Article

Perspective of Sustainable Rural Tourism in the United Kingdom of Great Britain and Northern Ireland (UK): Comparative Study of β and σ Convergence in the Economic Development Regions

by
Gina Ionela Butnaru
1,* and
Alina Petronela Haller
2
1
Department of Management, Marketing and Business Administration, Alexandru Ioan Cuza University of Iaşi, Bulevardul Carol I 11, 700506 Iasi, Romania
2
Department of Economics, Romanian Academy Branch of Iaşi + ICES, Gh. Zane, Codrescu 2, 700488 Iași, Romania
*
Author to whom correspondence should be addressed.
Sustainability 2017, 9(4), 525; https://doi.org/10.3390/su9040525
Submission received: 21 January 2017 / Revised: 18 March 2017 / Accepted: 24 March 2017 / Published: 30 March 2017
(This article belongs to the Special Issue Rural Tourism, Rural Development and Rural Resilience)

Abstract

:
Tourism is an activity which globally develops proportionally with the evolution of progress. The opportunities we enjoy are bigger than ever, but their price should be lowered in order for the global society to develop its wealth. This can be performed by sustainability, a concept which will join in the future all economic activities, not only tourism. Our analysis is focused on the specific case of the UK, one of the main tourist destinations in the world. It is well known that cultural tourism is the form attracting the highest number of foreign visitors. However, we can see the importance given to rural tourism. The main methods used to perform the present analysis are β and σ convergence. They proved their efficiency in other research studies, which led to a high degree of accuracy of the results. β and σ convergence analysis is performed on a sample of 12 Economic Development Regions from the UK, among which we will determine the degree of convergence and divergence of sustainable rural tourism.

1. Introduction

Rural tourism has a long history in the UK, especially in the western regions of the country; in Dorset, Devon, and Cornwall; and in the southwest of Highlands, Scotland [1], which were accompanied by the development of tourist activities that helped them maintain a market share rather stable in time. Development of rural tourism in the UK is based on the development of transport, initially of the railroads in 19th century. In the 1950s and 1960s, tourism development was registered in the coastal resorts, while the 1970s and 1980s recorded a high decrease as a result of the market development of tourist service packages for Mediterranean Sea. In this period, rural tourism registered a relatively stable market share. Inevitably, most of the people working in rural tourism can offer accommodation services or visits to tourist objectives. In addition, cooperative businesses with 20–30 members developed in this period, some of which had started to function since the end of the 1940s. In the analysis of tourism in the UK in the 1980s, we identified a series of factors with a major influence over rural tourism, including major changes of agricultural policies of the European Community for UK Government; control of urbanization by moving the population from the big cities towards small towns and rural areas; higher awareness for sustainable tourism and green tourism in an adequate context for rural tourism; higher perception of rural tourism among the Government representatives due to its economic potential and occupation of work force; and thorough study of educational needs with major implications in the preparation of specialists for this field of activity. According to the Government UK in 2015, 42.1% of enterprises, 25.7% of turnover and 44.4% of employment was in rural tourism industry, making it the largest division. In rural England, 10.6% of local business units are in tourism related industries. In addition, the visitors from rural areas spent £3 billion (of which £200 million were expenses in rural tourism), and there were 850 million tourists and 1900 million visitors. The main travel reasons were countryside visits for the landscape, friendly people, quietness and peace. In 1980, national organizations were established, recognizing and supporting the development of small businesses in rural environment, as follows: The British Tourist Authority, Farm Holiday Bureau (now it has agricultural cooperatives), Scottish Farmhouse Holidays (for tourist accommodation services in rural environment), Wolsey Lodges (for the cooperative members who sell accommodation services), and Classic Cottages (family business offering renting services for tourist cottages).
Regarding the development of rural tourism in the UK, we can see that there is an involvement and cooperation among the companies working in this field of activity. Consequently, the European Commission, UK Government, and non-governmental organizations are interested in the development of rural areas.
Up to 2020, UK intends to diversify the tourist offer in the rural area to create opportunities of development of local environment and communities [2]. Rural tourism does not involve only the development of a single activity, it is the accumulation of several activities [3], which sometimes are underestimated, but extremely important for UK economy. Consequently, rural tourism is among the most efficient sectors of the domestic market, and it brings a significant income to UK from the external markets [4]. In UK, it is based on educational progress, on the strong need to spend the leisure time in a different environment, on the development of communications and transport, and on traditional and authentic experiences [5].
UK rural environment offers the perspective of diversification of the tourist activity with extensive possibilities, without any relation to the niche [6], and rural tourism is promoted by authorized institutions [7], by specific programs, and supported by funds created on this purpose, e.g., in the case of Scotland: Tourism Innovation Fund, Visit Scotland Growth Found, and Scottish Rural Development Programme [8].

2. Some Theories that Formed the Basis of This Study

The contexts where sustainable rural tourism in UK was analyzed were different. Hall et al. (2005) [9] made the connection between rural tourism and (sustainable) business environment, demonstrating that tourist activity is creating workplaces, constituting a development factor for rural areas. A parallel between Canada and UK shows that rural tourism played, in time, an important role in UK, especially in Scottish Highlands [10], and Bakewell (UK). Not only the two rural regions are located in different geographical areas, but they are also in different phases of development (life cycle) [11]. Gastronomic tourism and its role in supporting the regional identity in Cornwall, Southwest of England, represented another subject directly correlated with rural tourism from the point of view of rural recovery, and agricultural diversification [12]. In a study conducted by Alexander and Mckenna in 1998 [13], the conclusions show that regarding rural tourism development, Central England is considered a peripheral area. The authors of this study tried to find solutions to improve this situation. Sustainable rural tourism may develop with an impulse from the authorities. Their involvement creates the conditions of a better integration of tourist activity in strategic spatial planning, and in local community development [14].
The study of local leadership was also interesting in the particular case of the region Adventa—Monmouthshire (UK) [15]. The economic policy is important for the development of sustainable rural tourism in UK, and the national, urban, and rural tourist policy suffered modifications under EU super-national influences, determining its uneven development [16]. At the same time, certification is also important for the development of sustainable rural tourism, subject approached in the research regarding UK [17]. The role of certification was analyzed in the case of West England regarding tourism impact on the environment, financial effects, marketing opportunities, brand recognition, and image improvement, moral responsibility, and political decisions.
The concerns for the environmental protection, also for the health of the people who travel on the territory of the UK led to the development of rural tourism and to a higher number of countryside holidays. The farms belong to the rural environment, and sustainable tourism is related to their diversification in England and Wales but the farm dimension and type influence the activity diversification [18]. At present, in the UK, rural tourism industry is still very fragmented and lacking coordination, because the visitors are looking for a sophisticated level of technology regarding the equipment and the accommodation services offered.
According to Dvoroková (2014) [19], for the economies of a state, β and σ economic convergence was and still is focusing the attention, and it represents one of the basic conditions to consolidate competitiveness externally, being also a prerequisite for a growing cohesion in Great Britain. Consequently, real convergence may be influenced by several factors, both positively and negatively. Therefore, this paper intends to analyze by a rigorous documentation β and σ convergence in UK Economic Development Regions, performing a rural tourism analysis.
In the elaboration of the first part of this paper, we performed the analysis of the economic impact of tourism in UK, with an emphasis on rural tourism, demonstrated by an analysis of the data obtained from reports provided by Eurostat, European Union, European Commission, VisitEngland, World Tourism Organisation, and World Travel & Tourism Council. In the second part, we performed a linear correlation for Gross Domestic Product from Tourism (GDPT) by UK Economic Development Regions, to establish the convergence or the divergence, if any, with the purpose to identify the main objectives of the effort of convergence. At the end of the paper we proposed a specific model of rural tourism for UK by presenting the challenges and opportunities of this field of activity. Research on sustainable rural tourism in UK has already been performed, however, the analyses of these studies with the help of β and σ convergence are relatively new.

3. Literature Review

3.1. Analysis of Tourism in the UK

The increasing progress, the improvement of the level of knowledge and, generally, life dynamics create possibilities and the wish to travel, to discover, to interact with places, people, and events. The possibility to cover enormous geographical distances in a relatively short time, comfortably and at reasonable prices, determines people to travel where they desire to satisfy their various needs, from relaxation to knowledge.
World Travel and Tourism Council (WTTC) [20,21,22] analyze in detail the economic impact of 184 countries, including the UK. In 2015, the growth rate of the tourism sector (2.8%) was higher than the global one (2.3%), with a contribution of 9.8% to the global GDP (Gross Domestic Product), or of 7.2 trillion dollars, in absolute terms [23]. In addition, tourism sector created 284 million workplaces, which means that, in the world, 1 of 11 workplaces is in the tourism sector. The world is threatened by economic, social, environmental, technological, geopolitical risks with a strong impact, which travel lovers assume not from ignorance, but from their desire to go where they had not gone before. One of the destinations preferred by tourists is the UK.
We present very shortly the direct and total impact on the GDP of UK tourism sector for 2015, the estimates for 2016, and the prognoses for 2026. British tourism sector registered significant growth rates for the fifth consecutive year.
Tourism sector had a direct impact of 3.7% of GDP, and the estimates and prognoses maintain the growing tendency. The direct impact of the tourism sector was estimated to grow by 3.8% in 2016, and by 4% in 2026.
By direct contribution, tourism sector created 1,791,000 workplaces on the territory of the UK, which means 5.3% of the total. For the following ten years, the prognoses lead towards a positive direct impact on the labor market of 6%.
UK takes the tenth place in WTTC hierarchy from the point of view of the impact over the labor market. Directly, tourism created 1,791,200 workplaces in 2015. By comparison, in USA the same sector contributed to the creation of 5,633,200 workplaces (3rd place), and in Germany (6th place) to the creation of 3,010,600 workplaces. The number of workplaces created by the tourism sector in the UK was 2.1 times higher than the global average, and 5.9 times higher than the European average.
From the point of view of the direct contribution to GDP, in 2015 the UK took the 5th place in WTTC hierarchy, with 103.7 billion dollars. By comparison, USA was on the first place (488 billion dollars), Germany was on the 3rd place (130.7 billion dollars), Japan on the 4th place (106.7 billion dollars). The direct contribution to GDP of UK tourism sector was 5.6 times higher than the global average, and 6.9 times higher than the European one.
Total contribution of the tourism sector to GDP was 11% in 2015. In 2016, it was estimated to grow by 4%, and in 2026 it was estimated to grow by 3%. Cumulatively, the direct and indirect total impact of the tourism sector on the labor market was 12.7% in 2015, the equivalent of 4,293,000 workplaces. The estimates foresee a growth by 2.2% of tourism total contribution on the labor market for 2016, and the estimates for the next decade show a growth by 1.3%.
Considering the total impact of the tourism sector on UK labor market, the country is in the 11th place in WTTC hierarchy, with 4,293,200 workplaces created in 2015. In USA, 14,247,900 workplaces were created by tourism, consequently it is in the 3rd place; in Germany, there were 5,234,600 workplaces, placing it on the 9th position; followed by Japan, where tourism determined the creation of 4,722,300 new workplaces. The total contribution of tourism on the labor market in the case of the UK was two times higher than the world average, and 5.6 times higher than the European one.
The total contribution of tourism sector to the GDP of the UK is 3 times higher than the direct one, which shows that the direct, indirect, and induced effects of tourist activity on UK economy are substantial: 32.9% direct effects, 20.3% induced effects, and 46.8% indirect effects.
From the point of view of the total contribution to GDP, the UK is placed on the 4th position in WTTC hierarchy, with 315.6 billion dollars, while USA takes the first place (1469.8 billion dollars), and Japan takes the 3rd place (326.1 billion dollars). The total contribution of the tourism sector to GDP was, in the case of the UK, 5.6 times higher than the global average, and 7.8 times higher than the European one.
In 2015, the tourism sector participated with 4.4% in the total investments of the UK. Tourism investments will continue, so their growth was estimated by 5.6% from the total investments in 2016, and the estimates show an increase of investments by 3% in 2026.
The analysis of the investments performed by tourism industry places the UK in the 8th place in WTTC hierarchy in 2015, with 21.5 billion dollars. USA is in the first place, in this country the tourism sector made investments of 148.8 billion dollars; France is in the 4th place, with investments of 33 billion dollars; followed by Japan with 32.8 billion dollars; and Germany with investments of 27.8 billion dollars. The investments made by the tourism sector in the UK are 5 times higher than the world average, and 5.3 times higher than the European one.
In WTTC hierarchy, from the point of view of the contribution of tourism to GDP, in absolute terms the UK takes the 4th place, and in relative terms it takes the 70th place. From the point of view of the estimates of growth in 2016, it is in the 58th place, and from the point of view of the estimates of growth on long term, i.e., 2016–2026, it is in the 152nd place.
The expenses which local and foreign tourists made on the territory of the UK for recreational activities (leisure travel spending) were 60.5% of the direct contribution of the tourism sector to GDP in 2015, while the expenses of the visitors who travelled for business were 39.5%. The estimates and prognoses illustrate a maintenance of the growing tendency of tourists’ expenses, regardless of the origin or of the purpose of tourist activities. Local tourists made 80.6% of the tourist expenses, while foreign visitors spent on the territory of the UK 19.4% of the total. Tourists’ expenses will increase. The estimates for 2016 show a growth by 3.2% of local tourists’ expenses, and by 2.6% of the expenses made by foreign tourists, and the prognoses for 2026 show a growth of local tourists’ expenses by 3.9%, and a growth by 4.6% of foreign tourists’ expenses.
Tourism statistical picture of the UK presents the country as one of the most important world destinations, with development perspectives in the following decade.

3.2. Tourist Activity and Its Specific Importance, with Focus on Rural Tourism

History and culture of the UK, well spread in the whole world by English language and colonialism, make it a very popular tourist destination, especially for its capital, London.
Based on the statistical data provided by Eurostat, we estimate that the number of tourists grew by 120% as compared to 1979, however their expenses for British services remained at an almost similar level. The average of expenses for each tourist arrived in England decreased from 1076 euro to 684 euro [23]. At the same time, the number of visitors who intended to spend their holidays with their families grew by 250% as compared to the same year of reference, 1979, their number being of approximately eight million. In 1979, the internal income from tourism was higher with almost three billion euro than the British’ expenses abroad. Today the report is reversed, the British spend twice as much in external locations than the tourists who come to England [24].
In 2015, the top seven most important visited cities in the UK were London, Edinburgh, Manchester, Birmingham, Glasgow, Liverpool and Oxford [25]. Regarding the visitors’ country of origin, the top three places of those who chose to visit London tourist destination between 2010 and 2015 are taken by France, USA and Germany.
Most of the time, in tourism, it may be very difficult to establish with precision the number of visitors for tourist attractions in general, because some companies in this field of activity or sites may have a different purpose in processing such information. Nevertheless, in the UK, over 5000 attractions are estimated for tourists who intend to visit these places [26].
Regarding the rural tourism, VisitEngland Report with the title Domestic Rural Tourism in 2014 for England [27] presents a series of statistical information for the UK. In 2014, the holidays in rural areas attracted approximately 9.21 million visitors, of which East Midlands Region attracted 1.12 million visitors, followed by East of England with 0.95 million visitors. In total, 3.57 million visitors preferred open air activities, including long walks; 2.77 million people visited important rural tourist objectives; and 2.14 million people preferred to visit historical and heritage rural sites.
Though the number of travels from the rural environment decreased in 2014 compared to the period 2009–2013, it still registers an increase compared to 2008 (year of reference), with an annual average growth rate almost equal to the national average.
Rural destinations of the UK are considered safe, welcoming, and comfortable—they are very attractive compared to other types of holidays. This makes the rural destinations preferred for relaxation, walking, and visiting parks and gardens, which are also a great joy for the visitors. The owners of rural businesses make big investments, rural attractions offering several facilities and services—especially shops and catering systems—in compliance with the type of tourist destination and with visitors’ consumption needs. Furthermore, rural attractions are more susceptible by comparison to other types of tourist attractions, and the personnel employed is trained and motivated to maintain the highest standards for the visitors.

3.3. An Economic Perspective over Sustainable Rural Tourism in the UK

Tourism industry, at a global level, contributes 10% to GDP [28]. Though mass tourism continues to dominate on an international level, alternative or sustainable tourism is also present among the types of tourism.
The concept of sustainable tourism comes from sustainable development. The latter became known in 1987, at the same time with the publication of the famous Brundtland Report (Our Common Future), which stated that the satisfaction of present needs is performed without affecting the capacity of future generations to satisfy their own needs, i.e., by sustainable development. In 1992, at Rio de Janeiro, at the famous Earth Summit, Agenda 21 refers to tourism as a potential remedy to social and environmental problems, favoring the appearance of the concept of sustainable tourism. In 2003, the European Commission adopted formal measures to support sustainable tourism.
Sustainable tourism is a form of tourism with low negative impact over the environment and local culture, generating income, workplaces, preserving the fauna, flora and ecosystem of the area, responsibly correcting the economic activity. The role of sustainable tourism is to reduce negative externalities associated to tourist activity.
The reasons for which the entire tourist activity should become sustainable are due to its main components [29]: responsibility towards the environment (ecological sustainability), local economy vitality (economic sustainability), cultural diversity (socio-cultural sustainability), and accumulation of experiences. Sustainable tourism is a relation among tourist destinations, tourist industry, inhabitants of local communities, and visitors [30]. In the past, this relation was dominated by tourist industry, but sustainability eliminates the tension among the three sides of the triangle, and maintains the balance in the long term.
Any tourist destination, and any form of tourism will last in time only if sustainability principles are applied. Ignoring them would reduce the degree of competitiveness of the tourist destination, due to major visual modifications, and others. A destination attracts tourists by itself, because it is notorious and indirectly promoted, if it already observes the principles of sustainability, or if there are efforts to attract tourists by actions which will change the image of the place, and not only by marketing strategies.
Overpopulation of the big cities and excessive pollution due to tourist activities lead to unfavorable consequences which will affect the economy and the society directly and indirectly in time. Without the application of the principles of sustainability, tourism risks to become an income generating activity, whose level will not compensate the associated costs.
Tourism in the UK needs to be circumscribed to the principles of sustainability. In the future, the potential of development of this activity in the UK is high [31], because communication and transport technologies and infrastructure develop continuously, opening the possibility of physical and financial access to various destinations, the life standard grows everywhere in the world, so people from developing countries can have the possibility to travel (most certainly, the emerging states will shortly become important markets emitting tourists), investments are increased, and promotion campaigns are intensified.
Risks correlated with tourist sustainability in the UK appear from the excess capacity of tourism industry, which confer to the visitor the power to decide what can to buy [32]. In the UK, cultural tourism enjoys a real success, proved by millions de visitors who choose this form of tourism every year, and who place the United Kingdom, by their interest for museums and culture, in the group of the most important destinations in the world. Overpopulation of some destinations, which are already overpopulated, is opposed to the principles of sustainability; consequently, it is necessary to manage the tourist activity adequately to balance the relationship among tourism-daily activities-improvement of living conditions (pollution control, traffic fluidization, and lowering of social risks such as threats to people’s safety, or acts of violence).
An overview of the level of development of the UK requires an analysis of Gross Domestic Product (GDP) presented on the Economic Development Regions, an important indicator for the category of structural transformations and macroeconomic balances (Table 1).
Gross Domestic Product directly from Tourism is the part of GDP directly attributed to internal tourism consumption as part of added value (at basic prices), generated by all the industries as an answer to the internal tourism consumption, to which it is added the sum of net taxes on production and imports included at acquisition costs. This part of GDP is called Gross Domestic Product directly from Tourism (GDPT is the part of GDP generated by all the industries as an answer to the internal tourist consumption, to which it is added the sum of net taxes on production and imports included at purchase prices.). For the 12 Economic Development Regions of the UK, GDPT generated an average contribution of 3.67% of GDP corresponding to the period between 2005 and 2014 [33].

4. The UK—Comparative Study of β and σ Convergence

4.1. Conceptual Approaches and Empirical Results of β and σ Convergence

Gap analysis is a preoccupation in economic and social research starting with Solow’s neoclassical theory, which inspired growth and development analyses, improved by new methods and methodologies. Several research studies have been performed by β and σ convergence. A great interest was granted to convergence in the states or regions of the United States of America (USA), and in the member countries or regions of the European Union (EU).
USA registered a convergence conditioned by income along the 20th century, possible in conditions of mobility and absence of commercial barriers [34]. β convergence was a necessary but not sufficient condition for σ convergence in the case of the American economy between 1970 and 1998. Most American states are homogenous, β convergence and σ convergence showing that the growth rates were balanced for richer states, and higher than those registered by poor states [32].
In the EU, there is a process of real, slow, and fluctuant convergence. The 1980s represented a period when the European process of convergence was lower. Convergence was slightly faster before the 1980s and after, at the same time, with the development of the interest for social cohesion, without denying the manifestation of divergences, slower in certain European member countries or regions, and visibly faster in others, EU being by definition characterized by economic, social, and geographical discrepancies [35].
The analysis of GDP/inhabitant in the EU regions at NUTS 2 level with the help of β and σ convergence is a highly complex process. Real beta-convergence manifested within the perimeter of EU 15 and EU 27, without following a constant tendency in time [36]. β and σ convergence leads to similar conclusions as in other analyses. The 1980s marked a period of decrease of European convergence compared to previous and subsequent time intervals, the degree of manifestation being different in countries and regions.
The analysis of integration of financial markets for seven EU member countries with the help of β and σ convergence illustrated that the financial market efficiency did not support a process of convergence, though after the introduction of unique currency, signs of the process visibly started to manifest [37].
The analysis of convergence hypotheses, conducted by Marquez and Soukiazis on a group of 12 European states for the time interval 1975–1995, divided in two subperiods, 1975–1984, and 1985–1995, respectively, and of the estimates of the convergence model for 175 regions at NUTS 2 level for the years 1987–1995, divided in three groups (regions with income/inhabitant under 75% of the EU average, with income/inhabitant lower than the EU average, and income/inhabitant higher than the EU average), draws interesting conclusions. Between 1975 and 1995, there was a moderate σ divergence, showing the growth of income/inhabitant dispersion. In absolute terms, the subperiods of 1975–1982 and 1986–1991 were marked by convergence, while 1983–1985 and 1991–1995 were marked by divergence. In contrast to σ convergence, β convergence reached different conclusions. The entire period analyzed was marked by a faster convergence in the interval 1985–1995, and by a slower convergence in the interval 1975–1984. The different results of β convergence and σ convergence show that β convergence rate is not sufficient to approximate the income/inhabitant. In absolute terms, the analysis of the regions at NUTS 2 level with the help of σ convergence illustrates an insignificant decrease of income/inhabitant dispersion like in the 1990s, with a clearly divergent tendency. β convergence showed, for the same period, that the poor regions registered higher growths than the rich ones. Considering the low convergence rate, the result may be similar to the one obtained by σ-convergence. Poor regions, with income/inhabitant under 75% of the EU average, show a strong σ and β convergence, the ones slightly under the average register lower rates, while the regions with income/inhabitant over the average do not support a convergence process. The results of this research suggest that in the long term, convergence is not assured, but the poor regions become more homogenous from the point of view of the standard of living as compared to the rest, being capable to progress without reaching the level of income/inhabitant specific to the rich regions [38].
Soukiazis (2017) ascertains that theoretical analyses support unconditional convergence of the European states, while the empirical models like β and σ convergence demonstrate the manifestation of a convergence conditioned by the manifestation of structural factors like human capital, accumulation of capital, investment process, institutional factors, certain conditions specific to the market, political factors, and macro-stability. Both theoretical and empirical models have weaknesses, but together they complete one another, emphasizing convergences and divergences as close to reality as possible [39].
Simionescu [40] analyzed the degree of convergence in the case of EU28 between 2000 and 2012, concluding that the divergence process decreased; however, there was no manifestation of an acceptable degree of convergence.
An analysis of GDP/inhabitant by the methods of β and σ convergence for all the 28 European states between 2001 and 2012, period including the economic crisis, concludes by σ convergence that poor states register higher growth rates than rich ones, conclusion validated by the method of β convergence. The latter distributes the results for the periods before and after the crisis. In the period before the crisis, β convergence shows heterogeneity for the European states, later the differences start to diminish, without manifesting the clear tendency of gap reduction in the economic performance of EU member states [41].
Dzenita (2015) studied the convergence of GDP/inhabitant in EU28, with the help of β and σ convergence methods for the years 1995–2013, subdivided in the intervals: pre-extension (1995–2003), post-extension (2004–2013), pre-crisis (2004–2008), and post-crisis (2009–2013). The results are similar to other research studies on EU countries: the growth potential of poor states is higher than the one of developed states; the results of σ convergence are in agreement with those of β convergence. The crisis slowed down the convergence process, with substantial differences from one country to the other. The highest convergence rate was registered in the post-extension period, 2004–2008, reflecting the efficiency of enlarging the Union, and the convergence was slower in the pre-adhesion period, and faster after that, even during the crisis [42].
The fact that the convergence process continued during the crisis in the EU in a lower rhythm was validated by the results of other research studies analyzing GDP/inhabitant with the help of β and σ convergence, with the amendment that, unlike the whole EU territory, within the perimeter of EU14, especially in the euro area, the crisis blocked the convergence process, manifesting elements of divergence [43].
The agreements South–South, such as ASEAN, MERCOSUR, Central and West Africa, and the process of their integration were analyzed using the methods of σ and β convergence starting from the income dynamics, leading to the conclusion that the disparities among incomes are not reduced, though there were elements of σ convergence in relation with β convergence [44].
The analyses of β and σ convergence generally reach congruent and complementary conclusions. The methods polarize countries and regions into poor and rich, they accept a relatively high degree of homogeneity among USA states and regions, and a real, slow, and fluctuant convergence in the European ones.
The results obtained determine us to credit these empirical methods, and to extend their areal of use towards other fields of research.

4.2. Materials and Methods

The methods applied involve the use of descriptive, empirical, qualitative, and quantitative instruments. The argumentation, inductive and deductive, is the result of the analysis of scientific papers, reports and statistical data illustrating and explaining the subject under research.
The quantitative method used, β and σ convergence, is an additional instrument which helped us draw the best conclusions, infirming or confirming the theoretical conclusions we reached by analysis, synthesis, argumentation, and inductive and deductive discovery.
Most frequently, the empirical studies of convergence use GDP in real terms, in conversion per capita (of inhabitant or worker). The economies of the regions with a lower GDP per capita grow faster compared to the economies of the developed regions with a higher GDP per capita. Considering this principle, a condition of homogeneity for the economies of the regions analyzed is recommended, otherwise the measurement of convergence is not possible. The sources of theoretical documentation are observational studies (e.g., case studies, description-argumentative studies), correlational (reports, statistics, comparative studies), which, together with the qualitative research, offer internal, external, and general validity to the research. In agreement with Dvoroková [19], in general poorer regions register a more dynamic growth. β convergence is characterized by a negative slope of the linear function when GDP per capita grows (GDP is an indicator depending negatively on the initial economic level). For σ convergence, we analyzed the studies conducted by Marques and Soukiazis [45], Baumol [46], Young et al. [47], and Dvoroková [19]. The conclusions of the studies show that all the regions converge towards the same level of development, with the purpose to obtain the same result (for example the growth of economic production). Therefore, σ convergence can be defined as a lowering of the variation of real GDP indicator per capita among the economies of the regions analyzed in a certain time interval.
In the present research, in agreement with Dvoroková [19], the methodology for β convergence was at the basis of the studies performed by William Baumol in 1986, when he studied real convergence among economies. In sustainable rural tourism, we can measure β convergence based on GDPT/inhabitant, using the equation proposed by Baumol as calculation method for β convergence:
1 T   [ ln ( y i , T )   ln ( y i .   t 0 ) ] =   α +   β ln ( y i , t 0 ) + ε t
where,
  • T is the time interval;
  • y T is the real GDPT per worker at the end of the period of time;
  • t 0 is the initial period of time;
  • y t 0 is the real GDPT per worker at the beginning of the period of time;
  • β is the slope parameter; and ε is the statistical error.
The equation proposed by Baumol in 1986 suffered some modifications, and Dvoroková [19] used the following model:
1 T   ln ( y i , T y i , 0 ) =   α +   β ln ( y i , 0 ) +   ε i
where α is a constant level.
σ convergence highlights the dispersion of the phenomenon compared to the average, or the gradual lowering of the differences among two or more chronological series.
In agreement with Iancu [48], σ convergence uses as indicator the coefficient of variation of GDPT level per inhabitant, calculated according to the formula:
σ t = i [ ln ( y i , t ) ln ( y ¯ t ) ] 2 ( N 1 )
where N represents the number of regions. Sala-i-Martin uses for the first time the term σ convergence in association with β convergence.
This model is used for the analysis of convergence level by the measurement of the dispersion of GDPT per inhabitant on a period of one year, using the transversal series (in this research, the Economic Development Regions of the UK are considered transversal series). The convergence indicator is relevant when analysis includes comparisons between certain Economic Development Regions. For this purpose, we use chronological series (a discrete time interval, t and t + T) to characterize convergence evolution (tendency). If the dispersion of the phenomenon registers a decrease in a certain time interval (i.e., the value of the indicator decreases in time), it means that the convergence phenomenon takes place, σt + T < σt, and when the dispersion is growing, it means that the divergence phenomenon takes place, σt + T > σt.

4.2.1. The Sample Analyzed

In this analysis, we used the statistical data offered by Eurostat for the values of GDP per capita in the Economic Development Regions of the UK. GDPT was calculated using the average percentage of tourism contribution to total GDP, which was obtained from the reports of the World Tourism Organisation, World Travel & Tourism Council, Eurostat, and Tourism Satellite Account (TSA) of the UK. The value of GDPT as average for the period 2005–2014 represents 3.67% of total GDP (Appendix A, Appendix B and Appendix C) (Table 2).
For this analysis, we chose the period between 2005 and 2014, because Eurostat database offered us information regarding GDP only for this time interval. Therefore, at the end of the period analyzed, we followed the reduction of the existing gap between the most developed region and the less developed region of the UK. The data were organized and processed numerically with Excel programs. For the specific research, we analyzed 12 Economic Development Regions of the UK. For the evaluation of β convergence we used the equation proposed by Baumol [46], modified in the paper proposed by Dvoroková [19]. For each region, we calculated ln ( G D P T 2005 ) , which is ( ln ( y i , 0 ) ) and ln ( G D P T 2014 G D P T 2005 ) , which is ( ln ( y i , T y i , 0 ) ) . The time interval T is 10 years for the period analyzed, 2005–2014. For σ convergence, we used the coefficient of variation of GDPT level per inhabitant, noted with σ. According to this model, it was necessary to calculate ln ( y ¯ t ) , and N took the value of 12, corresponding to the number of regions.

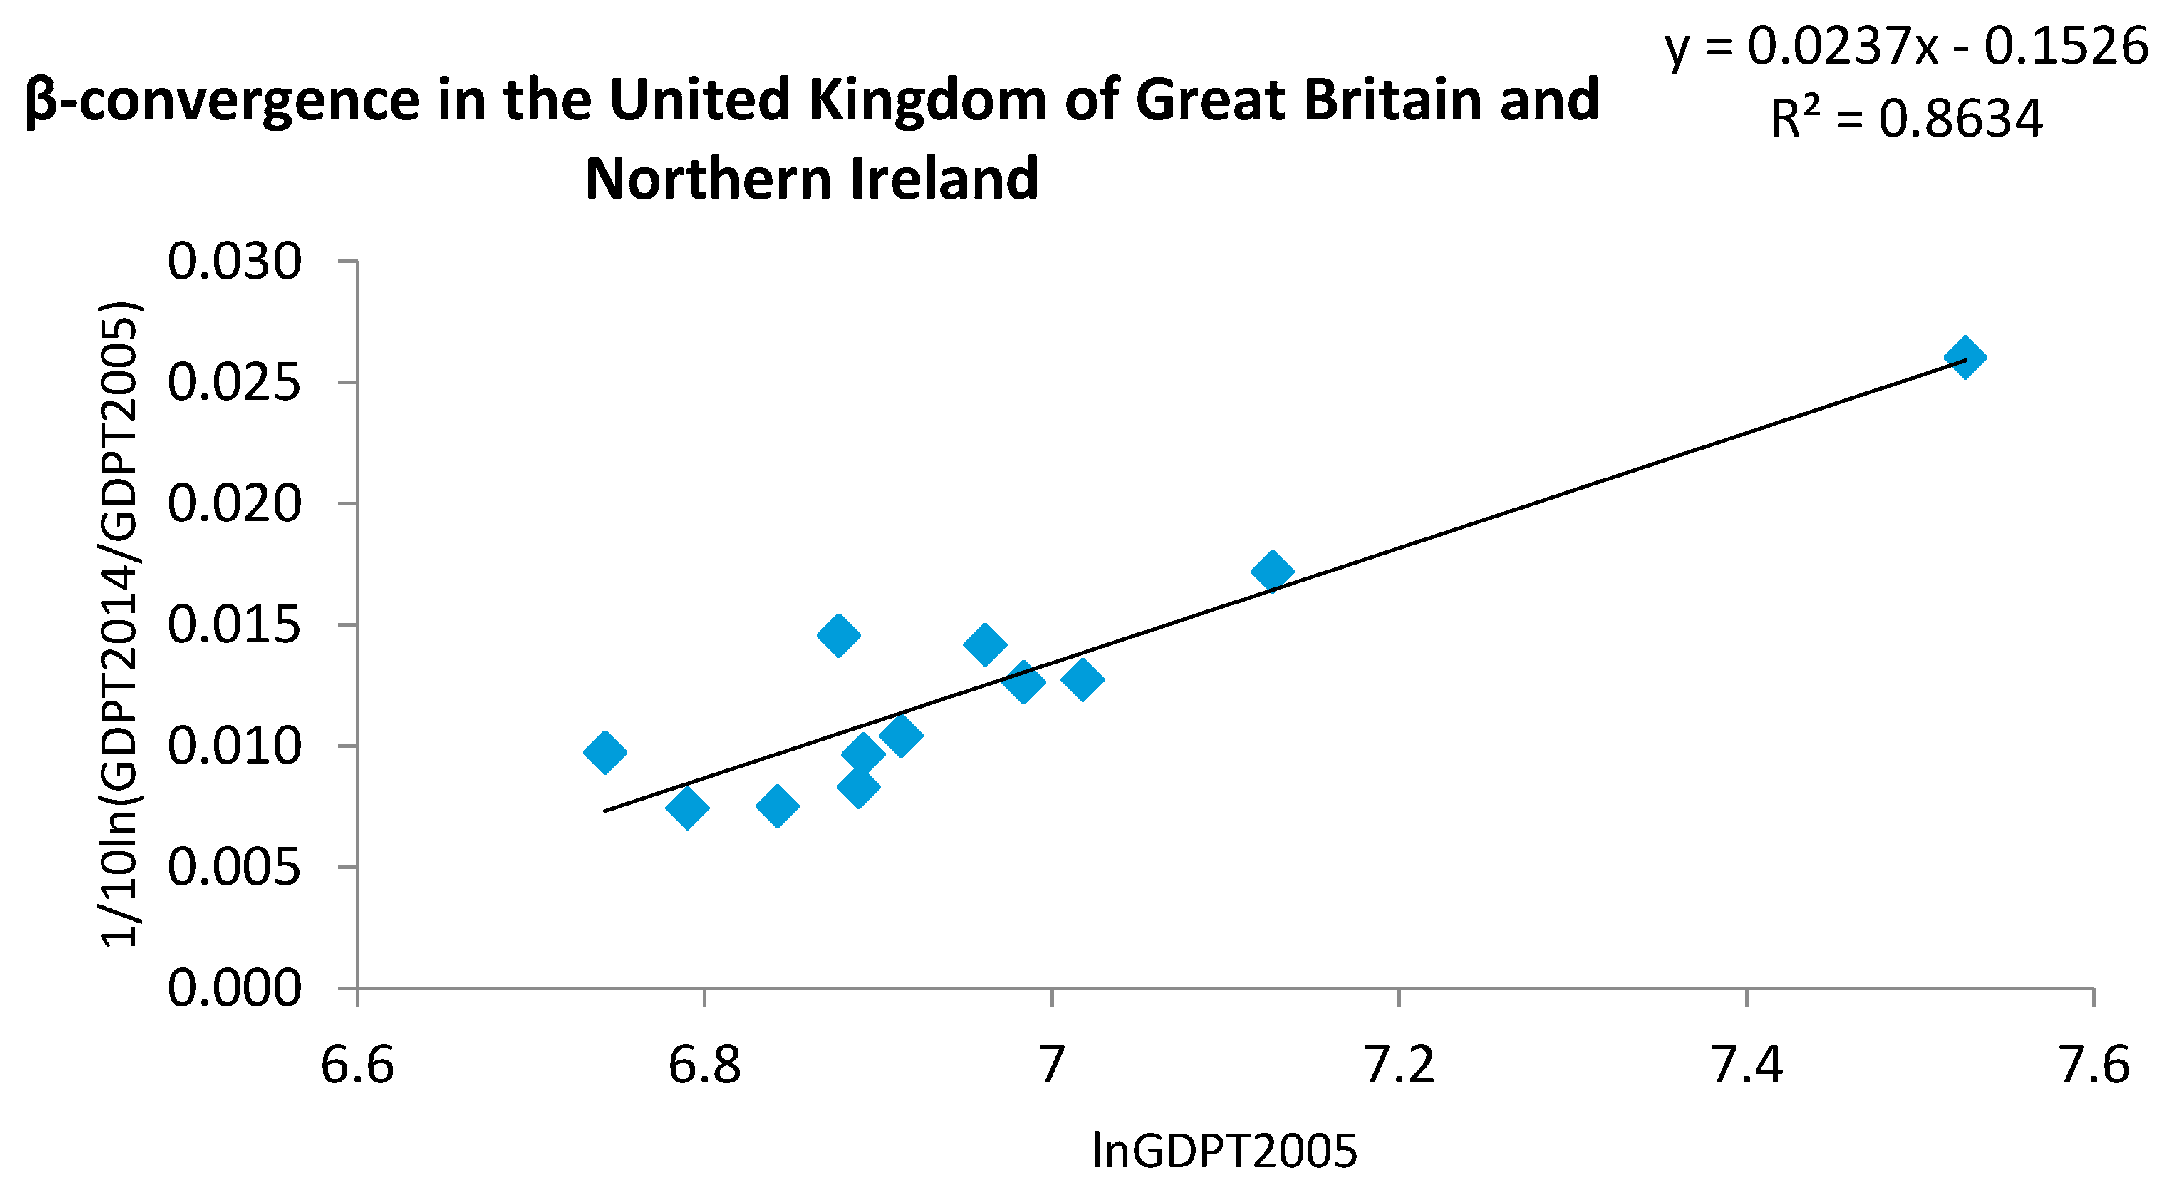
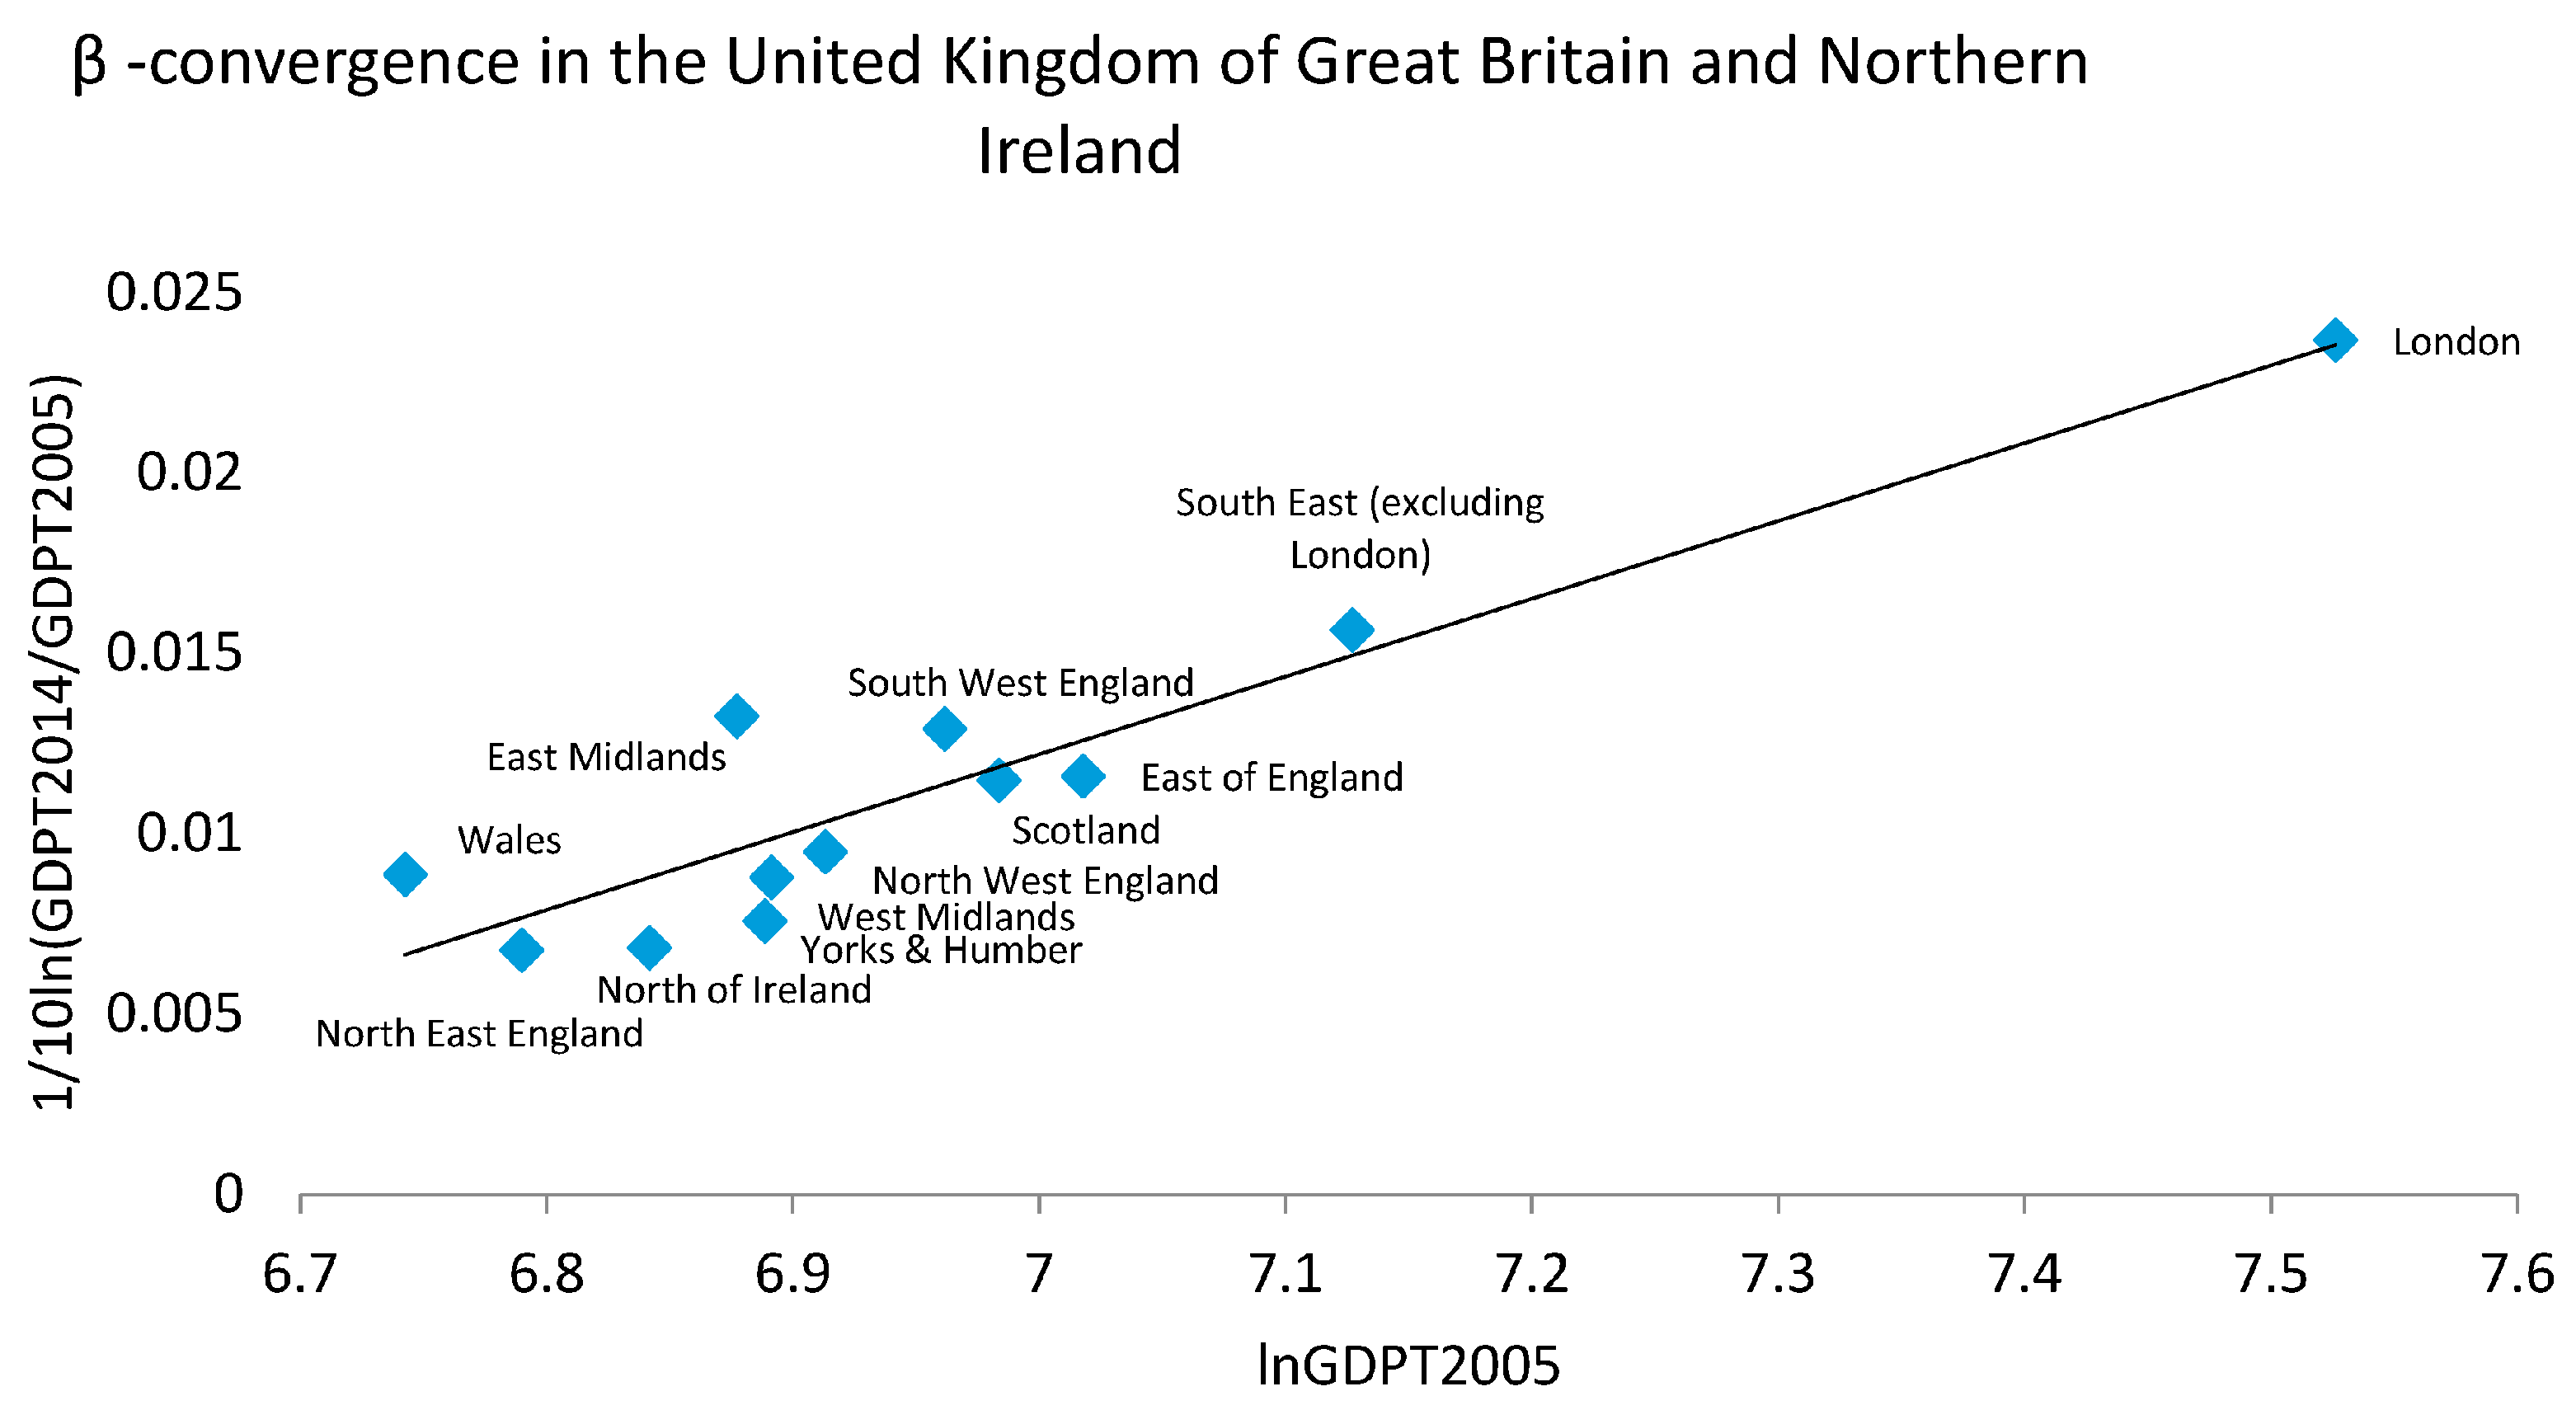
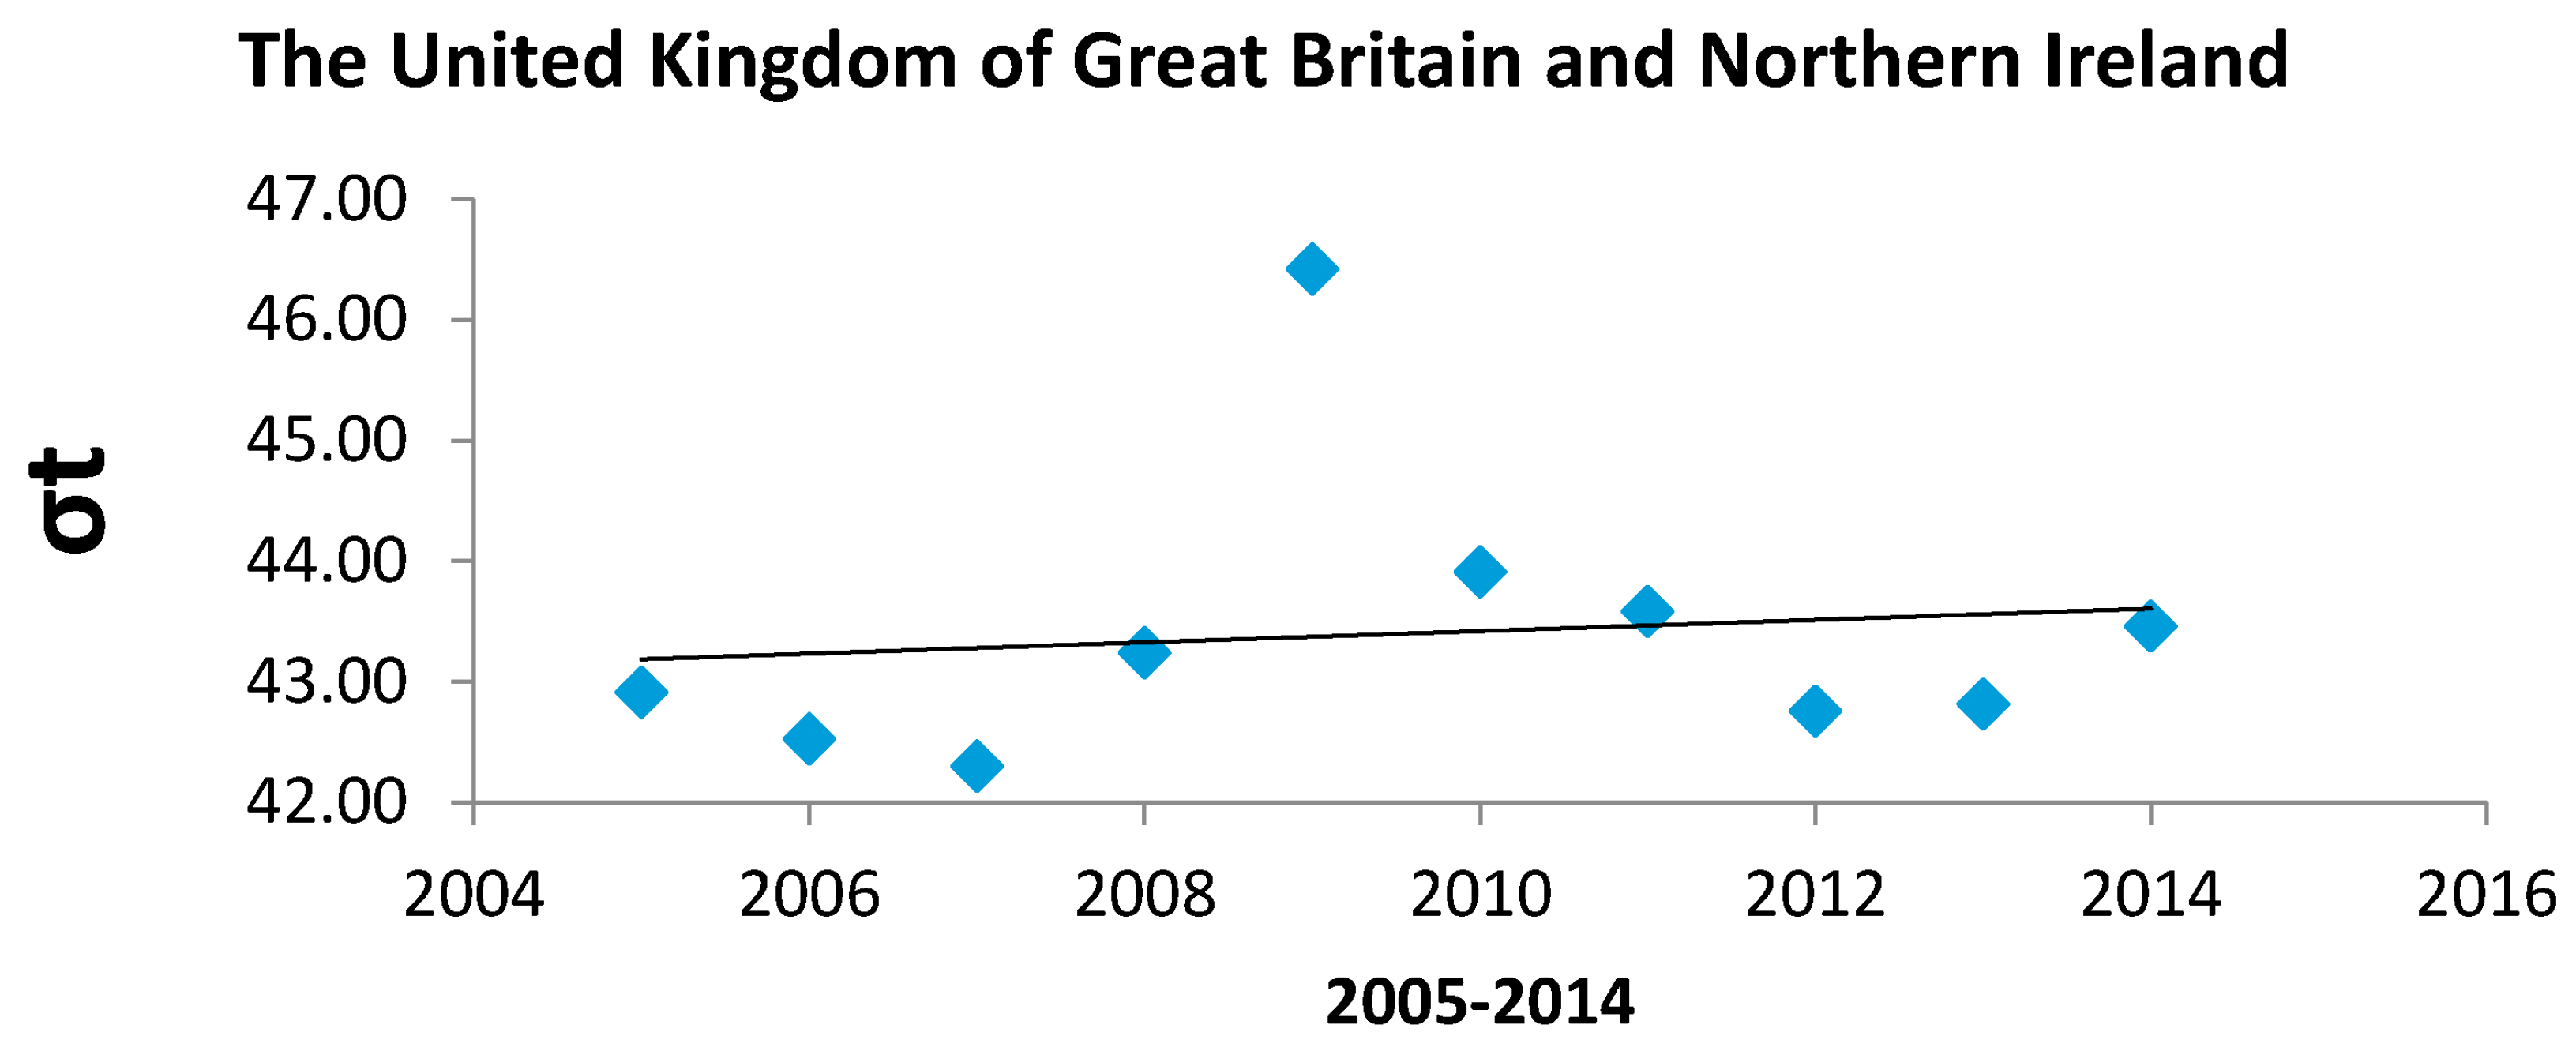
4.2.2. β Convergence and σ Convergence—Estimation of Econometric Model and Interpretation of Results

Mathematically, the indicator for β convergence can be written using the following model:
1 T   ln ( G D P T 2014 G D P T 2005 ) =   α +   β ln ( G D P T 2005 ) +   ε i
where α is a constant, β is the slope, ε is the error, and T is the number of years for the interval between 2005 and 2014.
The results of the calculations are synthetically presented in Table 3 for GDPT values corresponding to the period between 2005 and 2014, for the 12 Economic Development Regions of the UK.
As we can see in Figure 1, the linear equation with the form y = a + bx is y= −0.152 + 0.023x and R2 = 0.863. In Table 4, we present the estimative values for constant α and slope β.
The mathematical model can be written as follows:
1 10   ln ( G D P T 2014 G D P T 2005 ) =   0.152 +   0.023 ln ( G D P T 2005 )
Due to the positive value of slope β (+0.023), we can see that between 2005 and 2014, in the 12 Economic Development Regions, from a tourism point of view, β convergence becomes β divergence. Specifically, the model of β convergence can be used only retroactively (i.e., in the past) to analyze the development of the level of economies from tourism, without including explicative future values for GDPT (Figure 2).
The positions of certain regions on the graph shows that East Midlands, South East (excluding London), South West England, and Wales register an upward convergence, since the values of the points corresponding to the model 1 10   ln ( G D P T 2014 G D P T 2005 ) are over the curve corresponding to the linear correlation. The points under the curve correspond to the regions North East England, Yorkshire and Humber, East of England, West Midlands, North West England, Scotland and North of Ireland, which register a downward convergence. As expected, London registers divergence, determined by a much higher economic development than the other regions. Since, for the period between 2005 and 2014, the results obtained generally indicate a β divergence, for future periods, a growth of GDPT could determine the modification of β convergence model. Therefore, in Table 5, we analyze GDPT values for the 12 Economic Development Regions of the UK.
In the following, we will present the σ convergence model by using the coefficient of variation σt, which will indicate the convergence level by measuring GDPT dispersion (the Gross Domestic Product directly from Tourism is the part of GDP attributed directly to the intern tourist).
The mathematical model can be written as follows:
σ t = i [ ln ( G D P T 2014 ) ln ( y ¯ t ) ] 2 ( 12 1 )
Table 6 presents the estimative values for y ¯ t , ln ( y ¯ t ) , [ ln ( G D P T 2014 ) ln ( y ¯ t ) ] 2 and σt.
The high value obtained for sigma convergence shows that for the period between 2005 and 2014, in the Economic Development Regions of the UK there was a high degree of spreading of GDPT dispersion. In these conditions, it is necessary to perform a much more detailed analysis, with the purpose to measure the convergence process or the divergence process, according to the values obtained for σt, calculated this time for the following pairs of time intervals: 2005–2006; 2006–2007; 2007–2008; 2008–2009; 2009–2010; 2010–2011; 2011–2012; 2012–2013; 2013–2014; and 2005–2014.
In Table 7, we present the estimated values for σt, for the 10 time intervals.
As we can see in Table 7 and Figure 3, the values obtained for σt between 2005 and 2007 register a slight decrease, followed by an increase in the interval between 2008 and 2009. The interval 2010–2014 is also marked by a slight decrease, which leads us to the conclusion that the interval 2005–2014 could be divided in two important periods from an economic point of view. It refers to the pre-crisis and post-crisis periods. Therefore, 2009 is the year when the highest value for σt was registered. Thus, we consider that it was a convergence process for the Economic Development Regions of the UK between 2005 and 2014, contradicting the value β = (+0.023), which indicates that in the same period of time it was a divergence process. Consequently, we will analyze σt on time intervals. In this context, we can see that between 2005 and 2007 there was a convergence process due to the fact that σ2005 < σ2006 < σ2007, between 2008 and 2009 there was a divergence process due to the fact that σ2009 > σ2008, between 20010 and 2012 there was a convergence process due to the fact that σ2010 < σ2011 < σ2012, between 2013 and 2014 there was a divergence process due to the fact that σ2014 > σ2013. In conclusion, we can state that GDPT per inhabitant in the Economic Development Regions of the UK influences in a slight measure the economic development of the country, and the convergence process could take place very slowly.

5. Discussion

5.1. The Specific Model of Rural Tourism for the UK

In the UK, the offer for rural tourism is distinctive and diverse, including a wide range of products and services: walking, adventure sports, horse riding, fishing, boat riding, cultural festivals, bird watching, preservation activities, business meetings and team building. Rural areas, where these activities take place, are also diverse, and they include farms, waterways, rural seashore, rural towns, villages, pubs, historical cottages, and archaeological sites, gardens, lakes, forests, mountains and landscapes, national parks and areas with remarkable natural beauties. Tourism in the rural areas of the UK creates workplaces and business opportunities when other opportunities can be limited, also maintains and protects the existing workplaces in micro-companies and companies developing independent activities in rural environment. In Yorkshire, for example, the activities from rural areas represent 39% of the total workplaces of the economy in the region, and 37% of the total economy of the UK. Rural tourism offers the possibility to supplement the flows of income of the companies operating in rural areas, and a good example could be the activity developed at the farms. This can help maintain the environment and landscape qualities, which are evaluated by both visitors and rural communities and companies. Rural tourism supports economic viability of communities from the UK. Services and local facilities, such as shops, pubs, restaurants, transport, and postal services are supported completely by the visitors of rural areas [49,50]. Rural tourism of the UK has the capacity to contribute to the preservation and capitalization of the natural environment by developing new businesses, and by increasing the number of visitors who benefit and who are based on this type of activities developed in the rural environment. This is not always a direct contribution, but it is admitted by those who invest in this field of activity (Strategic Plan 2010–2020).

5.2. Challenges and Opportunities of Rural Tourism in the UK

The diversity of the offer of rural tourism for the UK differs from one area to the other. In different rural areas, tourism can lead, dominate, or support the economy of the UK. Nevertheless, businesses must be managed carefully to avoid the negative effects over the environment, economy and local communities. Holidays in rural environment are more susceptible for business purposes. To assure rural tourism development, destinations must develop tourist products and experiences appealing to the visitors all year long, less prone to possible climatic changes. Rural tourism offers an escape for urban population, and a series of specific activities for spending leisure time. Holidays in rural environment offer rest and quietness, and combine the beauty of the natural landscape with local architecture, food specific to the area, culture and community. This aspect represents a challenge for the developers who wish to propose businesses in the rural environment. Consumers in general are increasingly demanding, and they emphasize the development of technology to have access to rural environment information, since rural tourist products can be advertised with the help of new advertisement techniques. In the UK, the iPhone application called National Trust from the series walks and travels, and Geocaching, which was tested by several sites, are successfully used. However, the lack of connection in several rural areas may be a barrier for the users. UK Government proposed the increase of investments in rural areas for this type of projects. Since the number of companies in the field is relatively small, there is the risk that the information regarding rural tourism does not reach potential consumers at the right time, by the right means, with optimal results and satisfaction [26,51]. Rural tourism in the UK succeeded to differentiate from rural tourism of other European countries by the food specific to rural areas, products and landscapes. Therefore, it was modeled by generations, offering the opportunity to create authentic attractive experiences for visitors, making local communities proud of their history and culture. Consequently, it is very important for local communities to understand their implication in the development of rural tourism of United Kingdom, including also the benefits they can get from it.

5.3. Discussion about Future Research Directions

The research is inspirational for the theoreticians and practitioners in the field of tourism, especially rural tourism. From a normative point of view, the paper offers statistical information, and explains the frame and the presentation of tourist activity in UK rural area, offering coagulated information to those interested in this subject. In addition, β and σ convergence may be used to analyze comparatively, per regions or countries, several other aspects specific to the economic activity in general, and to the tourist activity in particular, because the convergent development is preferable to the divergent development. Consequently, there is an interest to find the regions with predisposition to develop convergently, and activities where convergence is possible. The method helps us delimitate theoretically the compatibility among regions, countries, and activities. Starting from rural tourism, the research may be extended to other activities, countries or regions than those we referred to in the present article.
From a practical point of view, the research offers information to the active economic agents in the tourist sector. By mentioning the opportunities, the convergence and divergence, the economic agents can see the favorable and unfavorable directions according to their preoccupations. The results obtained by β and σ convergence can help the economic agents in their investments, in the correct choice of the area for their activities, while the theoretical aspects of the research inform about the possibilities, places and development of their activities in UK rural area.

6. Conclusions

This paper approaches an essential subject for the economic development: sustainable rural tourism. The country analyzed is UK, the comparison being made among its Development Regions. We did not focus on tourism in general, but on a specific form of this activity, i.e., rural tourism, because it is best suited to the concept of sustainability.
We started from the idea that the interest for rural environment increased significantly, due to the decisions of Governmental authorities of the UK, and to the changes performed by agricultural policies of the European Commission in the 1980s. Statistical data confirm these affirmations regarding tourist development, which is extremely important due to increased travel opportunities in the world. Approximately 10% of the global GDP is due to tourist activity, and 1 of 11 workplaces is created by tourism.
The paper is structured in two parts, a theoretical one, and an empirical one. We described the importance of rural tourism for UK economy, and the previous contributions to the scientific research in the field, without pretending to include and synthesize the entire literature. We also considered important to present UK tourist activity from a statistical point of view to illustrate the importance, the dimensions, and the future perspectives of development.
UK is one of the main tourist destinations in the world with high potential of development, including the rural environment. The estimates and prognoses converge towards an increase of tourist activity. The tourist activity should observe the principles of sustainability, first in the rural environment associated especially to ecotourism and agritourism. In general, regardless of the form of tourism and area, sustainability requires the use of friendly concepts of environment and transport. Regarding the transport, the negative impact of product pollution should be reduced, and these characteristics are observed in British economy. Sustainable rural tourism takes into account the direct impact over the cultural inheritance and traditional activities. This is based especially on the traditional activities of each community, area identity, culture, and local preoccupations. It is developed in such a manner that the local communities get the benefits, it stimulates local economy, it creates workplaces, it gives a character of ecological sustainability, it uses local resources, including local food products and traditional production techniques, it observes traditional culture and lifestyle of the area. Any decision made for the development of sustainable tourism contributes to the improvement of life quality, and positively influences cultural identity. The great advantage of rural tourism is that it can relatively develop without depending on firms or big companies from outside the local communities, or on their decisions. Compared to other activities, tourism development in rural environment is not very expensive, which is an encouragement for the rural environment. However, it is well known that tourism and its associated activities are not isolated from the rest of local community activities. There is interdependence between tourism and different sectors and actors involved, since businessmen from the rural environment do not have resources to promote themselves. These are aspects leading to further costs and to the creation of networks and agreements of cooperation offering support and contributing to the better understanding of the businesses and marketing in rural environment.
The existing articles on sustainable rural tourism in UK illustrate an interest already manifested for this economic activity, which encouraged us to approach it from other perspective, and using other methods of analysis.
The theoretical analysis is completed by an empirical one, which explains more accurately the convergences and divergences among UK Development Regions, seen from the perspective of a niche, like rural tourism performed in the conditions of responsibility towards the environment. The empirical analysis involved the use of β and σ convergence. We considered that the most relevant indicators for our study were GDP and GDPT, taken from Eurostat statistics, specific to the Development Regions of Great Britain. We applied β and σ convergence method, but first we also analyzed other subjects researched with the help of this method. Initially, we ascertained the manifestation of a high degree of dispersion of GDPT, and we considered it was necessary to measure convergence and divergence in detail.
For the 12 regions of the UK, GDPT contributed by 3.67% to GDP between 2005 and 2014. Consequently, GDPT per capita influences very little UK economic development, and the convergence among the Development Regions is very slow.
The importance of this activity oriented us to the use of β and σ convergence to analyze convergences and divergences among tourist regions of the UK, concluding that convergent and divergent aspects are manifested on a fluctuant tendency. β and σ convergence method, applied with the help of an indicator specific to rural tourist activity, is relatively new. The knowledge of convergence and divergence in UK rural regions is important for making decisions regarding tourist politics, and for applying development strategies. Convergence proves the capacity to find similarities among regions, while divergence proves the manifestation of gaps, which require a different approach of the measures of tourist development.

7. Some Future Directions about Research of β and σ Convergence

In addition, we found that β and σ convergence method allows the comparative analysis of sustainable rural tourism by UK Development Regions, with the possibility to extend the analysis, e.g., by a comparison among countries. The conclusions may influence the decision makers in the future measures of tourist politics; the tour-operators in conceiving tourist packages according to convergence and divergence among regions; and the potential tourists in choosing their destinations. β and σ convergence is a method which can be used in the comparative analysis of any other economic activities, processes, or phenomena among regions or countries, without being restrictive.
The results validate the fact that rural tourism is an activity with potential of development in UK, even if it develops disproportionately among the Development Regions of the country. This paper opens the perspective of future research, e.g., convergence and divergence among regions in relation to rural tourism and other upstream and downstream activities.

Acknowledgments

The authors would like to thank the anonymous reviewers for their valuable comments and suggestions to improve the quality of the paper.

Author Contributions

The authors’ contributions were equal. Gina Ionela Butnaru designed the research; its reasoning; collected, analyzed the data and discussed the data; and performed the paper editing. Alina Petronela Haller did the literature review, the discussed data, drew conclusions and performed the paper editing. Both authors have read and approved the final manuscript.

Conflicts of Interest

The authors declare no conflict of interest.

Appendix A

Table A1. Gross Domestic Product (GDP) at current market prices by NUTS 2 regions, Million euro.
2005200620072008200920102011201220132014
England1,640,8401,733,3781,826,0371,606,1621,408,9001,536,7001,579,6611,747,4051,740,2611,926,600
North East England61,90765,62267,45758,93451,21855,21656,61961,95561,00966,700
Yorkshire and Humber136,977144,533153,246132,589117,310124,725126,943138,452136,149148,869
East Midlands115,037122,069128,226112,10896,794107,172110,076120,508120,862133,084
East of England170,856182,147188,537167,579144,870157,258159,850175,773174,073194,081
London392,558411,676443,630393,767349,441381,038405,724450,177450,341509,402
South East (excluding London)282,179297,273312,336276,398241,835266,765273,083306,253305,120335,161
South West England146,894154,210163,552143,872127,257139,887140,253154,239153,713169,288
West Midlands145,661153,450158,350137,367117,861129,619133,456147,867147,111160,458
North West England188,771202,398210,703183,548162,314175,020173,657192,181191,883209,557
Scotland152,233162,636170,266149,796133,789139,661142,588155,625156,013172,744
Wales68,91672,90576,03564,66358,03861,54564,22970,74070,07975,976
North of Ireland44,59348,03151,55943,86937,86940,49241,11445,17544,29048,078
Total per country1,906,5822,016,9502,123,8971,864,4901,638,5961,778,3981,827,5922,018,9452,010,6432,223,398
Source: [33].

Appendix B

Table A2. Gross domestic product in tourism (GDPT) at current market prices by NUTS 2 regions, Million euro.
2005200620072008200920102011201220132014
England60,21963,61567,01658,94651,70756,39757,97464,13063,86870,706
North East England2272240824762163188020262078227422392448
Yorkshire and Humber5027530456244866430545774659508149975463
East Midlands4222448047064114355239334040442344364884
East of England6270668569196150531757715866645163887123
London14,40715,10916,28114,45112,82413,98414,89016,52116,52818,695
South East (excluding London)10,35610,91011,46310,1448,8759,79010,02211,23911,19812,300
South West England5391566060025280467051345147566156416213
West Midlands5346563258115041432547574898542753995889
North West England6928742877336736595764236373705370427691
Scotland5587596962495498491051265233571157266340
Wales2529267627902373213022592357259625722788
North of Ireland1637176318921610139014861509165816251764
Total per country69,97274,02277,94768,42760,13665,26767,07374,09573,79181,599
Source: calculated by the authors.

Appendix C

Table A3. Population.
200120112015Population Average (2001 + 2011)/2
England49,138,83153,012,45654,786,32751,075,644
North East England2,515,4422,596,8862,624,6212,556,164
Yorkshire and Humber4,964,8335,283,7335,390,5765,124,283
East Midlands4,172,1744,533,2224,677,0384,352,698
East of England5,388,1405,846,9656,076,4515,617,553
London7,322,4008,204,4078,538,6897,763,404
South East (excluding London)8,000,6458,634,7508,947,9138,317,698
South West England4,928,4345,288,9355,471,1805,108,685
West Midlands5,267,3085,601,8475,751,0005,434,578
North West England6,729,7647,052,1777,173,8356,890,971
Scotland5,062,0115,295,4035,373,0005,178,707
Wales2,903,0853,063,4563,099,0862,983,271
North of Ireland1,685,2671,810,8631,851,6211,748,065
Total per country58,789,19463,182,17865,110,03460,985,686
Source: [21,22,52,53,54,55,56,57,58,59,60,61,62,63,64].

References

  1. Edwards, J. Rural Tourism in Great Britain, I Encontro Nacional do Turismo de Habitação—Ponte de Lima (12 e 13 de Março de 1993). Available online: http://www.center.pt/fotosctr/doc_encontro_27_136.pdf (accessed on 8 September 2016).
  2. Department for Environment, Food & Rural Affairs. Rural Tourism Package: Monitoring and Evaluation Framework, UK. 2014. Available online: https://www.gov.uk/government/uploads/system/uploads/attachment_data/file/388924/pb14249-defra-mid-year-report-2014.pdf (accessed on 27 February 2017).
  3. Lane, B.; Kastenholz, E.; Lima, J.; Majewsjki, J. Industrial Heritage and Agri/Rural Tourism in Europe, Directorate General for Internal Policies—Policy Department: Structural and Cohesion Policies: Transport and Tourism, Brussels, European Union. 2013. Available online: http://www.europarl.europa.eu/RegData/etudes/etudes/join/2013/495840/IPOL-TRAN_ET(2013)495840_EN.pdf (accessed on 28 February 2017).
  4. Penrose, J. Government Tourism Policy, Minister for Tourism and Heritage, Department for Culture, Media and Sport, UK. 2011. Available online: https://www.gov.uk/government/uploads/system/uploads/attachment_data/file/78416/Government2_Tourism_Policy_2011.pdf (accessed on 3 March 2017).
  5. OECD. Tourism Strategies and Rural Development, Paris. 1994. Available online: https://www.oecd.org/cfe/tourism/2755218.pdf (accessed on 27 February 2017).
  6. Brown, A.; Djohari, N.; Stolk, P. Fishing for Answers: Final Report of the Social Community Benefits of Angling Project. 2012. Available online: http://resources.anglingresearch.org.uk/sites/resources.anglingresearch.org.uk/files/Final%20report.pdf (accessed on 27 February 2017).
  7. House of Commons Culture, Media and Sport Committee. Tourism, Sixth Report of Session 2014–15: Report, Together with Formal Minutes Relating to the Report; Authority of the House of Commons: London UK, 2015. [Google Scholar]
  8. Scottish Natural Heritage, Agri-Tourism in Southern Scotland, Commissioned Report No. 463, UK. 2011. Available online: http://www.snh.org.uk/pdfs/publications/commissioned_reports/463.pdf (accessed on 4 March 2017).
  9. Hall, D.; Kirkpatrick, I.; Morag, M. Rural Tourism and Sustainable Business; Cornwell Press: Hook, UK, 2005. [Google Scholar]
  10. Butler, R.; Clark, G. Tourism in Rural Areas: Canada and United Kingdom. In Contemporary Rural Systems in Transition; Bowler, I.R., Bryant, C.R., Nellis, M.D., Eds.; Volume 2: Economy and Society, 1992; Cab International: Wallingford, UK, 1993; pp. 166–183. Available online: http://www.cabidirect.org (accessed on 3 March 2017).
  11. Ryan, C.; Scotland, A.; Montgomery, D. Resident Attitudes to Tourism Development—A Comparative Study between the Rangitikei, New Zeeland and Bakewell, United Kingdom. Prog. Tour. Hosp. Res. 1998, 4, 115–130. [Google Scholar] [CrossRef]
  12. Everett, S.; Aitchison, C. The Role of Food Tourism in Sustaining Regional Identity: A Case Study of Cornwall, South West England. J. Sustain. Tour. 2008, 16, 150–167. [Google Scholar] [CrossRef]
  13. Alexander, N.; Mckenna, A. Rural Tourism in the Heart of England. Int. J. Contemp. Hosp. Manag. 1998, 10, 203–205. [Google Scholar] [CrossRef]
  14. Godfrey, K.B. Attitudes towards “Sustainable Tourism” in the UK: A View from Local Government. Tour. Manag. 1998, 19, 213–224. [Google Scholar] [CrossRef]
  15. Tang, C.H.; Jones, E. Local Leadership for Rural Tourism Development: A Case Study of Adventa, Monmouthshire, UK. Tour. Manag. Perspect. 2012, 4, 28–35. [Google Scholar] [CrossRef]
  16. Church, A.; Ball, R.; Ball, C.; Tyler, D. Public Policy Engagement with British Tourism: The National, Local and the European Union. Tour. Geogr. 2000, 2, 312–336. [Google Scholar] [CrossRef]
  17. Jarvis, N.; Weeden, C.; Simcock, N. The benefits and Challenges of Sustainable Tourism Certification: A Case Study of the Green Tourism Business Scheme in the West of England. J. Hosp. Tour. Manag. 2010, 17, 83–93. [Google Scholar] [CrossRef]
  18. McNally, S. Farm Diversification in England and Wales—What can we learn from the farm Business Survey? J. Rural Stud. 2001, 17, 247–257. [Google Scholar] [CrossRef]
  19. Dvoroková, K. Sigma versus Beta-convergence in EU28: Do they lead to different results? Math. Methods Financ. Bus. Adm. 2014, 11, 314. [Google Scholar]
  20. World Travel and Tourism Council (WTTC). Travel & Tourism. Economic Impact 2016; World Travel &Tourism Council: London, UK, 2016. [Google Scholar]
  21. Travel & Tourism, Economic Impact 2016, UK. Available online: http://www.wttc.org/-/media/files/reports/economic-impact-research/countries-2016/unitedkingdom2016.pdf (accessed on 9 November 2016).
  22. Travel & Tourism, Economic Impact 2015, UK. Available online: https://www.wttc.org/-/media/files/reports/economic%20impact%20research/countries%202015/unitedkingdom2015.pdf (accessed on 11 November 2016).
  23. European Commission, n.d. Tourism. Available online: http://ec.europa.eu/ growth/sectors/tourism/ (accessed on 25 October 2016).
  24. Town Data: VisitBritain Corporate Site, VisitBritain. Retrieved 23 December 2015. Available online: https://www.visitbritain.org/nation-region-county-data (accessed on 15 September 2016).
  25. London Is World Capital of Culture Says LSE Expert. Available online: http://www.lse.ac.uk/newsAndMedia/news/archives/2008/culturecapital.aspx (accessed on 14 September 2016).
  26. Visitor Attractions—Most Visited Paid Attractions 2014. Available online: https://www.visitengland.com/sites/default/files/downloads/england_tourism_factsheet_2014_data_11th_december.pdf (accessed on 21 September 2016).
  27. Domestic Leisure Tourism to England’s Countryside, Domestic Rural Tourism in 2014. Available online: https://www.visitengland.com/biz/resources/insights-and-statistics/research-topics/destinations-and-destination-types/rural-tourism (accessed on 22 December 2016).
  28. Hirotsune, K. Tourism, Sustainable Tourism and Ecotourism in Developing Countries. In Proceedings of the ANDA International Conference, Nagoya, Japan, 5–7 March 2011. [Google Scholar]
  29. Furqan, A.; Som, A.P.M.; Hussin, R. Promoting Green Tourism for Future Sustainability. Theor. Empir. Res. Urban Manag. 2010, 5, 64–75. [Google Scholar]
  30. Lane, B. Sustainable Rural Tourism Strategies: A Tool for Development and Conservation. RIAT (Rev. Interam. Ambient. Tur./Int. J. Environ. Tour.) 2005, 1, 12–20. [Google Scholar] [CrossRef]
  31. Tourism Jobs and Growth. The Economic Contribution of the Tourism Economy in the UK; Deloitte, Oxford Economics: New York, NY, USA, 2013.
  32. Miller, G. Corporate Responsibility in the UK Tourism Industry. Available online: http://core.ac.uk (accessed on 14 September 2016).
  33. Gross Domestic Product (GDP) at Current Market Prices by NUTS 2 Regions. Available online: http://ec.europa.eu/eurostat/statistics-explained/index.php/GDP_at_regional_level/ro#PIB-ul_regional_pe_cap_de_locuitor (accessed on 22 December 2016).
  34. Kane, R. Investigating Convergence of zhe US Regions: A Time—Series Analysis, Bureau of Economic Analysis. In Proceedings of the Annual Conference of the Mid-Continent Regional Science Association, Duluth, MN, USA, 31 May–2 June 2001. [Google Scholar]
  35. Pascariu, G.C. Despre Convergenţă şi Divergenţă în Procesul de Integrare Europeană; Series Economic Science; Scientific Annals of “Al. I. Cuza” University of Iaşi: Iași, Romania, 2005; pp. 59–66. [Google Scholar]
  36. Monfort, P. Convergence of EU Regions Measures and Evolution. Available online: http://ec.europa.eu/regional_policy/sources/docgener/work/200801_convergence.pdf (accessed on 7 January 2017).
  37. Srivatsa, R.; Lee, S. European Real Estate Market Convergence; Aberdeen: London, UK, 2010. [Google Scholar]
  38. Marquez, A.; Soukiazis, E. Per Capita Income Convergence across Countries and across Regions in the European Union. Presented at the 2nd International Meeting of European Economy, Organised by CEDIN(ISEG), Lisbon. December 1998; Available online: http://citeseerx.ist.psu.edu/viewdoc/download?doi=10.1.1.504.9426&rep=rep1&type=pdf (accessed on 11 January 2017).
  39. Soukiazis, E. What Have We Learnt about Convergence in Europe? Some Theoretical and Empirical Consideration. Available online: www4.fe.uc.pt and www.researchgate.net (accessed on 9 January 2017).
  40. Simionescu, M. Testing Sigma Convergence across EU-28. Econ. Sociol. 2014, 7, 48–60. [Google Scholar] [CrossRef] [PubMed]
  41. International Monetary Fund, United Kingdom and the IMF, World Economic Outlook Database. 2015. Available online: https://www.imf.org/external/country/GBR/index.htm, (accessed on 7 December 2016).
  42. Dzenita, S. Real economic convergence in the European Union from 1995 to 2013. Bus. Manag. Rev. 2015, 6, 213–216. [Google Scholar]
  43. Merler, S. Income Convergence: Did EU Funds Provide a Buffer? Available online: http://bruegel.org/2016/11/income-convergence-during-the-crisis-did-eu-funds-provide-a-buffer/ (accessed on 9 January 2017).
  44. Sperlich, Y.; Sperlich, S. Income Development and Sigma Convergence in South-South Agreement Areas; Working Paper Series—WPS 12031; Université de Genève: Geneva, Switzerland, 2012. [Google Scholar]
  45. Marques, A.; Soukiazis, E. Per capita income convergence across countries and across regions in the European Union. In Proceedings of the 2nd International Meeting of European Economy, Lisbon, Portugal, 13–15 December 1998. [Google Scholar]
  46. Baumol, W. Productivity Growth, Convergence, and Welfare: What the Long-Run Data Show. Am. Econ. Rev. 1986, 76, 1072–1085. [Google Scholar]
  47. Young, A.; Heggind, M.; Levy, D. Sigma Convergence versus Beta Convergence: Evidence from US Country—Level Data. J. Money Credit Bank. 2008, 40, 1083–1094. [Google Scholar] [CrossRef]
  48. Iancu, A. Probleme ale Integrării în U.E. Problema Convergenței Economice. 2005. Available online: http://oeconomica.org.ro/files/pdf/93.pdf (accessed on 14 September 2016).
  49. International Monetary Fund, Report for Selected Countries and Subjects. Available online: http://www.imf.org/external/pubs/ft/weo/2015 (accessed on 7 December 2016).
  50. KOF Index of Globalization. 2015. Available online: http://globalization.kof.ethz.ch/media/filer_public/2015/03/04/rankings_2015.pdf (accessed on 14 September 2016).
  51. High-Speed Rail’s Long Journey. BBC News. 17 March 2014. Available online: http://www.bbc.com/news/uk-16473296 (accessed on 12 September 2016).
  52. United Kingdom, Yorkshire and the Humber. Available online: https://www.citypopulation.de/php/uk-england-yorkshireandthehumber.php (accessed on 9 November 2016).
  53. United Kingdom, North East England. Available online: https://www.citypopulation.de/php/uk-england-northeastengland.php (accessed on 9 November 2016).
  54. United Kingdom, East Midlands. Available online: https://www.citypopulation.de/php/uk-england-eastmidlands.php (accessed on 9 November 2016).
  55. United Kingdom, East of England. Available online: https://www.citypopulation.de/php/uk-england-eastofengland.php (accessed on 9 November 2016).
  56. United Kingdom, Greater London. Available online: https://www.citypopulation.de/php/uk-greaterlondon.php (accessed on 9 November 2016).
  57. United Kingdom, South East (Excluding London). Available online: https://www.citypopulation.de/php/uk-england-southeastengland.php (accessed on 9 November 2016).
  58. United Kingdom, South West England. Available online: https://www.citypopulation.de/php/uk-england-southwestengland.php (accessed on 9 November 2016).
  59. United Kingdom, West Midlands. Available online: https://www.citypopulation.de/php/uk-england-westmidlands.php (accessed on 9 November 2016).
  60. United Kingdom, North West England. Available online: https://www.citypopulation.de/php/uk-england-northwestengland.php (accessed on 9 November 2016).
  61. United Kingdom, Council Areas and Major Cities in Scotland. Available online: https://www.citypopulation.de/UK-Scotland.html (accessed on 9 November 2016).
  62. United Kingdom, Districts and Major Cities in Wales. Available online: https://www.citypopulation.de/UK-Wales.html (accessed on 9 November 2016).
  63. United Kingdom, Major Cities in Northern Ireland. Available online: https://www.citypopulation.de/UK-NorthernIreland.html (accessed on 9 November 2016).
  64. United Kingdom, Countries and Major Cities. Available online: https://www.citypopulation.de/UK-Cities.html (accessed on 9 November 2016).
Figure 1. Linear correlation for the values calculated in the table.
Sustainability 09 00525 g001
Figure 2. Graphical representation of the 12 Economic Development Regions of the UK according to the value of each point (Source: calculated by the authors).
Sustainability 09 00525 g002
Figure 3. Graphical representation of the values obtained for σt “2005–2014”.
Sustainability 09 00525 g003
Table 1. Gross Domestic Product (GDP) according to the standard of purchasing power (SPP), in relationship with the average of EU-28 level, by regions at NUTS 2 level, 2014 (percent of the average of EU-28 level, EU-28 = 100) (EUR/inhabitant).
2005200620072008200920102011201220132014
England32,12633,93735,75231,44727,58530,08730,92834,21234,07237,721
North East England24,21925,67226,39023,05620,03721,60122,15024,23723,86726,094
Yorkshire and Humber26,73128,20629,90625,87522,89324,34024,77327,01926,56929,052
East Midlands26,42928,04429,45925,75622,23824,62225,28927,68627,76730,575
East of England30,41532,42533,56229,83125,78927,99428,45531,29030,98734,549
London50,56553,02857,14450,72145,01149,08152,26157,98758,00865,616
South East (excluding London)33,92535,74037,55133,23029,07532,07232,83236,81936,68340,295
South West England28,75430,18632,01528,16224,91027,38227,45430,19230,08933,137
West Midlands26,80328,23629,13725,27621,68723,85124,55727,20927,06929,525
North West England27,39429,37130,57726,63623,55525,39825,20127,88927,84630,410
Scotland29,39631,40532,87828,92525,83426,96827,53430,05130,12633,357
Wales23,10124,43825,48721,67519,45420,63021,53023,71223,49125,467
North of Ireland25,51027,47729,49525,09621,66323,16423,52025,84325,33727,504
Total per country31,26333,07334,82630,57326,86929,16129,96833,10532,96936,458
Source: [33].
Table 2. Gross Domestic Product from Tourism (GDPT) per capita per regions (euro/inhabitant).
2005200620072008200920102011201220132014
England1179124613121154101211041135125612501384
North East England889942969846735793813890876958
Yorkshire and Humber981103510989508408939099929751066
East Midlands97010291081945816904928101610191122
East of England111611901232109594610271044114811371268
London1856194620971861165218011918212821292408
South East (excluding London)1245131213781220106711771205135113461479
South West England105511081175103491410051008110811041216
West Midlands984103610699287968759019999931084
North West England100510781122978864932925102410221116
Scotland10791153120710629489901010110311061224
Wales848897935795714757790870862935
North of Ireland936100810829217958508639489301009
Total per country114712141278112298610701100121512101338
Source: Data processed from bibliographical sources.
Table 3. Values for the calculation of natural logarithms.
ln ( G D P T 2005 ) 1 10   ln ( G D P T 2014 G D P T 2005 )
North East England6.7899023170.007457169
Yorkshire and Humber6.8885991710.008325370
East Midlands6.8772346880.014572669
East of England7.0177017810.012745450
London7.5260402190.026055319
South East (excluding London)7.1269329030.017206939
South West England6.9615460590.014189017
West Midlands6.8912769780.009675022
North West England6.9130994640.010446114
Scotland6.9836335860.012639849
Wales6.7426449450.009752913
North of Ireland6.8418441890.007524780
Source: calculations performed by the authors.
Table 4. The estimative values for constant α and slope β.
Periodαβ
2005–2014−0.1520.023
Table 5. Estimation for α and β.
GDPT (Euro/Inhabitant)
2005
GDPT (Euro/Inhabitant)
2014
ModificationConvergence
North East England88995869Downward convergence
Yorkshire and Humber981106685Downward convergence
East Midlands9701122152Upward convergence
East of England11161268152Downward convergence
London18562408552Divergence
South East (excluding London)12451479234Upward convergence
South West England10551216161Upward convergence
West Midlands9841084100Downward convergence
North West England10051116111Downward convergence
Scotland10791224145Downward convergence
Wales84893587Upward convergence
North of Ireland936100973Downward convergence
Source: Calculations performed by the authors.
Table 6. Estimated values for σt.
y ¯ t
y = 0.023x − 0.152
ln ( y ¯ t ) [ ln ( G D P T 2014 ) ln ( y ¯ t ) ] 2 σt
North East England0.004167753−5.480378169161.62950354.0203172
Yorkshire and Humber0.006437781−5.045571375141.84918113.7662870
East Midlands0.006176398−5.087020054145.41641613.8133504
East of England0.009407141−4.666286202136.63850903.6964646
London0.021098925−3.858533186121.08118193.4796721
South East (excluding London)0.011919457−4.429583192149.23497083.8630942
South West England0.008115559−4.813972153146.72415003.8304588
West Midlands0.006499371−5.036049952147.36712473.8388426
North West England0.007001288−4.961661194142.79505273.7788233
Scotland0.008623572−4.753255840138.55211973.7222590
Wales0.003080834−5.782555027166.21880214.0769940
North of Ireland0.005362416−5.228340594145.64904633.8163994
45.7029629
Source: Calculations performed by the authors.
Table 7. Estimated values for σt.
σt
2005–2006
σt
2006–2007
σt
2007–2008
σt
2008–2009
σt
2009–2010
σt
2010–2011
σt
2011–2012
σt
2012–2013
σt
2013–2014
σt
2005–2014
North East England3.88020343.81045233.78470513.96485284.79396404.15948404.06660463.87909883.90216914.0203172
Yorkshire and Humber3.77391613.73540023.70278713.80272563.98005063.87318383.85015563.76542823.77892403.7662870
East Midlands3.78342953.73906493.71040643.80720414.05454173.85784573.82619393.74765843.74565493.8133504
East of England3.69480143.66906993.65772293.70401663.80595173.74023583.72993573.68256463.68659713.6964646
London3.60011823.59917403.59921673.60003243.60621473.60113733.59937803.59942453.59943053.4796721
South East (excluding London)3.65449133.64067163.63001983.66083563.71746083.67300853.66478353.63399813.63478523.8630942
South West England3.72374583.69830663.67367133.73637333.84345213.75543993.75355953.69821803.69983883.8304588
West Midlands3.77175193.73472233.71627493.82674184.14245213.90327313.86127343.76011643.76398943.8388426
North West England3.75512903.71197013.69240043.77683663.92408703.82153883.83006253.74271843.74375393.7788233
Scotland3.71153033.68108603.66431023.72033963.80422813.76687863.75150083.70043843.69924853.7222590
Wales3.96081603.86770553.81785964.14476594.30622354.51357254.17450373.91273673.92888034.0769940
North of Ireland3.81692763.75296613.70977133.83477104.14705903.95530563.92668753.80391223.82415693.8163994
45.126860644.640589444.359145745.579495148.125685246.620903646.034638644.926312745.007428745.7029629
Source: Calculations performed by the authors.

