1. Introduction
The Kyoto Protocol, ratified in 1997, imposed an obligation to reduce greenhouse gases in 38 developed nations, excluding the US and China, but this agreement failed to effectively induce international participation with regards to greenhouse gas reductions due to its various limitations. However, the 21st Conference of the Parties that took place in Paris in December 2015 was significant in its success in producing a new climate regime (under the Paris Agreement) that would enable both advanced and developing nations to participate in reducing greenhouse gases and determine their own reduction targets.
In accordance with this new climate regime, 196 member states, including developing countries, are obliged to submit their Intended Nationally Determined Contributions (INDC) for every 5 years that delineate greenhouse gas reduction goals in response to climate change to the UN and establish their own individual plans to ensure the achievement of such goals [
1]. The US has proposed 2025 greenhouse gas emission reduction targets of 26–28%, the European Union (EU) proposed a 2030 target of 35%, and Japan proposed a 2030 target of 26% in reductions in comparison to 2005 levels [
2]. South Korea has also proposed a 37% reduction in comparison to expected BAU emissions levels in 2030. However, South Korea’s target matches the highest level of OECD reduction targets, and in order to achieve this, a multitude of policies and endeavors will be necessary.
Among the many detailed endeavors taken to carry out such efforts, last year, 20 countries, including South Korea along with the US and France participated in the “Mission Innovation Declaration” [
3]. This declaration aims to double public investments in R&D in the field of clean energy within 5 years, and in accordance with this declaration, the South Korean government is also planning to restructure its current investments of USD 1.5 trillion in energy R&D to focus more on clean energy. However, the method to strategically push forth this doubling of R&D investments is another difficult issue yet to be addressed. As one of many means to solve this issue, a proper tool that can objectively analyze the current level of energy technology in South Korea, the current level of R&D investments, and the impact of enhancements in energy technology is needed above all, and in addition, it will be critical to secure sufficient data in order to increase the credibility of the results obtained from the tool.
The Korea Institute of Energy Technology Evaluation and Planning (KETEP), a government organization in charge of national R&D planning and assessment with regards to energy technology, has set quantitative national energy R&D targets, including specific pricing and performance indicators per year, by publishing its 2013 Energy Technology Vision Roadmap [
4]. Therefore, if there were to be an analysis model that could calculate impact based on the levels of future R&D investments and energy technology, it would be helpful in performing quantitative analysis necessary to answer the question of how the South Korean government could achieve its proposed reduction targets.
Therefore, this research attempts to use a bottom-up model—The Integrated MARKAL-EFOM System (TIMES) model—in order to analyze the impact of the realization of the Energy Technology Vision Roadmap on energy systems. Through such analysis, it will be possible to suggest new methods to quantitatively analyze mid- to long-term impacts of energy technology R&D on energy systems, such as changes in energy consumption and CO2 emissions. In order to do so, it is necessary to understand the detailed characteristics and future prospects of energy technology that are proposed in the Energy Technology Vision Roadmap and construct an energy systems analysis model that would reflect such technological characteristics and development roadmaps. In addition, in order to overcome limitations of the Energy Technology Vision Roadmap that focuses only on the power generation technologies, the technologies proposed in the Green Energy Strategy Roadmap, which includes the final energy consumption areas, such as energy-saving houses and buildings, and green car technology, were additionally considered. Later on, through the modeling of various scenarios, the mid- to long-term impact on energy systems, such as changes in energy consumption and CO2 emissions following the achievement of the Energy Technology Vision Roadmap R&D targets, were analyzed.
In order to accomplish this task, in
Section 2, this paper will review the relevant literature in the field of impact analysis through utilizing the energy systems analysis models to propose the need to link quantitative impact analysis with the establishment of an R&D roadmap.
Section 3 will summarize the Energy Technology Vision Roadmap proposed by KETEP,
Section 4 will describe research methodology using the TIMES model, and
Section 5 will discuss the production of data necessary for the model as well as its characteristics. Next,
Section 6 will analyze the impact under various scenarios, and finally,
Section 7 will discuss implications and future research directions based on the model and the analysis of its results.
2. Literature Review
With the setting of greenhouse gas reduction targets, establishments of roadmaps in order to meet such targets have also been carried out by each country. That is, countries are reviewing the feasibility of such targets through various scenario analyses and are endeavoring to develop detailed measures and policies to achieve their proposed targets.
The International Energy Agency’s (IEA) Committee on Energy Research and Technology [
5] plays an important role in coordinating IEA member country R&D policies (IEA). In 2007, CERT published the report Reviewing R&D Policies: Guidance for IEA Review Teams [
6] as a guide to conducting R&D and technology reviews with the goal of enabling consistent reviews across member countries in order to facilitate cross country comparisons and transfer of best practices. It should be noted that the report acknowledges that there is no single method for R&D priority setting and that both quantitative and qualitative methods can be used.
The Energy Roadmap [
7] devised by the EU in 2011 proposed mid- to long-term energy reduction targets by 2050 as well as various reduction measures, energy technologies, and scenarios necessary to meet these targets. Knopf et al. [
8] utilized 13 energy systems models to comparatively analyze such measures and scenarios. As a result, most models concluded that the long-term greenhouse gas reduction targets were feasible. However, the results have also showed that, after 2040, greater efforts would be required, which would significantly increase relevant costs. Moreover, the results also suggested that, without changes in energy systems that are based on fossil fuels prior to 2030, it would be difficult to successfully achieve the reduction targets.
Kainuma et al. [
9] reviewed low-carbon society (LCS) models that have been recently used in Asian countries (Japan, China, South Korea, and Nepal) as well as their relevant frameworks and approach methods. Although the results of these models and the global greenhouse gas emission targets for these countries are not directly related, the results showed that, based on different input data per country, various scenarios and roadmaps could be produced. Although these Asian countries are relatively lagging in terms of modeling expertise or analytics capabilities, considering their rate of economic growth and learning speed on model utilization capabilities through continuous improvements, significant national impact could be expected through application of LCS models in the future. Therefore, the R&D strategy and roadmaps proposed through the effective utilization of models will become invaluable national assets in the future and, at the same time, serve important roles in meeting the greenhouse gas reduction targets for each country. In addition, Nakata et al. [
10] summarized the definition of the energy systems model in a systematic way in order to crystalize the concept of LCS as well as the energy systems model, which can optimize energy technology portfolios based on the method of approach and field of application.
The aforementioned papers have proposed policy measures, scenarios, or alternatives to energy technology that can meet the targets proposed by applicable nations. However, there has been a lack of in-depth research in analyzing the impact on energy systems as a result of R&D roadmaps per technology type, such as whether or not detailed energy technology roadmaps can actually help achieve the proposed greenhouse gas reduction targets or how the R&D investments will impact the reduction targets.
Developing the various measures and policies that may be carried out to reduce greenhouse gases, there is no doubt that the energy technology is the core element to deliver the comprehensive outputs. Therefore, the competitiveness of a nation’s energy technologies serves a crucial role in the development of greenhouse gas reduction measures. Wiesenthal et al. [
11] assumes two-factor-learning curve types linking trends in technology cost to both accumulated R&D investments and production volumes, and utilizes the global energy model Prospective Outlook on Long-term Energy Systems (POLES) for analysis. Next, a comparative analysis on the European Strategic Energy Technology Plan (SET) R&D investment plans and sizes were carried out, and as a result, less mature low-carbon technology (e.g., offshore wind power, PV, concentrated solar power (CSP), biomass gas generation) costs decreased as a result of global R&D investments, and accordingly, the decrease in costs facilitated entry of such technologies into the market. In addition, with the decrease in such technological costs, investments in renewable energy increased, and as a result, mid- to long-term R&D investment recommendations were expected to be made. Despite various limitations in accurate data and analysis methodologies regarding R&D investment costs, efforts made by the EU, such as its proposed SET plan are meaningful in that they demonstrate the possibility of providing valuable information for national decision-making processes with regards to future greenhouse gas reduction approaches. However, because POLES is a simulation model, it has limitations in its inability to consider characteristics in the field of power generation, such as power load per time slice and peak load contribution per generation technology, as well as the economics for each technology.
From an uncertainty perspective, the uncertainty in energy technology potentials or greenhouse gas reductions serve as obstacles when calculating optimal R&D budgets per field. Pugh et al. [
12] has discussed two different approach methods that have been used for such difficult decision-making processes as those experienced by energy policymakers at the US DOE and compared the effects of greenhouse gas reductions and technological cost reductions as a result of R&D investments based on return on investment (ROI). Moreover, despite of uncertainty in identifying the relationship between R&D investments and the degree of technological development, several studies [
13,
14,
15] have been carried out with regards to the appropriate application of these two factors in the model. However, as such studies focused on individual technology rather than taking into consideration the reciprocal effect between energy conversion and final energy consumption fields from an energy systems perspective, the studies were not suitable in analyzing the impact of overall R&D programs on energy consumption and CO
2 emissions.
Additionally, with respect to both uncertainty and energy/environmental policy interactions Anadon et al. [
16] used a combination of interviews and technology elicitations to develop a range of potential technology cost improvements for a variety of energy technologies at three different U.S. federal R&D funding levels. A multi-region U.S. MARKAL model then estimated the range of benefits from these cost improvements under different policy conditions. The metrics considered include: CO
2 emissions, CO
2 prices under climate policy scenarios, Clean Energy Standard (CES) prices under CES scenarios, and oil imports. The experts who participated in the technology elicitations recommended increases in U.S. federal R&D funding levels of almost 300% and that investments be made across a range of technologies, as well as different stages of RD&D from basic research to full scale demonstration projects. However, the experts did expect declining marginal returns from these investments at increased funding levels. Finally, the modeling results included in the study indicated that both increased levels of federal RD&D funding (in the range of U.S.
$10 billion per year) and appropriate energy/environmental policies would be required to reach greenhouse gas reduction goals.
Therefore, one alternative may be to analyze the impact of the Energy Technology Vision roadmap using a bottom-up energy systems analysis model that takes into consideration the detailed characteristics for each technology, such as efficiency, utilization rate, investment costs, and maintenance costs, as well as the competitive relationship or reciprocal effect among technologies. According to Pfenninger et al. [
17], energy systems models can be categorized into one of four groups (energy systems optimization models, energy systems simulation models, power system and electricity market models, and qualitative and mixed-methods scenarios), and these models suggest various measures that can help establish more effective national policies or energy roadmaps. According to the categories in the paper, the TIMES model would belong into the energy systems optimization models, and MARKAL, the previous version of this model, Message, and OSeMOSYS, which is currently being developed, are also included in this group. Among the four groups, the energy systems optimization models form the only group whose methodology takes into consideration the detailed technological characteristics for each individual technology while also comprehensively analyzing the overall energy systems from energy supply to energy conversion and final energy consumption.
As a result, a number of papers that utilize the TIMES model in order to develop measures to achieve greenhouse gas reduction targets per country have recently increased. Chiodi et al. [
18] analyzed whether or not Ireland’s greenhouse gas reduction targets were realistic by using the TIMES model. Ireland had proposed relatively aggressive targets of reducing Non-Emission Trading Scheme (ETS) greenhouse gas emissions by 25% of its 2005 levels by 2020. However, due to Ireland’s geological situation, because the proportion of emissions generated from farming is 29% (whereas EU is only 10%), there are various limitations in devising a cost-optimal portfolio that could satisfy the Non-ETS targets, and therefore, an alternative plan was suggested which proposed the need for greater R&D in the field of transportation and heat production through renewable energy as well as an increase in the electrification of residential heating.
The paper written by Amorim et al. [
19] utilizes the TIMES model in the design of Portugal’s energy roadmap for its non-carbon economy ambitions by 2050. This paper is divided into two scenarios for analysis: one that proposes the possibility of establishing a non-carbon economy through the nation’s independent energy systems and the other that utilizes the Liberian electricity system that is linked with neighboring nations. As a result, the paper concludes that it is difficult to construct a non-carbon economy in the form of an independent energy system, and therefore, only through an energy system connected with surrounding nations would it be possible to establish a sustainable low-carbon energy technology roadmap.
As for South Korea, Park et al. [
20] introduces a model that can construct an optimal renewable energy technology portfolio with minimum costs that satisfies the allotment ratio for renewable energy generation by using the TIMES model. As a result, solar PV generation proved to be the most price-competitive, and should R&D investments continue to proceed simultaneously with generation, the possibility of market entries for not only solar PV, but also wind energy would also be expected to increase, driving the impact of greenhouse gas reductions even higher.
As from the previous literature listed above, following the declaration of voluntary greenhouse gas reduction targets per country and the development of detailed roadmaps and policy measures to achieve these targets, several studies have been carried out which analyze greenhouse gas reduction roadmaps or the feasibility and impact of policy measures by using bottom-up energy systems analysis models. The results produced from such studies may differ in the given environment, scope, and methodology, but they are similar in the overall process, such as input data collection, analysis model development, analysis scenario setting, and output analysis, and especially, the importance of input data to ensure a high level of confidence in the results has been stressed in all studies. However, in most studies, the prediction of technological characteristics, which is one of the most crucial input data, has not been definable as long-term time series data, and the data has not been deduced through linking important national R&D programs or roadmaps.
Therefore, this paper intends to propose a method that can provide a quantitative analysis of the impact on energy systems and feedback for roadmap establishment through assessing the feasibility of the R&D roadmap by using the TIMES model based on technological development strategies that were suggested in South Korea’s Energy Technology Vision Roadmap.
3. Energy Technology Vision Roadmap
KETEP is an organization that carries out national energy R&D project planning, assessment, and management work, and in 2011 after the publishing of the Green Energy Strategy Roadmap [
21], the organization has continued to publish roadmaps to lead the direction of government R&D. Recently, in accordance with the increase in demand for a strategic roadmap as a result of demands for system restructuring and the need for long-term national R&D target settings to secure consistency in policy direction, a national energy technology R&D milestone that could supervise overall energy technology became necessary. Therefore, in order to secure consistency in policy direction through comprehensive analysis of the market, business, and technology as well as long-term national R&D target setting, in 2013, the Energy Technology Vision Roadmap [
4] was established. This section will briefly summarize the description of this Energy Technology Vision Roadmap.
First, the Energy Technology Vision Roadmap was established with the purpose of inducing innovative R&D from the private sector by setting national energy R&D targets, and in order to define detailed R&D directions and investment size, cost-oriented national energy R&D targets (e.g., price or performance targets) that took into consideration recent changes in the industrial environment were proposed.
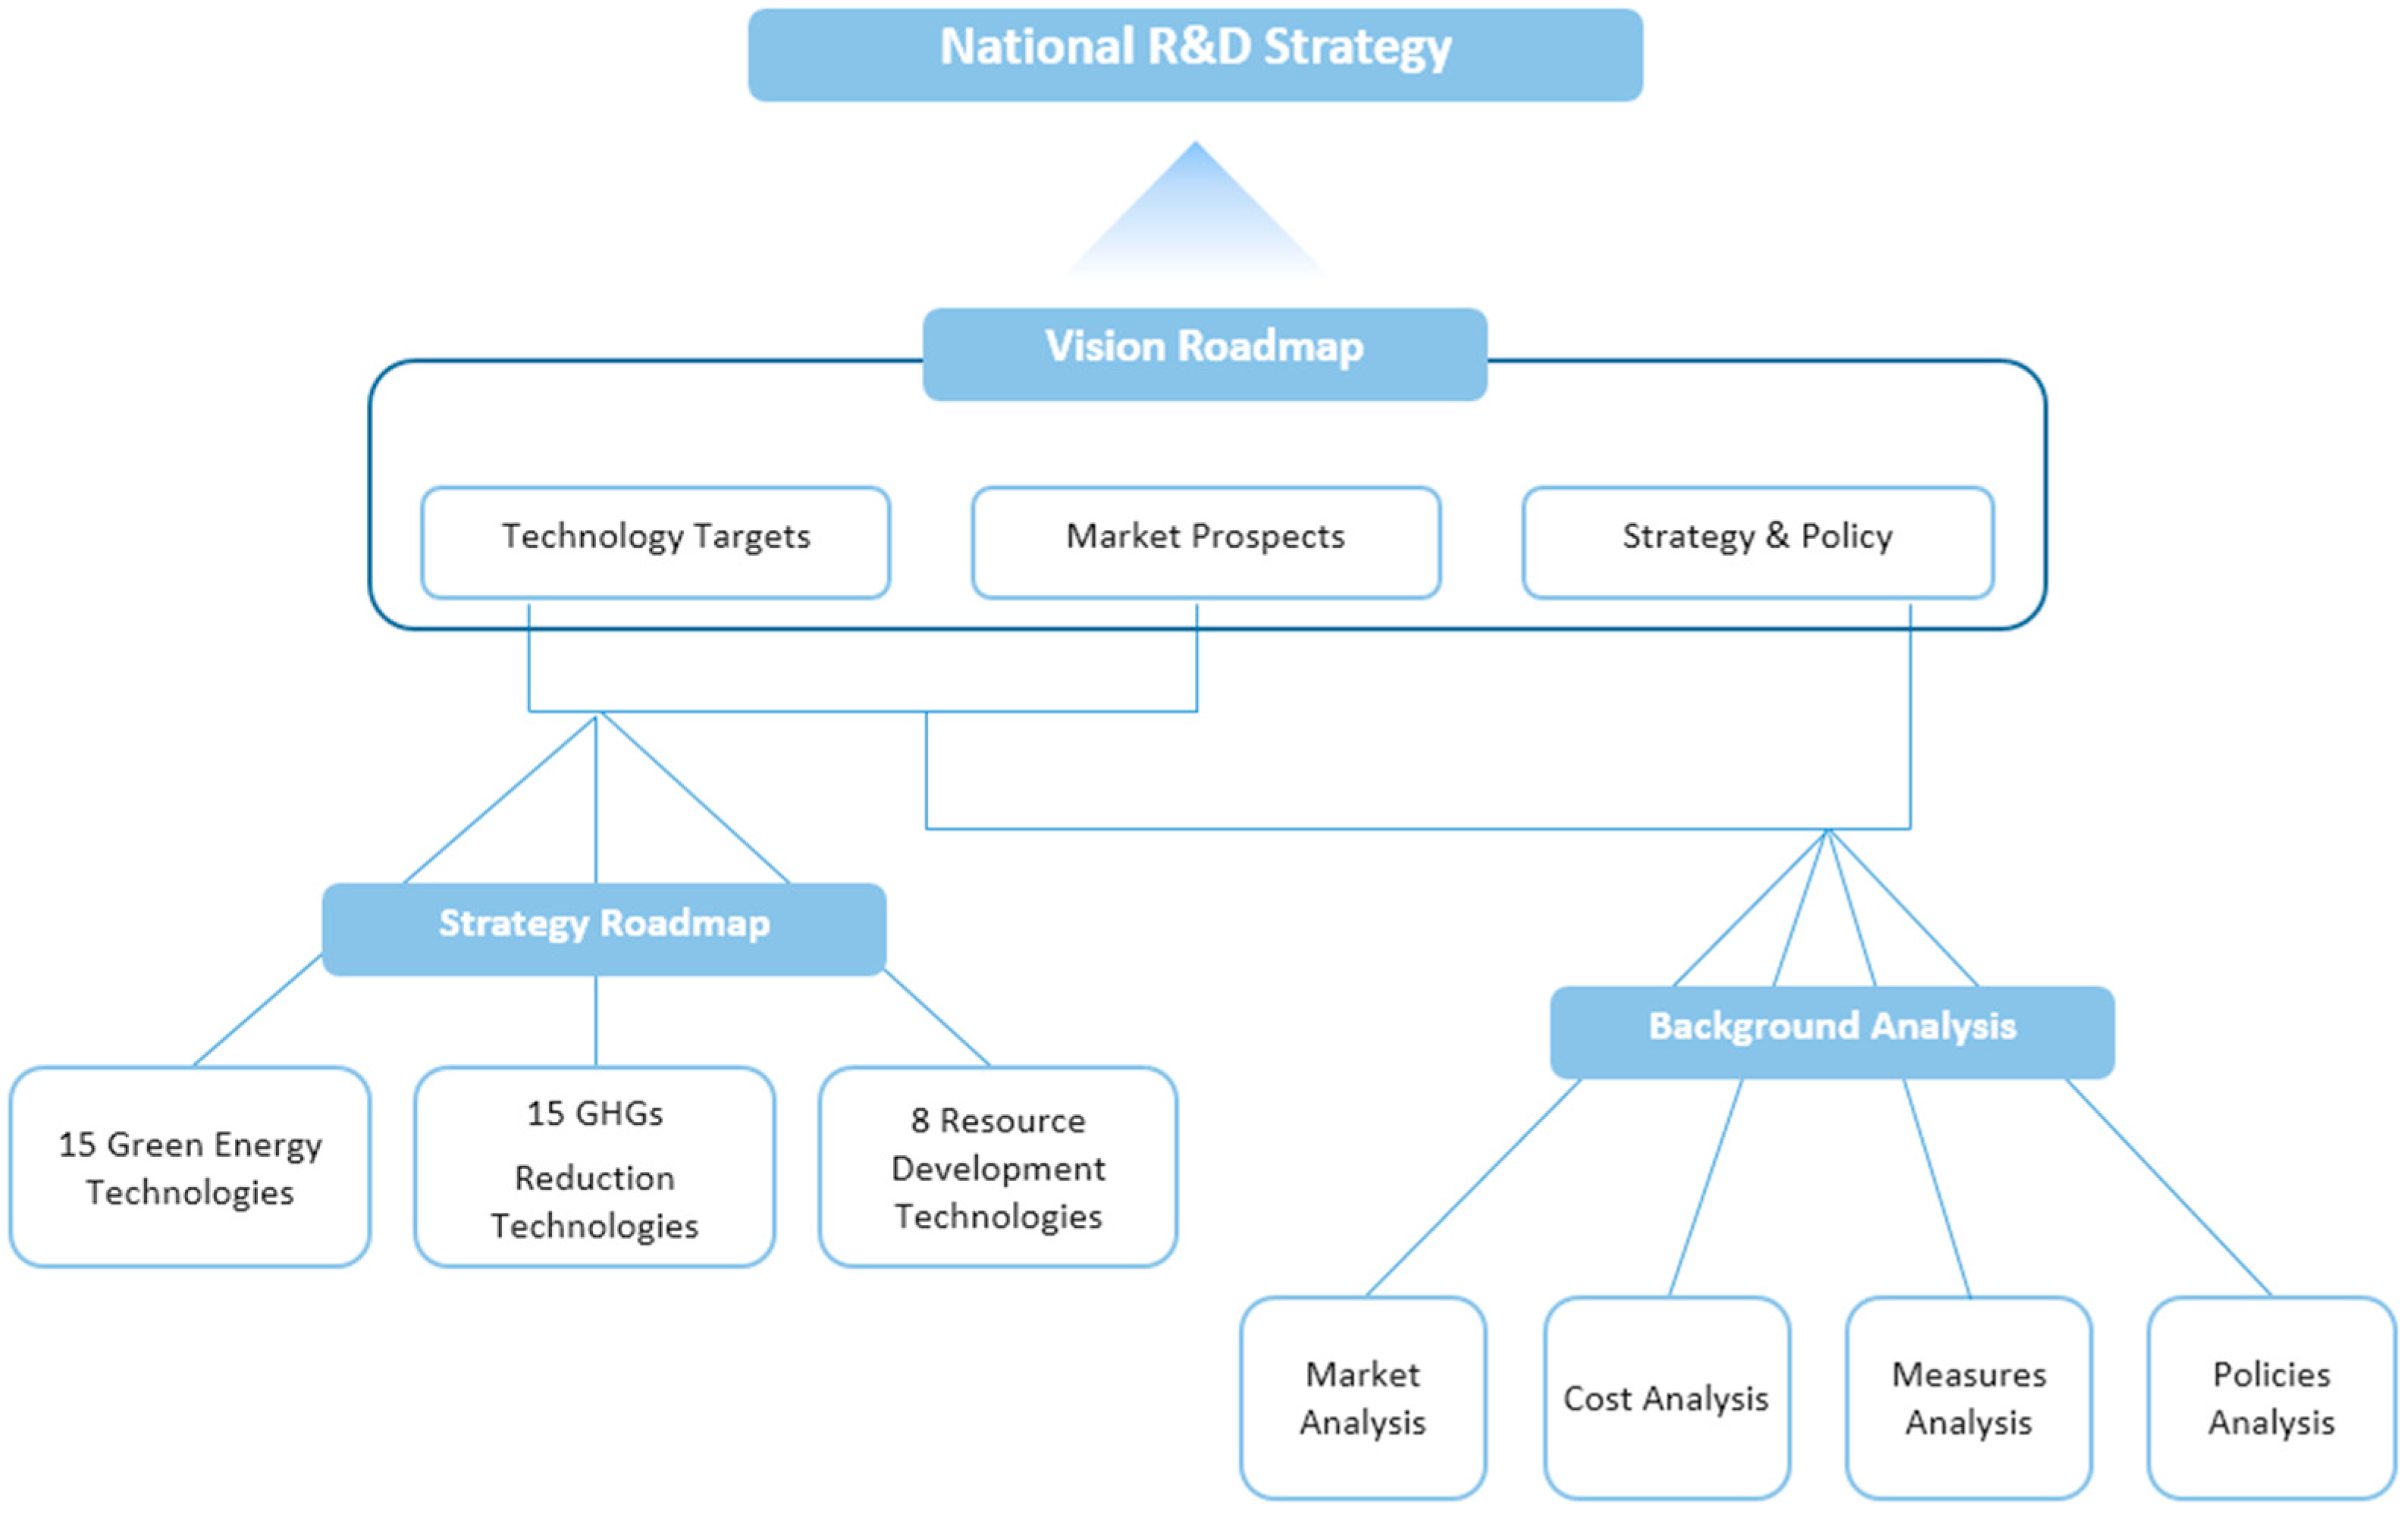
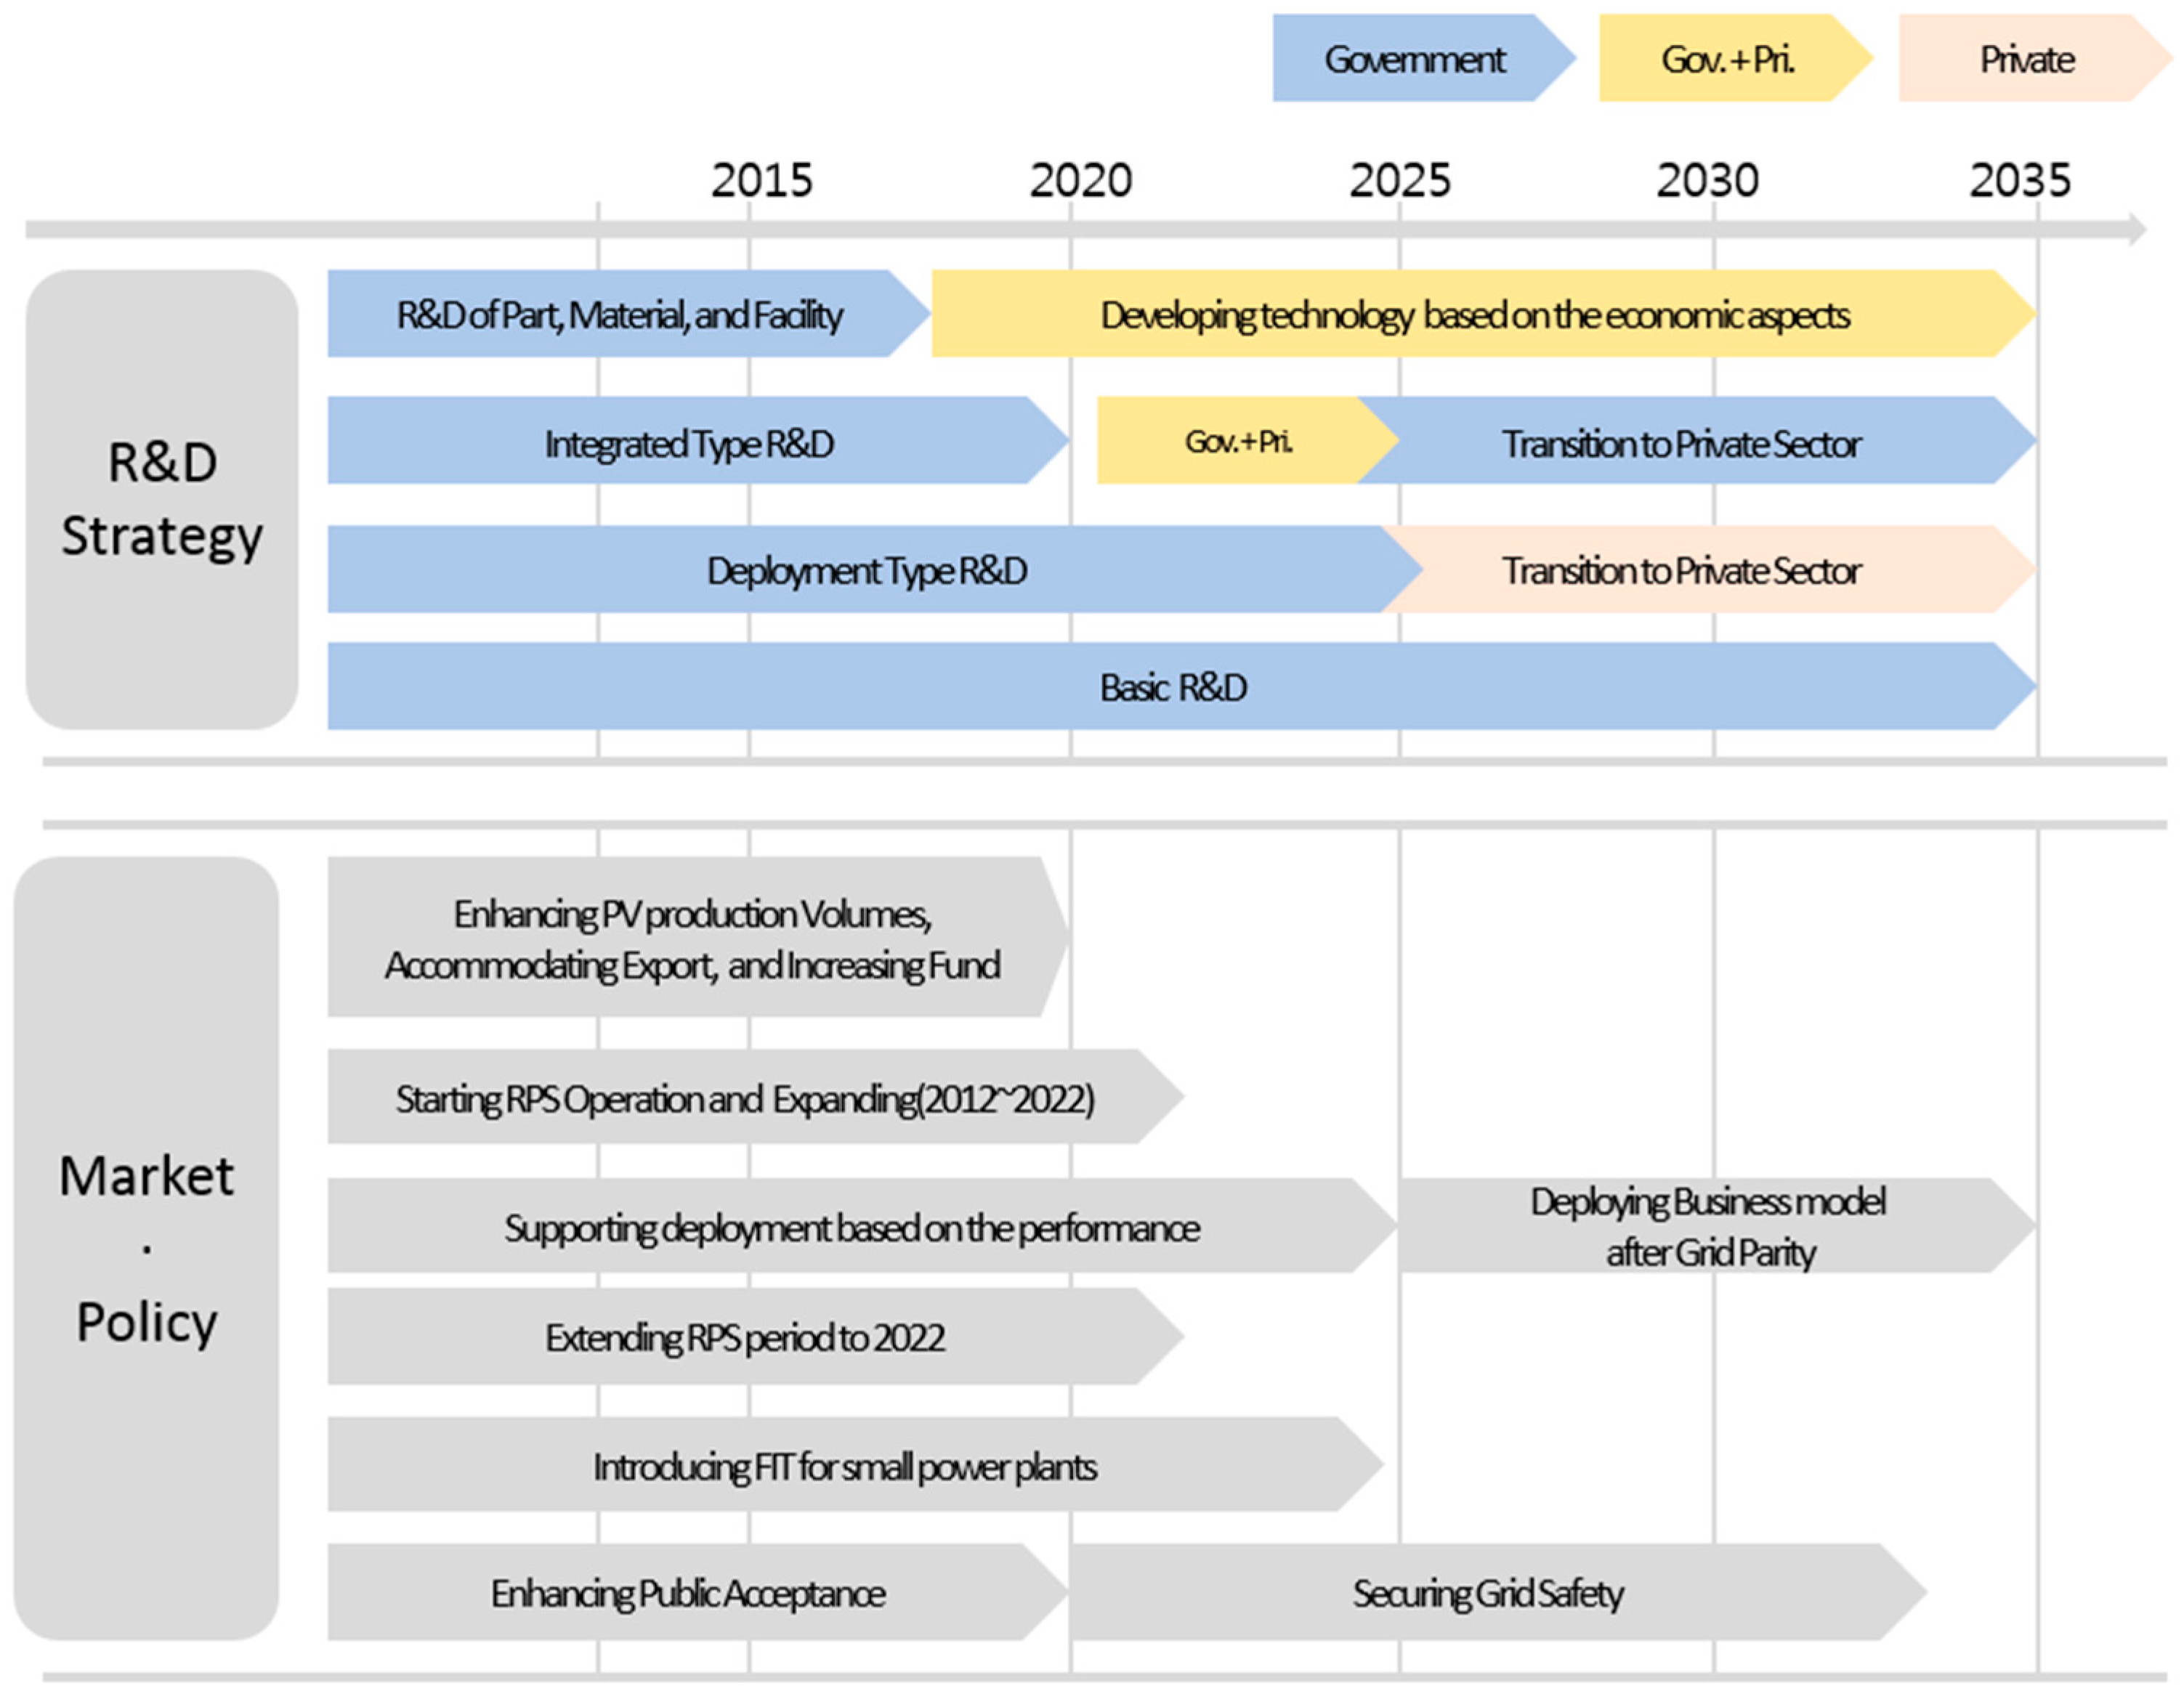
Figure 1 shows a diagram of the relationship among national R&D strategies, Energy Technology Vision Roadmap, and the Green Energy Strategy Roadmap.
If the Green Energy Strategy Roadmap was established at the strategy product unit based on the business model of a company, the purpose of the Energy Technology Vision Roadmap would be to propose national R&D targets at a higher level than the Green Energy Strategy Roadmap, and
Figure 2 provides an example of the relationship between these two roadmaps with regards to solar technology.
The fields of the Energy Technology Vision Roadmap were selected by shortlisting 14 among 38 fields from the 3 strategy roadmaps (15 from green energy technologies, 15 from greenhouse gas reduction technologies, and 8 from resource development technologies) in which comprehensive target-setting was possible, hosting expert consultation meetings, and finalizing 5 technological fields (i.e., solar power, wind power, fuel cells, energy storage, and coal power (including CCS)) with regards to energy generation by taking into consideration the political urgency, importance, and possibility of utilization. In order to decide the final 14 energy technologies and to estimate the technological characteristics in the model, two expert committees were involved. The first committee was responsible for the selection of the final technologies and consists of project directors in KETEP and external staff from industry, universities, and institutions. The second had meetings for five months in five groups (solar power, wind power, fuel cells, energy storage, and coal power) to gather the reference for the technological characteristics and brainstorming to get the estimates for the Energy Technology Vision Roadmap.
After the final technological fields were finalized, the detailed Energy Technology Vision Roadmap processes were carried out for each technology. In the first stage, detailed markets for the relevant technology and the technology analysis methodology were defined. To provide an example regarding the development of solar PV, the main detailed markets were the household, industrial, and power generation markets, and for the technology analysis methodology, the levelized cost of electricity generation (LCOE) indicators were applied [
22].
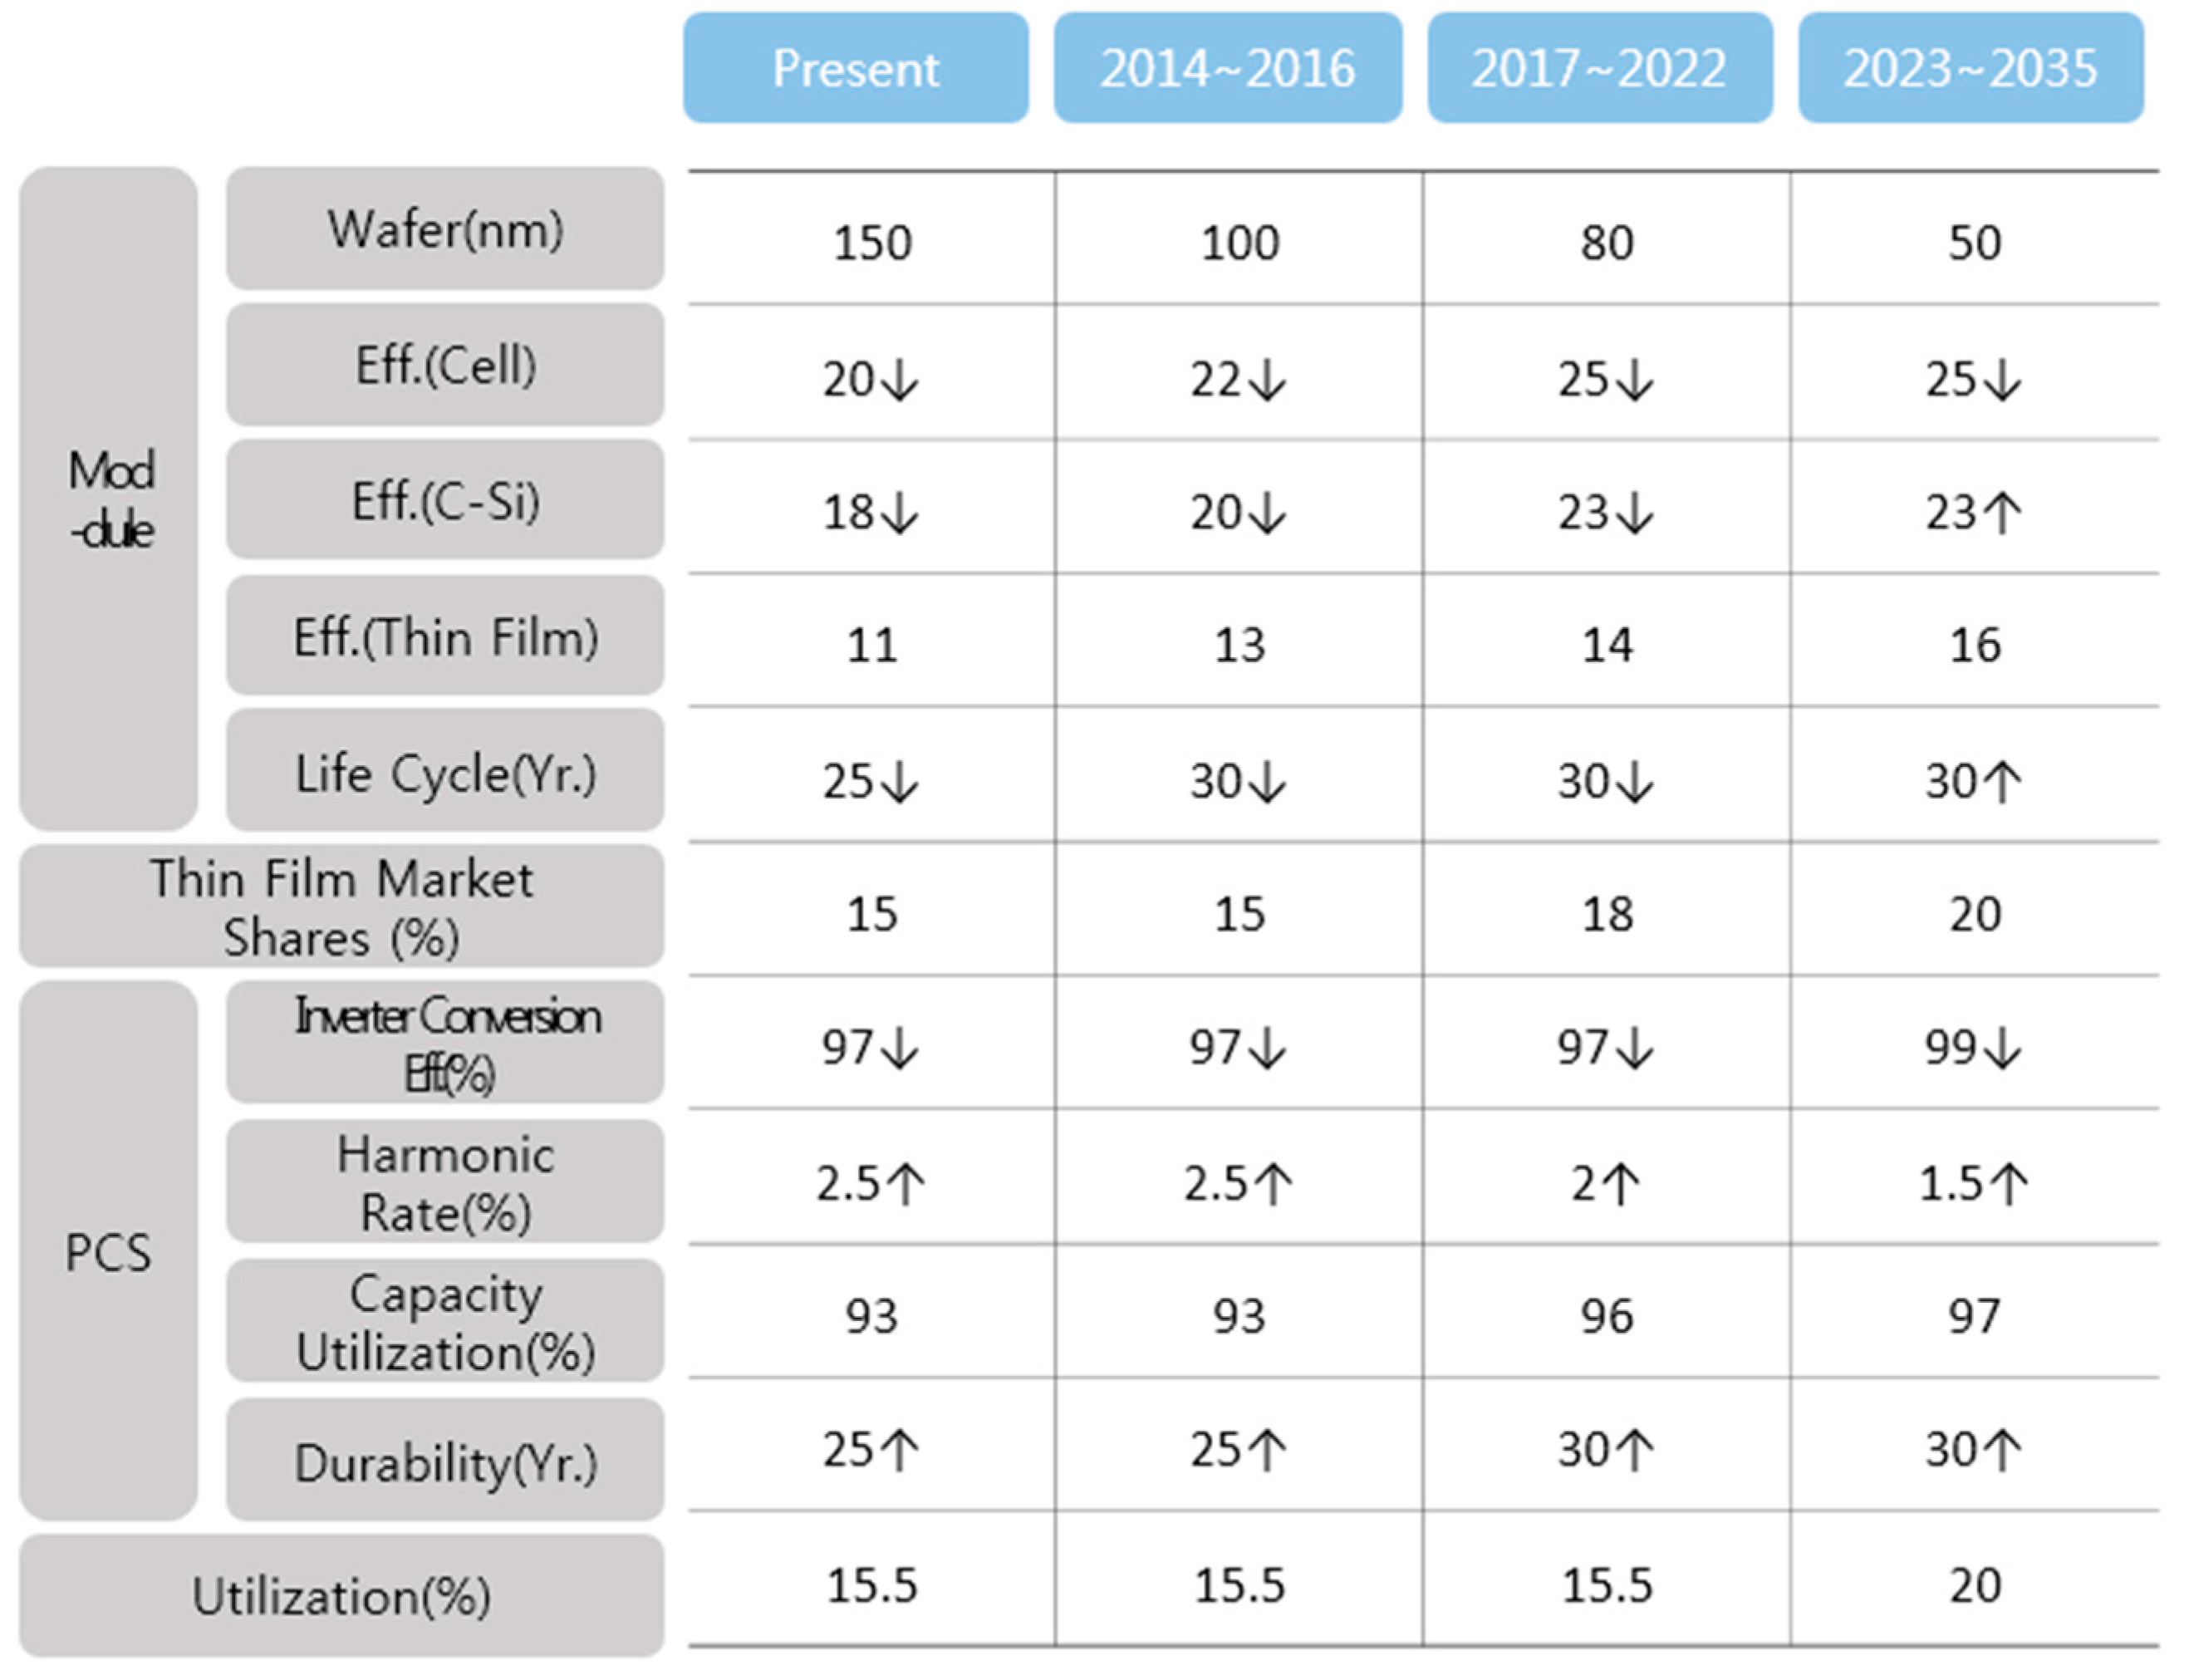
In the next stage, the main indicators to be utilized during the application of the technological analysis methodology are deduced and their values are predicted. The LCOE is an indicator that is generally applied when calculating the cost of power generation, and it is calculated by dividing the total cost incurred during the entire generation period, including generation equipment costs and operational costs, by the generation amount over the entire lifespan. The discount rate that is used here is 5.5% in accordance with the Korea Development Institute´s (KDI) General Guidelines for Preliminary Feasibility Studies, and the lifespan was assumed to be the economic lifespan. In addition, other indicators that affect the amount of generation, such as efficiency, lifespan, utilization rate, and system price, were proposed through relevant data analysis by working staff experts for each field of technology.
The final stage involves cost analysis for each technology based on the observed values of the major indicators as well as predicted LCOE values, and an example of solar power technology is shown in the following illustration.
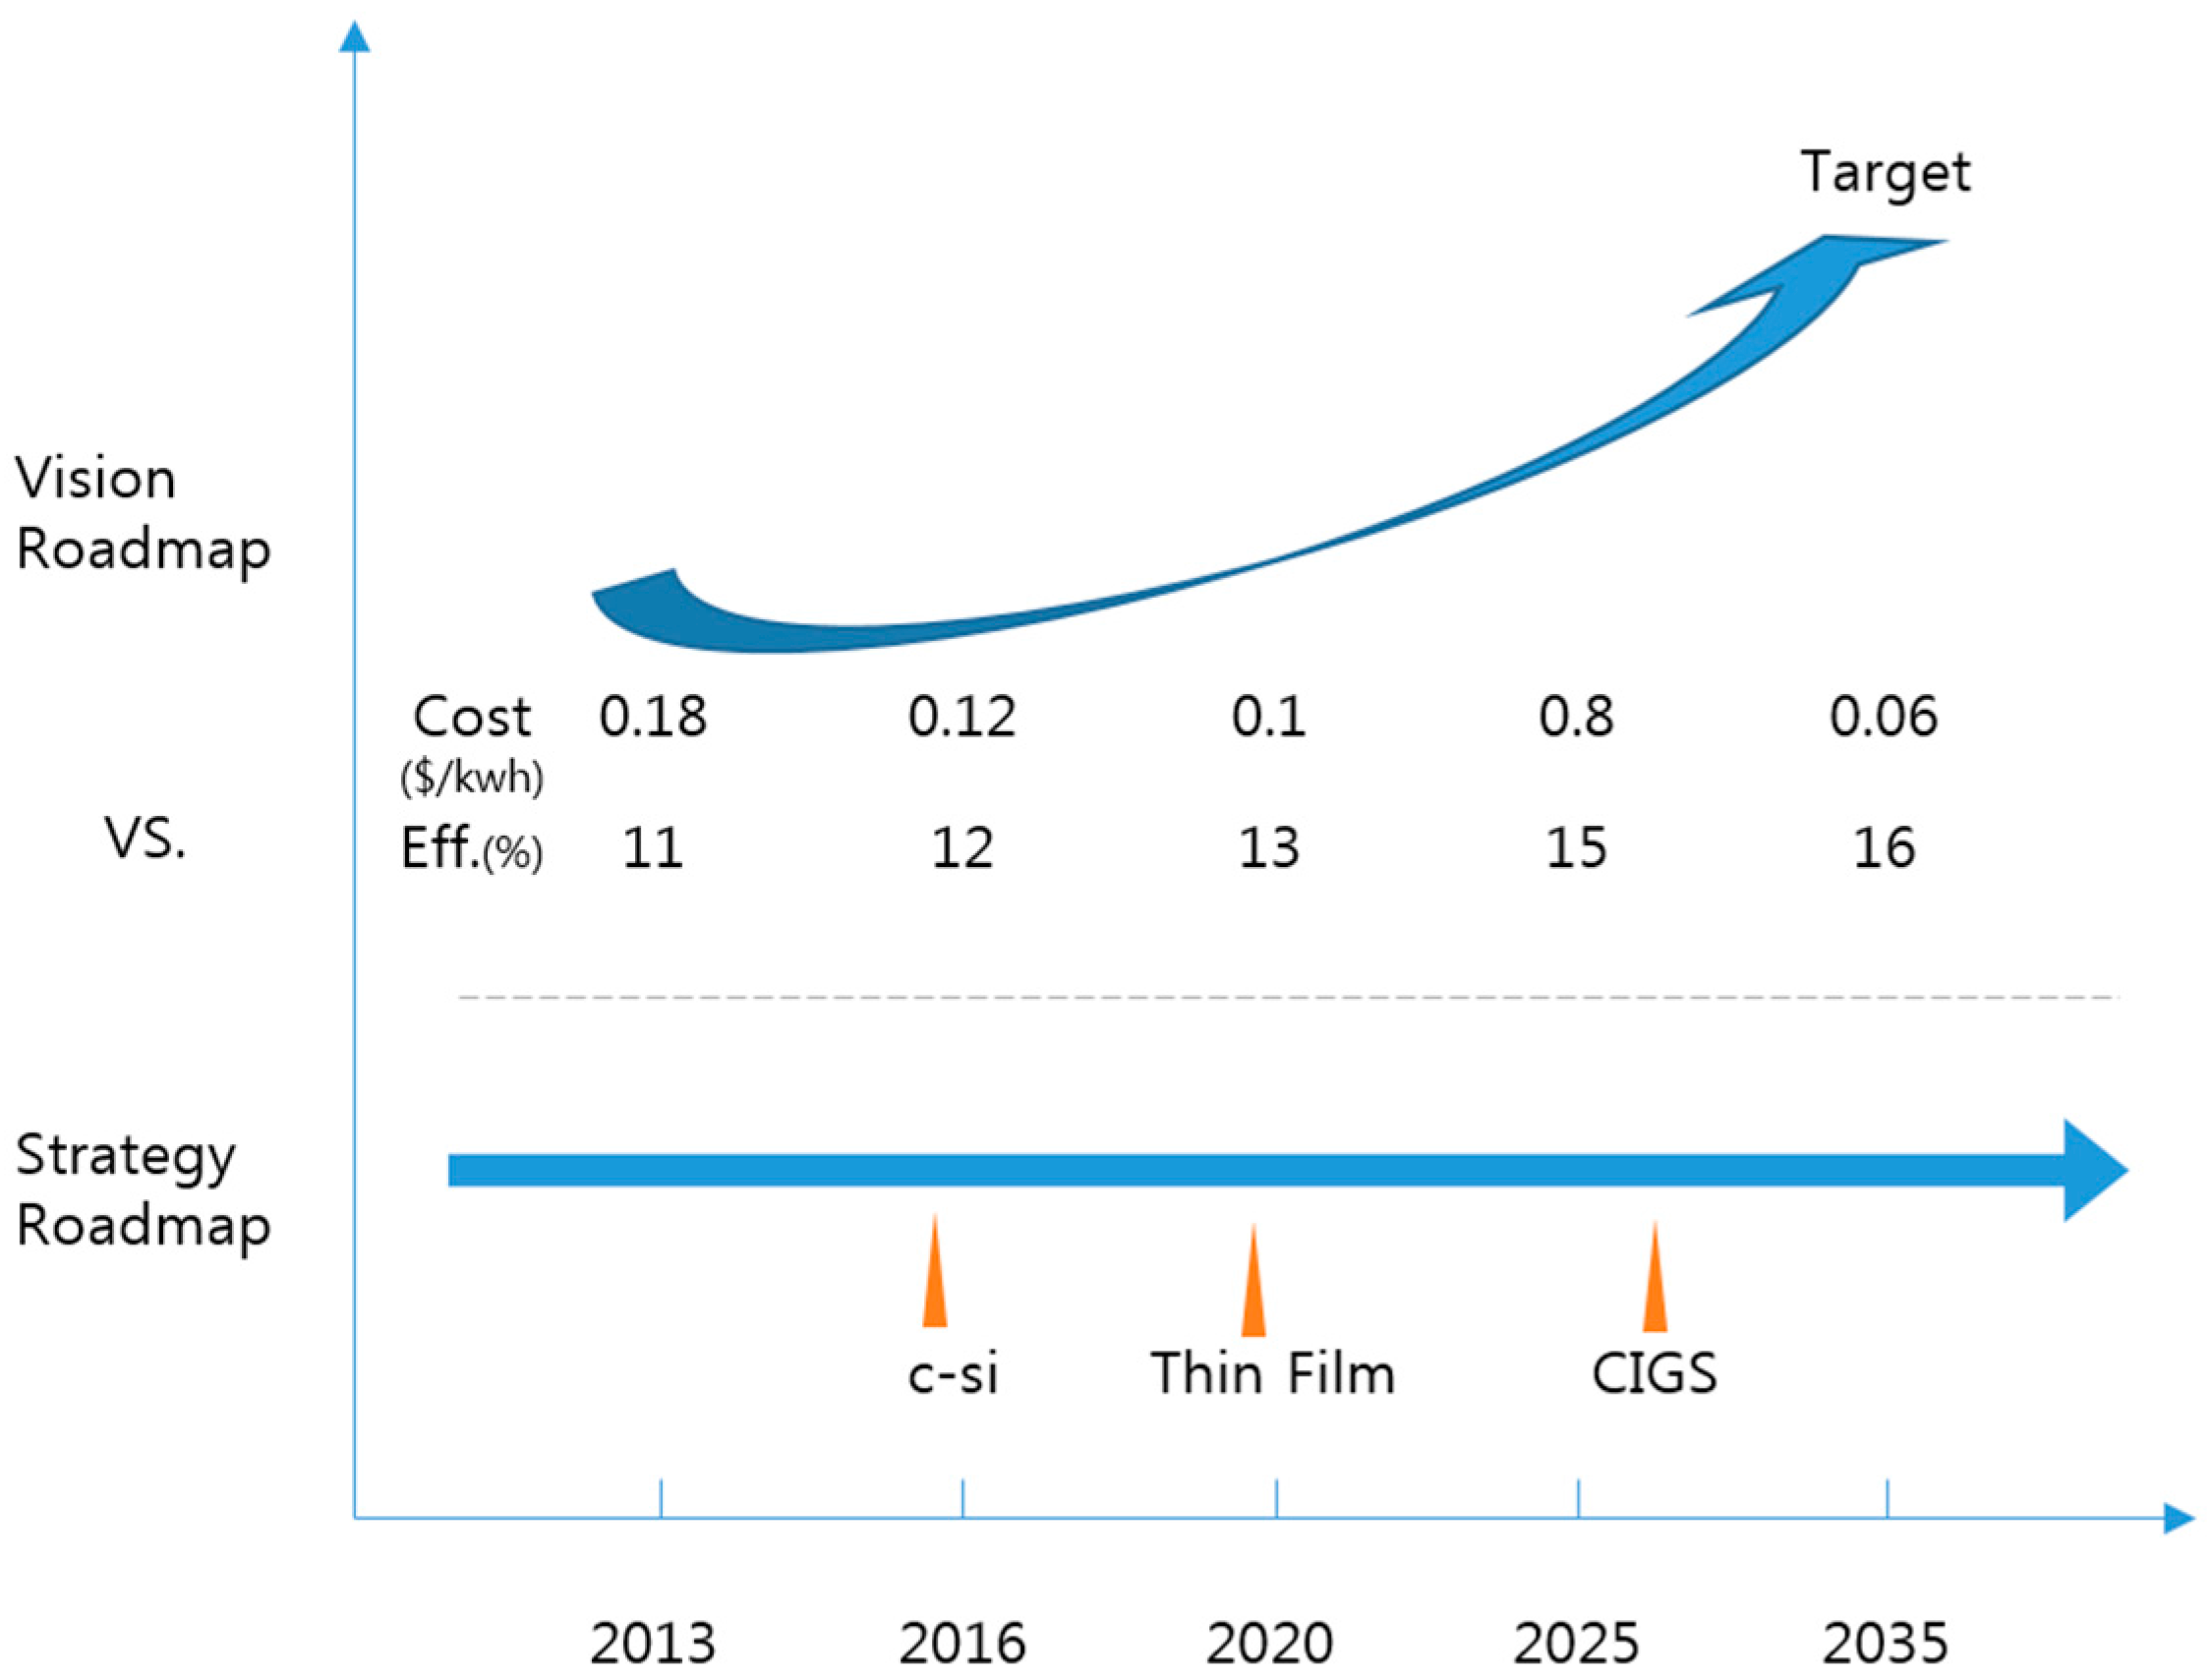
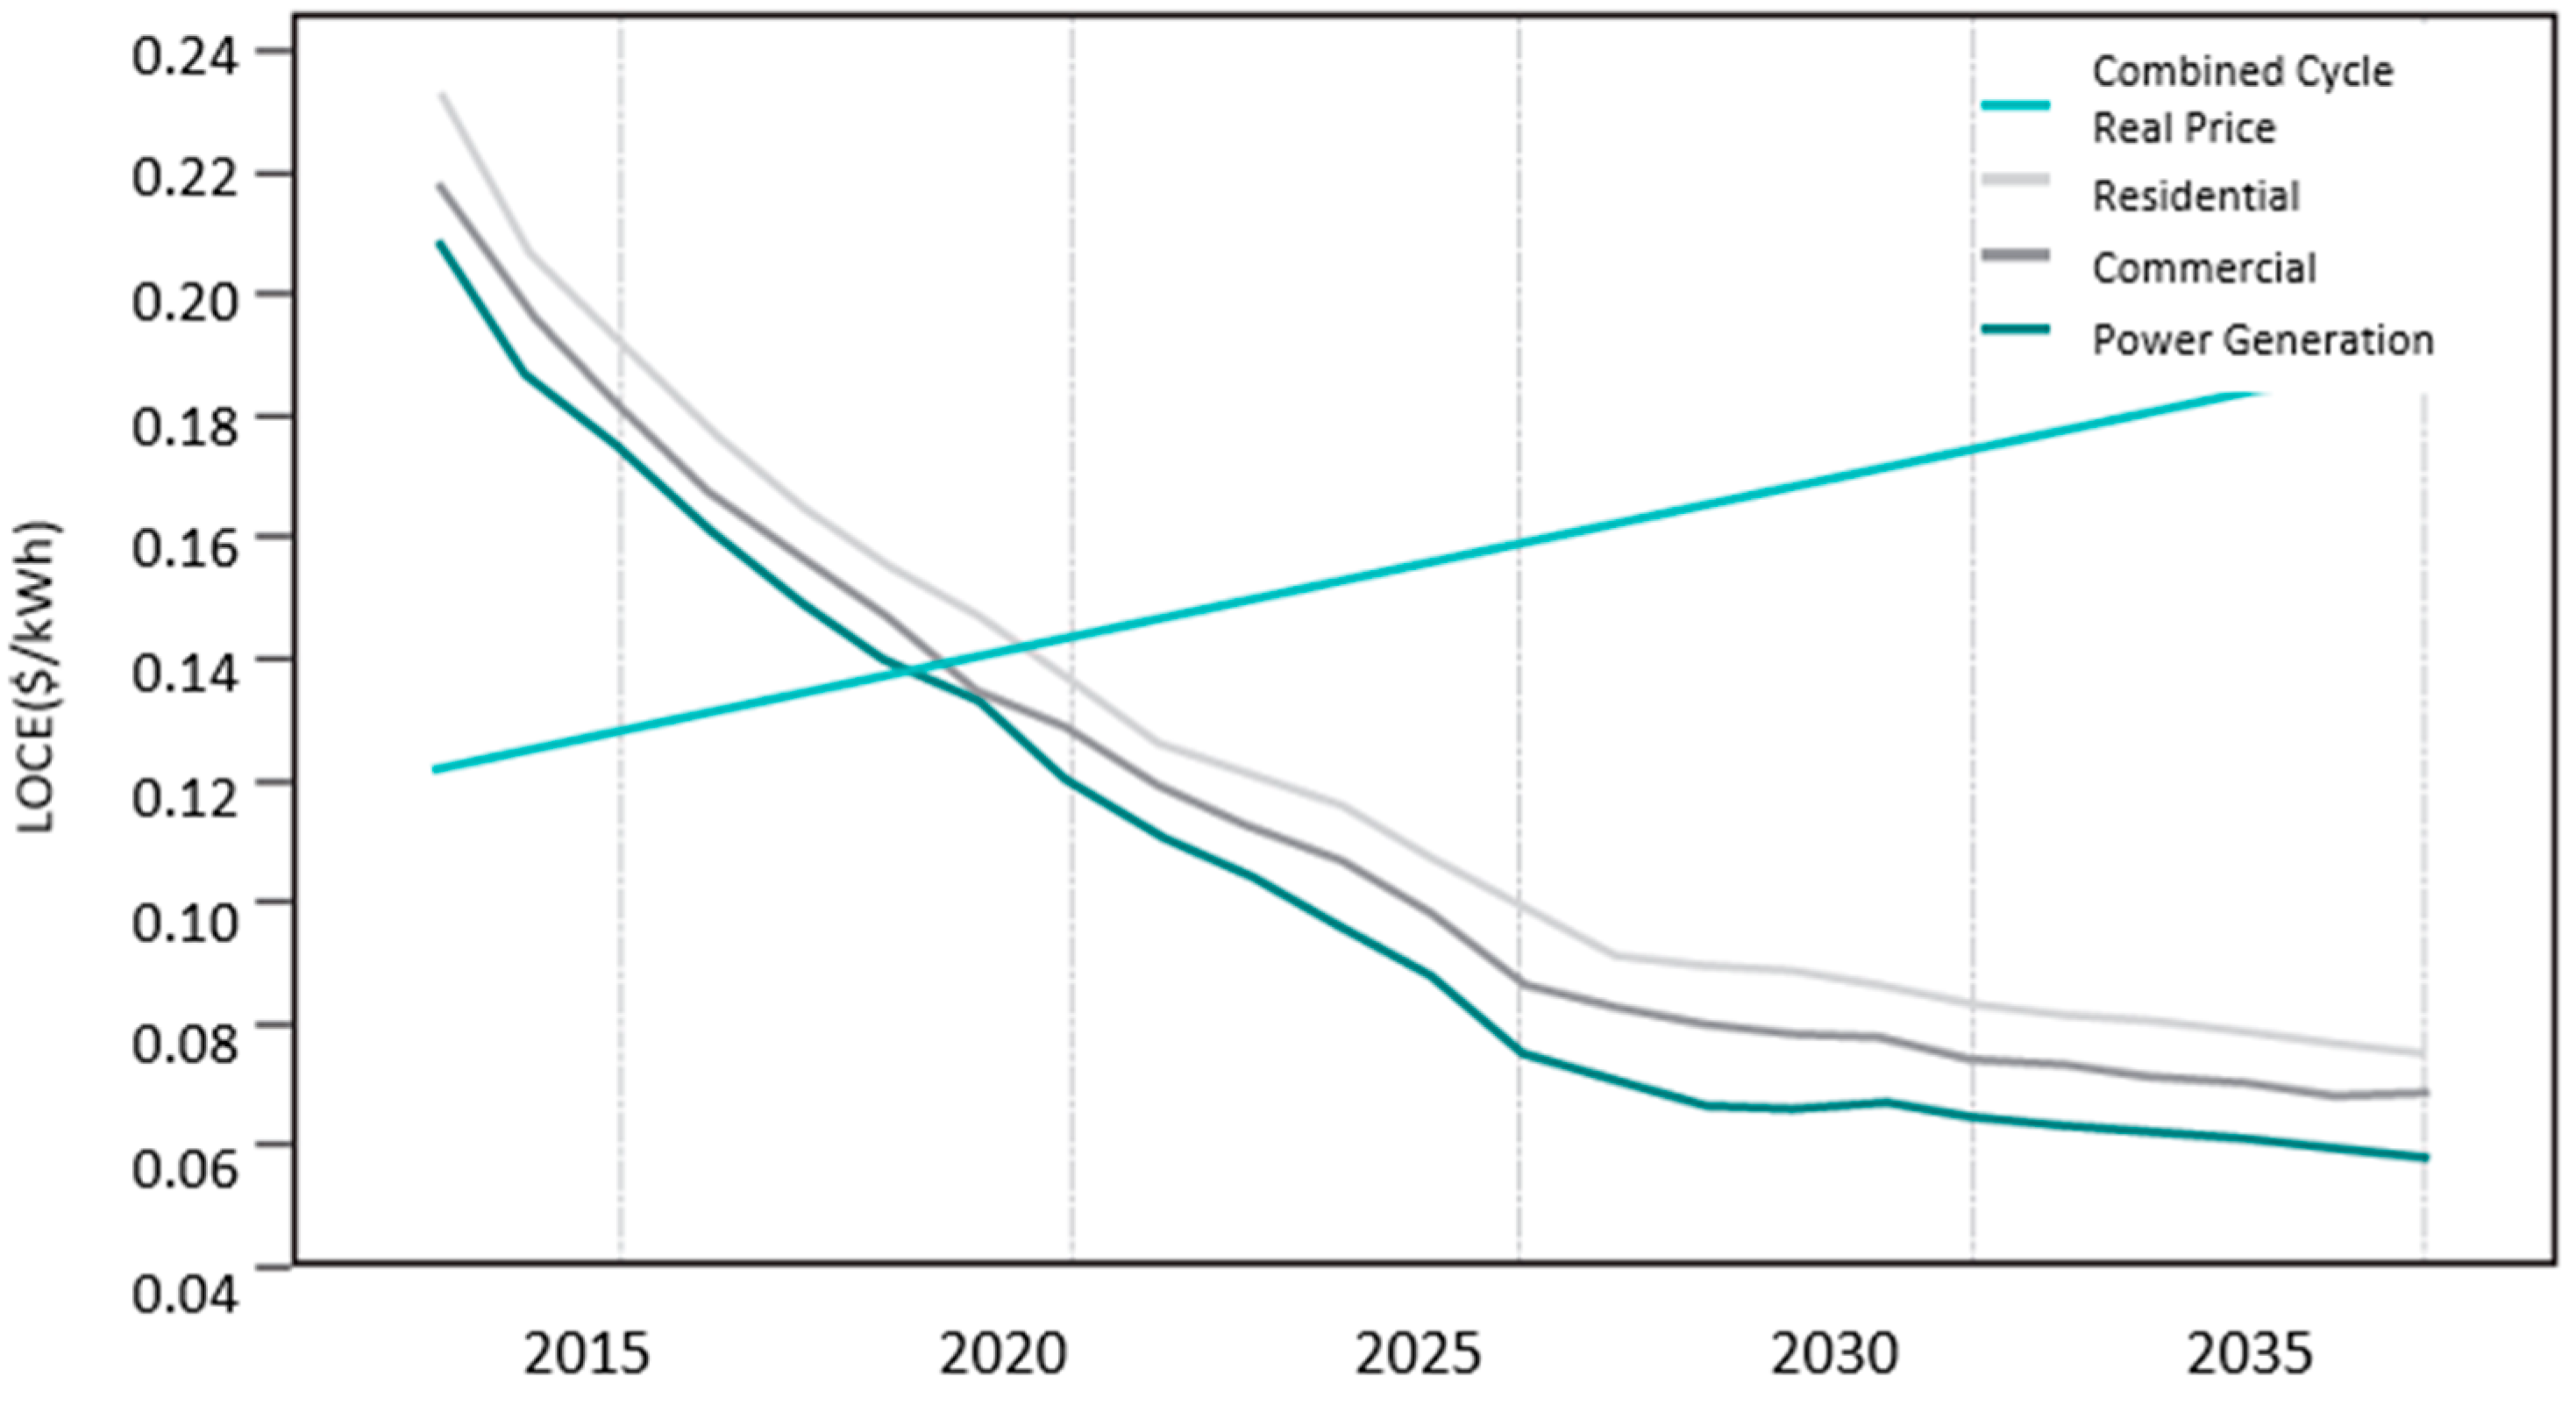
As shown in
Figure 3, although the actual price of combined cycle generation is expected to linearly increase based on historical combined cycle generation and domestic LNG prices, LCOE of the residential, commercial, and power generation technology is expected to gradually decrease when taking into consideration technological innovation and business model developments.
Figure 4 shows the solar PV generation model and power converter system (PCS) targets necessary to achieve the annual targets based on the predicted LCOE. These numbers will be used as important input data for the TIMES model.
In addition to the aforementioned LCOE and performance targets, the R&D strategy, market entry policies, and information on market size estimates necessary to achieve these targets ultimately become the components for the Energy Technology Vision Roadmap for solar PV technology.
Figure 5 shows the R&D strategy and market entry policies for solar PV technology, which can be reflected in various scenario developments within the model and thus influence energy systems model calculations.
4. Research Methodology
In order to analyze the impact in accordance with energy technology R&D targets, this paper utilized the TIMES model, which was developed as an energy systems analysis model by the International Energy Agency (IEA). The TIMES model is a bottom-up analysis model that can realize regional or national energy systems and analyze mid- to long-term economic, environmental, and social issues [
23]. The model is a partial equilibrium model consisting of a mathematical linear (non-linear) program and produces optimal solutions for providing energy services based on minimum costs for target energy systems. Therefore, the TIMES model can be defined through its objective function and constraint conditions. The objective function for the TIMES model is the total discounted costs of the system over the entire period prior to analysis, and the function is defined as follows [
20,
24]:
where:
NPV = the net present value of the total cost for all regions
ANNCOST(r,t) = the annual cost in region r for period t
NPER = the number of periods in the planning horizon
NYRS = the number of years in each period t
r = the number or regions
d = the general discount rate
Moreover, the TIMES model includes many constraint functions that define physical or logical relationships, which are prerequisites to illustrating energy systems. As an example of representative constraint conditions, it is necessary to satisfy reference energy service demands for every analysis interval that are given as exogenous variables. The installed capacity in the model is calculated after taking into consideration the initial capacity that has existed from previous period and has been operational until the relevant analysis period and the additional capacity through new investments from the previous period to the current period. The model utilizes all or only a portion of the equipment installed within the relevant analysis timeframe, and the availability factor (AF) of each technology is also taken into consideration. In addition, in the TIMES model, it is possible to realize various constraint conditions, such as the production of commodities, balance of consumption, realization of peak reservation rate for power generation, reflection of base-load and peak-load characteristics, and emissions restrictions with regards to pollutants such as CO2, to simulate a more realistic energy system for each time slice. Besides, the balance between the supply and the demand will be optimized in the TIMES model since it covers from energy supply to final demand and analyzes the mutual interactions among the technologies in a whole system.
The TIMES model provides a combination of technologies and commodities that satisfies these various constraint conditions while minimizing total systems costs. Therefore, with regards to the six fields of technology, such as solar PV, wind energy, coal power, natural gas combined cycle (NGCC) and integrated gasification combined cycle (IGCC), proposed in the Energy Technology Vision Roadmap, the time series of the supply capacity and the electricity generated for each technology in accordance with changes in technological specifications, such as the efficiency and costs when achieving R&D targets, can be analyzed, and as a result, the changes in energy consumption and CO2 emissions can be analyzed as well. However, there is a high possibility that the technology mix created through the optimization methodology for the four technological fields proposed in the Green Energy Strategy Roadmap—CCS, energy-saving houses and buildings, and green cars—will not be able to accurately reflect reality. The reason is because, in the case of CCS technology, there is almost no possibility that the technology will be marketed and commercialized for economic reasons if carbon tax or CO2 emissions restriction policies are not implemented. Moreover, for technological fields involving buildings or automobiles, when users select their products, they are influenced not only by economic factors, but also by the consumer’s level of income, safety, convenience, design, and other various factors.
Therefore, with regards to the four technological fields—CCS, energy-saving houses and buildings, and green cars—the supply capacity is defined by inputting deployment targets defined in the Green Energy Strategy Roadmap, and accordingly, the energy consumption and CO2 emission changes can then be analyzed by the TIMES model.
The base year for the model is 2011, and analysis has been carried out in 2-year intervals to 2015 and 5-year intervals after until 2050. The scope of the model is whole national energy system. However, the modelling based on detail technology data was conducted only for the electricity generation, residential, commercial and transportation sectors considering the research area in Energy Technology Vision Roadmap. The Reference Energy Systems (RES) in the model was set based on the 2011 Energy Balance Table from the Energy Statistical Yearbook [
25] and through utilization of the Energy Consumption Survey 2011 [
26], Korea Electric Power Statistics 2012 [
27], Renewable Energy Supply Statistics 2011 [
28], and the Mass Energy Supply Manual 2012 [
29]. After the base year, energy consumption estimates to 2050 were defined based on the BAU scenario for the 2nd Energy Master Plan [
30]. The energy price per year was set by applying the annual average growth rate for the prices [
31] for each energy source for each time period as proposed in the EIA’s Annual Energy Outlook to the domestic energy prices listed in the 2011 Energy Statistical Yearbook. The CO
2 emissions factor was defined in accordance with the IPCC guidelines, and a discount rate of 5.5% and a KRW-USD currency exchange rate of KRW 1151.8/USD 1, which was the average exchange rate in 2011, were used. The efficiency of technologies was estimated on the basis of the lower heating value (LHV).
5. Scenarios and Data
The Energy Technology Vision Roadmap provides R&D targets based on two scenarios: “maintaining current R&D levels” and “strengthening R&D”. The strengthening R&D scenario assumes that the new innovative technologies were introduced since the costs were reduced by more aggressive R&D investments. However, the R&D targets proposed in the “maintaining current R&D levels” scenario were only used to define the technological characteristics because it is consistent with the Green Energy Strategy Roadmap. Some technologies provided in the Green Energy Strategy Roadmap were also included in this research scope and it could be assumed that R&D targets of those technologies have already been reflected in the “maintaining current R&D levels” scenario because the Green Energy Strategy Roadmap was published two years earlier than the Energy Technology Vision Roadmap.
Although the Green Energy Strategy Roadmap proposes performance targets based on R&D for each technology, the information they provide are not sufficient to be used as input data in the TIMES model. Therefore, this paper collaborated with the expert panel that had participated in the drafting of the Green Energy Strategy Roadmap in order to obtain input data for the TIMES model. The obtained characteristics per technology are listed in
Table 1,
Table 2,
Table 3 and
Table 4.
6. Analysis Results
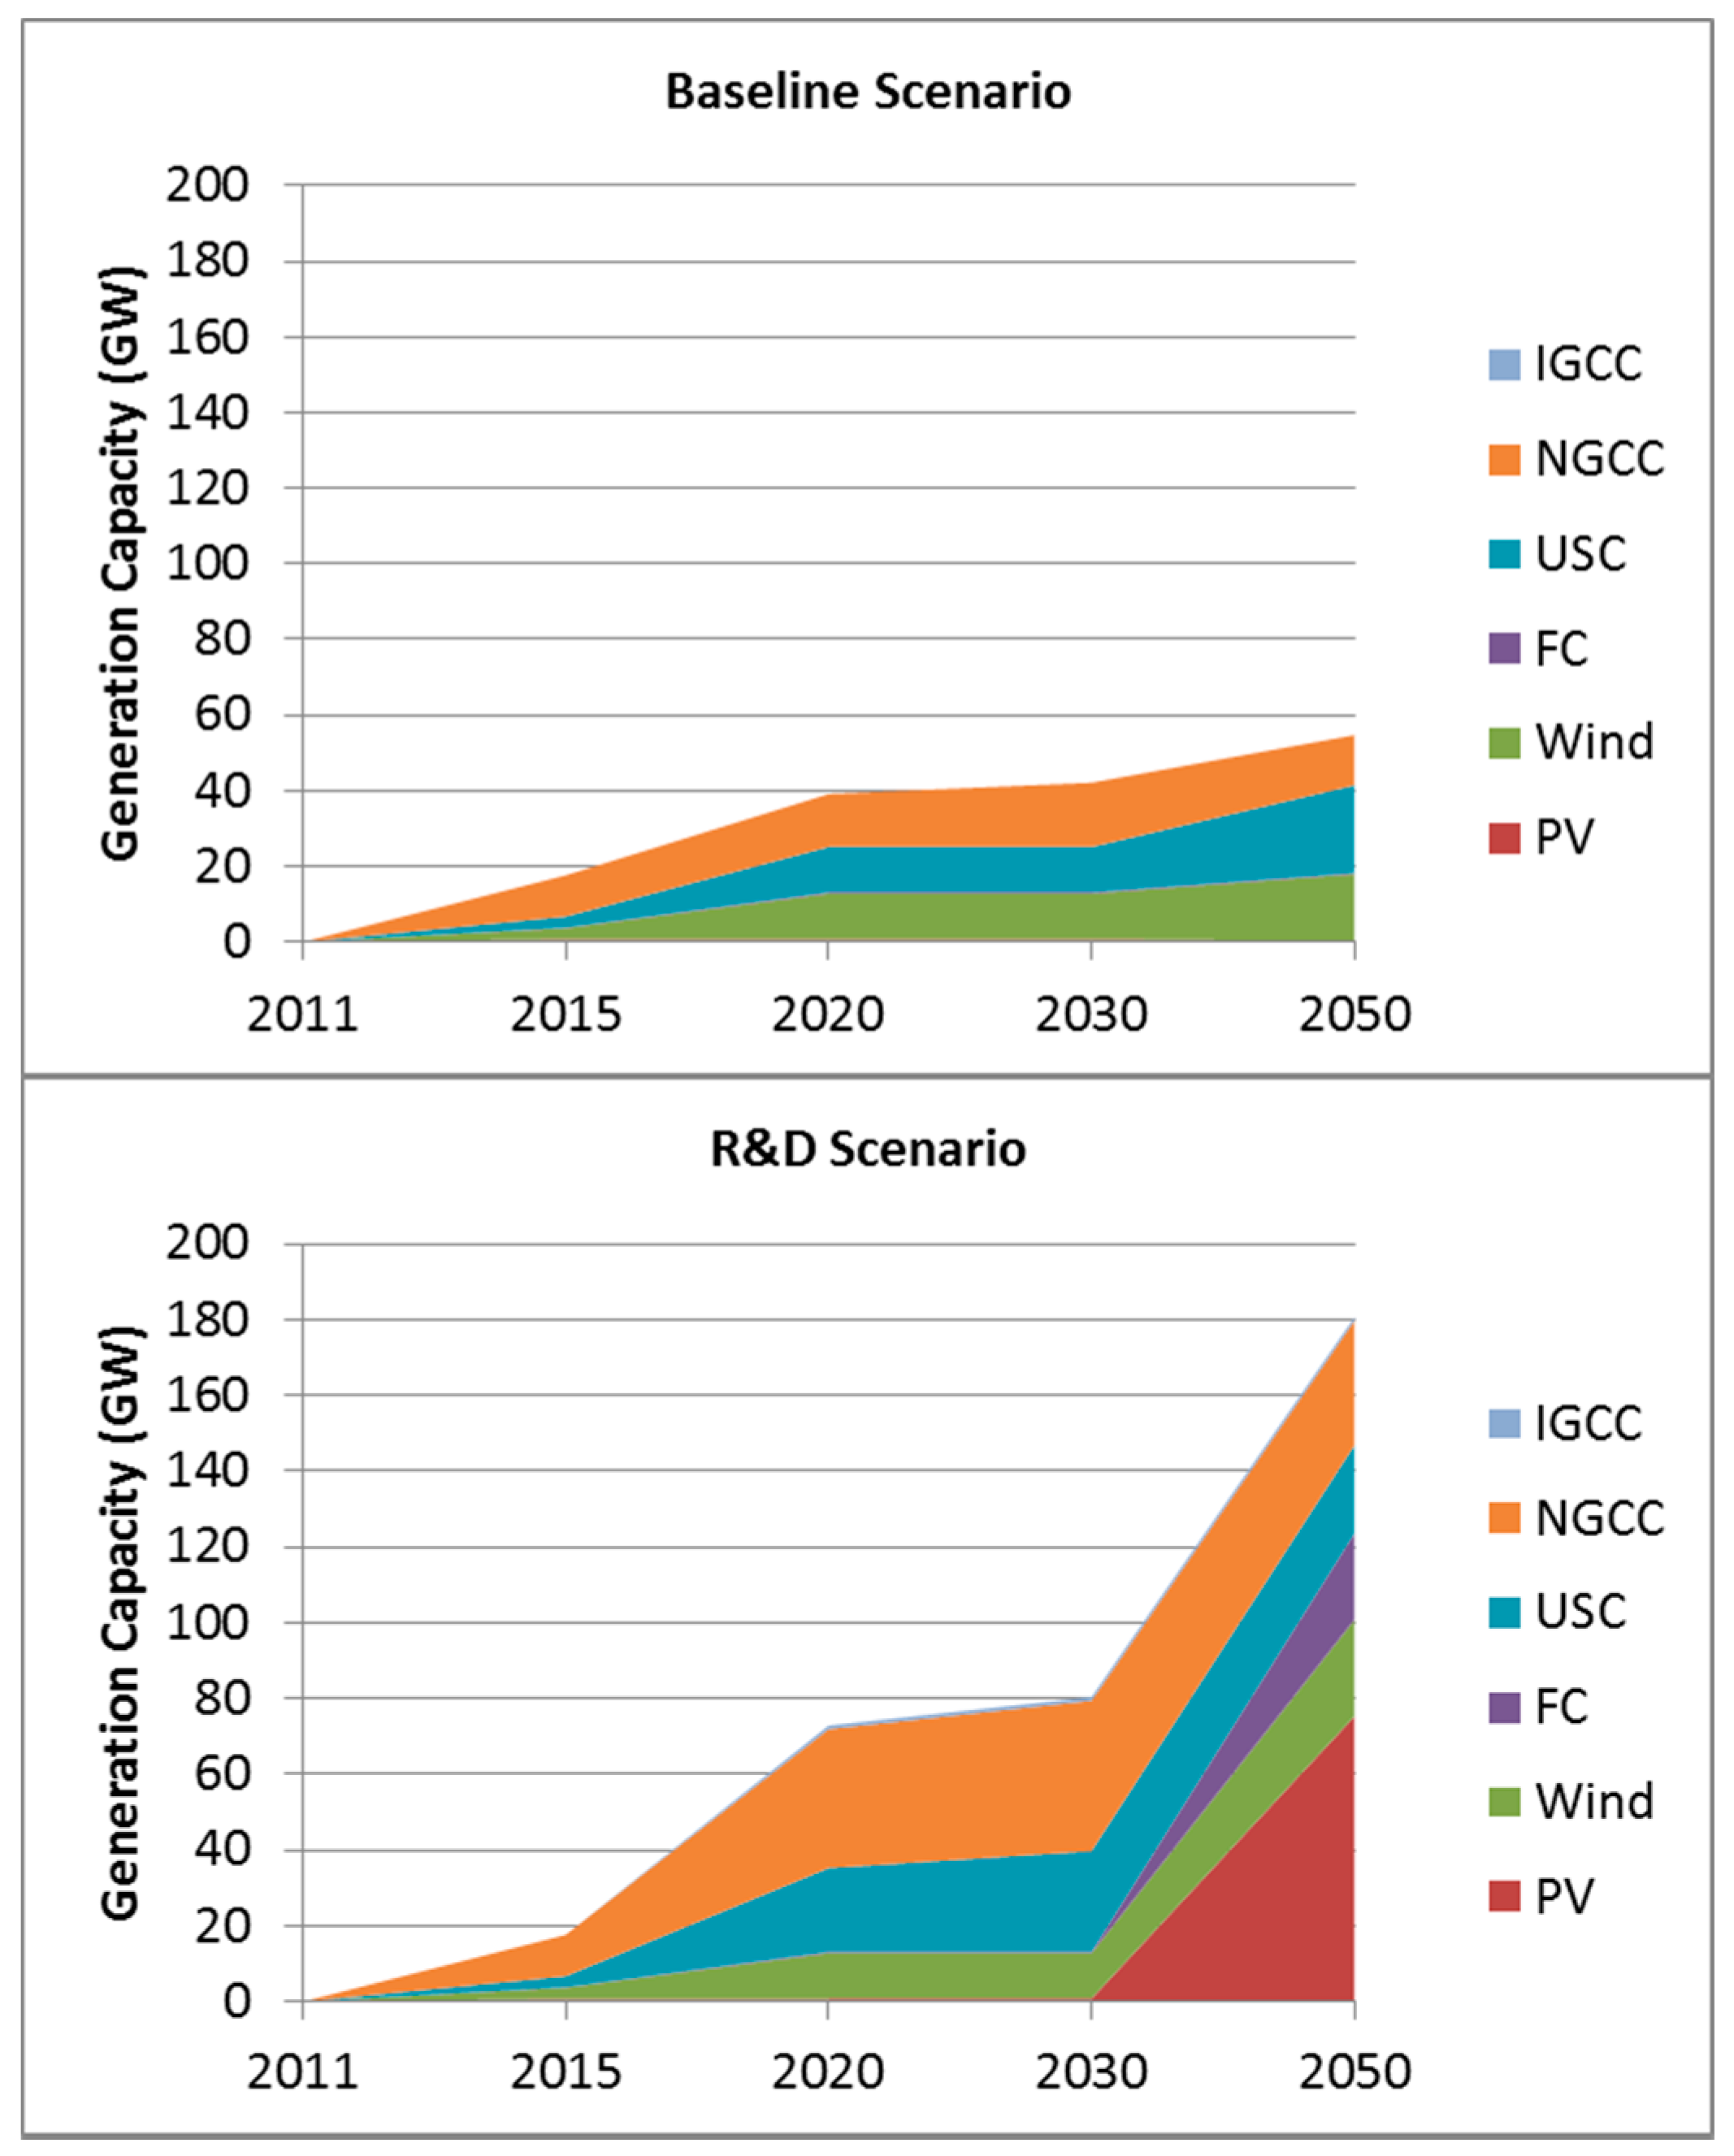
In this research, although the supply capacity of the four technological fields—CCS, energy-saving houses and buildings, and green cars—were directly input into model as based on expert opinions, the supply capacity of the six technological fields, including solar PV, wind energy, and IGCC, were derived in accordance with the optimization methodology. Therefore, there would be a need to compare supply prospects in the case of improvements in technological characteristics between two scenarios. In this research, the sustainment of 2013 levels of technology was set as the baseline scenario, and the improvement in technology level was set as the R&D scenario.
Figure 6 and
Figure 7 show a comparison of the supply estimates for the six technologies assuming the baseline and R&D scenarios. In the scenario where 2013 technology levels are maintained, analysis has shown that wind, ultra-supercritical coal (USC), and NGCC were the technologies for which generation capacity would be expanded as a result of securing economic feasibility in comparison to existing generation technologies.
However, due to technological performance improvements as a result of R&D investments, PV and wind are expected to rapidly expand in supply and secure price competitiveness starting in 2030. Accordingly, although the 2050 supply capacity for the six generation technologies were expected to be at the 55 GW level under the baseline scenario, under the R&D scenario, it is expected to increase by approximately 3.3 times in comparison to the baseline scenario, to 181 GW as shown in
Figure 6. Especially among the six generation technologies, power generation from solar PVs, which is responsible for 39% of total power generation, has been analyzed to serve the most critical role among the power supplied by new technologies in 2050. However, for IGCC technologies, even in the case where R&D targets are achieved, our analysis has shown that it will not be able to secure price competitiveness in comparison to existing technologies.
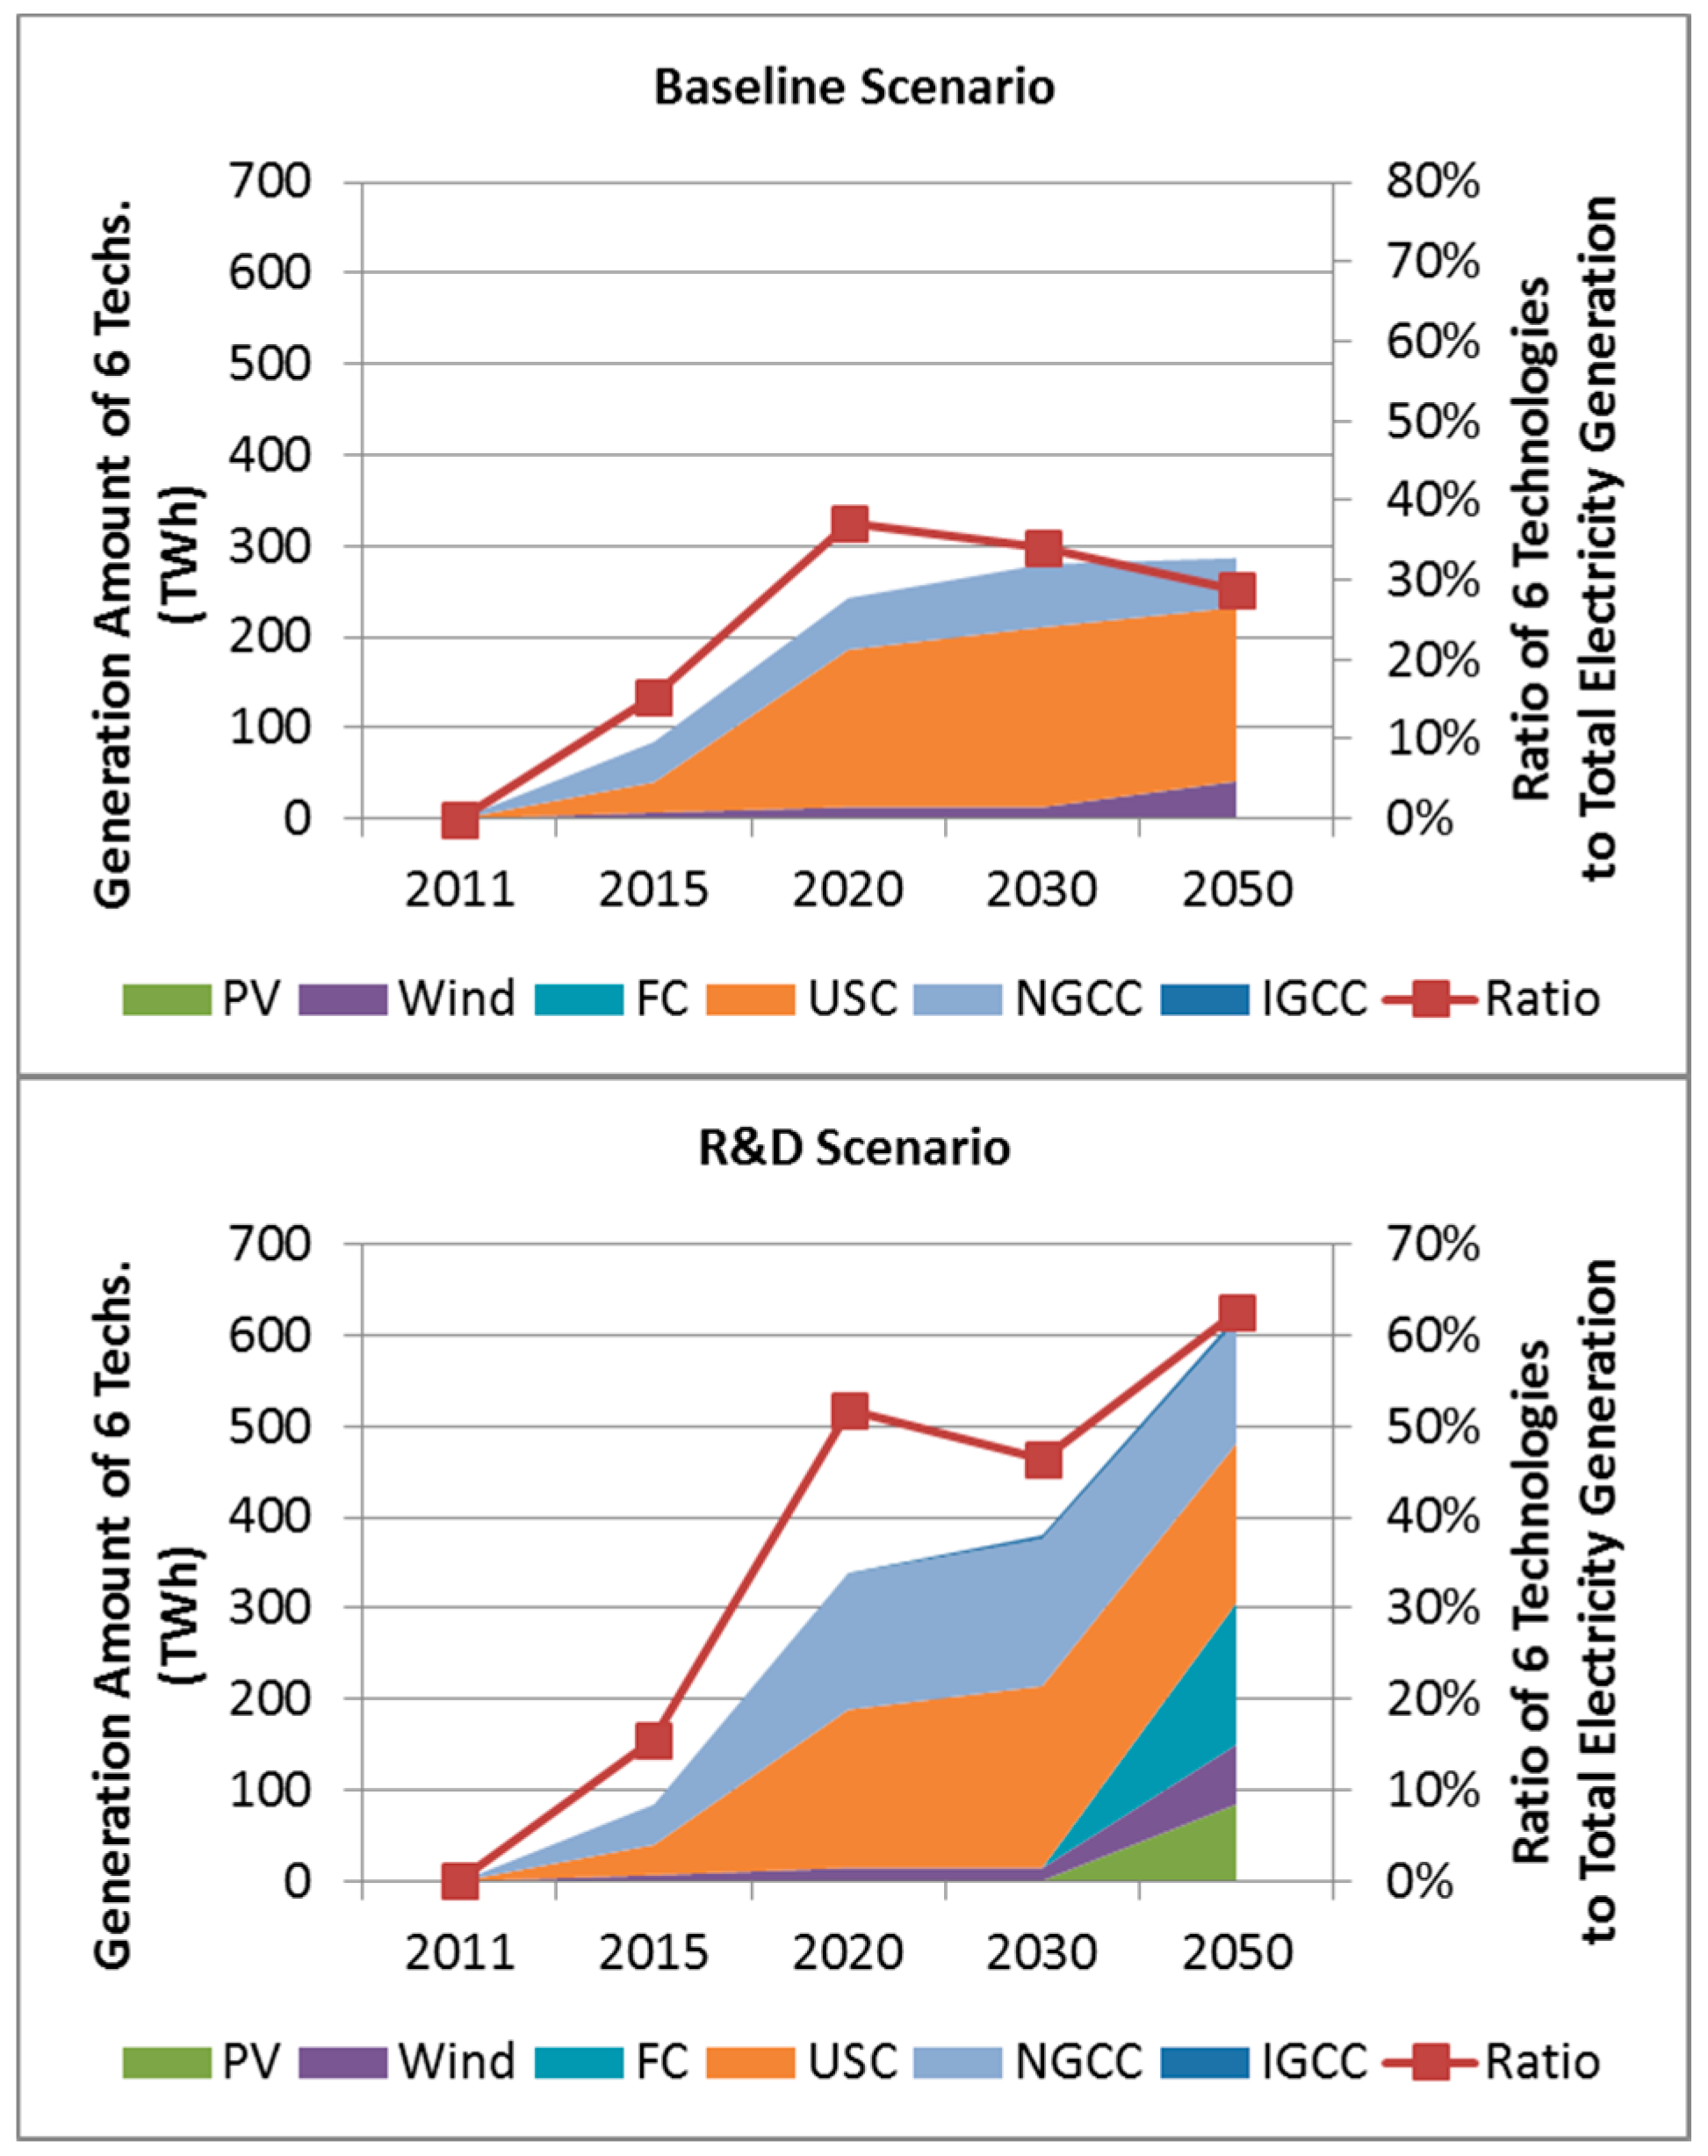
Similar to the supply capacity case, under the baseline scenario, only wind, USC, and NGCC are expected increase in generation capacity, and because the utilization rate of USC is high, its contribution proportion to generation capacity has shown to be the highest. Under the R&D scenario, due to the expected increase in generation amount for PV and wind technology starting in 2030 as well as the significant jump in generation amount for NGCC technology, the generation amount of the six generation technologies is expected to increase by approximately 2.17 times the baseline numbers.
Figure 7 shows that the proportion of the power generated from the six generation technologies in comparison to the total generation amount is expected to dramatically increase by 29% and 62% in comparison to the 2050 baseline scenario and the R&D scenario, respectively. For PV, because its availability factor is low, the proportion of the generation amount in comparison to the 6 technologies is around 13.6%, which is low in comparison to its supply capacity.
As such, depending on the R&D investment, the supply of renewable technologies, such as PV and wind, and high-efficiency generation technologies, such as USC, NGCC, IGCC, and fuel cells, will dramatically increase.
Table 5 shows the changes of the primary energy supply from the increase of renewable energy supply as well as the deployment of CCS, energy-saving houses and buildings, and green car technologies. As a result of R&D on the 11 main energy technologies, nuclear and fossil energy supplies are expected to decrease from 336 million TOE (Tonne of Oil Equivalent) to 274 million TOE by 2050, and the supply of renewable energy is expected to increase from 21 million TOE to 41 million TOE, which is a 20 million TOE increase.
With regards to power generation, because the savings effect from household and commercial electricity demands resulting from the supply of energy-saving buildings (7.3% and 19.2% by 2030 and 2050) is relatively greater than the increase in electric power demand in the field of transportation due to the spread of plug-in hybrid electric vehicles (PHEVs) and electric vehicle (EVs ) (0.7% and 3.8% by 2030 and 2050, respectively), the demand in electric power is expected to decrease by 6.6% and 12.9% by 2030 and 2050, respectively, under the R&D scenario in comparison to the baseline scenario. More details on the electricity demand are shown in
Table 6.
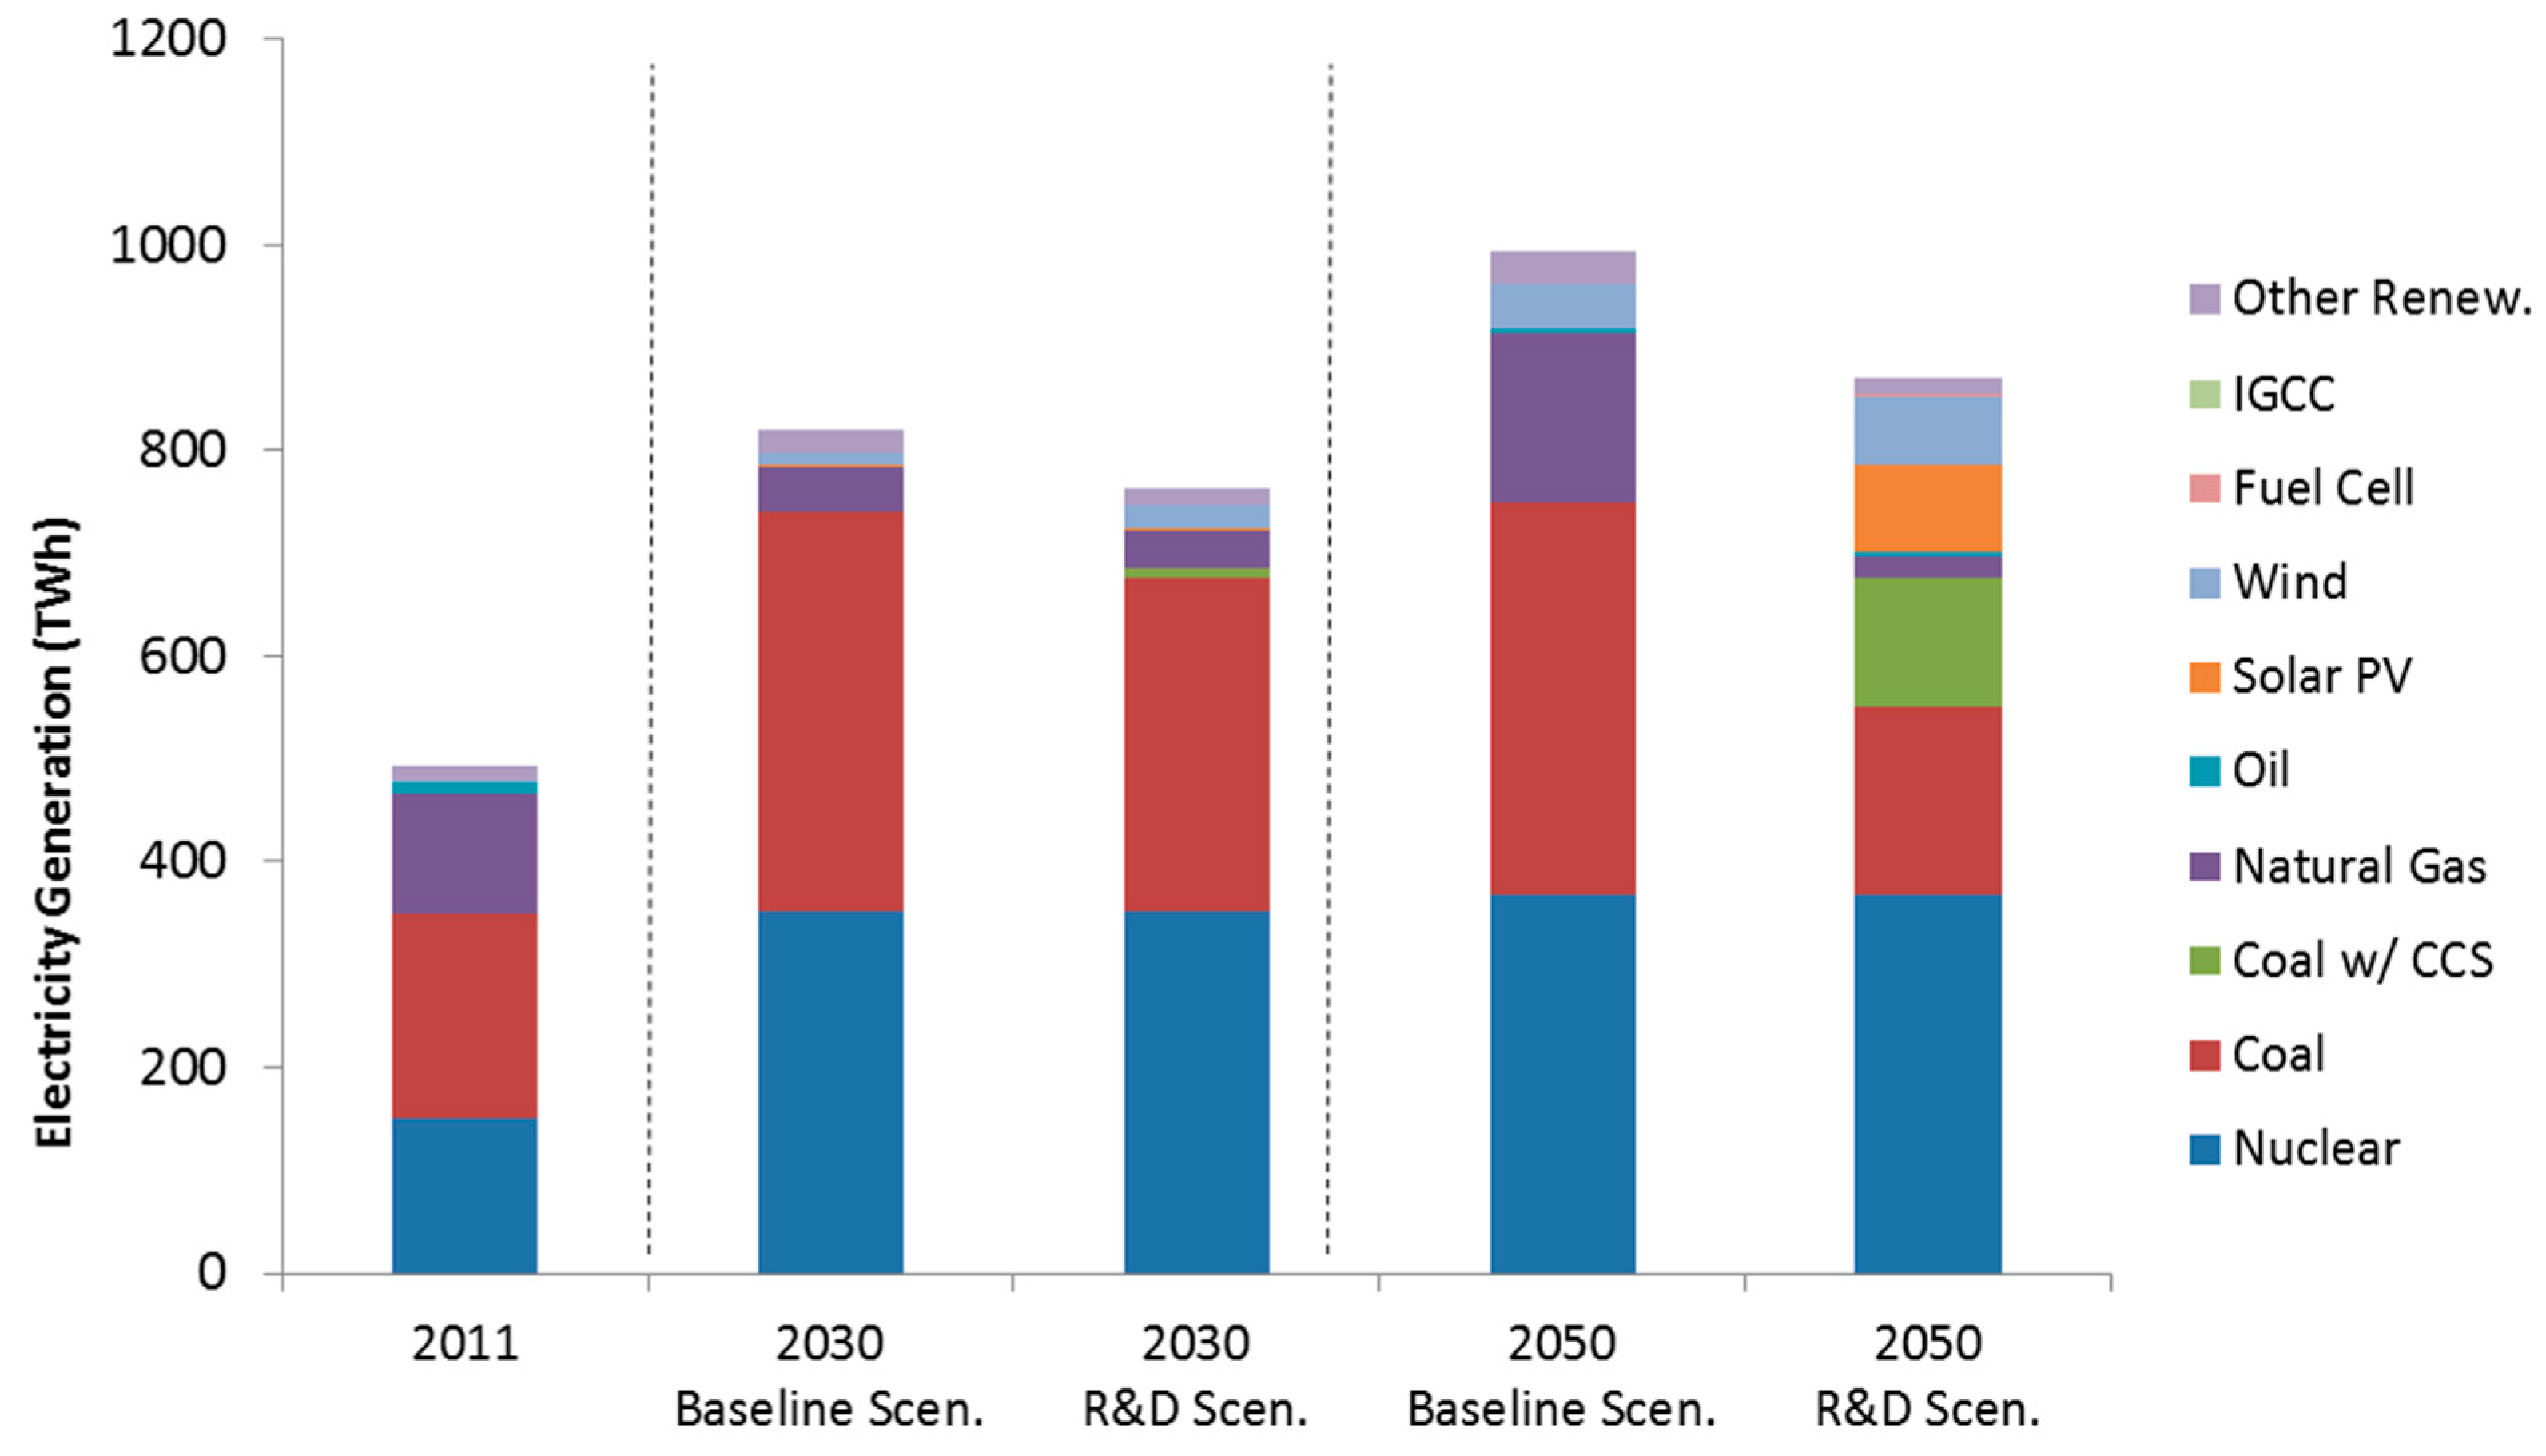
Figure 8 shows the power generation mix for the baseline scenario and the R&D scenario. The percentage of renewable energy and new energy generation, such as fuel cells and IGCC, are forecasted to increase by 3.0% by 2011, 5.3%, by 2030, and 19.4% by 2050. Comprehensive analysis has shown that the reason for the decrease in the proportion of power generation from renewable energy in comparison to the energy supply forecast is due to the decrease in power demand in the area of final energy consumption.
As for final energy consumption,
Table 7 shows that there are no differences between the baseline scenario and the R&D scenario with regards to the industrial and public sectors, which are not relevant to the technological subjects for the aforementioned analysis. However, as for the effect of the provision of energy-saving buildings on household and commercial fields, energy consumption savings of 4.9% by 2020, 16.6% by 2030, and 38.1% by 2050 are expected to be achieved, and similar savings of 0.5% by 2020, 5.2% by 2030, and 22.8% by 2050 are likely to be possible in the field of transportation following the supply of green cars. Hence, total final energy consumption by 2050 is forecasted to be around 225 million TOE assuming the baseline scenario, and with energy technology R&D, 13.7% can be saved, which will reduce the consumption amount to 194 million TOE.
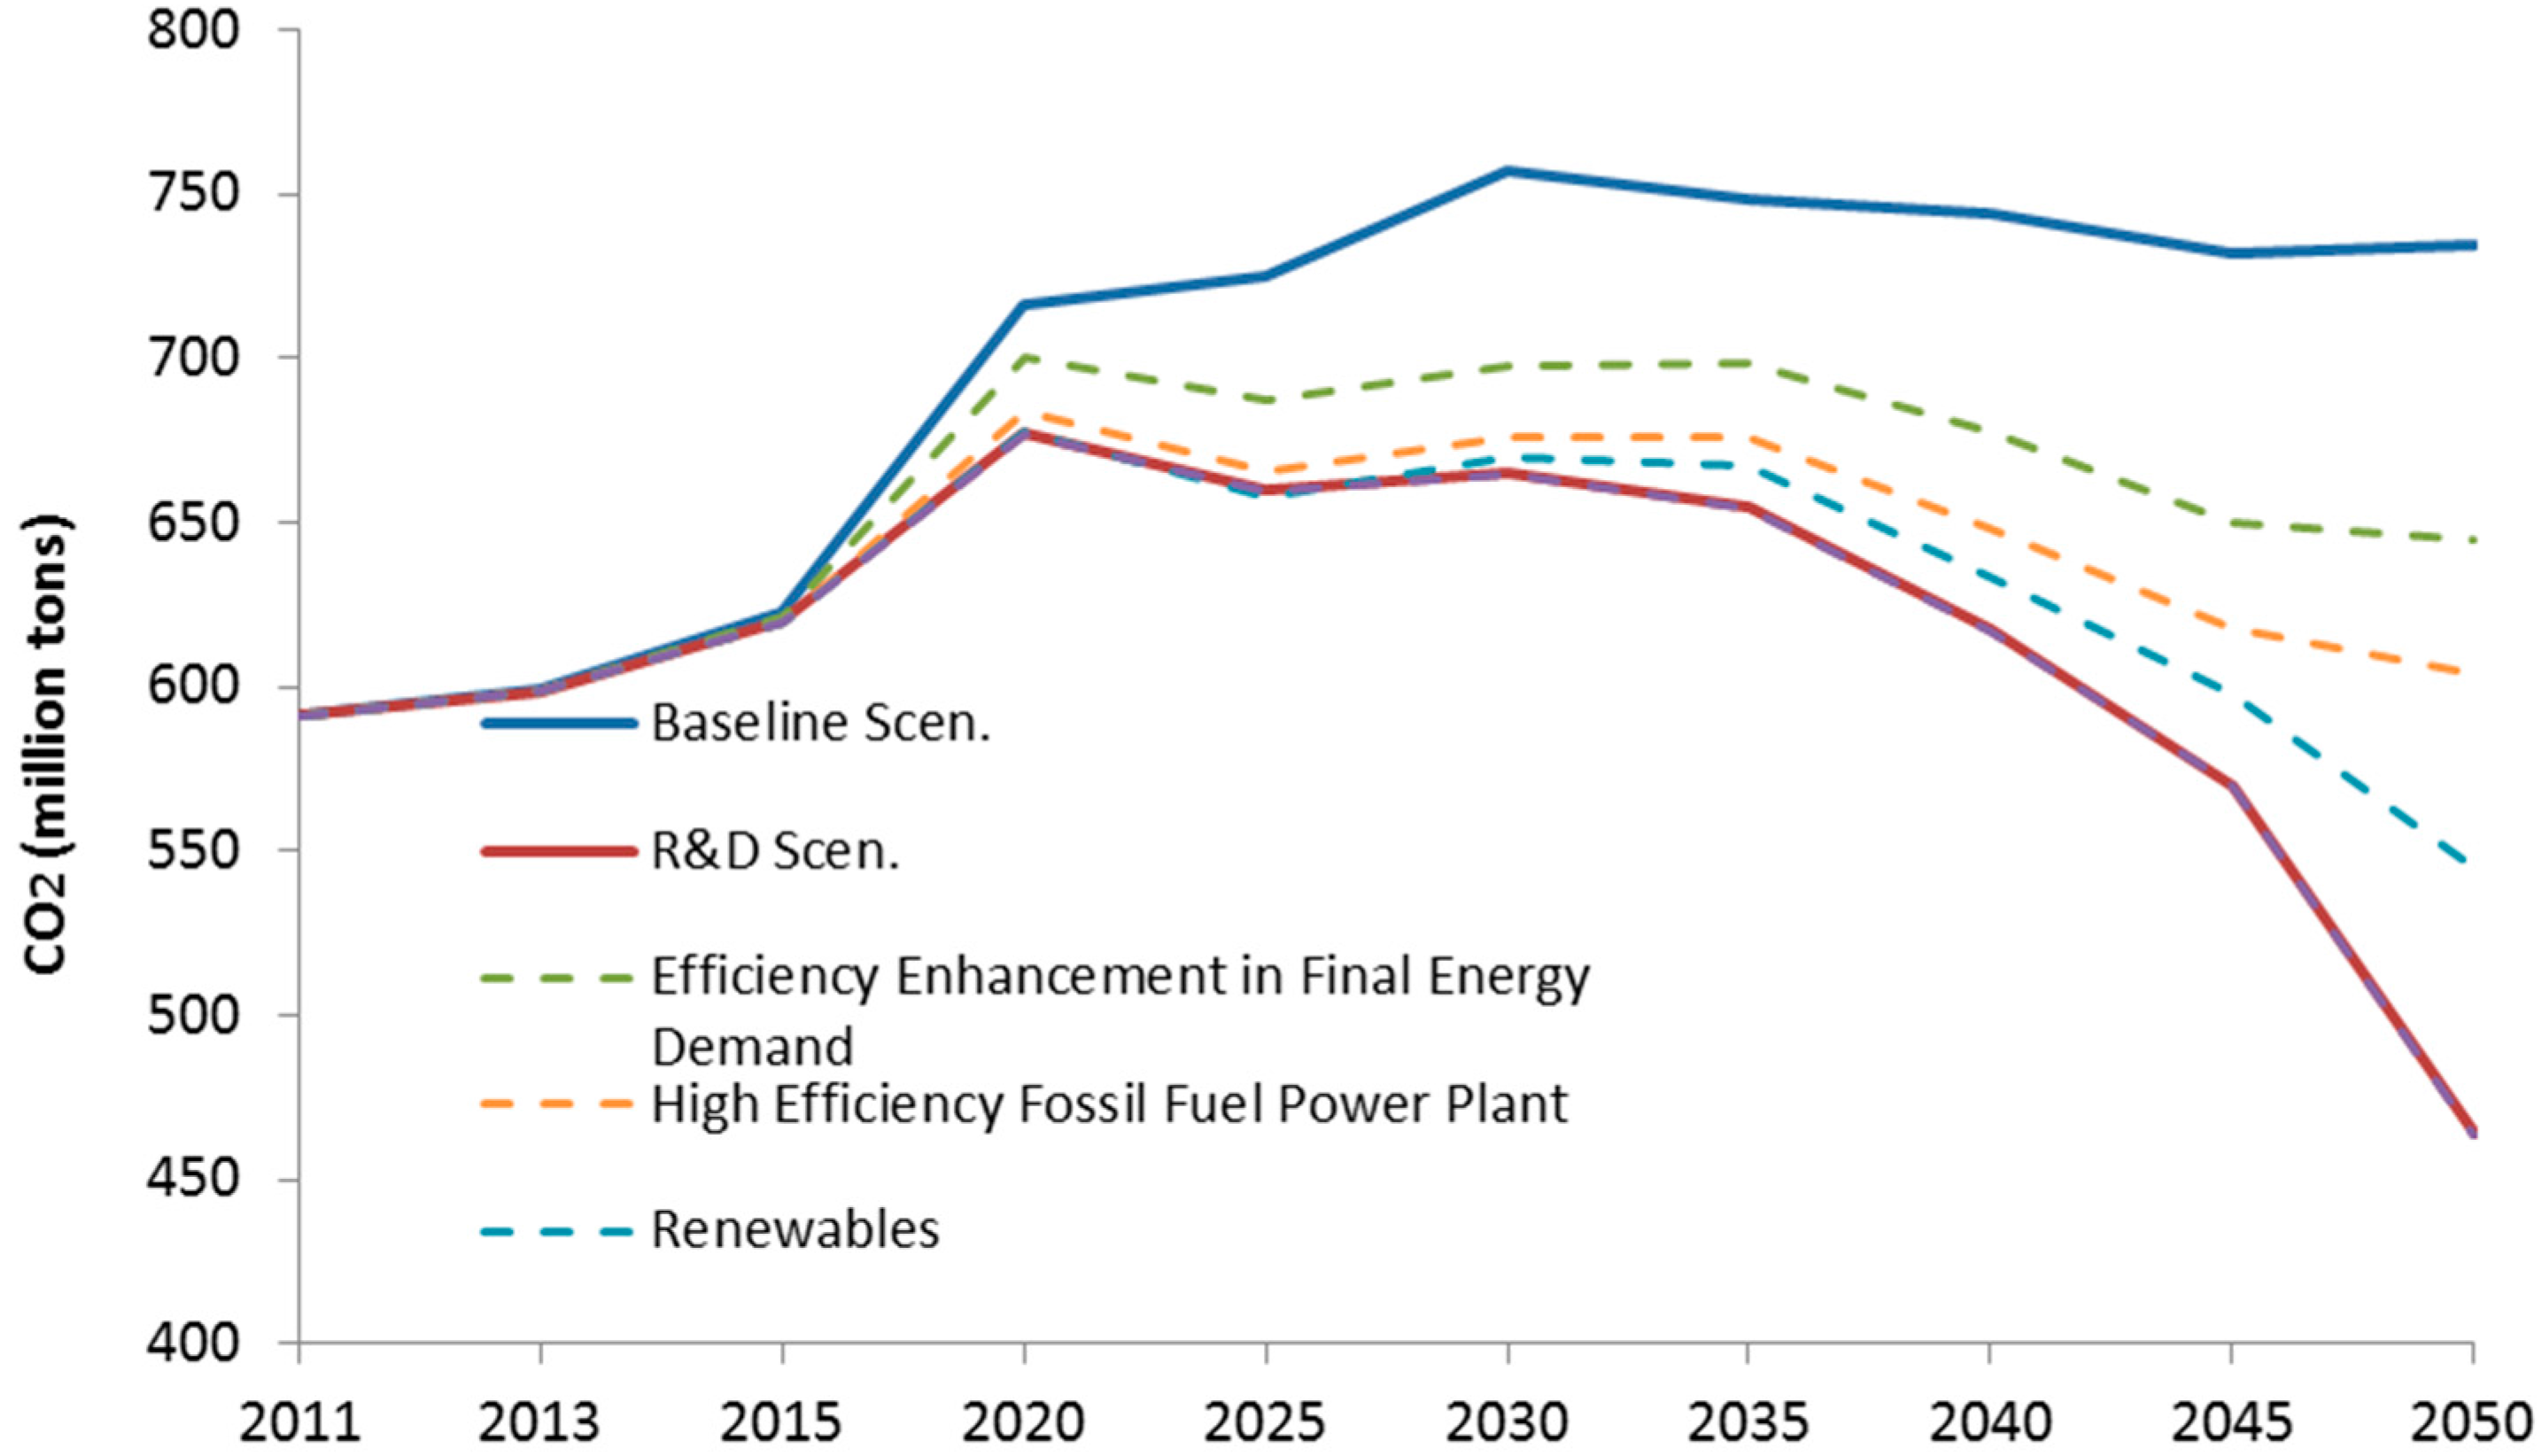
From a CO
2 emissions perspective, first, the CO
2 emissions amount due to energy combustion in 2011 was 237 million tons resulting from power generation and 591 million tons from the entire energy systems. Although the baseline scenario predicted that emissions would increase until 2030 and then maintain those levels, analysis has shown that it may be possible to restrain increases after 2020 and gradually reduce emissions thereafter due to R&D investments in energy technology as shown in
Figure 9. As a result, CO
2 emissions for the R&D scenario is expected to decrease by 12.2% and 36.9% in 2030 and 2050, respectively, in comparison to the baseline scenario, which is a 21.7% decrease in comparison to 2011 levels. When analyzing such reduction rates for each technology group separately, throughout the entire analysis period, energy-saving houses and green cars have been the highest contributors to efficiency enhancement technology from the demand side. Moreover, efficiency enhancement for fossil fuel generation technology and CO
2 reduction contributions for CCS and renewable energy technology are expected to show the greatest growth in the mid-term (by 2030) and long-term (2040 and after) futures, respectively.
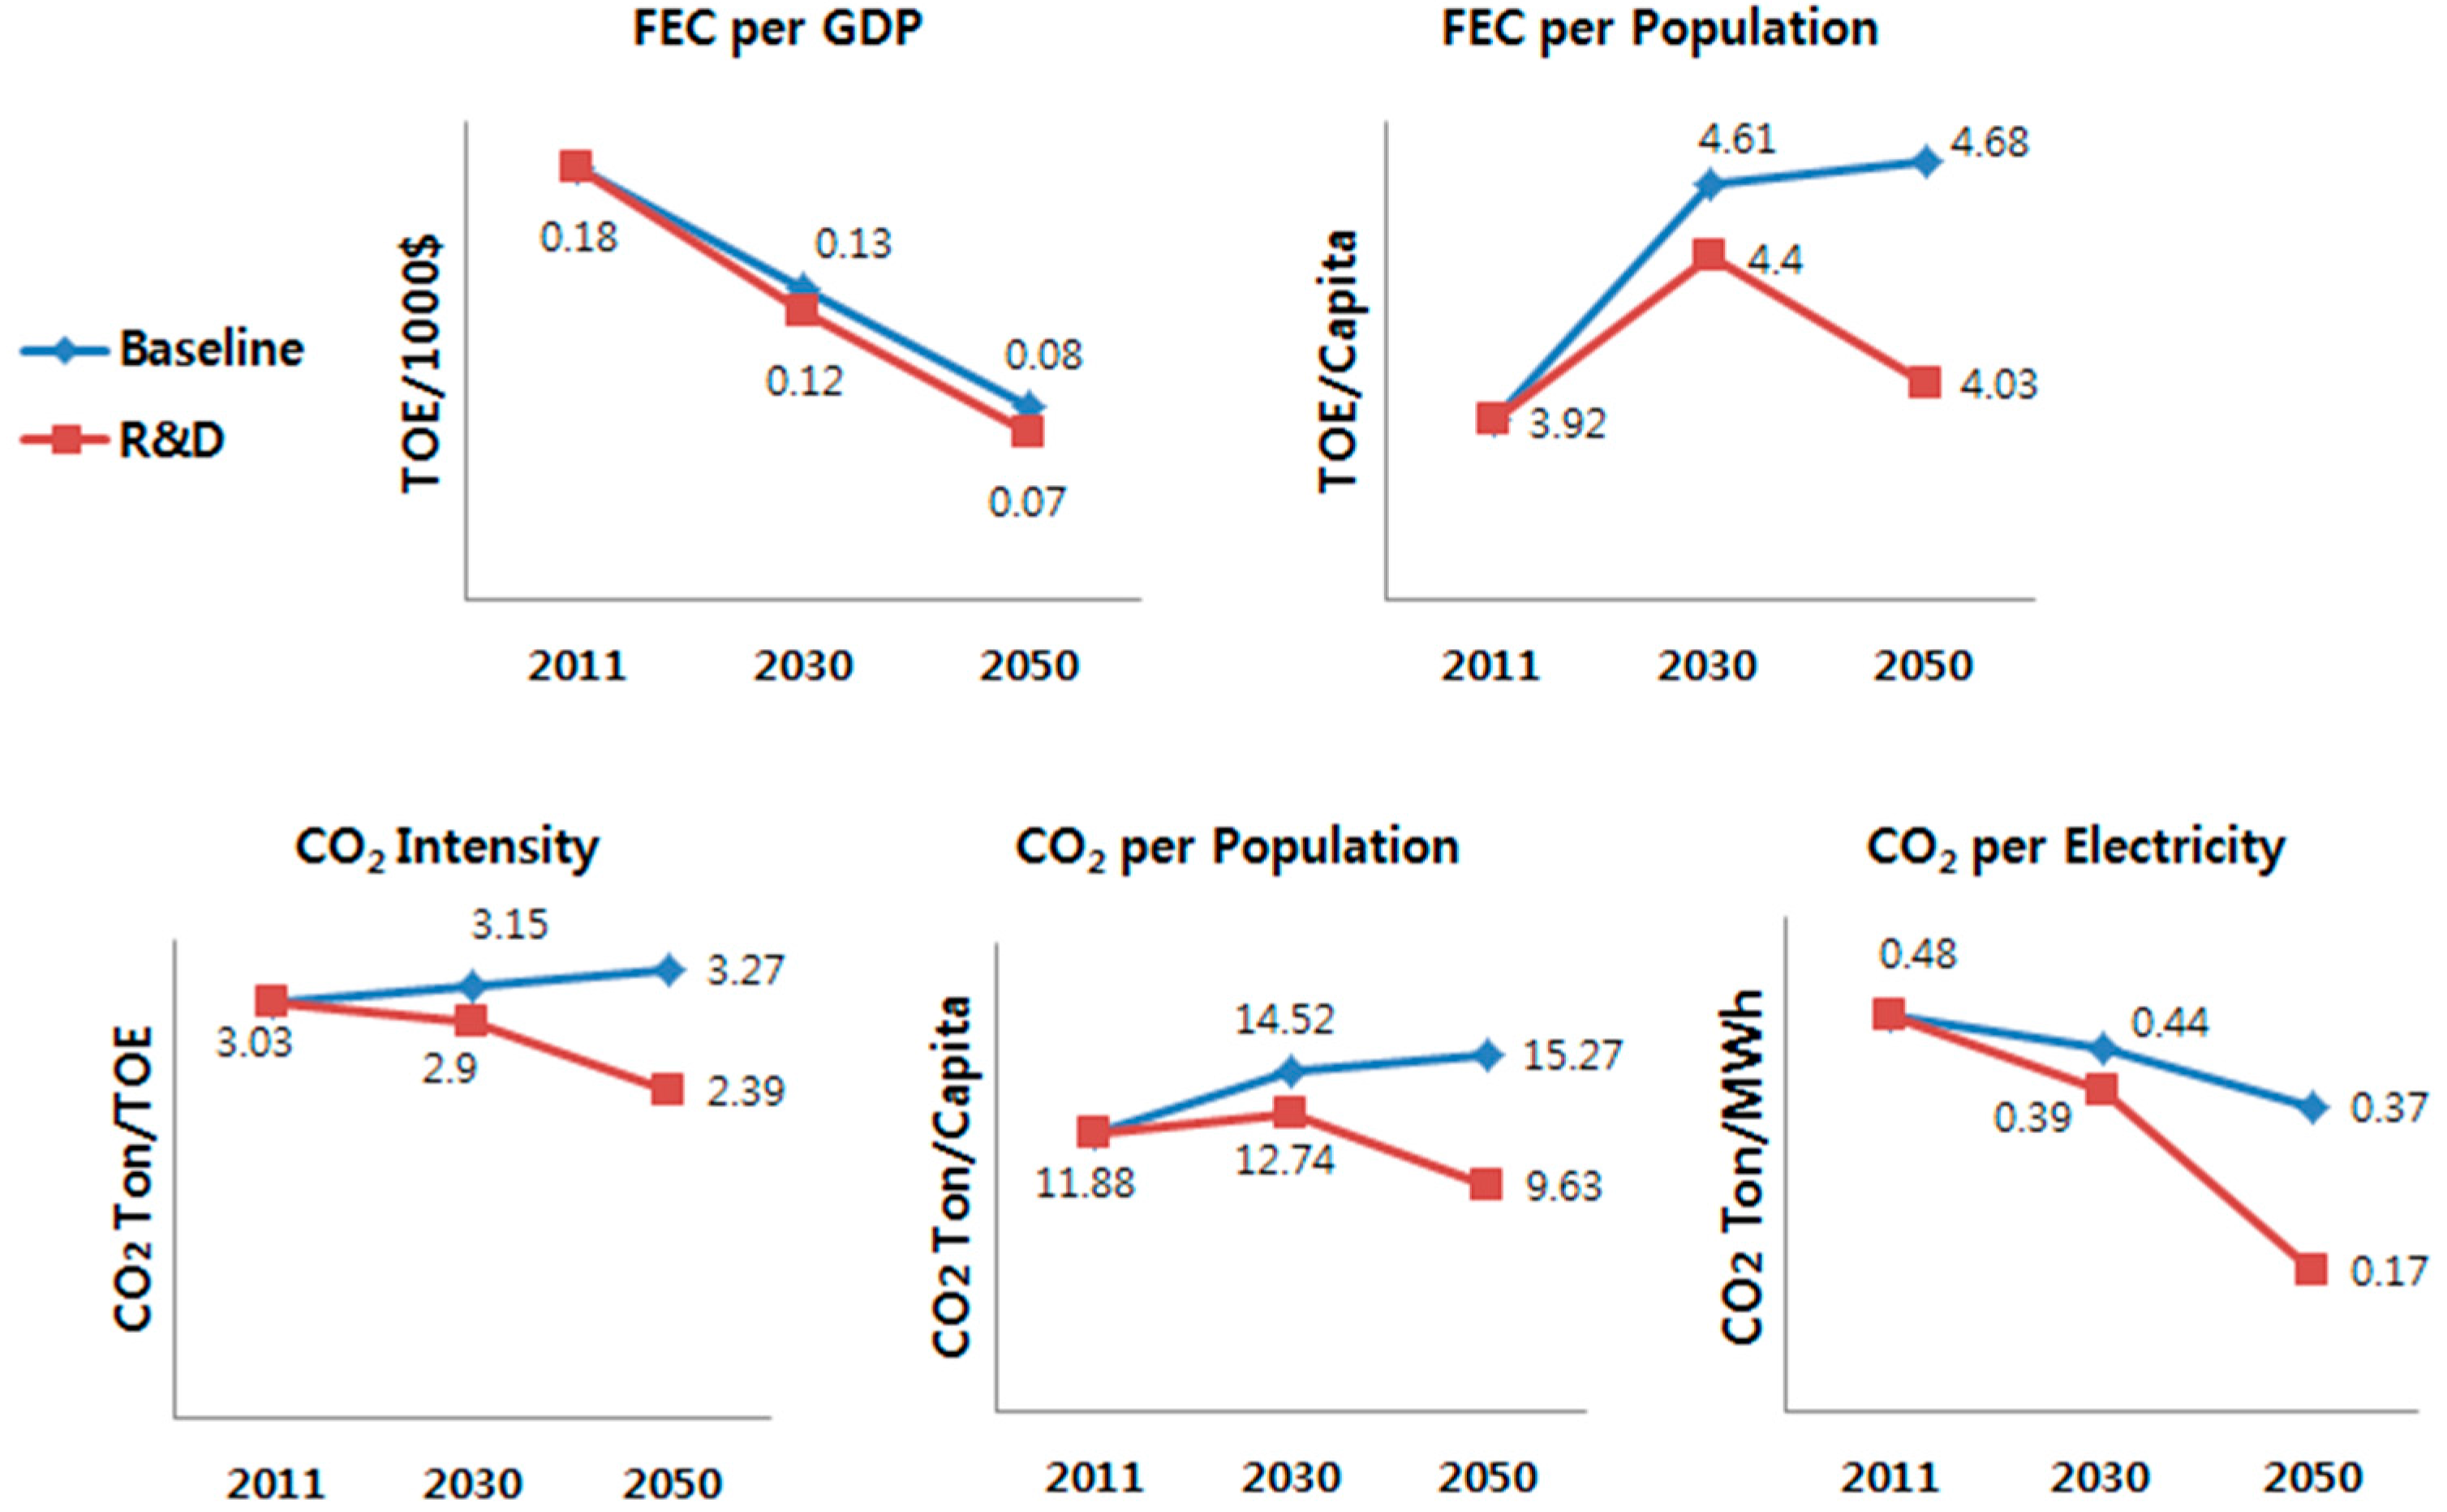
From deducing long-term population, GDP estimates, and major energy indicators that are linked to economic indicators,
Figure 10 shows that the final energy consumption (FEC) per GDP and per capita are expected to decrease by 10–15% and the CO
2 emissions per the final energy consumption and capita are expected to decrease by 30–40%. One of the main reasons that the degree of enhancement is greater from the CO
2 perspective in comparison to the energy perspective is because of the supply of CCS technology, and accordingly, the CO
2 emissions per electricity generation amount is expected to decrease by 54% from 0.37 kg CO
2/kWh under the 2050 baseline scenario to 0.17 kg CO
2/kWh under the R&D scenario.
7. Conclusions and Policy Implications
This paper has attempted to quantitatively analyze the effect of energy consumption and CO2 emissions when the technological characteristics proposed in the Energy Technology R&D Roadmap are achieved and such technologies are successfully deployed into the market by utilizing a bottom-up energy systems analysis model, also known as the TIMES model. Thus, the model could provide the effect of technology roadmap in terms of economic and environmental aspects. At the same time, the model could be utilized setting the targets of the roadmap. However, the model assumed that the technological targets can be matched by R&D investment, regardless of whether it is from public or private funding. Furthermore, if the technology finally enters market, the price and all other costs will be the criteria for the competing technologies.
The subjects of analysis were focused on seven types of technologies in the field of power generation, including solar PVs, wind power, and CCS, and four types of technologies in the field of final energy consumption including energy-saving houses and buildings and green cars that were provided in the Energy Technology Vision Roadmap and the Green Energy Strategy Roadmap. In addition, the scenario in which technological characteristics such as cost or efficiency for the 11 types of energy technologies were fixed during the analysis period was set as the baseline scenario, whereas the scenario in which continuous R&D improvements were made during the analysis period was set as the R&D scenario.
The results of the analysis showed that, assuming R&D investments for the 11 types of technologies, savings of 11.7% and 13.7% with regards to primary energy and final energy consumption, respectively, compared to the baseline scenario would be feasible by 2050. Furthermore, in the field of power generation, the generation proportion of new and renewable energy, including fuel cells and IGCC, is expected to increase from 3.0% as of 2011 to 19.4% by 2050. With the introduction of CCS technology, the CO2 emissions are expected to be reduced by about 36.9% in comparison to the 2050 baseline scenario under the R&D scenario. As a result, the indicators for final energy consumption per capita and per energy source units are expected to decrease by 10–15%, and the indicators for the degree of CO2 intensity and CO2 emissions per capita are expected to decrease by 30–40%. However, the introduction of CCS is not deduced from the optimization process of the TIMES model but is defined by deployment target of technology R&D roadmap because the policy would play a decisive role in the implementation of CCS.
Currently, various types of R&D roadmaps in the field of energy technology are being proposed, and in many cases, in-depth analyses on the relevant impact of these roadmaps are lacking. Moreover, even if an impact analysis has been carried out, the analysis is most likely done on a per technology basis and would not take into consideration a higher comprehensive impact analysis on energy systems as a whole. Therefore, as discussed above, this paper aims to provide research results based on bottom-up energy systems models, such as the TIMES model, that can analyze the impact while taking into consideration the interactive effects between the areas of energy conversion and final energy consumptions based on the characteristics of individual technologies.
The analysis using the TIMES model is useful not only in assessing the overall impact of the R&D roadmap, but also in setting R&D targets at a per technology level. For instance, in the case of the IGCC technology, even if R&D targets have been met, analysis has shown that it will not be able to secure price competitiveness in comparison to existing technologies. This is because the rate of increase in investment and maintenance costs is expected to be greater than the savings in energy costs as a result of improvements in energy efficiency. Therefore, there may be a need to reset R&D targets from efficiency and cost perspectives in order to obtain price competitiveness for IGCC technologies. Of course, the value of the IGCC technology should be judged not based only on its price competitiveness, but also on its environmentally-friendly aspect as a result of its usage of the abundant energy source, coal, in a much cleaner way, as well as its energy security aspects. However, even in such cases, it is difficult to ignore competing technologies, such as natural gas power plants and solar PV. Therefore, by making it possible to analyze the competition among technologies while increasing restrictions on CO2 emissions for power generation through the model developed in this research, this research will be able to assist the prioritization of R&D by taking into consideration both the economic and environmental aspects.
Moreover, in the case of solar or wind power generation, the installed capacity and generation amount is expected to increase from 2030, and if level of efficiency and costs that match the R&D targets for 2030 are met, this will indicate that the technology has secured economic feasibility. Such economics is not deduced simply through calculations of levelized cost of electricity (LCOE), but rather through the overall consideration of hourly electricity load profile, hourly capacity factor for solar and wind power generation, and the load following characteristics of fossil fuel power plants. Hence, if it is possible to achieve 2030 R&D targets earlier through more aggressive R&D investments, this can facilitate the grid parity period, which is the point in time when solar and wind power generation technologies can be supplied to the market in a self-sustaining manner [
32].
As such, analysis on the Energy Technology R&D Roadmap based on a bottom-up energy systems analysis model can be used not only for overall impact analysis and R&D portfolio establishment, but also for the development of detailed R&D strategies, such as R&D target settings, for each technology. Hence, at the current point in time when the role of energy technology in reducing greenhouse gases is being underscored, there is a greater need to analyze the quantitative impact on energy systems by using a bottom-up energy systems analysis model and actively reflect the results into R&D planning. In addition, if the results of this R&D roadmap analysis can serve as feedback for the process of setting national reduction targets, such as Nationally Determined Contributions (NDCs), and for the establishment of implementation roadmaps, they will most certainly contribute significantly to the establishment of efficient reduction strategies.
Therefore, in the future, there is a need to expand further on the analysis model to include an even greater range of energy technologies and carry out research on establishing the optimal R&D roadmap to meet national greenhouse gas emissions reduction targets. To do so, an expansion in the range of technologies subject to analysis as well as a greater variety of analysis scenarios to identify the optimal R&D roadmap will be necessary. Moreover, for a more detailed analysis on the R&D effects, there will be a need to carry out additional research to link the bottom-up energy systems analysis model with other analysis methodologies, such as the two-factor-learning curve, in order to also take into consideration the correlation between the R&D roadmap and investment costs. Finally, through the bottom-up energy systems analysis model, although the results on energy consumption, CO2 emissions, and relevant systems costs will be obtainable, an even greater variety of factors, such as R&D success rates, commercialization rates, impact on export expansion, and impact on employment, will need to be taken into consideration when investing in R&D. Thus, there is a need for continuous research to develop a model that can actually be used for R&D investment prioritization through linking the analysis results of the bottom-up energy systems model with multi-criteria decision-making methodologies, such as AHP and DEA. The rebound effect consuming energy technologies should also be considered in the model in the future research. Usually, an elastic demand is a solution in macro-economics, but an iterative approach varying the price and the demand could be deployed in the TIMES model.


