
Variations in Growing-Season NDVI and Its Response to Permafrost Degradation in Northeast China
by
 and
and
Jinting Guo
1,2, 
Yuanman Hu
1,
Zaiping Xiong
1,
Xiaolu Yan
1,2,
Chunlin Li
1,2 and
Rencang Bu
1,* 1
CAS Key Laboratory of Forest Ecology and Management, Institute of Applied Ecology, Chinese Academy of Sciences, No. 72, Wenhua Road, Shenyang 110016, China
2
University of Chinese Academy of Sciences, No. 19, Yuquan Road, Beijing 100049, China
*
Author to whom correspondence should be addressed.
Sustainability 2017, 9(4), 551; https://doi.org/10.3390/su9040551
Submission received: 17 February 2017
/
Revised: 27 March 2017
/
Accepted: 30 March 2017
/
Published: 5 April 2017
Abstract
:Permafrost is extremely sensitive to climate change. The degradation of permafrost has strong and profound effects on vegetation. The permafrost zone of northeastern China is the second largest region of permafrost in China and lies on the south edge of the Eurasian cryolithozone. This study analyzed the spatiotemporal variations of the growing-season Normalization Difference Vegetation Index (NDVI) in the permafrost zone of northeastern China and analyzed the correlation between NDVI and ground surface temperatures (GST) during the years 1981–2014. Mean growing-season NDVI (MGS-NDVI) experienced a marked increase of 0.003 year−1 across the entire permafrost zone. The spatial dynamics of vegetation cover had a high degree of heterogeneity on a per pixel scale. The MGS-NDVI value increased significantly (5% significance level) in 80.57%, and this increase was mostly distributed in permafrost zone except for the western steppe region. Only 7.72% experienced a significant decrease in NDVI, mainly in the cultivated and steppe portions. In addition, MGS-NDVI increased significantly with increasing growing-season mean ground surface temperature (GS-MGST). Our results suggest that a warming of GS-MGST (permafrost degradation) in the permafrost region of northeastern China played a positive role in increasing plant growth and activities. Although increasing ground surface temperature resulted in increased vegetation cover and growth in the short time of permafrost degradation, from the long term point of view, permafrost degradation or disappearance may weaken or even hinder vegetation activities.
1. Introduction
Permafrost is defined as ground that remains below 0°C for at least two consecutive years [1,2,3], and forms a main component of the cryosphere [4]. The conditions related to ground temperature that allow the existence of permafrost determine the vulnerability of permafrost to climate change [5,6], and this vulnerability is indirectly reflected by changes in aboveground vegetation growing on permafrost [7]. Therefore, changes in the permafrost zone associated with warming temperatures were directly or indirectly correlated to changes in the features of overlying vegetation, such as changes in vegetation cover [8], net primary productivity [9], plant biomass [10], phenology [11], and plant community structure [12,13]. In cold regions, the existence of permafrost has extremely important effects on plant growth. Permafrost forms a relatively impermeable layer that modifies the soil hydrological regime, prevents the infiltration of soil moisture, and provides sufficient water resources for vegetative growth [14,15]. Permafrost also plays a vital role in nutrient cycling [16]. The degradation of permafrost has strong and profound effects on vegetation [17,18]. The permafrost zone of northeastern China, located in middle-high latitude regions of the Northern Hemisphere, forms the second largest region of permafrost in China and lies on the southern edge of the Eurasian cryolithozone [19]. Recent and significant climate warming has obviously caused the degradation of permafrost [20,21,22]. For example, Jin et al. [23] suggested that areas of sporadic islands of permafrost have decreased by 35–37% when conditions in the early 2000s were compared with those of the 1970s. Meanwhile, Wei et al. [19] indicated that the southern edge of the permafrost zone had obviously shifted northward. Plant species richness has been shown to increase with the thawing of permafrost [24,25]. However, the dynamics of vegetation character (i.e., Normalized Difference Vegetation Index (NDVI)) with the degradation of permafrost at each pixel remain unclear in different zones of permafrost distribution.
Degradation of permafrost occurs in many ways, such as through an increase in ground temperature, active layer thickening, and a modification of continuous permafrost into discontinuous permafrost and island permafrost. Because a persistent permafrost profile is lacking (including for example the depth of the active layer), we selected GST (ground surface temperature) as an indicator of the degradation of permafrost [26,27] in this study.
The main purpose of this study was to probe the spatiotemporal variations of NDVI that are associated with the degradation of permafrost in northeastern China from 1981 to 2014 based on satellite and climate data sets. Furthermore, in this study, the primary objectives were to (1) investigate the spatiotemporal variations as described above and (2) examine the correlations between NDVI and GST to discuss the role that the degradation of permafrost plays in vegetation dynamics. The study results enhance the understanding of the effects of permafrost degradation on environmental conditions and add a scientific basis for research related to the response of cold region ecosystems to global climate warming.
2. Materials and Methods
2.1. Study Area
The permafrost region analyzed in the present study, located in the northernmost part of northeastern China, extends from 46°30′N to 53°30′N and from 115°52′E to 135°09′E and covers approximately 3.87 × 10⁵ km2 (Figure 1). The climate regime is characterized by long, dry, and cold winters and short, moist, and hot summers [19]. The annual average temperature ranges from 0 °C in the south to −6 °C in the north, and the annual precipitation ranges from less than 200 mm in the west to 500–700 mm in the east [23]. Forests dominated by larch (Larix gmelinii Kuzen.) and white birch (Betula platyphylla Suk.) represent the main land cover type, with a small proportion covered by a mosaic of scrubland, woodland, steppe, meadow, swamp, and cultivated land (Figure 1). Vegetation data on a scale of 1:1,000,000 were obtained from a digitized vegetation map of China derived from ground-based observations [28]. The permafrost region has traditionally been classified into continuous permafrost (CP), discontinuous permafrost with island taliks (DIP), and sparse island permafrost (SIP). CP, DIP, and SIP covered 19.12% (0.74 × 10⁵ km2), 10.85% (0.42 × 10⁵ km2), and 70.03% (2.71 × 10⁵ km2) of the landscape in this region, respectively (Figure 1). Generally in DIP and SIP, there are extensive peatlands and palsas [29,30]. Using the results of Guo et al. [31] we produced the map of the distribution of permafrost and the changes in the southern limit of permafrost by vector quantization in ArcGIS 9 (Environmental Systems Research Institute, Redlands, CA, USA) (Figure 1).
2.2. NDVI Datasets
Two datasets, Long Term Data Record (LTDR) NDVI (AVH13C1) collected during 1981–1999 and Moderate Resolution Imaging Radiometer (MODIS) NDVI (MOD13C2) in 2000–2014, were employed in this study to reveal the spatiotemporal variation of growing-season vegetation cover in the permafrost region of northeastern China to completely cover 1981–2014. LTDR AVH13C1 products are supported by the LTDR project that was funded as part of the National Aeronautics and Space Administration (NASA) Earth Science Research, Education, and Application Solution Network. This was designed to derive consistent and longtime datasets from the Advanced Very High Resolution Radiometer (AVHRR) series of satellites (NOAA 7, 9, 11, 14, and 16) [32] and MODIS apparatuses for application in global climate warming research studies [33]. The LTDR AVH13C1 products consisted of a series of daily NDVI data, which was produced with a spatial pixel resolution of 0.05° for the period 1981–1999. This dataset included a modified atmospheric correction approach and bidirectional reflectance distribution function correction [34].
MODIS is an important piece of equipment aboard the Terra (generally known as Earth Observing System AM-1) and Aqua (generally known as Earth Observing System PM-1) satellites active from 2000 onward. These provide a good opportunity to monitor many processes associated with the photosynthetic plant activity of Earth’s terrestrial ecosystems [35,36]. The MODIS NDVI (MOD13C2) datasets are composed of the gridded 16-day 1-km NDVI (MOD13A2) with cloud effect eliminate [37]. These data provide monthly product with a spatial pixel resolution of 0.05° that can be obtained from the NASA Level 1 and Atmosphere Archive and Distribution System [38].
Both datasets have considered the effects of atmospheric and geometric calibrations, particularly for those deviations that are generated by the satellite shift to ensure the quality of the data [33,37]. MOD13C2 monthly datasets were generated by employing the maximum value composite (MVC) approach to further reduce the influence of clouds, atmospheric conditions, and the solar zenith angle. The MVC procedure picks the highest NDVI at a per pixel scale [39]. The composite algorithm decreases the effects of angular and sensor changes and offers spectral measures that can be used to rigorously detect spatiotemporal variations of terrestrial plant activity [40]. By using the MVC method, monthly compounds were produced from the AVH13C1 NDVI data products to have a consistent time resolution for the above two NDVI products datasets. Therefore, a long-term monthly NDVI dataset was obtained from AVH13C1 NDVI and MOD13C2 NDVI with a spatial resolution of 0.05°.
The mean growing-season NDVI values were calculated by averaging monthly maximum values from April to October. Any pixels that showed an average growing-season NDVI <0.05 were masked as non-vegetated regions [41].
2.3. Ground Surface Temperature Data
Monthly ground surface temperature (0 cm) dataset was offered by the National Meteorological Information Centre of China during 1981–2014. The climate data during the growing-season each year were generated from 35 meteorological stations across the permafrost region of northeastern China. These climate data were interpolated in ArcGIS 9 through Co-Kriging method based on DEM at a spatial resolution of 0.05° to keep consistent with mean growing-season NDVI.
2.4. Methods
2.4.1. Consistency Checking Between LTDR and MODIS Datasets
The continuity and uniformity of the above two NDVI products data are indispensable for studies of land-climate relationships [42]. This was done by analyzing monthly NDVI during the periods of 1995–1999 (LTDR dataset) and 2000–2005 (MODIS dataset) with the homologous sections of 1995–2005 Global Inventory Modelling and Mapping Studies (GIMMS) dataset for the entire permafrost zone [33]. Moreover, the annual average of NDVI was compared between LTDR NDVI and MODIS NDVI data during 1982–2014, corresponding with the GIMMS NDVI data during 1982–2006.
2.4.2. Spatiotemporal Analysis for NDVI and GST
The MGS-NDVI and GS-MGST were calculated. The linear time trends were produced by applying the ordinary least-squares regression method for NDVI and GST to quantify the magnitude of these trends [43] (Equations (1) and (2)):
where is the MGS-NDVI or GS-MGST, is year, and and are mean values of and respectively. The slope () represents the magnitude of the trend, is the intercept, is the residual error. Furthermore to investigate the trends of growing-season NDVI, linear trends from 1981 to 2014 on a per-pixel basis were examined. Expression is shown in Equations (3) [44].
where is the trend of vegetation dynamics or GST, is equal to 34, the order of year from 1 to 34 in the study period, and is the MGS-NDVI in the th year. The MGS-NDVI from 1981–2014 exhibits an increasing trend when > 0 and a decreasing trend when < 0 [41].
To understand the correlations between NDVI and GST, Pearson’s correlation coefficient between NDVI and GST were computed. Correlations range from +1 to −1. A zero coefficient suggested that there is no correlation between the variables. A positive coefficient indicates that both variables move in the same direction together. A negative coefficient states that the two variables go toward opposite directions. Correlation analysis was produced at both the spatial average value and pixel scale (Equations (4)) [45].
where represents the correlation coefficient for x and y, whose value ranges from −1 to 1, xi and is the values of the two variables in th year and and is the mean values of and during the period of study respectively.
3. Results and Discussion
3.1. Consistency Check
The consistency between LTDR and MODIS data was evaluated in the permafrost region of northeastern China (Figure 2). Figure 2a suggested that there is good consistency among LTDR, MODIS, and GIMMS NDVI. The regression slopes were very similar between GIMMS NDVI and LTDR NDVI for 1995–1999 and between GIMMS NDVI and MODIS NDVI for 2000–2005 (Figure 2b). The annual average of NDVI in 1982–2006 was also found to be similar among LTDR, MODIS, and GIMMS. The result shows a good consistency between LTDR and MODIS NDVI data. The rapid increase and decrease for NDVI from the LTDR to the MODIS also correspondingly appeared for the GIMMS NDVI. Therefore, the monthly NDVI sequence dataset that we generated from LTDR and MODIS in this study is reliable and covers a long time period with a spatial resolution of 0.05°.
3.2. The Interannual Dynamics of MGS-NDVI and Its Correlation to GS-MGST at the Scale of the Entire Permafrost Zone
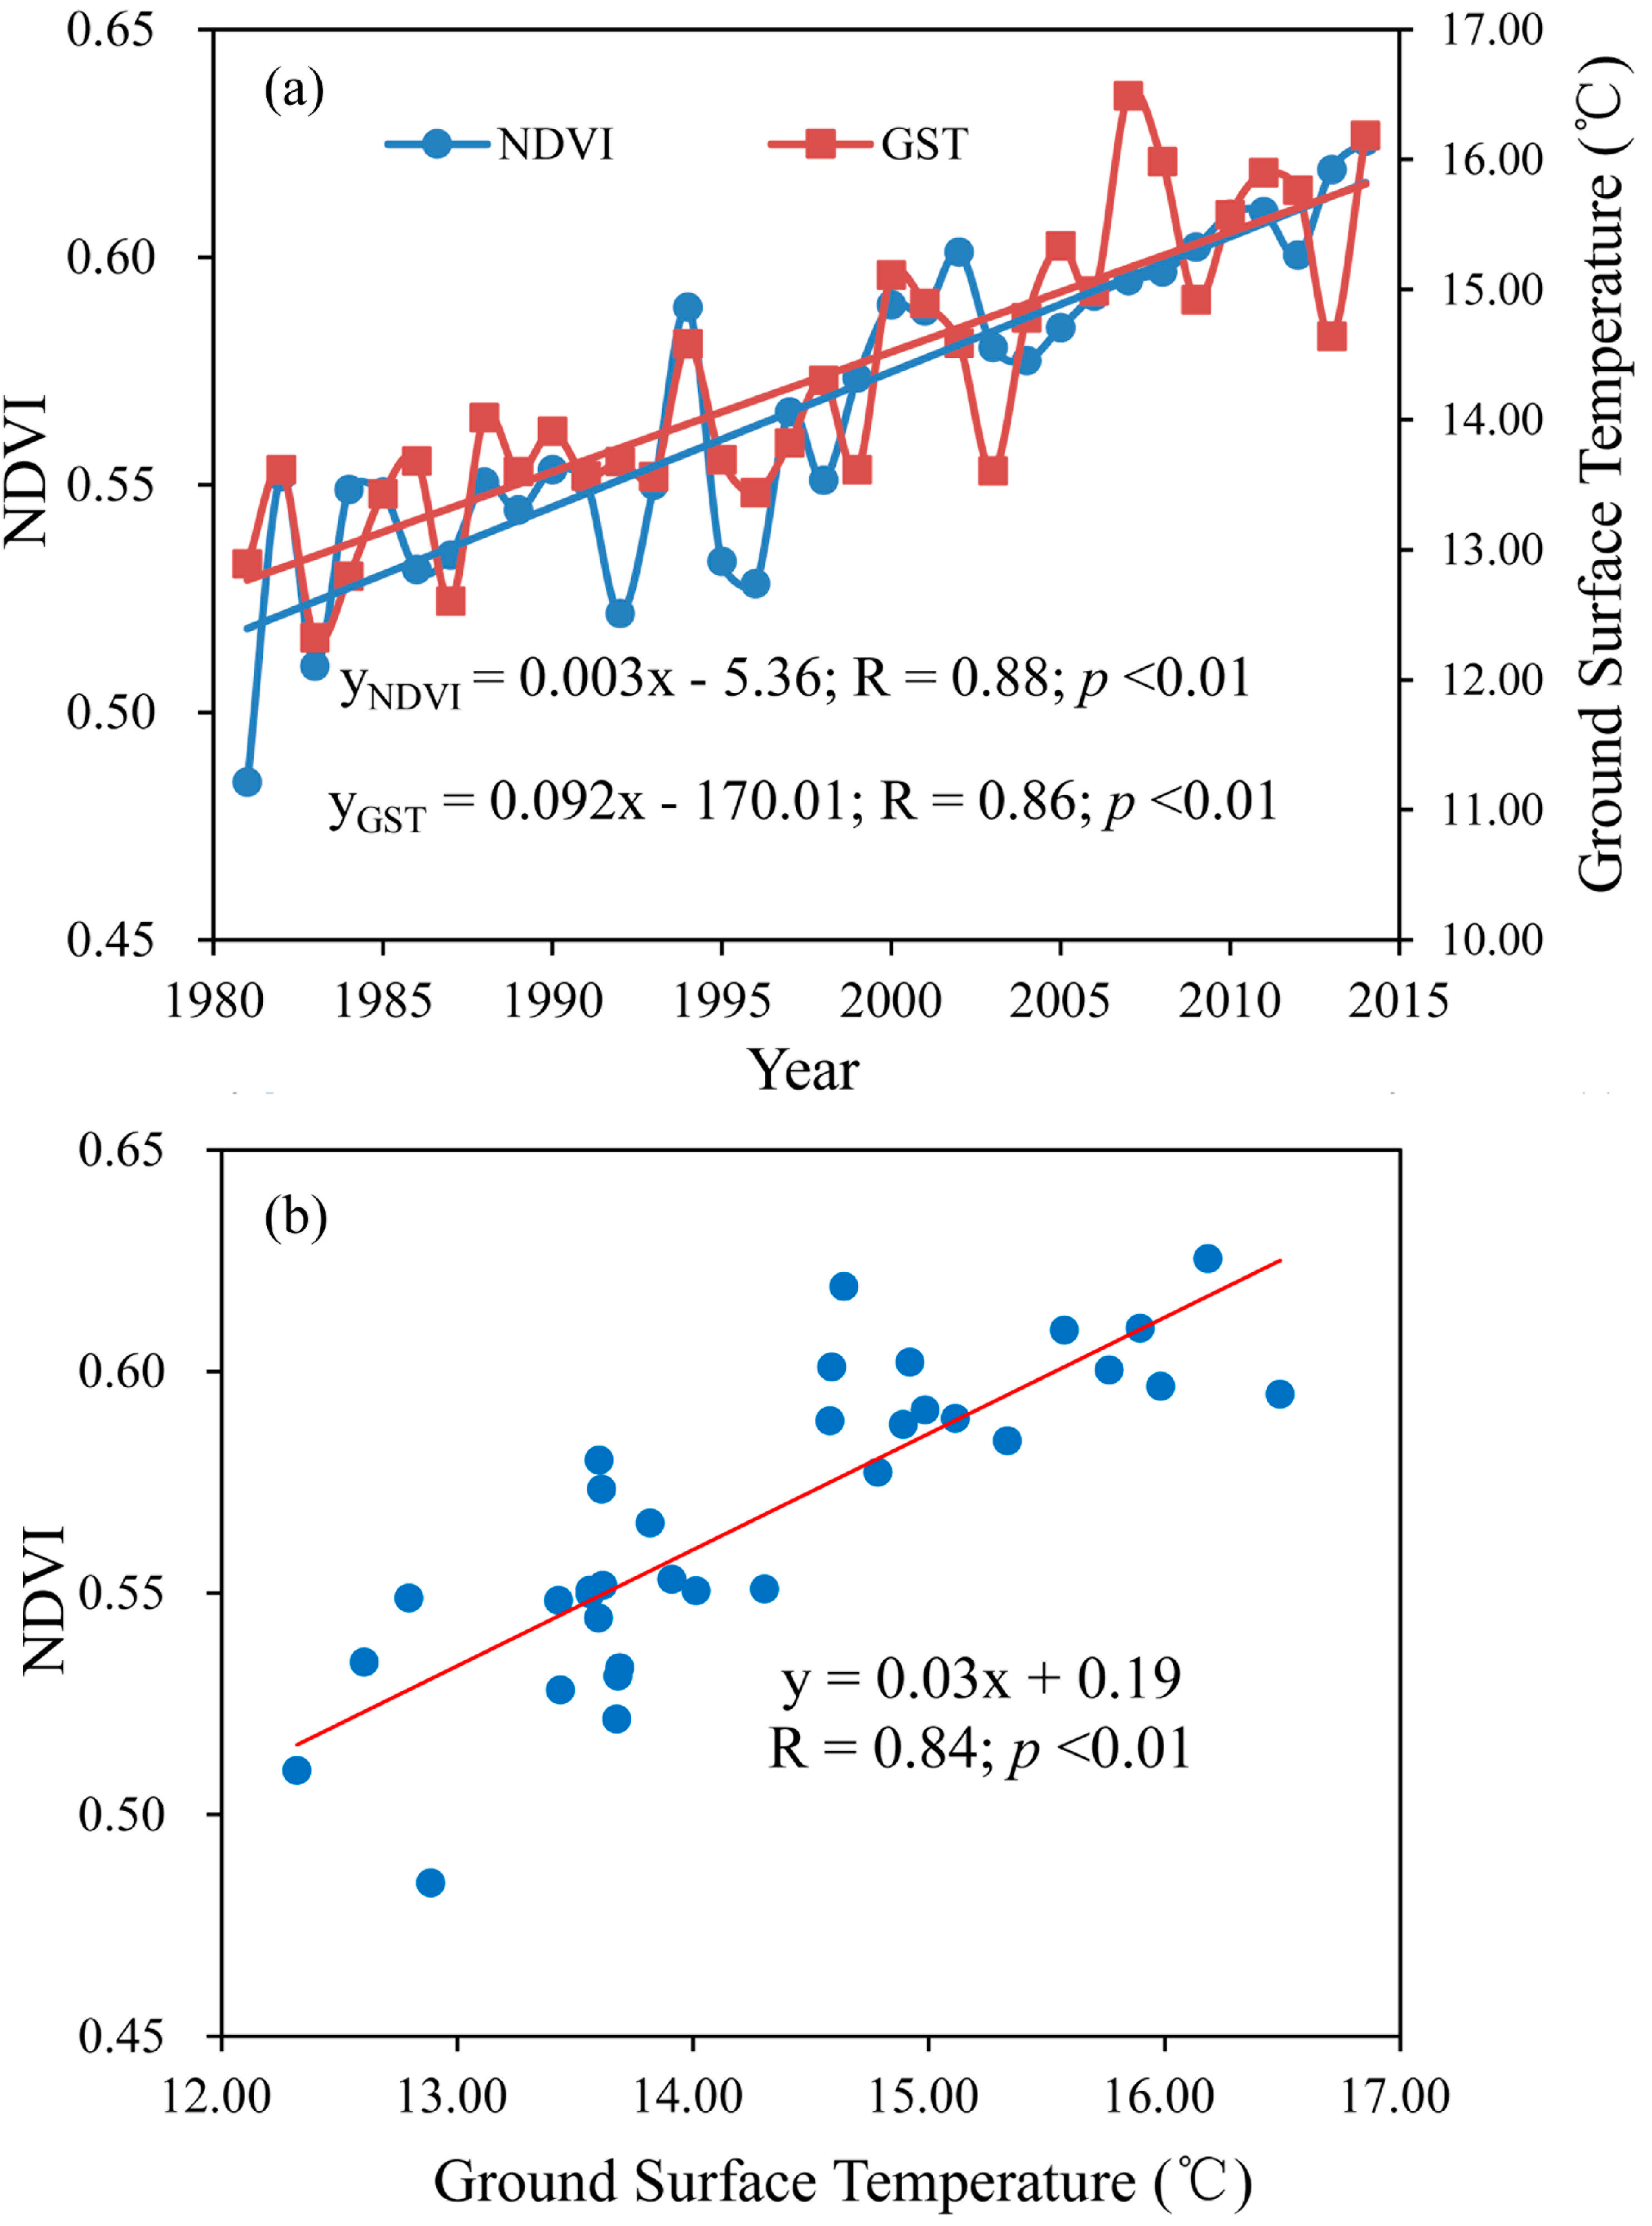
An analysis of the interannual variation of spatial average MGS-NDVI for the entire study area shows it significantly increased at a rate of 0.003 year−1 (p < 0.01; Figure 3a). Annual GS-MGST also increased at a rate of 0.092 °C/year (p < 0.01). The significantly positive (R = 0.84; p < 0.01) correlation between MGS-NDVI and GS-MGST is depicted in Figure 3b. The MGS-NDVI markedly increased with increasing GS-MGST. These results suggest that warming GS-MGST in the permafrost region of northeastern China played a positive role in plant growth that was consistent with some previous studies [46,47]. Mao et al. [9] found that warming land surface temperature resulted in increased vegetation growth in the permafrost zone of the Tibetan Plateau. Permafrost thawing induced by warming ground surface temperature resulted in accelerated soil respiration and increased mineralization and decomposition of nutrients that promoted the growth of vegetation cover [48]. Warming temperature prolonged the growing-season (amplitude of the growth cycle) by causing earlier bud break and delayed senescence of plants and thus improved vegetation activity [49]. However, a few studies have revealed that vegetation cover decreased with an increase in the thickness of the active layer of permafrost, i.e., the degradation of permafrost played a negative role in vegetation cover in the Qinghai-Tibet Plateau [50,51,52].
3.3. Spatial Dynamics of MGS-NDVI and Its Relationship to GS-MGST at the Pixel Scale
Spatial dynamics of the MGS-NDVI show that there was a high degree of spatial heterogeneity based on per pixel analysis (Figure 4a). The pixels that showed increasing trends accounted for 87.78% of the permafrost area, and were mostly distributed in the entire permafrost zone except for the western steppe regions. Pixels that showed decreasing trends (approximately 12.22%) were mainly found in the cultivation and steppe regions of the study area. The results of statistical tests at the 5% significance level of MGS-NDVI trends show the MGS-NDVI value in 80.57% of the entire study area increased significantly and decreased significantly only 7.72% of the total study area (Figure 4b).
To further detect the correlations between MGS-NDVI and GS-MGST, correlation coefficients were calculated for all pixels (Figure 5). Strong and positive correlations between MGS-NDVI and GS-MGST were found in most areas with permafrost and these accounted for approximately 77.49% of the permafrost area (1% and 5% significance levels). The correlation was significant especially in most of CP region, the entire DIP, and the central section and eastern region of SIP with high NDVI values and forest cover, even at the 1% level (approximately 74.30%). However, in the steppe-dominated areas in the western part of the SIP, the MGS-NDVI was significantly negatively correlated with GS-MGST and included approximately 9.49% of all pixels (1% significance levels).
The permafrost zone of northeastern China is located in cold regions where the positive and significant correlation can be explained physiologically because increased temperatures can accelerate plant photosynthesis [53], prolong the growing-season, and result in increased plant activity [54,55,56,57]. This can be interpreted as an increase in photosynthesis and respiration in support of vegetative growth in response to warmer climatic conditions [58]. A negative correlation between MGS-NDVI and GS-MGST was observed in the western part of the SIP (i.e., the Hulun Buir grassland) because an increase in temperature limited plant growth in this semi-arid climate. In the semi-arid region, increasing temperature might result in a decrease in moisture availability for vegetative growth [59]. Increasing GS-MGST enhanced the intensity of transpiration and indicated vegetation cover would decrease with increasing temperature during the growing-season.
3.4. Changes in MGS-NDVI and Its Association with GS-MGST in Different Types of Permafrost Zones
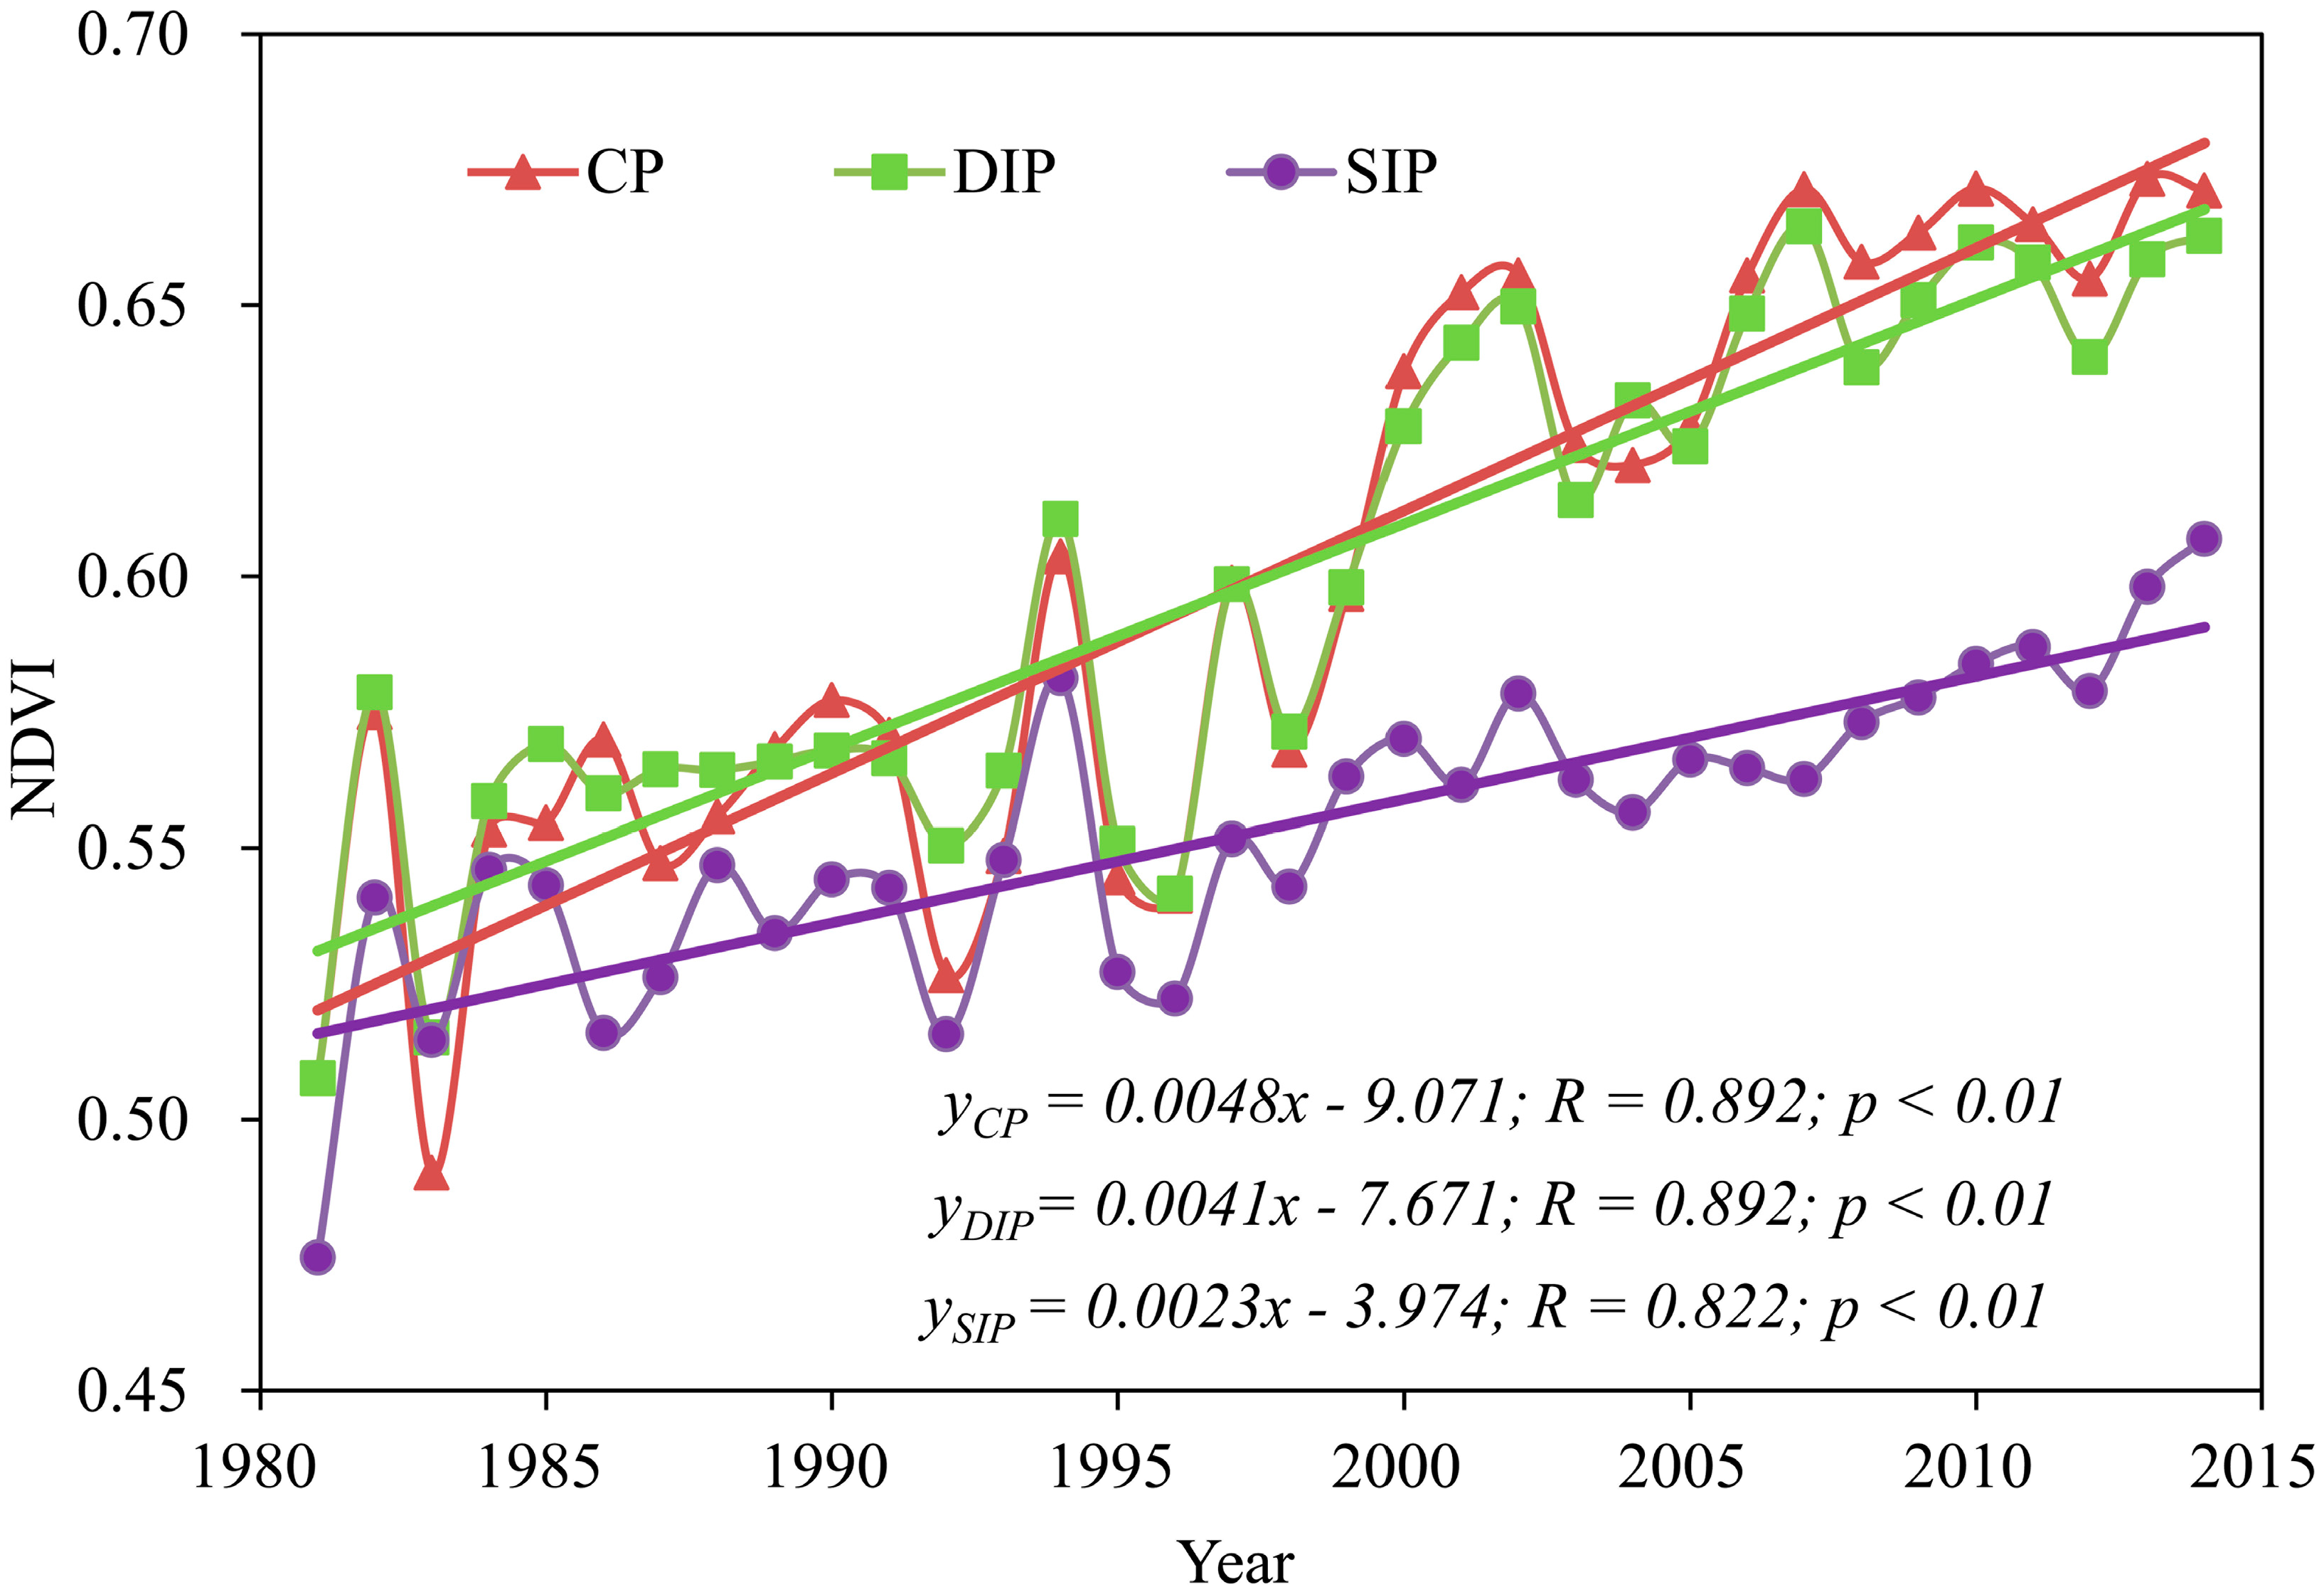
The MGS-NDVI trends for various permafrost types allowed us to better understand patterns of NDVI change. The MGS-NDVI for all permafrost types significantly increased (p < 0.01) because of increased soil moisture and a longer growing-season that is associated with warming temperature [60]. However, the variations in MGS-NDVI were obviously different among the various types of permafrost zones (Figure 6). CP and SIP exhibited the largest and smallest significant increasing trend, with average annual increments of 0.0048 year−1 and 0.0023 year−1, respectively. Additionally, DIP was similar to the trends in the CP, with a positive rate of 0.0042 year−1; this might be related to the similar GS-MGST and extent of thawing [9].
The correlation coefficients between MGS-NDVI and GS-MGST among different permafrost types clearly show that a significantly positive correlation existed between NDVI and ground surface temperature in the entire permafrost zone of northeastern China (Table 1). Moreover, the correlation coefficients between NDVI and GST ranged from 0.718 to 0.754 to 0.821 for SIP, CP, and DIP, respectively (p < 0.01). The trend of correlation coefficients showed an increase from CP to DIP, while the trend of correlation coefficients decreased from DIP to SIP. In our research, CP, DIP, and SIP represented successive stages in the process of permafrost thawing. Trends of the correlation coefficients between MGS-NDVI and GS-MGST increased from CP to DIP and then decreased from DIP to SIP. The degradation of permafrost was a long-term dynamic process and a lag effect was observed [8]. As permafrost begins to degrade, increased ground surface temperature weakened the influence of cold temperature resulting in increased soil temperature, and a prolonged growing-season that resulted in accelerated plant growth [48]. As permafrost continued to degrade, the positive correlation between NDVI and ground surface temperature became weak; this may be attributed to decreased soil moisture [61]. Furthermore, permafrost disappears completely with continued warming of ground surface temperature; this may cause the soil to become much drier and will aggravated conditions related to vegetative growth [62]. Hence, increasing ground surface temperature accelerated a short term increase in vegetation cover with the degradation of permafrost, while over the long term the degradation or disappearance of permafrost may weaken or even hinder vegetative activities.
4. Conclusions
This study documented the spatiotemporal variations in vegetation NDVI and the correlation between NDVI and GST. In addition, we investigated how permafrost degradation played a role in affecting vegetation dynamics. The main conclusions follow:
- (1)
- The MGS-NDVI significantly increased at a rate of 0.003 year−1 at the entire permafrost zone scale. Meanwhile, the spatial dynamics of the vegetation cover in the permafrost zone had a high degree of heterogeneity at the per pixel scale.
- (2)
- These results suggest that warming GS-MGST (permafrost degradation) in the permafrost region of northeastern China played a positive role in improving plant growth and increasing plant activity. However, increasing ground surface temperature accelerated vegetation cover and growth in the short term with permafrost degradation; nevertheless, from a long term point of view, permafrost degradation or its disappearance may weaken or even hinder vegetation growth and activity.
While this study did provide some useful results, several points remain unclear and need to be researched, analyzed, and discussed in the future. For example, despite a strong increase in NDVI in the permafrost zone in northeastern China over the last three decades, the details related to carbon exchange remain unknown under the background of a warming climate. However, some literature suggested that the thawing of permafrost was caused by climate warming that accelerated the decomposition of organic carbon by soil microbes, and this decomposition released carbon dioxide (CO2) and methane (CH4) into the atmosphere and hydrosphere [63,64,65,66]. However, Qian et al. [67] investigated terrestrial carbon storage in the northern high latitudes using a model and revealed that climatic warming in the northern high latitudes will cause the maintenance of a carbon sink in this region by 2100. Permafrost thawing plays a positive or negative role in creating feedback to climate change based on different research approaches. Effective observation networks need to be developed in order to allow researchers to evaluate the potential effects of the thawing of permafrost on climate change. More studies are needed to detect and document the role of permafrost in the regional and global carbon balance.
Acknowledgments
This work was financially supported by the National Basis Research Program of China (973 program, 2013CBA01807), the National Natural Science Foundation of China (41371198), and the “123” Project of the China Environment Protect Foundation (CEPF2013-123-2-12). The authors are grateful to the anonymous reviewers who made suggestions that enhanced the manuscript. Finally, the authors would like to express their appreciation for research team; they assisted not only in the work but in spirit.
Author Contributions
Jinting Guo made substantial contributions toward the collection, processing, analysis, and interpretation of data and assisted with manuscript preparation; Yuanman Hu ensured the integrity of the entire study; Zaiping Xiong provided guidance for the ArcGIS software; Xiaolu Yan performed data analysis; Chunlin Li performed data collection; Rencang Bu performed manuscript review and final approval of the version for publication.
Conflicts of Interest
The authors declare no conflict of interest.
Abbreviations
| NDVI | Normalization Difference Vegetation Index |
| GST | Ground surface temperature |
| NASA | National Aeronautics and Space Administration |
| AVHRR | Advanced Very High Resolution Radiometer |
| MODIS | Moderate Resolution Imaging Radiometer |
| LTDR | Long Term Data Record |
| GIMMS | Global Inventory Modelling and Mapping Studies |
| CP | Continuous permafrost |
| DIP | Discontinuous permafrost with island taliks |
| SIP | Sparse island permafrost |
| MGS-NDVI | Mean growing-season Normalization Difference Vegetation Index |
| GS-MGST | Growing-season mean ground surface temperature |
| MVC | Maximum value composite |
References
- Ran, Y.H.; Li, X.; Cheng, G.D.; Zhang, T.J.; Wu, Q.B.; Jin, H.J.; Jin, R. Distribution of permafrost in China: An overview of existing permafrost maps. Permafr. Periglac. Process. 2012, 23, 322–333. [Google Scholar] [CrossRef]
- Schuur, E.A.G.; Bockheim, J.; Canadell, J.G.; Euskirchen, E.; Field, C.B.; Goryachkin, S.V.; Hagemann, S.; Kuhry, P.; Lafleur, P.M.; Lee, H.; et al. Vulnerability of permafrost carbon to climate change: Implications for the global carbon cycle. Bioscience 2008, 58, 701–714. [Google Scholar] [CrossRef]
- Morgenstern, A.; Hauber, E.; Reiss, D.; van Gasselt, S.; Grosse, G.; Schirrmeister, L. Deposition and degradation of a volatile-rich layer in Utopia Planitia and implications for climate history on Mars. J. Geophys. Res. Planets 2007, 112. [Google Scholar] [CrossRef]
- Cheng, G.D.; Wu, T.H. Responses of permafrost to climate change and their environmental significance, Qinghai-Tibet Plateau. J. Geophys. Res. Earth Surf. 2007, 112. [Google Scholar] [CrossRef]
- Guglielmin, M.; Ellis Evans, C.J.; Cannone, N. Active layer thermal regime under different vegetation conditions in permafrost areas. A case study at Signy Island (Maritime Antarctica). Geoderma 2008, 144, 73–85. [Google Scholar] [CrossRef]
- Li, X.; Cheng, G.D. AGIS-aided response model of high-altitude permafrost to global change. Sci. China Ser. D Earth Sci. 1999, 42, 72–79. [Google Scholar]
- Tutubalina, O.V.; Rees, W.G. Vegetation degradation in a permafrost region as seen from space: Noril’sk (1961-1999). Cold Reg. Sci. Technol. 2001, 32, 191–203. [Google Scholar] [CrossRef]
- Yang, Z.; Gao, J.; Zhou, C.; Shi, P.; Zhao, L.; Shen, W.; Ouyang, H. Spatio-temporal changes of NDVI and its relation with climatic variables in the source regions of the Yangtze and Yellow rivers. J. Geogr. Sci. 2011, 21, 979–993. [Google Scholar] [CrossRef]
- Mao, D.; Luo, L.; Wang, Z.; Zhang, C.; Ren, C. Variations in net primary productivity and its relationships with warming climate in the permafrost zone of the Tibetan Plateau. J. Geogr. Sci. 2015, 25, 967–977. [Google Scholar] [CrossRef]
- Hudson, J.M.G.; Henry, G.H.R. Increased plant biomass in a High Arctic heath community from 1981 to 2008. Ecology 2009, 90, 2657–2663. [Google Scholar] [CrossRef] [PubMed]
- Sun, Z.G.; Wang, Q.X.; Xiao, Q.G.; Batkhishig, O.; Watanabe, M. Diverse responses of remotely sensed grassland phenology to interannual climate variability over frozen ground regions in Mongolia. Remote Sens. 2015, 7, 360–377. [Google Scholar] [CrossRef]
- Camill, P.; Lynch, J.A.; Clark, J.S.; Adams, J.B.; Jordan, B. Changes in biomass, aboveground net primary production, and peat accumulation following permafrost thaw in the boreal peatlands of Manitoba, Canada. Ecosystems 2001, 4, 461–478. [Google Scholar] [CrossRef]
- Liu, X.; Zhang, J.; Zhu, X.; Pan, Y.; Liu, Y.; Zhang, D.; Lin, Z. Spatiotemporal changes in vegetation coverage and its driving factors in the Three-river Headwaters Region during 2000–2011. J. Geogr. Sci. 2014, 24, 288–302. [Google Scholar] [CrossRef]
- O’Donnell, J.A.; Jorgenson, M.T.; Harden, J.W.; McGuire, A.D.; Kanevskiy, M.Z.; Wickland, K.P. The effects of permafrost thaw on soil hydrologic, thermal, and carbon dynamics in an Alaskan peatland. Ecosystems 2012, 15, 213–229. [Google Scholar] [CrossRef]
- Chen, S.Y.; Liu, W.J.; Qin, X.; Liu, Y.S.; Zhang, T.Z.; Chen, K.L.; Hu, F.Z.; Ren, J.W.; Qin, D.H. Response characteristics of vegetation and soil environment to permafrost degradation in the upstream regions of the Shule river basin. Environ. Res. Lett. 2012, 7, 11. [Google Scholar] [CrossRef]
- Li, Y.; Guan, D.; Zhao, L.; Gu, S.; Zhao, X. Seasonal Frozen Soil and Its Effect on Vegetation Production in Haibei Alpine Meadow. J. Glaciol. Geocryol. 2005, 27, 311–319. (In Chinese) [Google Scholar]
- Lloyd, A.H.; Yoshikawa, K.; Fastie, C.L.; Hinzman, L.; Fraver, M. Effects of permafrost degradation on woody vegetation at arctic treeline on the Seward Peninsula, Alaska. Permafr. Periglac. Process. 2003, 14, 93–101. [Google Scholar] [CrossRef]
- Tape, K.; Sturm, M.; Racine, C. The evidence for shrub expansion in northern Alaska and the Pan-Arctic. Glob. Chang. Biol. 2006, 12, 686–702. [Google Scholar] [CrossRef]
- Wei, Z.; Jin, H.J.; Zhang, J.M.; Yu, S.P.; Han, X.J.; Ji, Y.J.; He, R.X.; Chang, X.L. Prediction of permafrost changes in Northeastern China under a changing climate. Sci. China Earth Sci. 2011, 54, 924–935. [Google Scholar] [CrossRef]
- Cheng, G.D.; Jin, H.J. Permafrost and groundwater on the Qinghai-Tibet Plateau and in Northeast China. Hydrogeol. J. 2013, 21, 5–23. [Google Scholar] [CrossRef]
- Jin, H.J.; Li, S.X.; Cheng, G.D.; Wang, S.L.; Li, X. Permafrost and climatic change in China. Glob. Planet. Chang. 2000, 26, 387–404. [Google Scholar] [CrossRef]
- Li, X.; Cheng, G.D.; Jin, H.J.; Kang, E.; Che, T.; Jin, R.; Wu, L.Z.; Nan, Z.T.; Wang, J.; Shen, Y.P. Cryospheric change in China. Glob. Planet. Chang. 2008, 62, 210–218. [Google Scholar] [CrossRef]
- Jin, H.J.; Yu, Q.H.; Lii, L.Z.; Guo, D.X.; He, R.X.; Yu, S.P.; Sun, G.Y.; Li, Y.W. Degradation of permafrost in the Xing’anling Mountains, Northeastern China. Permafr. Periglac. Process. 2007, 18, 245–258. [Google Scholar] [CrossRef]
- Guo, J.T.; Han, F.L.; Bu, R.C.; Hu, Y.M.; Ma, J.; Nie, Z.W.; Zhu, J.L.; Ren, B.H. Classification of plant communities and species diversity responses to changes in the permafrost depths of the north slope of the Great Khingan Mountain valley of Northeast China. Acta Ecol. Sin. 2016, 36, 1–8. (In Chinese) [Google Scholar] [CrossRef]
- Sun, J.; Li, X.Z.; Wang, X.W.; Lu, J.J.; Li, Z.M. Plant species distribution in permafrost wetlands of the Great Hing’an Mountain valleys and its response to global climate change. J. Earth Sci. 2010, 21, 266–270. [Google Scholar] [CrossRef]
- Bockheim, J.; Vieira, G.; Ramos, M.; Lopez-Martinez, J.; Serrano, E.; Guglielmin, M.; Wilhelm, K.; Nieuwendam, A. Climate warming and permafrost dynamics in the Antarctic Peninsula region. Glob. Planet. Chang. 2013, 100, 215–223. [Google Scholar] [CrossRef]
- Westermann, S.; Langer, M.; Boike, J. Spatial and temporal variations of summer surface temperatures of high-arctic tundra on Svalbard—Implications for MODIS LST based permafrost monitoring. Remote Sens. Environ. 2011, 115, 908–922. [Google Scholar] [CrossRef]
- Editorial Board of Vegetation Map of China, Chinese Academy of Sciences (EBVMC). Vegetation Atlas of China; Science Press: Beijing, China, 2001. (In Chinese) [Google Scholar]
- Jin, H.; Sun, G.; Yu, S.; Jin, R.; He, R. Symbiosis of Marshes and Permafrost in Da and Xiao Hinggan Mountains in Northeastern China. Chin. Geogr. Sci. 2008, 18, 62–69. [Google Scholar] [CrossRef]
- Sjöberg, Y.; Marklund, P.; Pettersson, R.; Lyon, S.W. Geophysical mapping of palsa peatland permafrost. Cryosphere 2015, 9, 465–478. [Google Scholar] [CrossRef]
- Guo, D.X.; Wang, S.L.; Lu, G.W.; Dai, J.B.; Li, E.Y. Zonation of permafrost in the Da and Xiao Xing’anling mountains in Northeastern China. J. Glaciol. Geocryol. 1981, 3, 1–9. (In Chinese) [Google Scholar]
- Kidwell, K.B. NOAA Polar Orbiter Data User’s Guide (TIROS-N, NOAA-6, NOAA-7, NOAA-8, NOAA-9, NOAA-10, NOAA-11, NOAA-12, NOAA-13 and NOAA-14). Available online: http://www.ncdc.noaa.gov/oa/pod-guide/ncdc/docs/podug/index.htm (accessed on 1 April 2016).
- Sun, W.; Song, X.; Mu, X.; Gao, P.; Wang, F.; Zhao, G. Spatiotemporal vegetation cover variations associated with climate change and ecological restoration in the Loess Plateau. Agric. For. Meteorol. 2015, 209, 87–99. [Google Scholar] [CrossRef]
- Pedelty, J.; Devadiga, S.; Masuoka, E.; Brown, M.; Pinzon, J.; Tucker, C.; Vermote, E.; Prince, S.; Nagol, J.; Justice, C.; et al. Generating a long-term land data record from the AVHRR and MODIS instruments. Proceeding of the IEEE International Geoscience and Remote Sensing Symposium (IGARSS), Barcelona, Spain, 23–28 July 2007; pp. 1021–1025. [Google Scholar]
- Fensholt, R.; Proud, S.R. Evaluation of earth observation based global long term vegetation trends—Comparing GIMMS and MODIS global NDVI time series. Remote Sens. Environ. 2012, 119, 131–147. [Google Scholar] [CrossRef]
- Guo, M.; Wang, X.; Li, J.; Yi, K.; Zhong, G.; Tani, H. Assessment of global carbon dioxide concentration using MODIS and GOSAT data. Sensors 2012, 12, 16368. [Google Scholar] [CrossRef] [PubMed]
- Solano, R.; Didan, K.; Jacobson, A.; Huete, A. MODIS Vegetation Indices (MOD13) C5 User’s Guide. Available online: http://tbrs.arizona.edu/project/MODIS/UsersGuide.pdf (accessed on 1 April 2016).
- Chang, T.; Xiong, X.; Angal, A.; Mu, Q. Assessment of MODIS RSB detector uniformity using deep convective clouds. J. Geophys. Res. Atmos. 2016, 121, 4783–4796. [Google Scholar] [CrossRef]
- Holben, B.N. Characteristics of maximum-value composite images from temporal AVHRR data. Int. J. Remote Sens. 1986, 7, 1417–1434. [Google Scholar] [CrossRef]
- Huete, A.; Didan, K.; Miura, T.; Rodriguez, E.P.; Gao, X.; Ferreira, L.G. Overview of the radiometric and biophysical performance of the MODIS vegetation indices. Remote Sens. Environ. 2002, 83, 195–213. [Google Scholar] [CrossRef]
- Liu, X.; Zhu, X.; Li, S.; Liu, Y.; Pan, Y. Changes in growing season vegetation and their associated driving forces in China during 2001–2012. Remote Sens. 2015, 7, 15517–15535. [Google Scholar] [CrossRef]
- Steven, M.D.; Malthus, T.J.; Baret, F.; Xu, H.; Chopping, M.J. Intercalibration of vegetation indices from different sensor systems. Remote Sens. Environ. 2003, 88, 412–422. [Google Scholar] [CrossRef]
- Bao, G.; Qin, Z.H.; Bao, Y.H.; Zhou, Y.; Li, W.J.; Sanjjav, A. NDVI-based long-term vegetation dynamics and its response to climatic change in the Mongolian Plateau. Remote Sens. 2014, 6, 8337–8358. [Google Scholar] [CrossRef]
- Stow, D.; Daeschner, S.; Hope, A.; Douglas, D.; Petersen, A.; Myneni, R.; Zhou, L.; Oechel, W. Variability of the seasonally integrated normalized difference vegetation index across the north slope of Alaska in the 1990s. Int. J. Remote Sens. 2003, 24, 1111–1117. [Google Scholar] [CrossRef]
- Herrmann, S.M.; Anyamba, A.; Tucker, C.J. Recent trends in vegetation dynamics in the African Sahel and their relationship to climate. Glob. Environ. Chang. Hum. Policy Dimens. 2005, 15, 394–404. [Google Scholar] [CrossRef]
- Chen, H.; Zhu, Q.; Peng, C.; Wu, N.; Wang, Y.; Fang, X.; Gao, Y.; Zhu, D.; Yang, G.; Tian, J.; et al. The impacts of climate change and human activities on biogeochemical cycles on the Qinghai-Tibetan Plateau. Glob. Chang. Biol. 2013, 19, 2940–2955. [Google Scholar] [CrossRef] [PubMed]
- Kelley, A.M.; Epstein, H.E.; Walker, D.A. Role of vegetation and climate in permafrost active layer depth in arctic tundra of northern Alaska and Canada. J. Glaciol. Geocryol. 2004, 26, 269–274. [Google Scholar]
- Schuur, E.A.G.; Crummer, K.G.; Vogel, J.G.; Mack, M.C. Plant species composition and productivity following permafrost thaw and thermokarst in Alaskan tundra. Ecosystems 2007, 10, 280–292. [Google Scholar] [CrossRef]
- Zhuang, Q.; McGuire, A.D.; Melillo, J.M.; Clein, J.S.; Dargaville, R.J.; Kicklighter, D.W.; Myneni, R.B.; Dong, J.; Romanovsky, V.E.; Harden, J.; et al. Carbon cycling in extratropical terrestrial ecosystems of the Northern Hemisphere during the 20th century: A modeling analysis of the influences of soil thermal dynamics. Tellus B 2003, 55, 751–776. [Google Scholar] [CrossRef]
- Guo, Z.G.; Niu, F.J.; Zhan, H.; Wu, Q.B. Changes of grassland ecosystem due to degradation of permafrost frozen soil in the Qinghai-Tibet Plateau. Acta Ecol. Sin. 2007, 27, 3294–3301. (In Chinese) [Google Scholar]
- Wang, S.L.; Jin, H.J.; Li, S.X.; Zhao, L. Permafrost degradation on the Qinghai-Tibet Plateau and its environmental impacts. Permafr. Perigla. Process. 2000, 11, 43–53. [Google Scholar]
- Wang, Z.; Yang, G.; Yi, S.; Wu, Z.; Guan, J.; He, X.; Ye, B. Different response of vegetation to permafrost change in semi-arid and semi-humid regions in Qinghai-Tibetan Plateau. Environ. Earth Sci. 2012, 66, 985–991. [Google Scholar]
- Piao, S.L.; Fang, J.Y.; Ji, W.; Guo, Q.H.; Ke, J.H.; Tao, S. Variation in a satellite-based vegetation index in relation to climate in China. J. Veg. Sci. 2004, 15, 219–226. [Google Scholar] [CrossRef]
- Jeong, S.J.; Ho, C.H.; Gim, H.J.; Brown, M.E. Phenology shifts at start vs. End of growing season in temperate vegetation over the Northern Hemisphere for the period 1982-2008. Glob. Chang. Biol. 2011, 17, 2385–2399. [Google Scholar] [CrossRef]
- Los, S.O.; Collatz, G.J.; Bounoua, L.; Sellers, P.J.; Tucker, C.J. Global interannual variations in sea surface temperature and land surface vegetation, air temperature, and precipitation. J. Clim. 2001, 14, 1535–1549. [Google Scholar] [CrossRef]
- Myneni, R.B.; Keeling, C.D.; Tucker, C.J.; Asrar, G.; Nemani, R.R. Increased plant growth in the northern high latitudes from 1981 to 1991. Nature 1997, 386, 698–702. [Google Scholar] [CrossRef]
- Xu, L.; Myneni, R.B.; Chapin, F.S., III; Callaghan, T.V.; Pinzon, J.E.; Tucker, C.J.; Zhu, Z.; Bi, J.; Ciais, P.; Tommervik, H.; et al. Temperature and vegetation seasonality diminishment over northern lands. Nat. Clim. Chang. 2013, 3, 581–586. [Google Scholar] [CrossRef]
- Piao, S.; Nan, H.; Huntingford, C.; Ciais, P.; Friedlingstein, P.; Sitch, S.; Peng, S.; Ahlstrom, A.; Canadell, J.G.; Cong, N.; et al. Evidence for a weakening relationship between interannual temperature variability and northern vegetation activity. Nat. Commun. 2014, 5, 1–7. [Google Scholar] [CrossRef] [PubMed]
- Mao, D.; Wang, Z.; Luo, L.; Ren, C. Integrating AVHRR and MODIS data to monitor NDVI changes and their relationships with climatic parameters in Northeast China. Int. J. Appl. Earth Obs. 2012, 18, 528–536. [Google Scholar] [CrossRef]
- Yi, S.H.; Zhou, Z.Y.; Ren, S.L.; Xu, M.; Qin, Y.; Chen, S.Y.; Ye, B.S. Effects of permafrost degradation on alpine grassland in a semi-arid basin on the Qinghai-Tibetan Plateau. Environ. Res. Lett. 2011, 6, 7. [Google Scholar] [CrossRef]
- Peng, X.; Wu, Q.; Tian, M. The effect of groundwater table lowering on ecological environment in the headwaters for the yellow river. J. Glaciol. Geocryol. 2003, 25, 667–671. [Google Scholar]
- Zhang, S.; Wang, Y.; Zhao, Y.; Huang, Y.; Li, Y.; Shi, W.; Shang, X. Permafrost degradation and its environmental sequent in the source regions of the yellow river. J. Glaciol. Geocryol. 2004, 26, 1–6. [Google Scholar]
- Daniel, J.H.; David, W.K.; McGuire, A.D.; Min, C.; Qianlai, Z.; Fengming, Y.; Jerry, M.M.; Stan, D.W. The impacts of recent permafrost thaw on land–atmosphere greenhouse gas exchange. Environ. Res. Lett. 2014, 9, 1–12. [Google Scholar]
- Schaefer, K.; Lantuit, H.; Romanovsky, V.E.; Schuur, E.A.G.; Witt, R. The impact of the permafrost carbon feedback on global climate. Environ. Res. Lett. 2014, 9, 9. [Google Scholar] [CrossRef]
- Schuur, E.A.G.; McGuire, A.D.; Schadel, C.; Grosse, G.; Harden, J.W.; Hayes, D.J.; Hugelius, G.; Koven, C.D.; Kuhry, P.; Lawrence, D.M.; et al. Climate change and the permafrost carbon feedback. Nature 2015, 520, 171–179. [Google Scholar] [CrossRef] [PubMed]
- Zimov, S.A.; Schuur, E.A.G.; Chapin, F.S. Permafrost and the global carbon budget. Science 2006, 312, 1612–1613. [Google Scholar] [CrossRef] [PubMed]
- Qian, H.; Joseph, R.; Zeng, N. Enhanced terrestrial carbon uptake in the northern high latitudes in the 21st century from the coupled carbon cycle climate model intercomparison project model projections. Glob. Chang. Biol. 2010, 16, 641–656. [Google Scholar] [CrossRef]
Figure 1.
Location of the study area with types of permafrost and vegetation in the permafrost zone of northeastern China.
Figure 1.
Location of the study area with types of permafrost and vegetation in the permafrost zone of northeastern China.
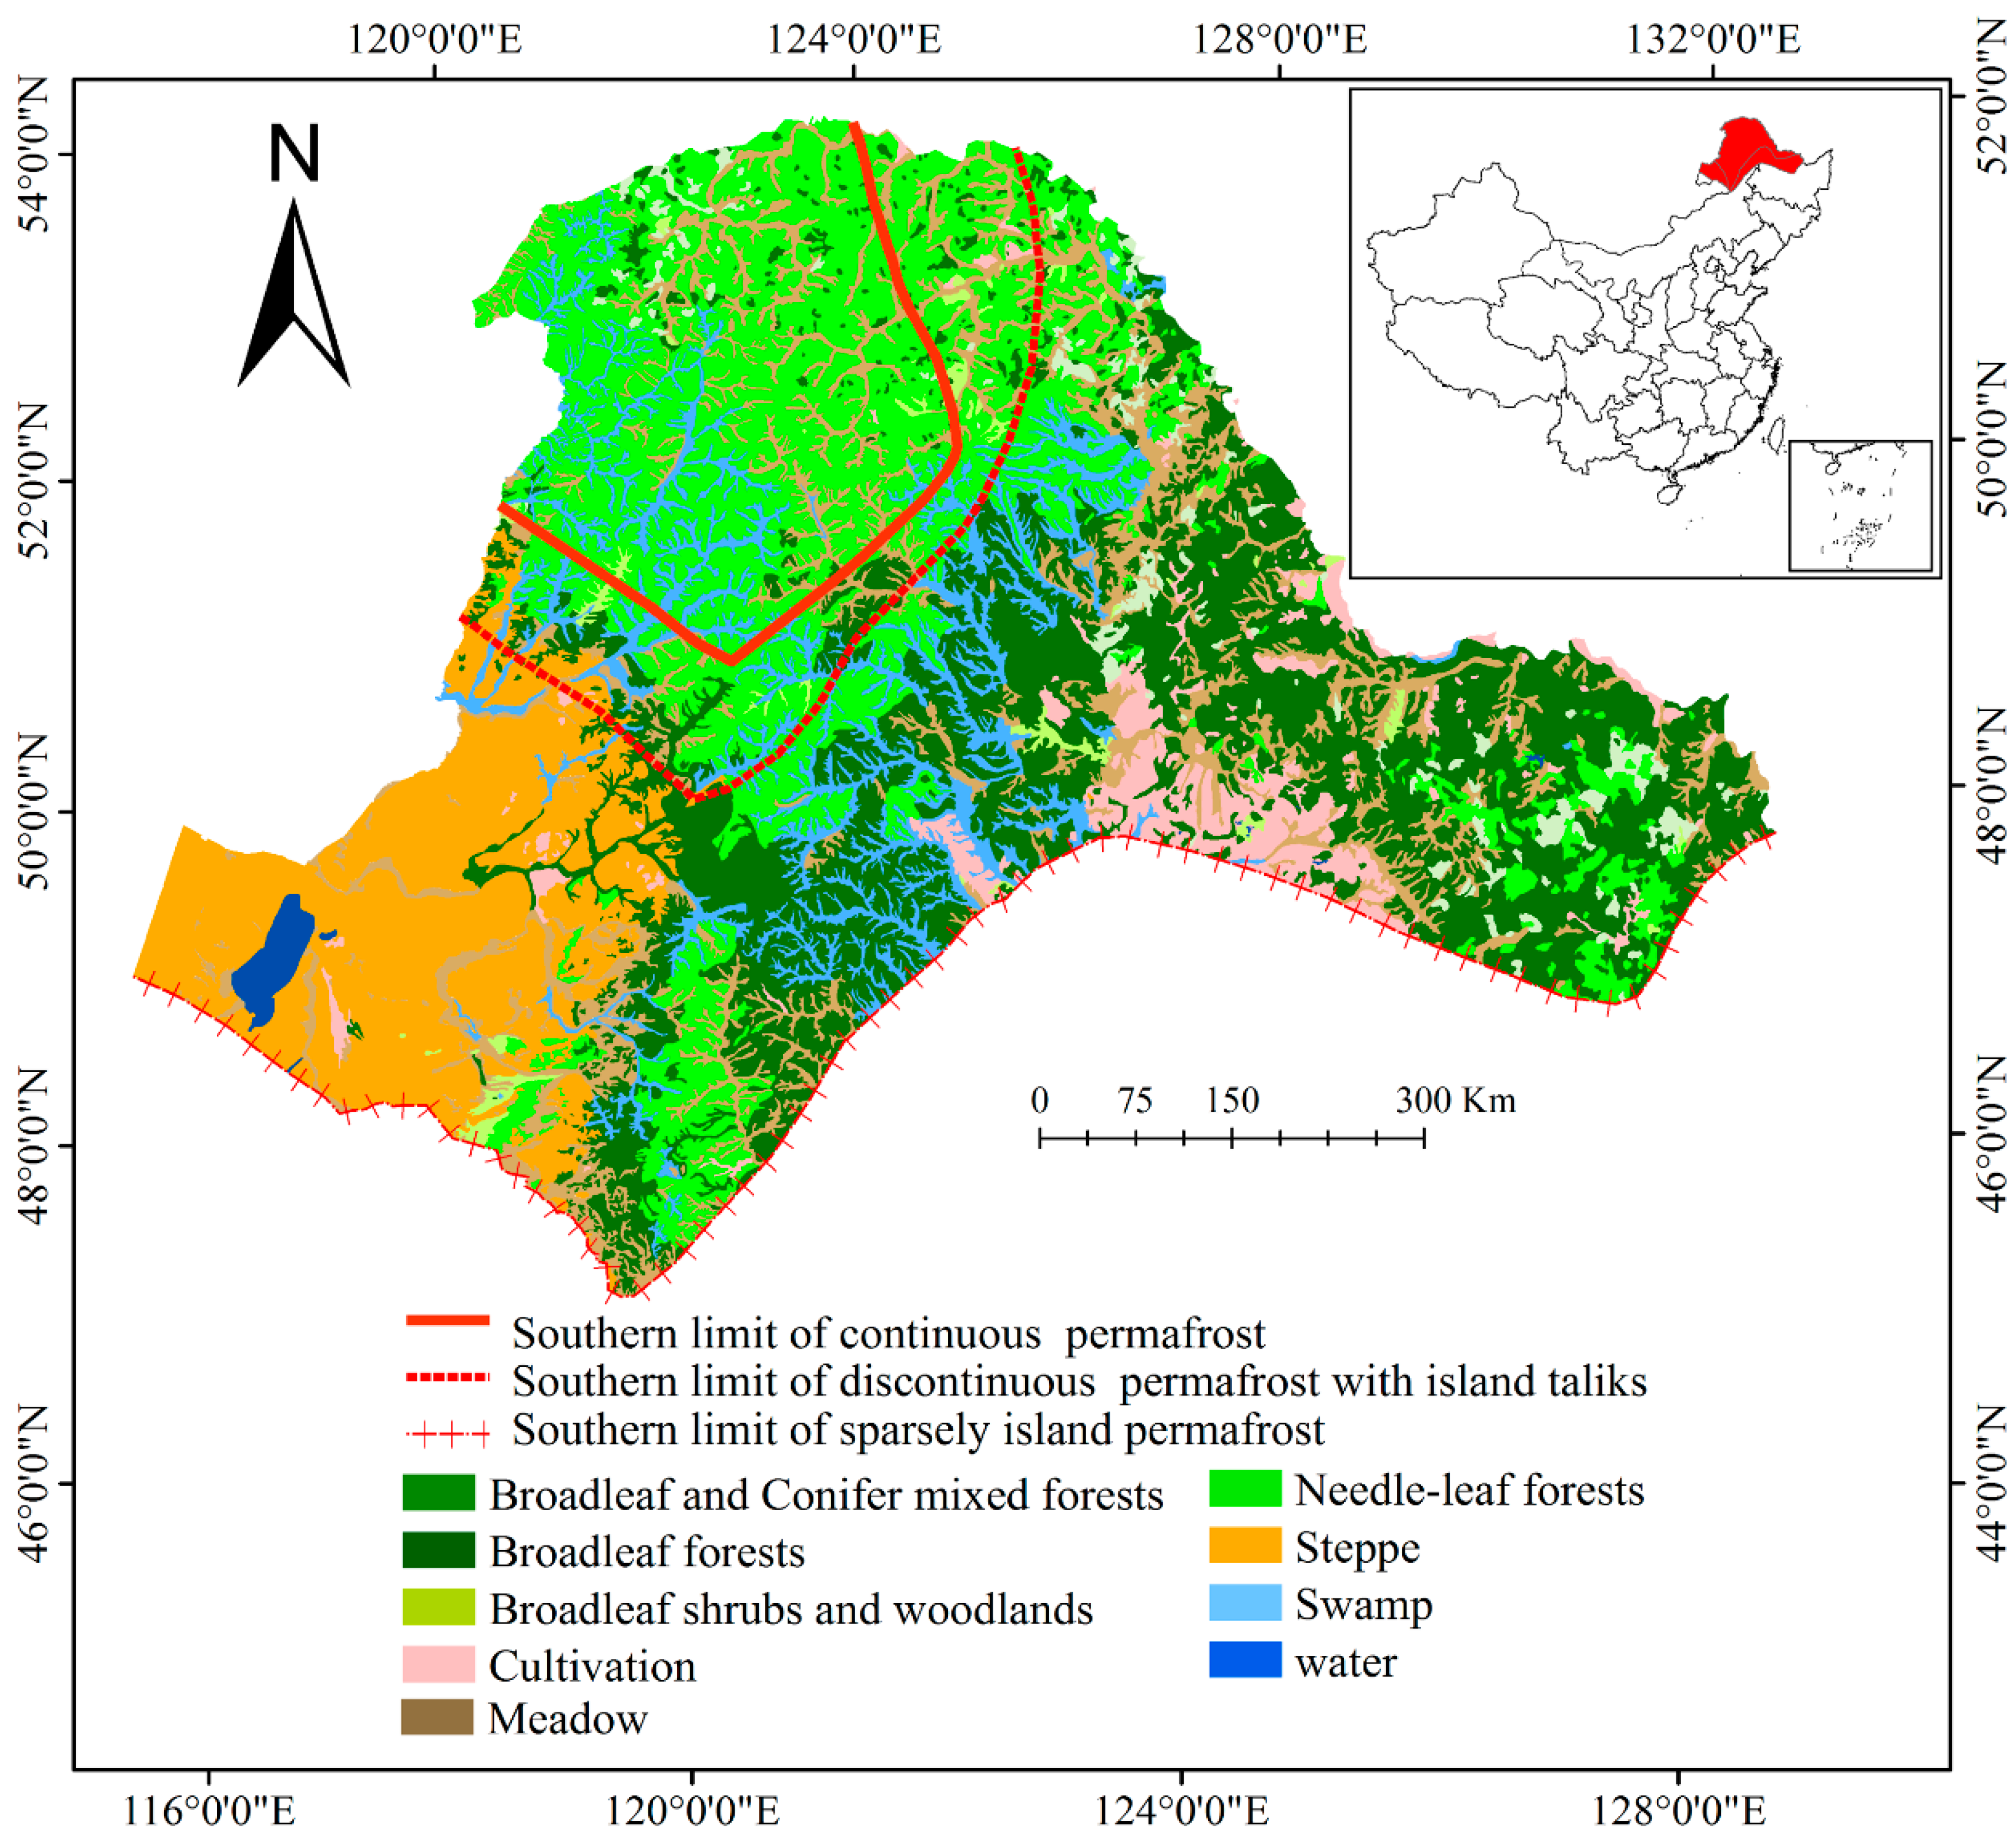
Figure 2.
Comparison of Normalization Difference Vegetation Index (NDVI) time sequences obtained from the Global Inventory Modelling and Mapping Studies (GIMMS) NDVI data, Long Term Data Record (LTDR) AVH13C1, and Moderate Resolution Imaging Radiometer (MODIS) MOD13C2 for the permafrost region of northeastern China. (a) Monthly NDVI time series of the LTDR, MODIS, and GIMMS datasets from 1995 to 2005. (b) AVH13C1 (blue) and MOD13C2 (red) versus the GIMMS NDVI data. (c) Annual NDVI time series of the LTDR, MODIS, and GIMMS datasets from 1982 to 2006 (time series of GIMMS NDVI provided was from July 1981 to December 2006).
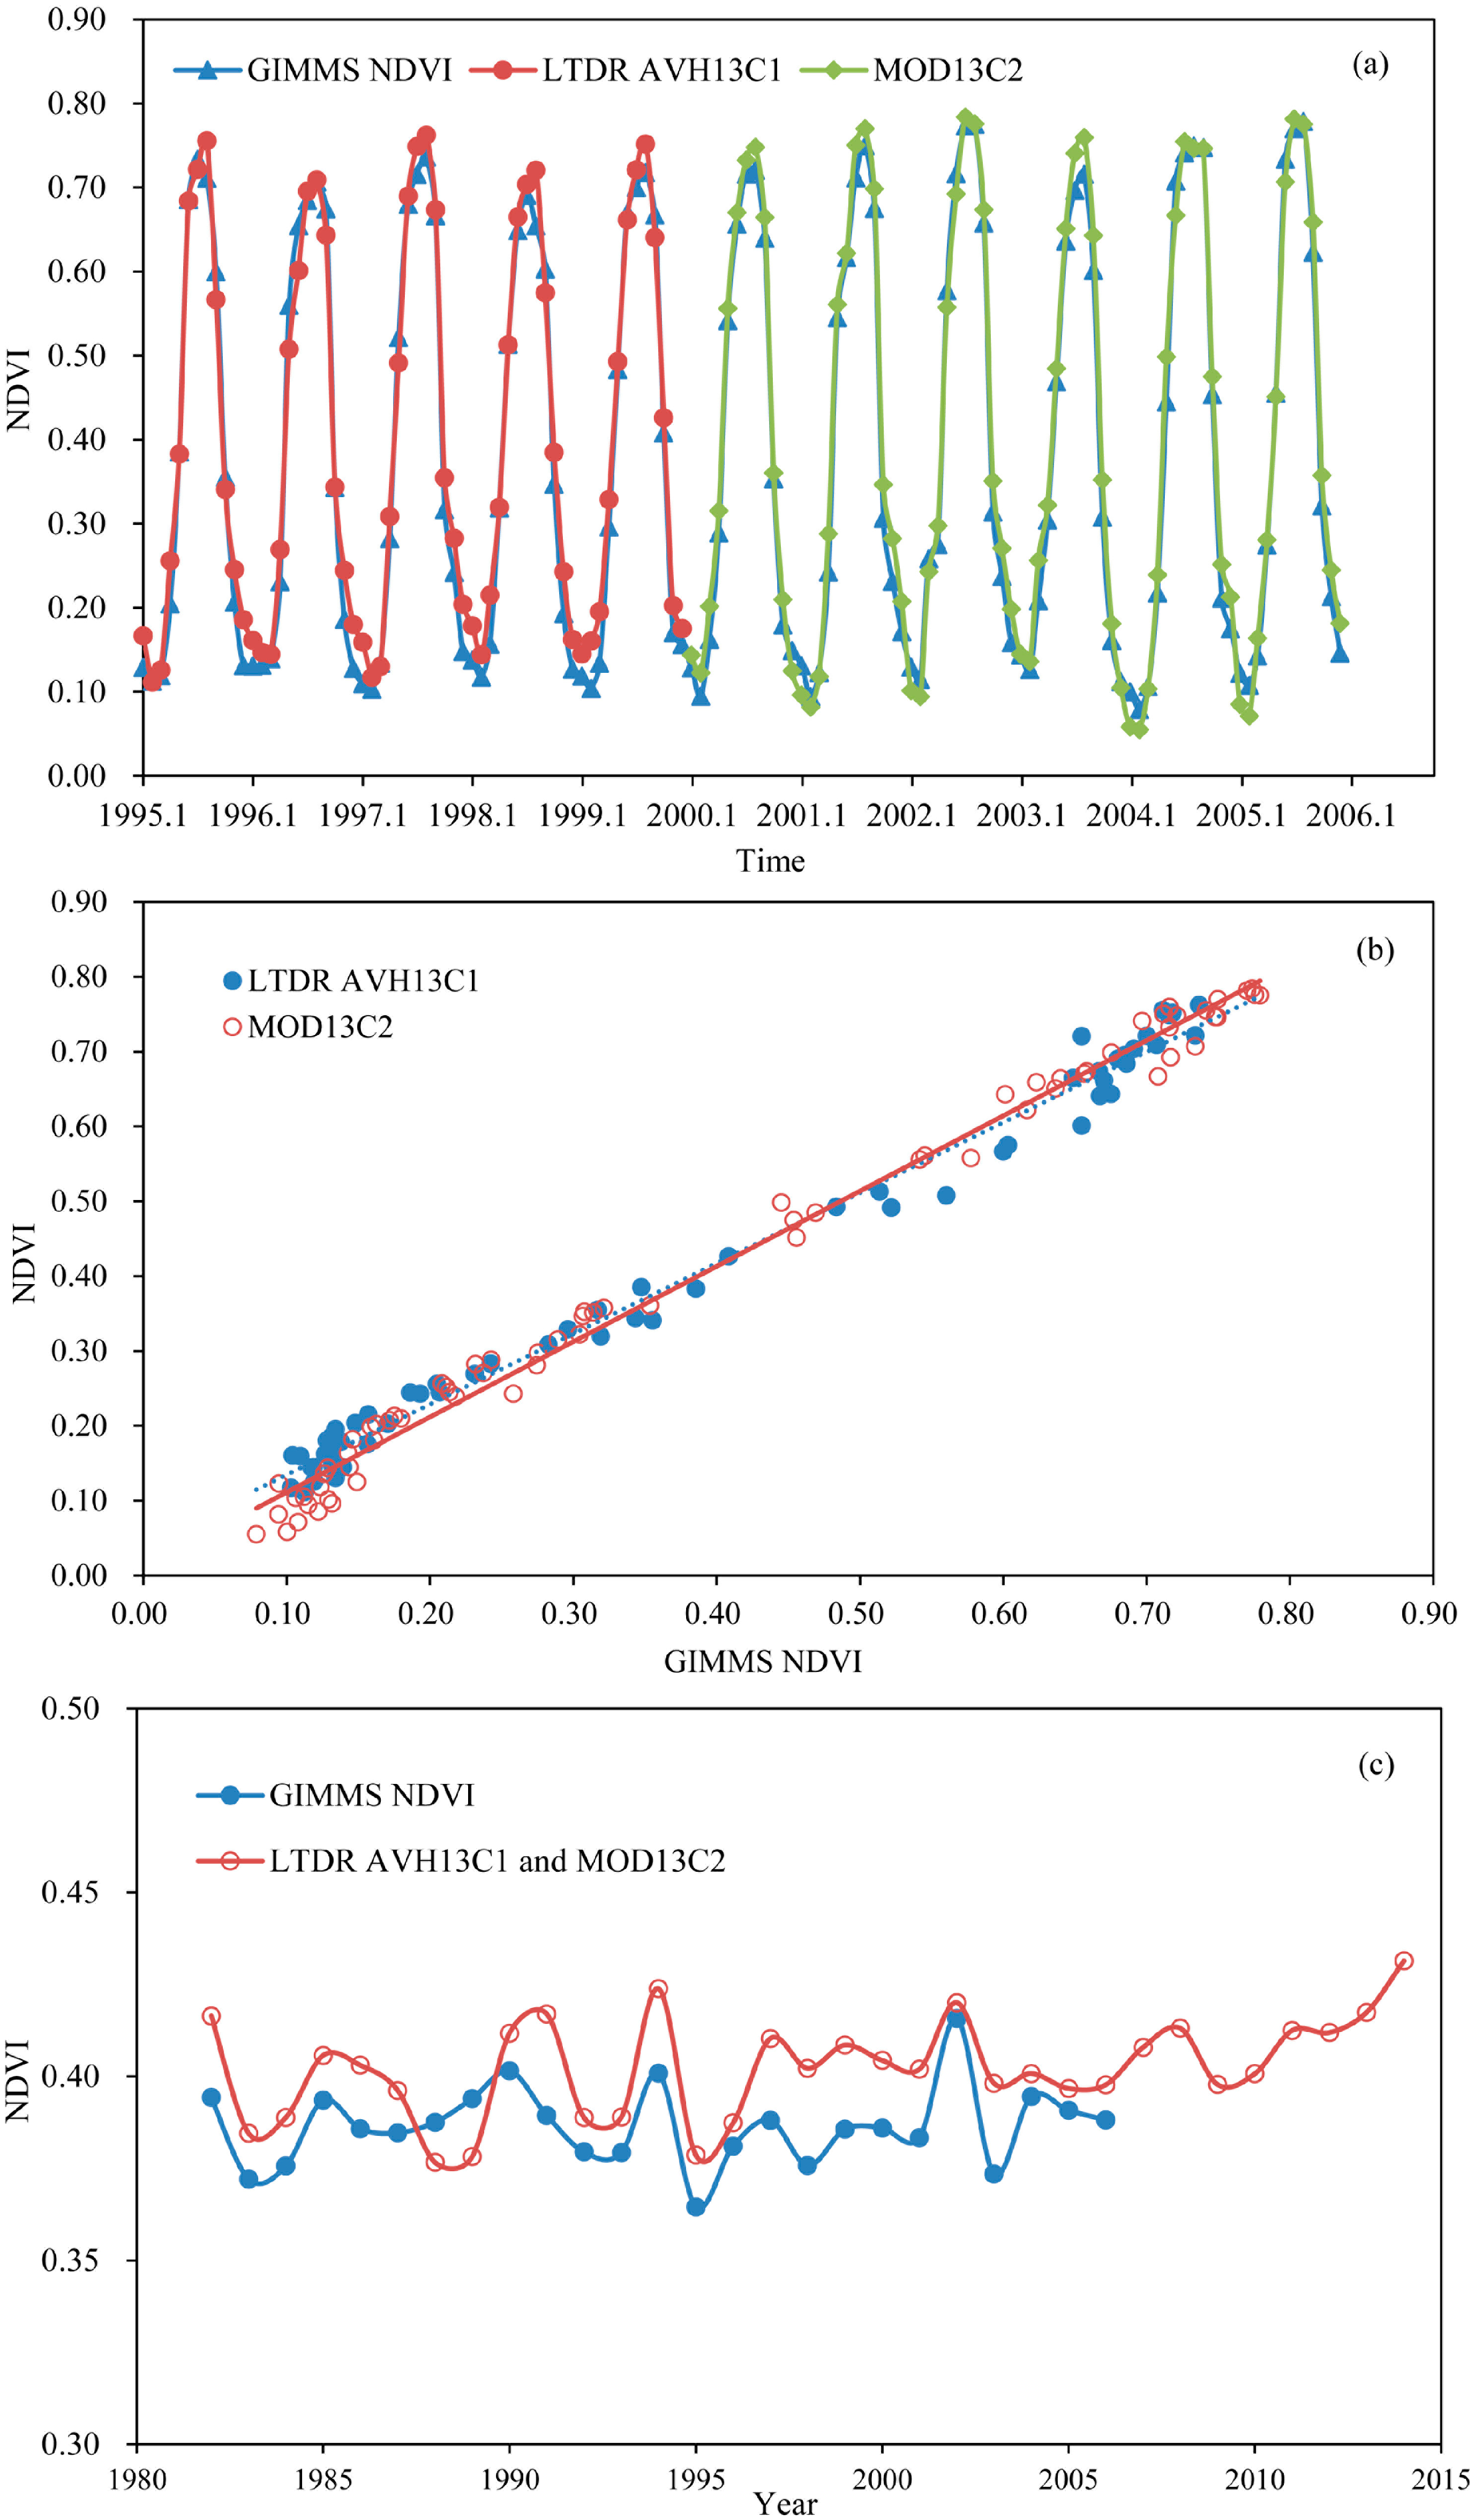
Figure 3.
Trend in spatial average growing-season mean NDVI and growing-season average ground surface temperature (a) and correlation between growing-season mean NDVI and growing-season average ground surface temperature over the entire permafrost zone of northeastern China, 1981–2014 (b).
Figure 3.
Trend in spatial average growing-season mean NDVI and growing-season average ground surface temperature (a) and correlation between growing-season mean NDVI and growing-season average ground surface temperature over the entire permafrost zone of northeastern China, 1981–2014 (b).

Figure 4.
Spatial variations in the mean growing-season NDVI values for the permafrost zone in northeastern China from 1981–2014. (a) Magnitude and Statistical test at 5% level of significance (b).
Figure 4.
Spatial variations in the mean growing-season NDVI values for the permafrost zone in northeastern China from 1981–2014. (a) Magnitude and Statistical test at 5% level of significance (b).
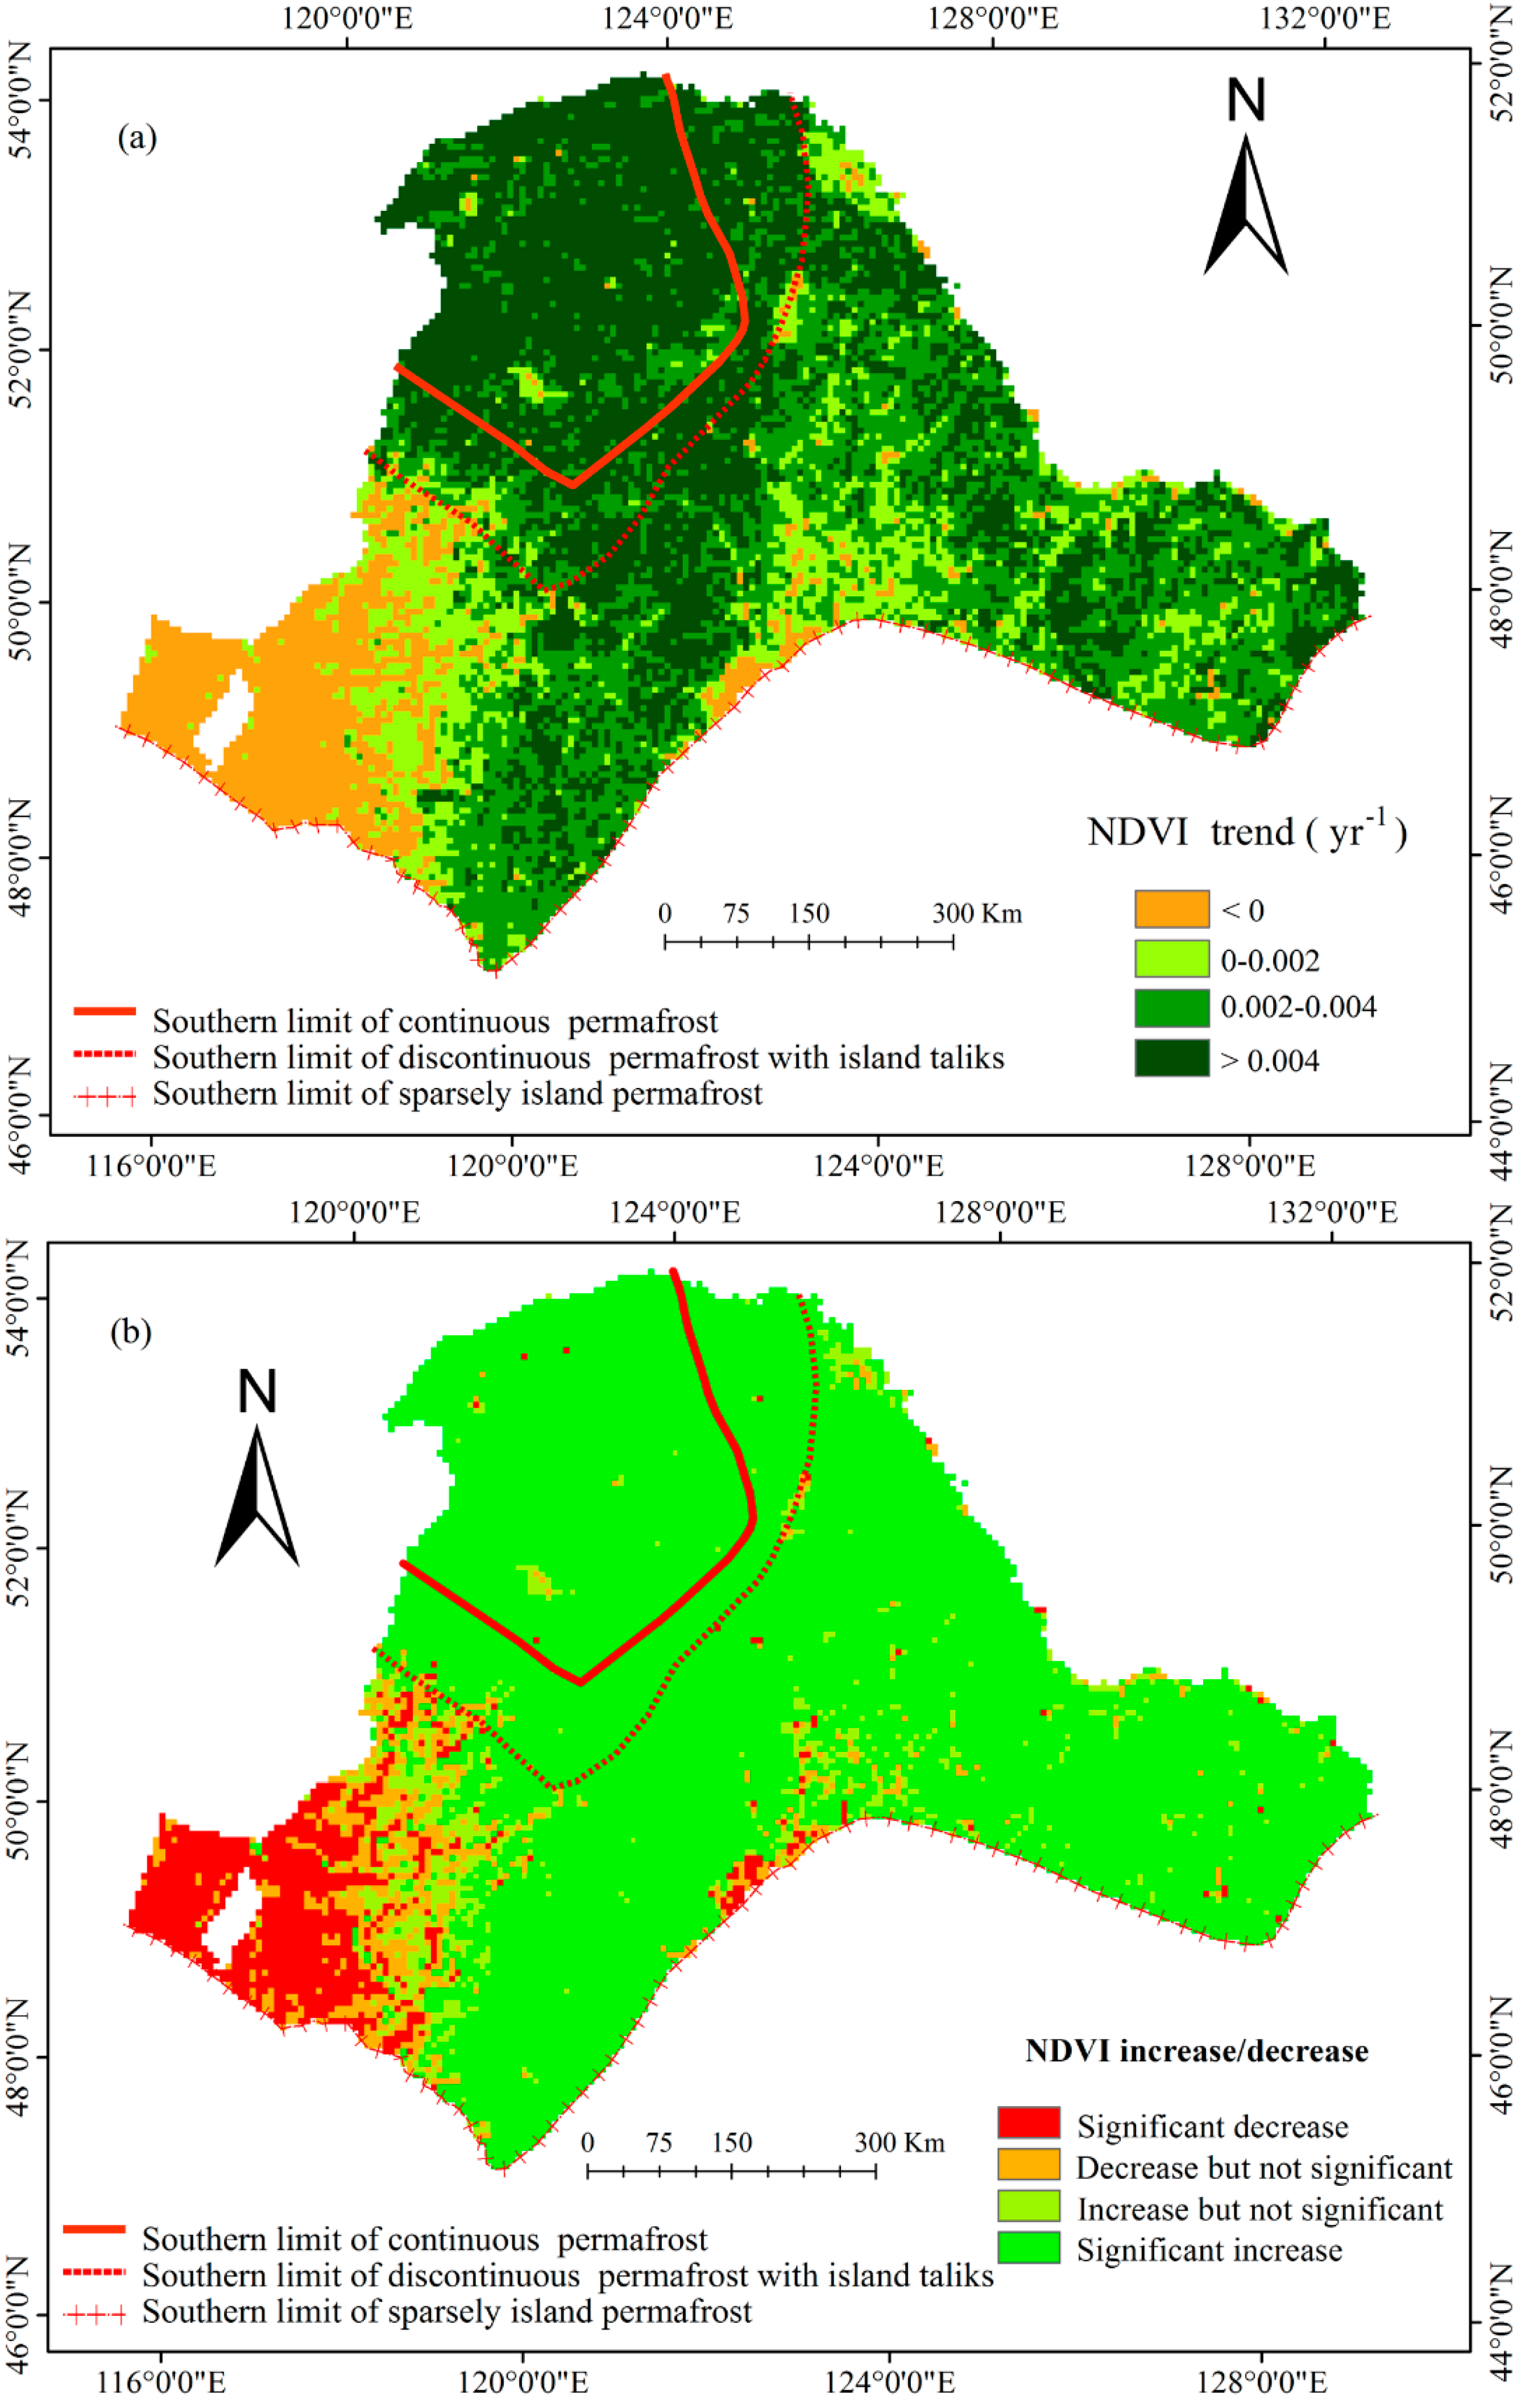
Figure 5.
Spatial correlations between mean growing-season NDVI and growing-season average ground surface temperature for the permafrost zone in northeastern China from 1981 to 2014. * and ** correspond to 5% and 1% levels of statistical significance, respectively.
Figure 5.
Spatial correlations between mean growing-season NDVI and growing-season average ground surface temperature for the permafrost zone in northeastern China from 1981 to 2014. * and ** correspond to 5% and 1% levels of statistical significance, respectively.
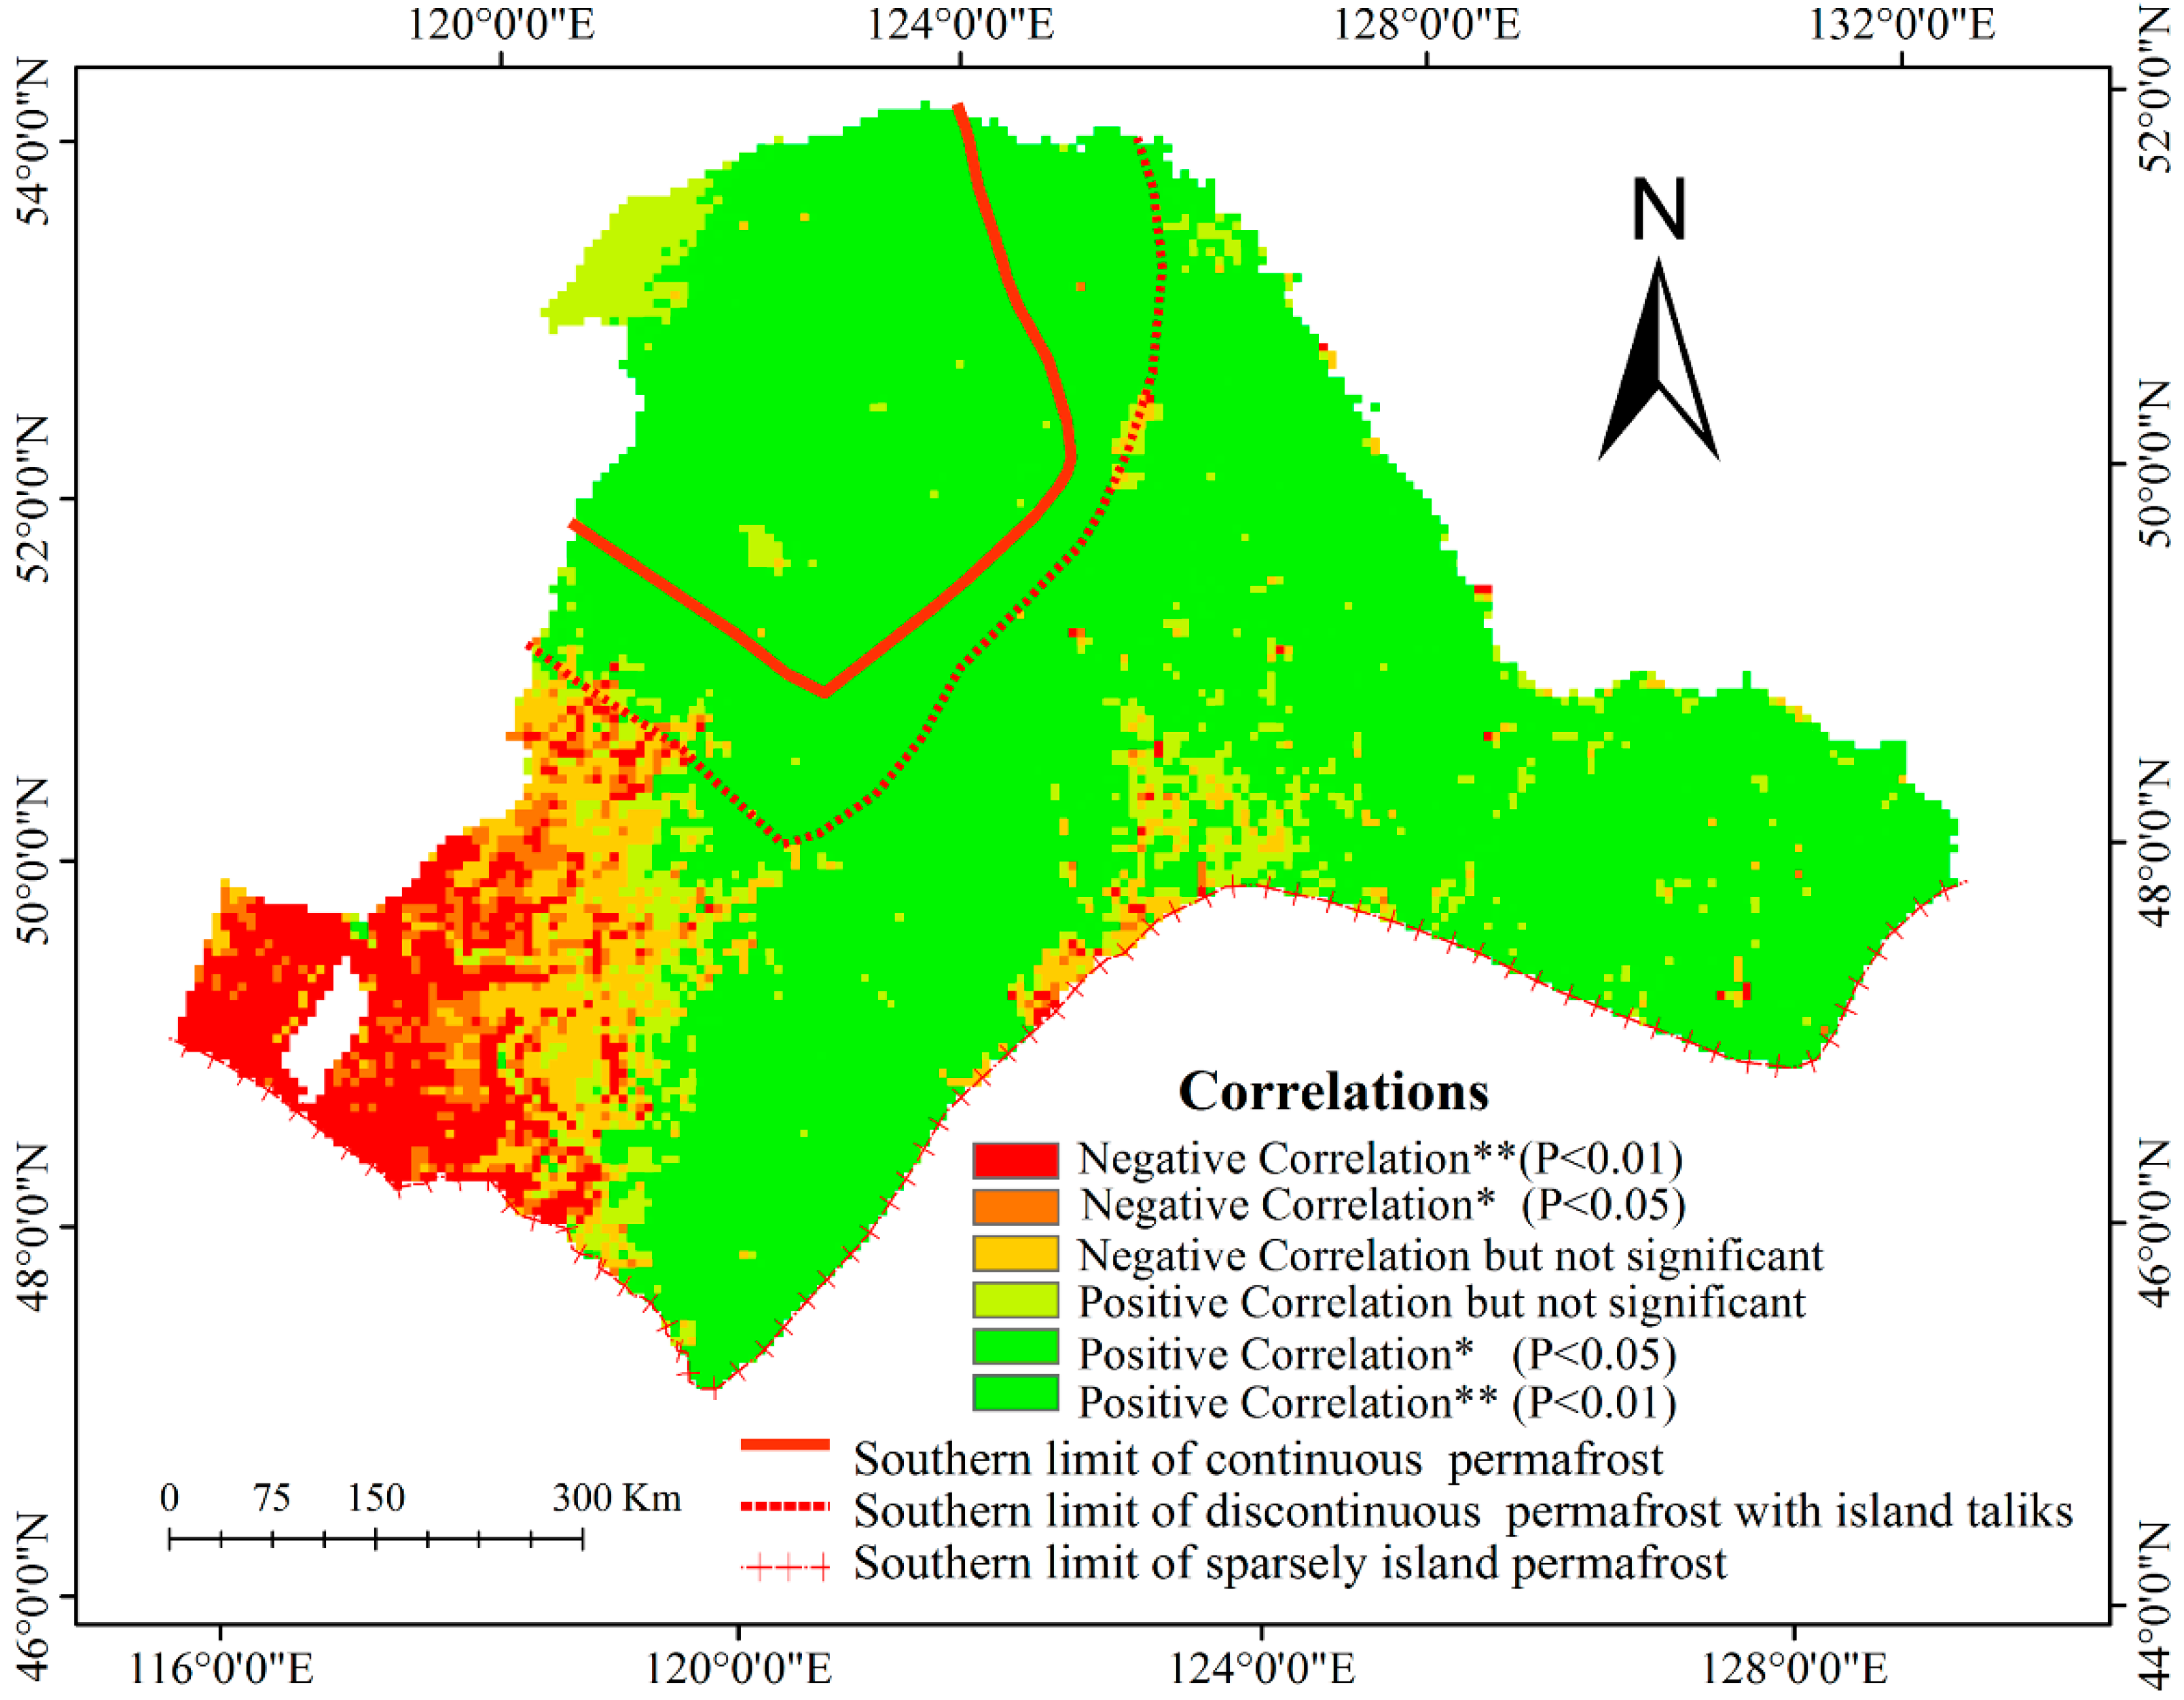
Figure 6.
Trend in spatial average growing-season mean NDVI values over the various types of permafrost zones from 1981–2014 (CP: continuous permafrost zone; DIP: discontinuous permafrost with island taliks; SIP: sparse islands of permafrost zone).
Figure 6.
Trend in spatial average growing-season mean NDVI values over the various types of permafrost zones from 1981–2014 (CP: continuous permafrost zone; DIP: discontinuous permafrost with island taliks; SIP: sparse islands of permafrost zone).


Table 1.
Correlation coefficients between mean growing-season NDVI and growing-season mean ground surface temperature among different permafrost types (CP: continuous permafrost zone; DIP: discontinuous permafrost with island taliks; SIP: sparsely island permafrost zone). ** indicates a 0.01 level of significance.
| Permafrost Types | Correlation Coefficients |
|---|---|
| CP | 0.754 ** |
| DIP | 0.821 ** |
| SIP | 0.718 ** |
© 2017 by the authors. Licensee MDPI, Basel, Switzerland. This article is an open access article distributed under the terms and conditions of the Creative Commons Attribution (CC BY) license (http://creativecommons.org/licenses/by/4.0/).
Share and Cite
MDPI and ACS Style
Guo, J.; Hu, Y.; Xiong, Z.; Yan, X.; Li, C.; Bu, R. Variations in Growing-Season NDVI and Its Response to Permafrost Degradation in Northeast China. Sustainability 2017, 9, 551. https://doi.org/10.3390/su9040551
AMA Style
Guo J, Hu Y, Xiong Z, Yan X, Li C, Bu R. Variations in Growing-Season NDVI and Its Response to Permafrost Degradation in Northeast China. Sustainability. 2017; 9(4):551. https://doi.org/10.3390/su9040551
Chicago/Turabian StyleGuo, Jinting, Yuanman Hu, Zaiping Xiong, Xiaolu Yan, Chunlin Li, and Rencang Bu. 2017. "Variations in Growing-Season NDVI and Its Response to Permafrost Degradation in Northeast China" Sustainability 9, no. 4: 551. https://doi.org/10.3390/su9040551
Note that from the first issue of 2016, this journal uses article numbers instead of page numbers. See further details here.