
Empirical Study of China’s Provincial Carbon Responsibility Sharing: Provincial Value Chain Perspective

1
School of Economy & Trade, Hunan University, No. 109 Shi Jia Chong Road, Changsha 410079, China
2
Two-Oriented Society Research Institute of Hunan University, No. 2 South Lushan Road, Changsha 410012, China
3
Institutes of Science and Development, Chinese Academy of Sciences, Beijing 100190, China
4
Collaborative Innovation Center for Territorial Sovereignty and Maritime Rights of Wuhan University, Wuhan 430072, China
5
School of Public Policy and Management, University of Chinese Academy of Sciences, Beijing 100049, China
*
Authors to whom correspondence should be addressed.
Sustainability 2017, 9(4), 569; https://doi.org/10.3390/su9040569
Submission received: 30 November 2016
/
Revised: 23 March 2017
/
Accepted: 4 April 2017
/
Published: 8 April 2017
(This article belongs to the Special Issue Sustainable Governance in Northeast Asia: Challenges for Sustainable Frontier)
Abstract
:Against the background of global warming, China has vowed to meet a series of carbon emissions reduction targets and plans to launch a national carbon emissions rights trading market by 2017. Therefore, from the provincial value chain perspective, using input-output tables from China in 2002, 2007, and 2010, this study constructs models to calculate the CO2 emissions responsibility of each province under the production, consumption, and value capture principles, respectively. Empirical results indicate that Shandong, Hebei, Jiangsu, Guangdong, and Henan bear the most responsibility for CO2 emissions under the three principles in China, while Hainan and Qinghai have the least responsibility. However, there is a great difference in the proportion of carbon emissions responsibility for each province during the same period under different principles or different periods under the same principle. For consumption-oriented areas such as Beijing, Tianjin, Zhejiang, Shanghai, and Guangdong, the production principle is more favorable, and the consumption principle is more beneficial for production-oriented provinces such as Hebei, Henan, Liaoning, Shanxi, Inner Mongolia, and Shaanxi. However, the value capture principle strikes a compromise of the CO2 emissions responsibility of each province between the production and consumption principles, and it shares the CO2 emissions responsibility based on the actual value captured by each province in the provincial value chain. The value capture principle is conducive to the fair and reasonable division of CO2 emissions rights of each province by sectors, as well as the construction of a standardized carbon emissions rights trading market.
1. Introduction
The State Council issued the “13th Five-Year” program to control greenhouse gas emissions on October 2016, which proposed that CO2 emissions per unit GDP (Gross Domestic Product) should be cut by 18% from the 2015 levels by 2020. Additionally, the national carbon emissions rights trading market will be launched by 2017. It means that all provinces will be included in a trading system to achieve the carbon reduction targets. Therefore, it is critical to determine the reasonable shares of carbon emissions responsibilities and rights. If one divides the carbon emissions reduction responsibility and carbon emissions rights totally in accordance with the principles of production, consumption, or some shared responsibility based on production and consumption principles, it may involve issues such as fairness and efficiency. In addition to promoting the coordinated development of economic growth in China, the separation of production and consumption places implies inter-provincial carbon emissions transfer. Moreover, the great differences in the provincial economic development levels, industrial structures, and natural conditions and other economic development conditions may result in different capacities to bear the carbon emissions reduction responsibility among provinces. Therefore, from the perspective of the provincial value chain, this study makes use of the economic link directly and indirectly among sectors in input-output tables, and tracks the value captured by all participants in the production chain and the amount of carbon emissions, thus allocating their corresponding carbon emissions reduction responsibilities in accordance with their abilities. This is propitious to determining reasonable carbon emissions reduction measures, scientifically allocating carbon emissions reduction responsibilities, and providing theoretical support for the realization of carbon emissions reduction targets and the establishment of a carbon emissions trading system.
Domestic and foreign scholars conducted a series of studies on the principles of carbon emissions responsibilities. The earliest is the principles of historical responsibility and fairness, which were first put forward in the World Climate Conference. These principles state that countries that consumed atmospheric space in the past which caused climate change should now bear moral responsibility. No generation can discharge too much greenhouse gas without compensating for it. However, these principles depend on the data of the environmental resources consumption around countries or regions over the years. The lack of historical data makes it difficult to accurately measure their emissions responsibilities, coupled with the opposition of most developed countries, resulting in the failure of adoption (Wang and Huang, 2011) [1].
With the refinement of the global production division, some scholars compartmentalize the international CO2 emissions responsibility from the production, consumption, and income sides. They have proposed four basic principles to divide the global carbon emissions reduction responsibility: the principles of production, consumption, shared responsibility, and income liability. Since the 1997 Kyoto Protocol, the principle of production has become the basic principle of international climate policy and international negotiations. It advocates that “the responsibility for carbon emissions should be borne by the producer”. The international transfer of production activities optimizes the allocation of resources and promotes the economic growth, technological progress, employment, and social welfare of production places. Thus being a “beneficiary” of international trade, these countries should bear more responsibility for carbon emissions reduction. This means that under the production principle, the Parties to the Kyoto Protocol bear the corresponding emissions reduction responsibility for carbon emissions that are directly generated by production within their borders. However, its fairness has been questioned. Schaeffer and Sa, 1996 [2], Tolmasquim and Machado, 2003 [3], and Csutora and Vetőné mózner, 2014 [4] have argued that this principle is not conducive to emerging countries and may lead to plight in climate policy negotiations. Moreover, this territorial principle does not include the carbon emissions generated during transportation and is more likely to generate “carbon leakage” (Pan et al., 2008) [5].
In order to compensate for the shortcomings of the production principle, academic circles have focused on the consumption principle. The consumption principle argues that countries with low environmental regulation in free trade have cost advantages in regards to pollution-intensive products, causing the transfer of pollution-intensive industries in countries with high environmental regulation, and resulting in transfer-in countries becoming the pollution shelter of transfer-out countries, (Copeland and Taylor, 1994; Ederington, 2007) [6,7]. These countries should be responsible for CO2 emissions. Wyckoff and Roop, 1994 [8] argued that a country can achieve its goal of reducing its domestic emissions by outsourcing production and increasing imports. Thus, the diversification of consumption products and the reduction of pollution emissions increase the social welfare of outsourced countries, and the consumption principle of “the responsibility for carbon dioxide emissions should be borne by the consumer” shall be held (Munksgaard and Pedersen, 2001) [9]. Although the consumption principle can effectively solve the “carbon leakage” and “carbon transfer” problem as opposed to the production principle, it is unfair to those economically developed countries that have more consumption than production, such as the United States and Japan (Peters, 2008) [10]. Therefore, it is difficult to accept allocating carbon responsibility under either the production or consumption principles. As the stakeholders of carbon emissions responsibility and economy, both the production and consumption principles are difficult at reflecting fairness. Therefore, the principles of shared responsibility and income have been gradually recognized by scholars.
The principle of shared responsibility refers to the fact that producers and consumers share the pollution and emissions caused by production in light of some rules. Many scholars have studied the principle of shared responsibility mainly from three aspects: (1) theoretical research on the principle of shared responsibility (Bastianoni et al., 2004; Lenzen, 2005; Lenzen et al., 2007) [11,12,13]; (2) the application of the shared responsibility principle in dividing carbon emissions responsibility caused by international trade, such as Csutora and Vetőné mózner, 2014 [4] and Peng et al., 2016 [14]; (3) the application of the shared responsibility principle in the carbon emissions responsibility for a certain country, for example, Zhang, 2012 [15] and Chang, 2013 [16] applied the principle of shared responsibility to study the division of carbon emissions responsibility for China’s various sectors. Ferng, 2003 [17] constructed a framework for estimating the carbon liability of a country or districts from the perspective of the interest principle and the ecological deficit, and analyzed the data of Taiwan from 1996. Andrew and Forgie, 2008 [18] used input-output analysis to study the greenhouse gas emissions responsibility of New Zealand under the principles of production, consumption, and shared responsibility, and found that compared with traditional production or consumption principles, the principle of shared responsibility was more likely to be accepted. Lenzen and Murray, 2010 [19] established a framework for quantifying the responsibility for downstream carbon footprints and the structural path analysis model (SPA), which was applied to analyze the division of carbon emissions responsibility in Australia. The principle of shared responsibility offsets the shortcomings of the principles of production and consumption. However, as stakeholders, producers and consumers achieve a mutually acceptable shared responsibility, and this plight may occur in global climate negotiations.
Based on the supply perspective, the principle of income responsibility uses the Ghosh model of input-output to measure the direct and indirect pollution emissions caused by the initial supply, that is, the downstream perspective. In contrast, the consumption principle views the upstream perspective, which uses the Leontief inverse matrix in the input-output model to measure direct and indirect pollution emissions caused by the final demand. Lenzen and Murray, 2010 [19] pointed out that the existing studies from the downstream perspective that track the carbon footprint were fewer, mainly due to the lack of a clear definition of downstream responsibility. Therefore, under the definition of upstream and downstream responsibilities, they took the Australian industry as an example and analyzed its carbon footprint. Marques et al., 2011 [20] studied the carbon emissions embodied in trade from the downstream perspective. Marques et al., 2012 [21] also proposed “income liability” to measure the carbon responsibility of countries from the downstream perspective. Marques et al., 2013 [22] further studied the geographical isolation between the place of international trade income and the place of carbon emissions from the principle of income responsibility in the downstream perspective. Zhang, 2015 [23] studied the carbon emissions responsibility and made a comparative analysis using the inter-provincial input-output model of China under the principles of production, consumption, income responsibility, and four shared responsibilities.
In summary, extant research on the principles of shared carbon emissions responsibility has focused on the principles of production, consumption, and shared responsibility. Due to carbon emissions transfer and carbon leakage between the provinces in China, there are significant differences in the value captured by each province from the provincial production value chain. Therefore, it is reasonable to divide the amount of carbon emissions by the value captured by each province and sector in the production value chain. Currently, there has been little work to investigate the carbon emissions responsibility among all the provinces based on the combination of input-output methods, shared responsibility ideas, and the provincial value chain perspective. Zhang and Wei, 2016 [24] put forward the value capture principle which not only contains “shared responsibility”, but also includes “beneficiaries should pay for carbon emissions” and “those who are capable shall pay”. It is more reasonable for all participants to allocate emissions under the value capture principle. It also provides theoretical support for the development of fair and reasonable inter-provincial environmental policies and emissions reduction policies.
From the provincial value chain perspective, based on the input-output tables of China from 2002, 2007, and 2010, this study constructs models to calculate the amounts of CO2 emissions responsibility of each province under the principles of production, consumption, and value capture, respectively. This will provide support for dividing the carbon emissions responsibility, building carbon emissions trading systems, and meeting the carbon reduction commitments for China’s provinces.
2. Materials and Methods
2.1. Data Preparation
The 30-province and 30-sector inter-provincial input-output tables (2002, 2007, and 2010) of China were obtained from the Chinese Academy of Sciences Research Center on Fictitious Economy and Data Science (http://free.xiaze.com). These tables include the 30 major provinces in China, excluding Hong Kong, Macau, Taiwan, and Tibet. This study merged the five categories of final demands (rural residents’ consumption, urban residents’ consumption, government consumption expenditure, fixed capital formation, and inventory increase) in the input-output table into one category. In other words, the final demands of all provinces are a column vector. Also, the element structure of the value added is not taken into account in this study, therefore the value added is only a row vector (as shown in Table 1).
With reference to the method proposed by Zhang, 2015 [23], we estimated the carbon emissions of different provinces and sectors. The concrete steps are as follows: firstly, the energy consumption data for China’s provinces in 2002, 2007, and 2010 were obtained from the China Energy Statistical Yearbook (in 2003, 2008, and 2011) (http://free.xiaze.com). The industrial energy consumption by sectors were obtained from the provincial Statistical Yearbook, and the energy consumption data of agriculture and services were from the “comprehensive energy balance table” for the provinces published by the China Energy Statistical Yearbook. Secondly, the collected data were compiled into the energy consumption data of the 30 sectors for the 30 provinces in China. The carbon emissions factors of various fuels were calculated with reference to IPCC (Intergovernmental Panel on Climate Change). Finally, the amount of major fossil fuels consumed by each province and sector were multiplied by the corresponding carbon emissions factors to calculate the CO2 emissions from the 30 provinces by the 30 sectors in China. The amount of CO2 emitted from the 30 provinces by 30 sectors was divided by the total output of each province by its sectors, and then the carbon emissions coefficient of each province by each sector was obtained, that is, the amount of CO2 emissions per unit of output from each province by each sector.
The matrices in Table 1 are defined as follows: Zij is the intermediate demand matrix from Pi to Pj, and its dimension is m×m; fij is the final demand vector from Pi to Pj, and its dimension is m×1; Xi and Ei are the total output vector and the export vector of Pi, respectively, and their dimensions are m×1; Mi, Vi, and Ci are imports, value added, and CO2 emissions vectors of Pi, respectively, and their dimensions are 1×m. The superscript (’) indicates that the vector or matrix is transposed.
2.2. Model Specification
The equilibrium relationship of the row direction in Table 1 is:
If the direct consumption coefficient matrix is , where is a m×1 column vector. Then Equation (1) can be written in the form of a matrix:
Among them, X, F, and E are the total output, the final demand, and the export matrix of all provinces by sectors, and A is the direct consumption coefficient matrix of each province by each sector. According to Equation (2), the total output of each province by its sectors can be expressed as:
In Equation (3), B is the Leontief inverse matrix, i.e., the complete demand coefficient matrix. The main difference among the three principles (production, consumption, and value capture) is that the CO2 emissions are divided differently. In fact, the CO2 emissions are due to changes in the total output caused by changes in the final demands of each province by its sectors. To divide the CO2 emissions responsibility, we explore the different paths in which the final consumption causes changes in the total output (we only consider the changes of total output and the corresponding CO2 emissions caused by the domestic final demands, regardless of export demands):
In the above formula, Xij, k is the total output of all provinces by sectors caused by the final demand of Pj to sector k of Pi, and its elements Xp, ij, k represent the total output of the pth province caused by the final demands of Pj supplied by sector k of Pi, and its dimension is m×1. p is in the range of 1,···,n.
The production principle states that “the producer should be responsible for carbon emissions”. Then according to Equation (4), the amount of CO2 emissions of the pth province and each province, which are caused by the final demands of Pj supplied by sector k of Pi, are expressed as:
cp is the CO2 emissions coefficient vector of the pth province by sectors, and its dimension is 1 × m, and cp = Cp/Xp’, p = 1,2,···,n.
If the amount of CO2 emissions of the pth province is caused by the final demands of all provinces supplied by all sectors, then under the production principle, the responsibility of CO2 emissions that the pth province should bear can be calculated by:
However, the consumption principle states that “the consumer should be responsible for carbon emissions”. Then, under the consumption principle, Pj should be responsible for the amount of CO2 emissions from all provinces caused by the final demands of Pj. According to Equations (4) and (5), the formula for calculating the CO2 emissions responsibilities of Pj (j = 1,2,···,n) can be expressed as:
where the sign is the same as that of Equation (5), and p represents the pth province. For ease of understanding, Equation (8) can be converted to:
The value capture principle proposed by Zhang and Wei, 2016 [24] concluded that the responsibilities of CO2 emissions caused by the final demands of all provinces by sectors should be allocated in accordance with the value added for economic activity participants. Then, from Equation (4), the total output of all provinces by sectors caused by the final demands of Pj supplied by sector k of Pi can be obtained, if it is multiplied by the corresponding value-added rate, and the amount of value added to each province by each sector from the whole economic activity can be determined. The specific equation is as follows:
In Equation (10), vp represents the value-added rates vector of the pth province by sectors, its dimension is 1 × m, and vp = Vp/Xp’, p = 1,2,···,n.
The purpose of the value capture principle is to divide the responsibilities of CO2 emissions in accordance with the proportions of the value added that is captured by the economic activity participants. Meanwhile, the sum of the value added to all provinces by sectors caused by the final demands is equal to its final demands. Then we can obtain the sharing ratio of the carbon emissions responsibilities for each province by sectors, caused by the final demand:
In combination with Equations (6) and (11), the amounts of CO2 emissions that the pth province should be responsible for in the CO2 emissions caused by the final demands of Pj supplied by sector k of Pi are:
When we divide the responsibility of CO2 emissions caused by the final demands of all provinces by sectors, the responsibility of the CO2 emissions that the pth province should bear are:
3. Results and Discussion
In this section, we use the above-stated Equations (7)–(9), and (13) to measure the CO2 emissions responsibility for China’s provinces under the principles of production, consumption and value capture, respectively, in 2002, 2007, and 2010. The specific results are as follows.
3.1. Dynamic Analysis of CO2 Emissions Responsibility under the Three Principles
Figure 1 shows that under the principle of production in 2002, 2007, and 2010, Shandong and Hebei bear the most carbon emissions responsibility. They account for 7% of the country’s total carbon emissions, showing an upward trend throughout the study period. Hainan and Qinghai bear the least responsibility, accounting for less than 0.5% of the total carbon emissions, and showing a downward trend. First, due to their geographical locations, Shandong and Hebei may have become the transfer of the production bases of Beijing and Tianjin, and Hainan and Qinghai have less industrial production activities. Second, Henan, Shanxi, and Jiangsu and other places closer to Shandong and Hebei bear more responsibility for carbon emissions. Dynamically, the share of carbon emissions in the Beijing-Tianjin region (Beijing and Tianjin), Shanxi, Jilin, Heilongjiang, and the eastern coastal areas (Shanghai, Jiangsu, and Zhejiang) shows a rapid decline, while Hebei, Inner Mongolia, Liaoning, Guangdong, and Guangxi and the central region of Henan, Hunan, and Jiangxi and other places show an upward trend.
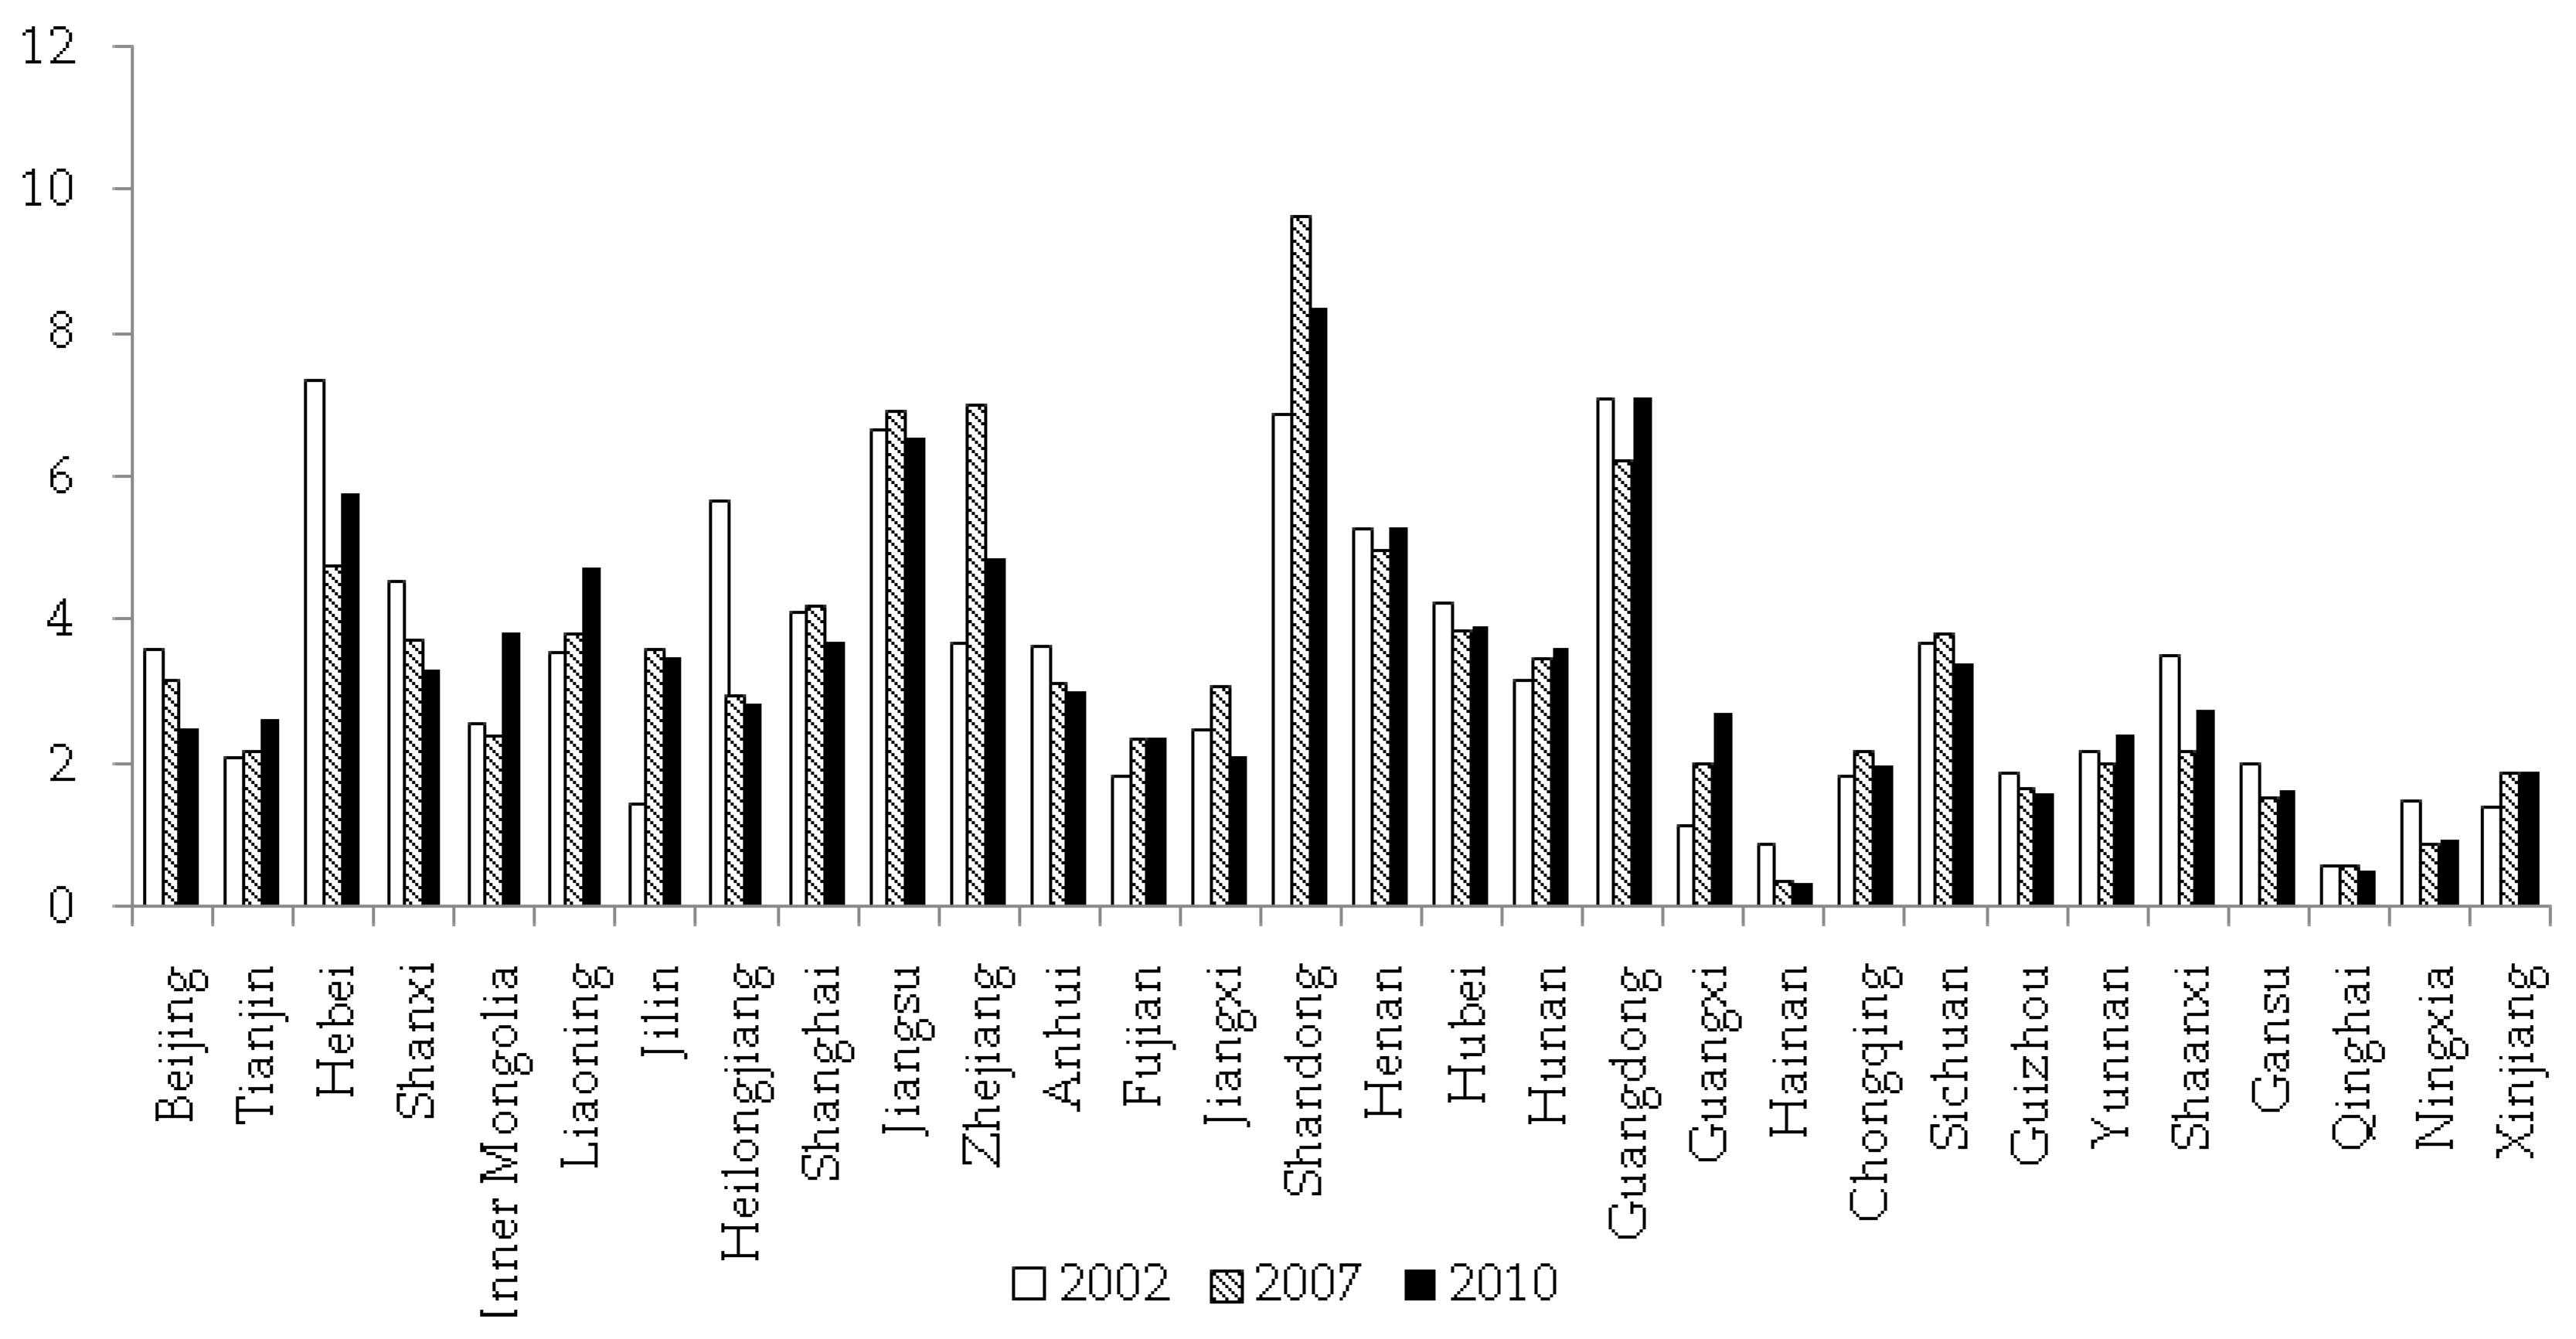
Figure 2 illustrates that under the principle of consumption, the most carbon emissions responsibility switches from Hebei in 2002 (7.34%) to Shandong in 2007 and 2010 (9.61% and 8.36%), followed by Guangdong and Jiangsu, accounting for 6%–7%. Qinghai and Hainan are the least responsible provinces for carbon emissions, and their ratios are below 1%. Dynamically, the share of carbon emissions in Beijing, Hebei, Shanxi, Heilongjiang, Guangxi, and Hainan and other places show a rapid decline. Tianjin, Inner Mongolia, Liaoning, Jilin, Zhejiang, Shandong, and Guangdong have a more substantial increase in their proportion and the other regions indicate a narrow range of fluctuations.
Figure 3 demonstrates that under the principle of value capture, Shandong has the most carbon emissions responsibility of the country’s total carbon emissions in 2002, 2007, and 2010, accounting for 7.79%, 10.46%, and 9.42%, respectively. Second, Jiangsu is charged with more carbon emissions responsibility, but its share of carbon emissions displays a downward trend, from 7.65% to 6.84%. During the entire study period, Guangdong and Hebei account for more than 6% of the total carbon emissions. Relatively speaking, Qinghai and Hainan have less responsibility for carbon emissions, with their share below 0.5%. On the whole, Beijing, Shanxi, Heilongjiang, Shanghai, Jiangsu, and Ningxia show a rapid decline in the proportion of total carbon emissions. Inner Mongolia, Liaoning, Shandong, Henan, and Guangxi have a more substantial increase in their proportions and other regions display a narrow range of fluctuations.
The comparative analysis of the carbon responsibility of the same province under different principles indicates that the home market effect is ubiquitous in the provinces (the home market effect means that products produced by the province are consumed by the province, and the value is also attributed to the province). It is not obvious for the change in the main carbon emissions responsibility under the different principles, concentrating on Shandong, Hebei, Jiangsu, Guangdong, and Henan. However, the differences are obvious for the carbon responsibility of the provinces under the different principles and years. Taking Guangdong as an example, Figure 1, Figure 2 and Figure 3 display that during the whole study period, the carbon responsibility under the principle of production is less than that under the value capture principle and the latter is less than that under the principle of consumption. Similar results are found for Beijing, Tianjin, Zhejiang, Shanghai, and other places. It is clear that the allocation of the carbon reduction responsibility under the principle of production is more favorable for these consumption-oriented provinces. For Hebei, Henan, Liaoning, Inner Mongolia, and Shanxi, the carbon emissions responsibility under the production principle is greater than that under the value capture principle, and the latter is greater than that under the consumption principle, indicating that the consumption principle is easily accepted by these provinces. For Shandong, Jiangsu, Shaanxi, and Hunan, the carbon emissions responsibility under the principle of value capture is greater than that under the principles of production and consumption. For Gansu, Guizhou, and Anhui, the carbon emissions responsibility under the principle of production is greater than that under the principle of consumption, and the latter is greater than that under the principle of value capture.
Overall, the different principles of responsibility have different interests for different provinces. Compared to the provinces’ existing economic development in Figure 4, that is, the contribution to GDP, we can conclude that the provinces’ emissions reduction capacity is quite different. In general, carbon responsibility under the principle of value capture is in accordance with economic capabilities. This is because the use of the value capture principle to share the carbon emissions responsibility can be accepted by the provinces, with strong fairness. It also enables the provinces to have the ability to reduce emissions and improve the emissions reduction efficiency.
3.2. Dynamic Comparative Analysis of CO2 Emissions Responsibility of Each Province under the Three Principles
In order to perform a dynamic comparative analysis, we calculate the relative change rates of consumption-based emissions to production-based emissions, value capture-based emissions to production-based emissions, and value capture-based emissions to consumption-based emissions for each province respectively in 2002, 2007, and 2010.
3.2.1. A Comparison between the Principles of Consumption and Production
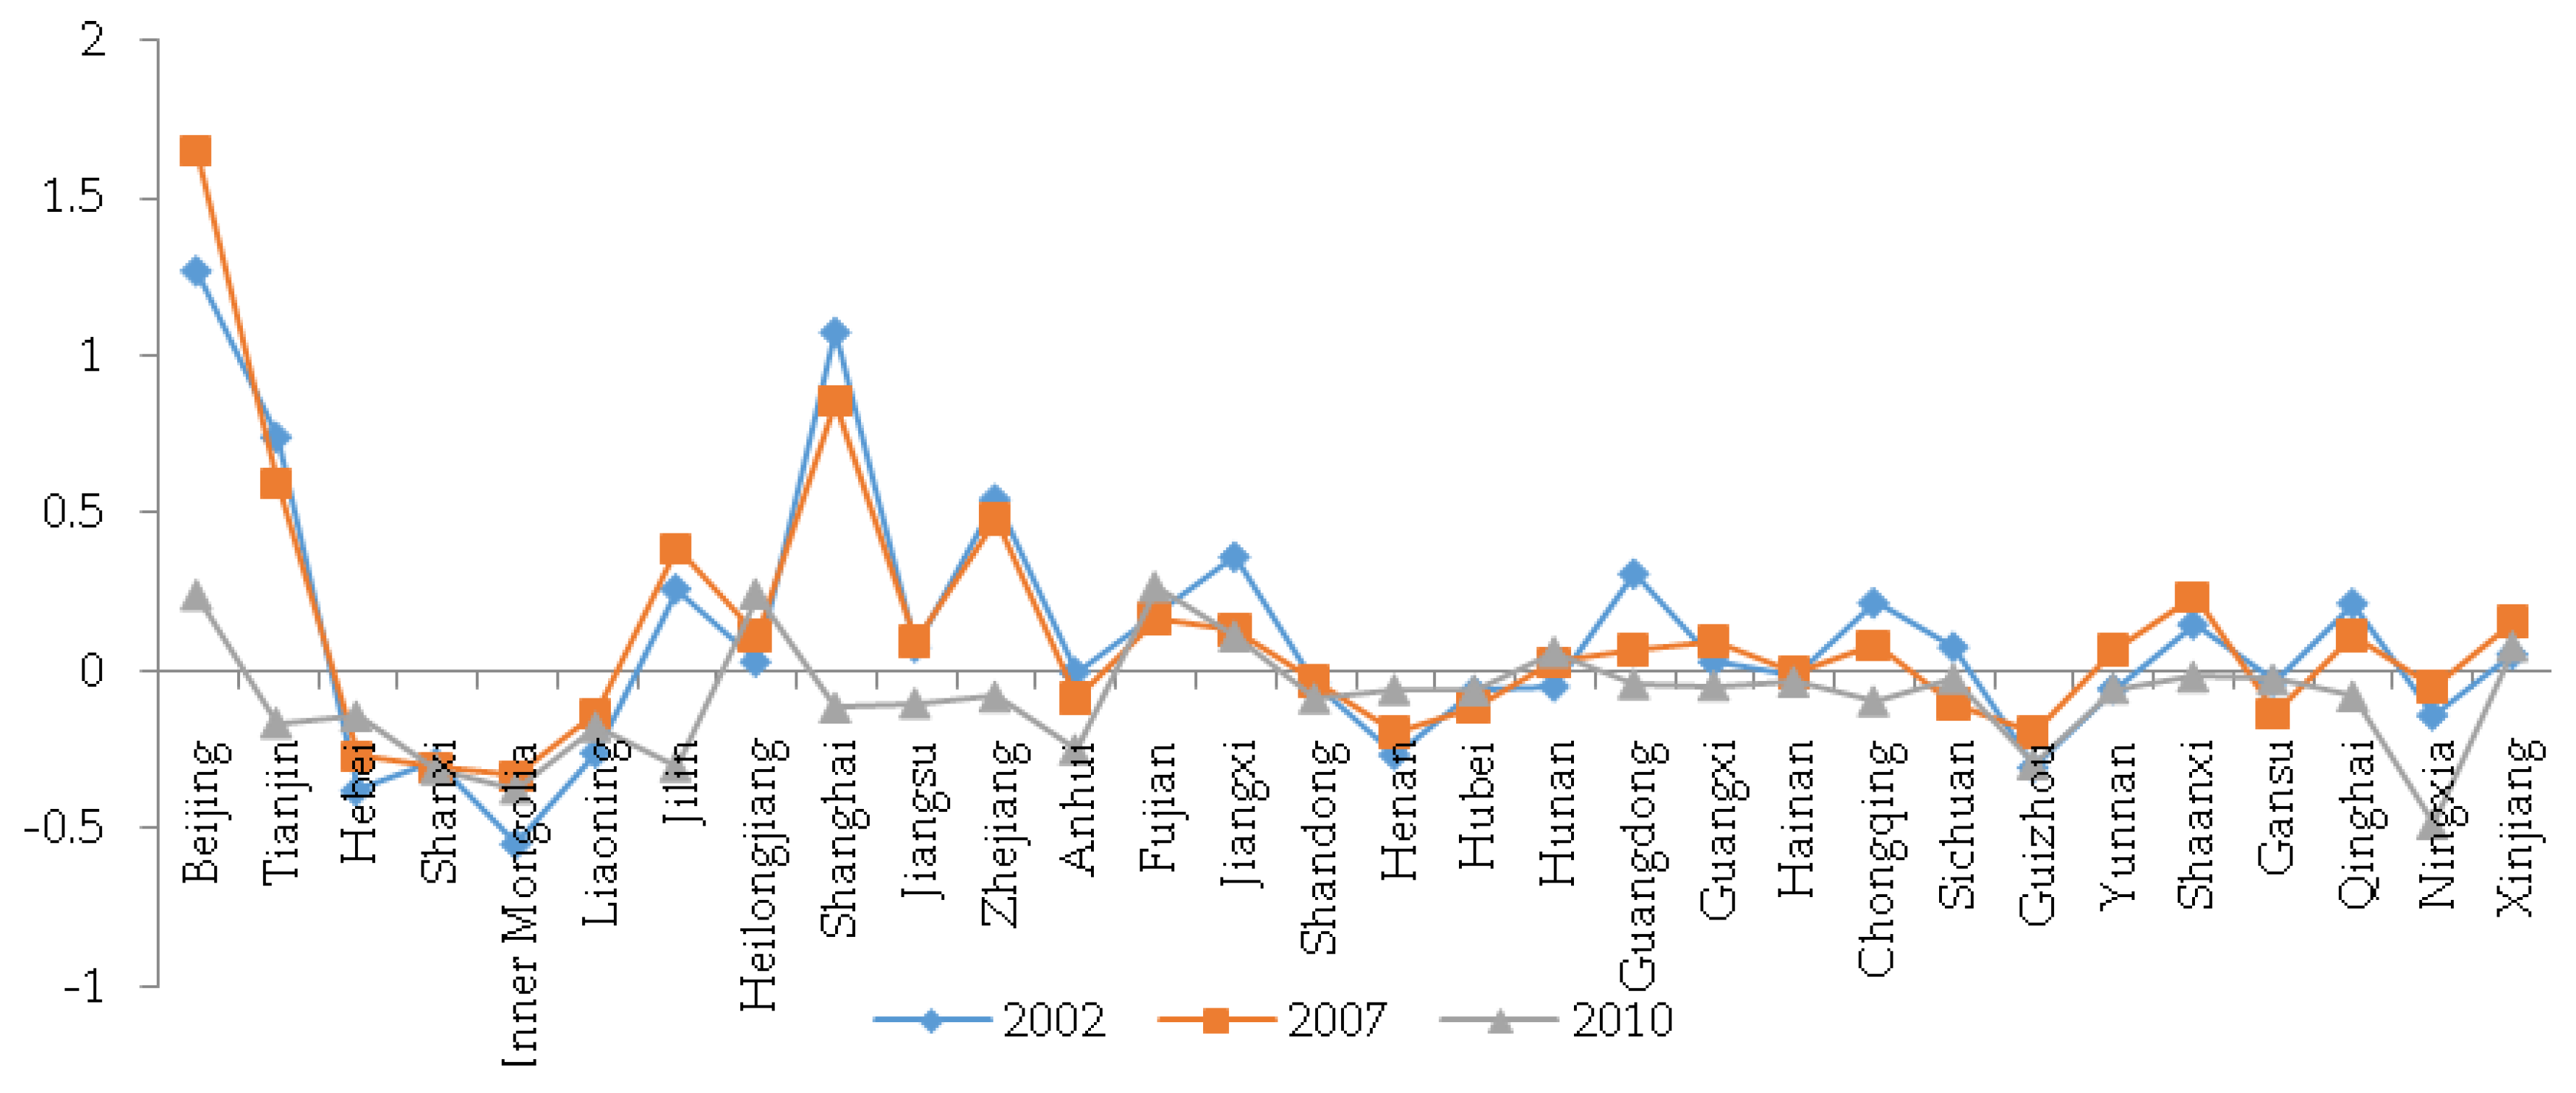
Figure 5 indicates that compared to the production principle, Hainan has the highest change rate, reaching 1.04 under the consumption principle in 2002. Hainan is one of the provinces with the least carbon emissions responsibility. However, under the consumption principle, its responsibilities have increased by 1.04 times compared to that under the production principle. This may result from Hainan’s dependence mainly on tourism and agriculture to develop its economy with its relatively backward industrial level. In addition, Hainan is a province where consumption exceeds production. So it is obvious that adopting the consumption principle would increase its carbon emissions. Additionally, in 2002, compared to the production principle, the consumption principle increased the carbon emissions responsibility of some provinces, such as Heilongjiang, Jiangxi, Beijing, Guangdong, and Shanghai. On the other hand, it decreased the carbon emissions responsibility of Jilin, Inner Mongolia, Shanxi, Shandong, and Jiangsu. Other provinces have nearly the same responsibility for carbon emissions under the two principles. In 2007, the carbon emissions responsibility of Beijing, Shanghai, Tianjin, Zhejiang, and Guangdong increased obviously, while that of Inner Mongolia, Hebei, Guizhou, Shanxi, and Henan decreased significantly. In 2010, Shanghai, Beijing, Tianjin, and Zhejiang had a palpable increase in responsibility of carbon emissions, while Inner Mongolia, Shanxi, Hebei, and Henan had reduced responsibility.
It can be concluded that during the whole study period, compared with the production principle, the consumption principle has greatly increased the carbon emissions responsibility of Beijing, Shanghai, Tianjin, Guangdong, etc., and has lowered the liability of Inner Mongolia and Shanxi, which are rich in coal resources. However, this conclusion is not static. Taking Zhejiang and Jilin as examples, in 2002, their consumption-based emissions were lower than their production-based emissions, but in 2007 and 2010, we find that their consumption-based emissions were higher than their production-based emissions. Also, in 2002, Hainan’s consumption-based emissions were higher than their production-based emissions. Along with the “Strong Industrial Province” slogan and the implementation of the “big enterprises enter, large projects led” development strategy, Hainan has achieved a leap-forward development and its industry has become an important force for its economic development. Thus, its consumption-based emissions are less than production-based emissions in 2007 and 2010.
3.2.2. A Comparison between the Principles of Value Capture and Production
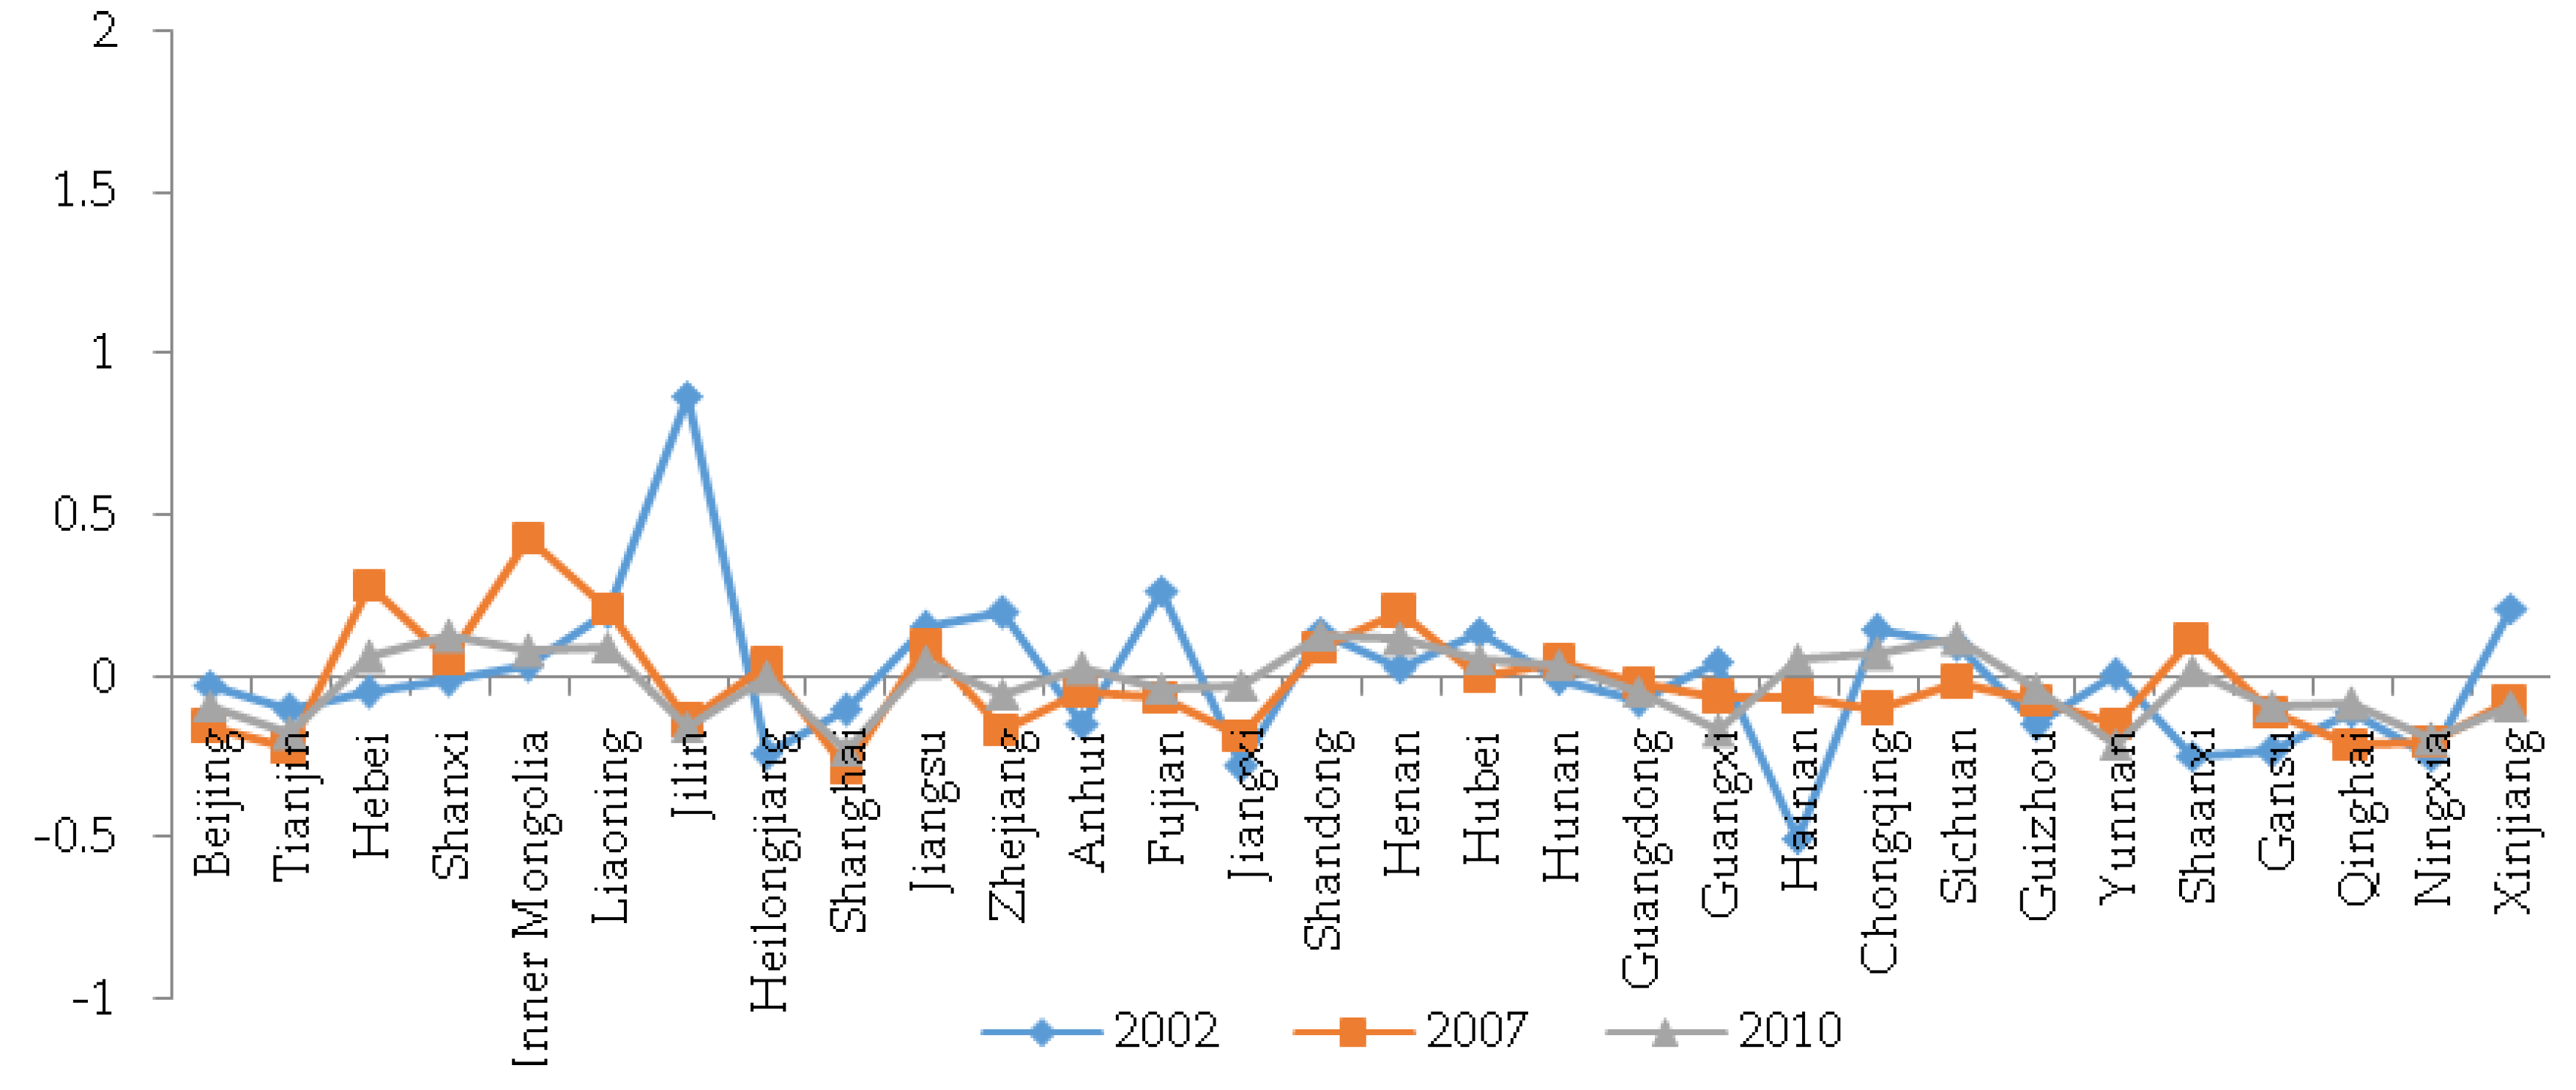
Figure 6 reveals that in 2002, compared to the production principle, Fujian, Beijing, Heilongjiang, Jiangxi, Guangdong, Xinjiang, Hunan, Shanghai, and Shandong have significantly increased their carbon emissions responsibility under the principle of value capture, while Ningxia, Inner Mongolia, Shanxi, Jilin, and Guizhou have significantly reduced their carbon emissions responsibility. Similarly, in 2007, Beijing, Shanghai, Zhejiang, Tianjin, Guangdong, Shanxi, Heilongjiang, and Shandong have significantly increased their carbon emissions responsibility under the value capture principle, while Ningxia, Inner Mongolia, Shanxi, Jilin, and Guizhou have significantly reduced their carbon emissions responsibility. In 2010, compared to the production principle, Beijing, Shanghai, Zhejiang, Tianjin, Shanxi, Jilin, Chongqing, Jiangsu, and Shandong have significantly increased their carbon emissions responsibility, but Ningxia, Inner Mongolia, Shanxi, Hebei, and Henan have significantly reduced their carbon emissions responsibility under the value capture principle.
Therefore, during 2002–2010, compared to the production principle, the value capture principle has greatly increased the carbon emissions responsibility of consumption-oriented provinces such as Beijing, Shanghai, Tianjin, Guangdong, and Zhejiang, but has also lowered the responsibility of production-oriented provinces such as Inner Mongolia, Shanxi, Henan, and Hebei. For the production-oriented provinces, compared with the production principle, they are more inclined to the value capture principle. This means that pollution-intensive industries and low value-added industries in Beijing, Tianjin, Shanghai, Guangdong, and Zhejiang have been transferred, and then these provinces have obtained high added value from research and development. If the production principle is adopted to divide the carbon emissions responsibility, it will reduce the fairness and emissions reduction efficiency. Therefore, compared with the production principle, the value capture principle is more fair and efficient.
3.2.3. A Comparison between the Principles of Value Capture and Consumption
Figure 7 indicates in 2002, relative to the consumption principle, the responsibility of carbon emissions for Jilin, Fujian, Xinjiang, Liaoning, Zhejiang, Jiangsu, Shandong, Guangxi, and Inner Mongoliain significantly increased under the value capture principle, while it has sharply reduced for Hainan, Jiangxi, Shanxi, Ningxia, Heilongjiang, Tianjin, Shanghai, Guangdong, and Beijing. Similarly, in 2007, the responsibility of carbon emissions for Inner Mongolia, Hebei, Liaoning, Henan, Shandong, Shanxi, and Heilongjiang increased, while it reduced for Shanghai, Yunnan, Ningxia, Tianjin, Beijing, Zhejiang, and Guangdong. In 2010, the responsibility of carbon emissions for Shandong, Shanxi, Henan, Inner Mongolia, Hebei, and Jiangsu had obvious increases, but significantly reduced for Shanghai, Yunnan, Tianjin, Ningxia, Guangxi, and Jilin.
It is to be found that, relative to the consumption principle, the value capture principle greatly increased the carbon emissions responsibility of production-oriented places such as Shandong, Inner Mongolia, Jiangsu, Henan, and Hebei, but lowered the responsibility of high-consumption areas such as Shanghai, Tianjin, Beijing, and Guangdong. At this time, if the consumption principle is adopted, Shanghai, Tianjin, Beijing and Guangdong would not agree. These places insist that consumption leads to the economic growth of provinces depending on industrial production to stimulate economic development. The consumption principle states that “The responsibility for carbon dioxide emissions should be borne by the consumer”. Thereby the efficiency of the emissions reductions would be sharply reduced. Additionally, the division of carbon emissions responsibility in accordance with the value capture principle will ease the tense relationship between producers and consumers.
In summary, taking Figure 5, Figure 6 and Figure 7 for comparison, for most provinces, the relative change rates of value capture-based emissions to production-based emissions and value capture-based emissions to consumption-based emissions are both less than the relative change rates of consumption-based emissions to production-based emissions in 2002, 2007, and 2010. These conclusions indicate that the value capture principle is more eclectic than the consumption principle and the production principle. Different from the production principle and the consumption principle, the value capture principle divides the amount of carbon emissions from domestic production activities in keeping with the amount of value captured by each province by sectors in the production value chain. It is more equitable and more likely to be accepted by all responsible participants.
3.3. Sector Analysis under the Value Capture Principle
According to the empirical analysis of Section 3.1, it can be seen that the main provinces of carbon emissions responsibility under the principle of value capture in 2002, 2007, and 2010 are Shandong, Jiangsu, Hebei, Guangdong, and Henan. As a result, in this section, we provide a detailed analysis of the sector allocations of the five major carbon-depleting responsibilities.
Table 2 shows that carbon emissions responsibilities for Shandong, Jiangsu, and Guangdong are mainly distributed in other services (30) and construction (24), accounting for 10% to 20%. The rapid development of the service stimulates economic growth and promotes the transfer of industrial structure. The value captured by other services in the inter-provincial value chain is relatively large, so the carbon responsibility is relatively large. Similarly, there is an intimate linkage between the construction and the steel, cement, and mining sector and other sectors. In the production chain derived from the value chain, construction has a larger value, causing a large commitment to the carbon emissions reduction. Second, non-metallic mineral products, agriculture, chemicals, and chemical products contribute to the carbon emissions responsibility in Shandong, Jiangsu, and Guangdong. For the Hebei province, the primary carbon responsible sectors are other services, construction, basic metals, and agriculture. Other services, non-metallic mineral products, and agriculture have always been the main contributors of carbon emissions in the Henan province.
From the data above, we can see that other services, construction, non-metallic mineral products, agriculture, and chemicals and chemical products are the main carbon responsibility sectors for Shandong, Jiangsu, Hebei, Henan, and Guangdong. This means that the production activities of the provinces are connected through the inter-provincial value chain. China should allocate carbon emissions responsibility to specific sectors according to the principle of the value capture. For the common main carbon emissions responsibility sectors, the provinces can learn from each other and cooperate with each other to achieve the sectors’ carbon emissions reduction targets. It is also notable that the food and beverage sector is the main carbon offset responsibility sector in Shandong, and in Henan it is the mining of coal. The provinces should put forward specific carbon emissions reduction responsibility schemes according to the province’s own situation. For example, to complete the carbon emissions reduction responsibility for the food and beverage sector in Shandong, it can not only adopt technical optimization to reduce the carbon emissions intensity of the production process, but can also pay a certain cost through the carbon emissions trading system to buy carbon emissions rights for lower carbon responsibility of the provinces or lower carbon emissions sector in the province.
4. Conclusions
For China, an accurate accounting of CO2 emissions responsibility of each province by sectors is the basis for the fair and equitable distribution of carbon emissions rights, and the complete start of the carbon emissions rights trading market and the rational development of provincial environmental policy. The method of accurately allocating CO2 emissions responsibility for each province by sectors has become the focus of scholars and policy makers. Due to carbon emissions transfer, carbon leakage, and other issues between the provinces in China, there are significant differences in the value captured by each province from the domestic production value chain. It is reasonable to divide the amount of carbon emissions from the domestic production activities in keeping with the amount of value captured by each province and sector in the production value chain. Consequently, from the provincial value chain perspective combined with input-output methods and the sharing responsibility ideology, based on the input-output tables of China in 2002, 2007, and 2010, this study constructs models to calculate the CO2 emissions responsibility of each province under the three principles, respectively. The empirical results are compared and analyzed from the vertical and horizontal directions. The main conclusions are as follows:
On the whole, under the production, consumption, and value capture principles, the provinces that bear the most responsibility for CO2 emissions in China are Shandong, Hebei, Jiangsu, Guangdong, and Henan, while those with the least responsibility are Hainan and Qinghai. However, there is a great difference in the proportions of carbon emissions responsibility for each province during the same period under different principles or different periods under the same principle. For provinces such as Beijing, Tianjin, Zhejiang, Shanghai, and Guangdong, the proportion of CO2 emissions liability under the production principle is less than that under the value capture principle, and the latter is less than that under the consumption principle. In other words, it is more advantageous for these economically developed and consumption-oriented areas to share CO2 emissions responsibility in accordance with the production principle. The consumption principle is more beneficial for these production-oriented provinces such as Hebei, Henan, Liaoning, Shanxi, Inner Mongolia, and Shaanxi. However, the value capture principle strikes a compromise of the CO2 emissions responsibility of each province between the production and consumption principles, and it shares the CO2 emissions responsibility based on the actual value captured by each province in the provincial value chain. From the sector analysis, other services, construction, non-metallic mineral products, agriculture, and chemicals and chemical products are found to be the main carbon responsibility sectors for Shandong, Jiangsu, Hebei, Henan, and Guangdong.
According to the above analysis, this study argues that the value capture principle can be used to apportion CO2 emissions responsibility of each province by the sectors in China, so that the CO2 emissions responsibility of each province by its sectors is matched with its value captured from the provincial value chain. On this basis, Chinese policymakers should divide the carbon emissions rights for various provinces by the sectors in China fairly and rationally, establish an open carbon emissions database and a standardized national carbon emissions rights trading market, and build a platform for online transactions and information sharing, so that the participants of transactions are able to timely understand the supply and demand situation of the carbon emissions rights of each province by its sectors. In addition, to effectively achieve the carbon emissions reduction targets as soon as possible, we can proceed from the following points: for one thing, for the common sectors of the major responsible sectors of the carbon emissions responsibility in all provinces, it is necessary to strengthen the sharing and exchange of experience in carbon reduction among the provinces and break down the barriers in inter-provincial trade and competition. For another, the low-capacity, high-energy, high-emission, but inefficient sectors should be removed, while production technology and emissions reduction technology should be improved.
Acknowledgments
This work was supported by the National Natural Science Foundation of China (71303076, 71473242, 71673083), the National Key Research and Development Program of China (2016YFA0602500) and the Major Consulting Program of Institutes of Science and Development of Chinese Academy of Sciences (Y02015003).
Author Contributions
Rui Xie conceived and designed the experiments; Chao Gao and Guomei Zhao wrote the paper; Yu Liu and Shengcheng Xu performed the experiments. All authors read and approved the final manuscript.
Conflicts of Interest
The authors declare no conflict of interest.
References
- Wang, Y.; Huang, Y. Equity and Uncertainty: The Key Problems for the Allocation of World Carbon Emissions. China Popul. Resourc. Environ. 2011, 21, 271–275. (In Chinese) [Google Scholar]
- Schaeffer, R.; Sa, A.L. The embodiment of carbon associated with Brazilian imports and exports. Energy Convers. Manag. 1996, 37, 955–960. [Google Scholar] [CrossRef]
- Tolmasquim, M.T.; Machado, G. Energy and Carbon Embodied in the International Trade of Brazil. Mitig. Adapt. Strateg. Glob. Chang. 2003, 8, 139–155. [Google Scholar] [CrossRef]
- Csutora, M.; Vetőné mózner, Z. Proposing a beneficiary-based shared responsibility approach for calculating national carbon accounts during the post-Kyoto era. Clim. Policy 2014, 14, 599–616. [Google Scholar] [CrossRef]
- Pan, J.; Phillips, J.; Chen, Y. China’s balance of emissions embodied in trade: Approaches to measurement and allocating international responsibility. Oxf. Rev. Econ. Policy 2008, 24, 354–376. [Google Scholar] [CrossRef]
- Copeland, B.R.; Taylor, M.S. North-South trade and the environment. Q. J. Econ. 1994, 109, 755–787. [Google Scholar] [CrossRef]
- Ederington, J. NAFTA and the Pollution Haven Hypothesis. Policy Stud. J. 2007, 35, 239–244. [Google Scholar] [CrossRef]
- Wyckoff, A.W.; Roop, J.M. The embodiment of carbon in imports of manufactured products: Implications for international agreements on greenhouse gas emissions. Energy Policy 1994, 22, 187–194. [Google Scholar] [CrossRef]
- Munksgaard, J.; Pedersen, K.A. CO2, accounts for open economies: Producer or consumer responsibility? Energy Policy 2001, 29, 327–334. [Google Scholar] [CrossRef]
- Peters, G.P. From production-based to consumption-based national emission inventories. Ecol. Econ. 2008, 65, 13–23. [Google Scholar] [CrossRef]
- Bastianoni, S.; Pulselli, F.M.; Tiezzi, E. The problem of assigning responsibility for greenhouse gas emissions. Ecol. Econ. 2004, 49, 253–257. [Google Scholar] [CrossRef]
- Lenzen, M. A consistent input–output formulation of shared producer and consumer responsibility. Econ. Syst. Res. 2005, 17, 365–391. [Google Scholar]
- Lenzen, M.; Murray, J.; Sack, F.; Wiedmann, T. Shared producer and consumer responsibility—Theory and practice. Ecol. Econ. 2007, 61, 27–42. [Google Scholar] [CrossRef]
- Peng, S.; Zhang, W.; Wei, R. National Carbon Emission Responsibility. Econ. Res. J. 2016, 3, 137–150. (In Chinese) [Google Scholar]
- Zhang, Y. Benefit Based Inter-industrial Environmental Responsibility Allocation. China Ind. Econ. 2012, 7, 57–69. (In Chinese) [Google Scholar]
- Chang, N. Sharing responsibility for carbon dioxide emissions: A perspective on border tax adjustments. Energy Policy 2013, 59, 850–856. [Google Scholar] [CrossRef]
- Ferng, J.J. Allocating the responsibility of CO2, over-emissions from the perspectives of benefit principle and ecological deficit. Ecol. Econ. 2003, 46, 121–141. [Google Scholar] [CrossRef]
- Andrew, R.; Forgie, V. A three-perspective view of greenhouse gas emission responsibilities in New Zealand. Ecol. Econ. 2008, 68, 194–204. [Google Scholar] [CrossRef]
- Lenzen, M.; Murray, J. Conceptualising environmental responsibility. Ecol. Econ. 2010, 70, 261–270. [Google Scholar] [CrossRef]
- Marques, A.; Rodrigues, J.; Domingos, T. Embodied emissions and the carbon trade balance between world regions. In Proceedings of the 19th International Input–output Conference, Alexandria, VA, USA, 13–17 June 2011. [Google Scholar]
- Marques, A.; Rodrigues, J.; Lenzen, M.; Domingos, T. Income-based environmental responsibility. Ecol. Econ. 2012, 84, 57–65. [Google Scholar] [CrossRef]
- Marques, A.; Rodrigues, J.; Domingos, T. International trade and the geographical separation between income and enabled carbon emissions. Ecol. Econ. 2013, 89, 162–169. [Google Scholar] [CrossRef]
- Zhang, Y. Provincial responsibility for carbon emissions in China under different principles. Energy Policy 2015, 86, 142–153. [Google Scholar] [CrossRef]
- Zhang, W.; Wei, R. Carbon Responsibility Sharing in the Global Value Chain: Based on the Perspective of Value Capture. In Proceedings of the Yuelu Forum of International Young Scholars 2016, Changsha, China, 26–28 December 2016. (In Chinese). [Google Scholar]
Figure 1.
The proportion of all provinces in total CO2 emissions under the production principle (unit: %).
Figure 1.
The proportion of all provinces in total CO2 emissions under the production principle (unit: %).
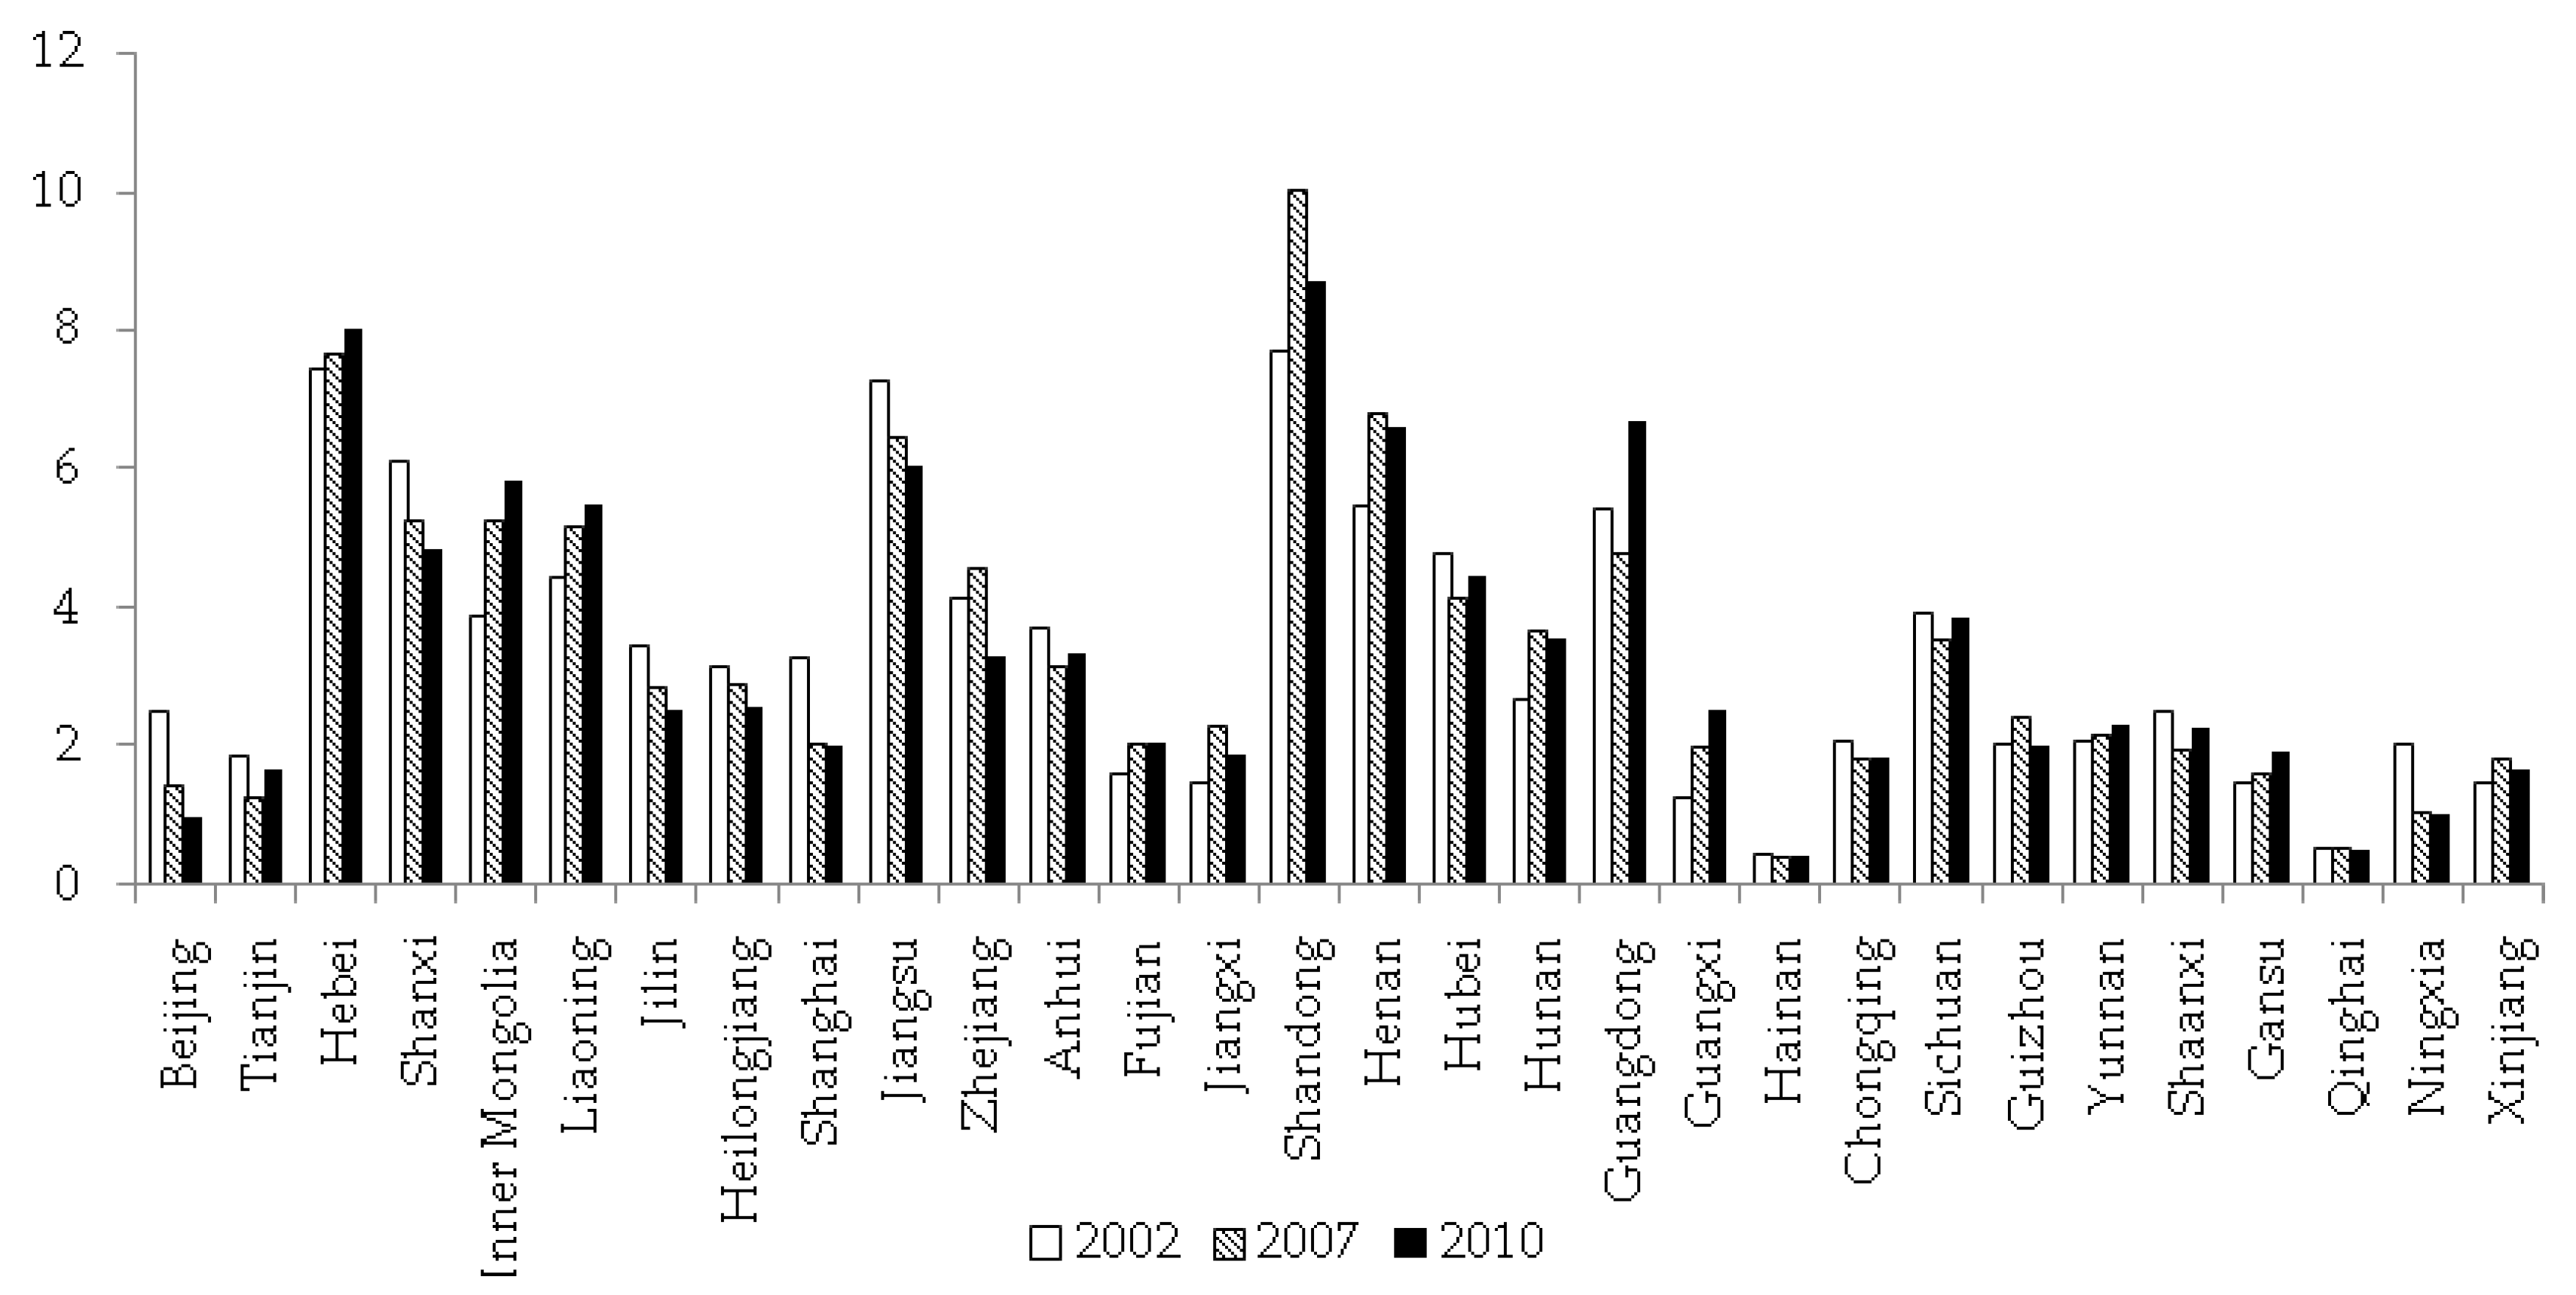
Figure 2.
The proportion of all provinces in total CO2 emissions under the consumption principle (unit: %).
Figure 2.
The proportion of all provinces in total CO2 emissions under the consumption principle (unit: %).

Figure 3.
The proportion of all provinces in total CO2 emissions under the value capture principle (unit: %).
Figure 3.
The proportion of all provinces in total CO2 emissions under the value capture principle (unit: %).
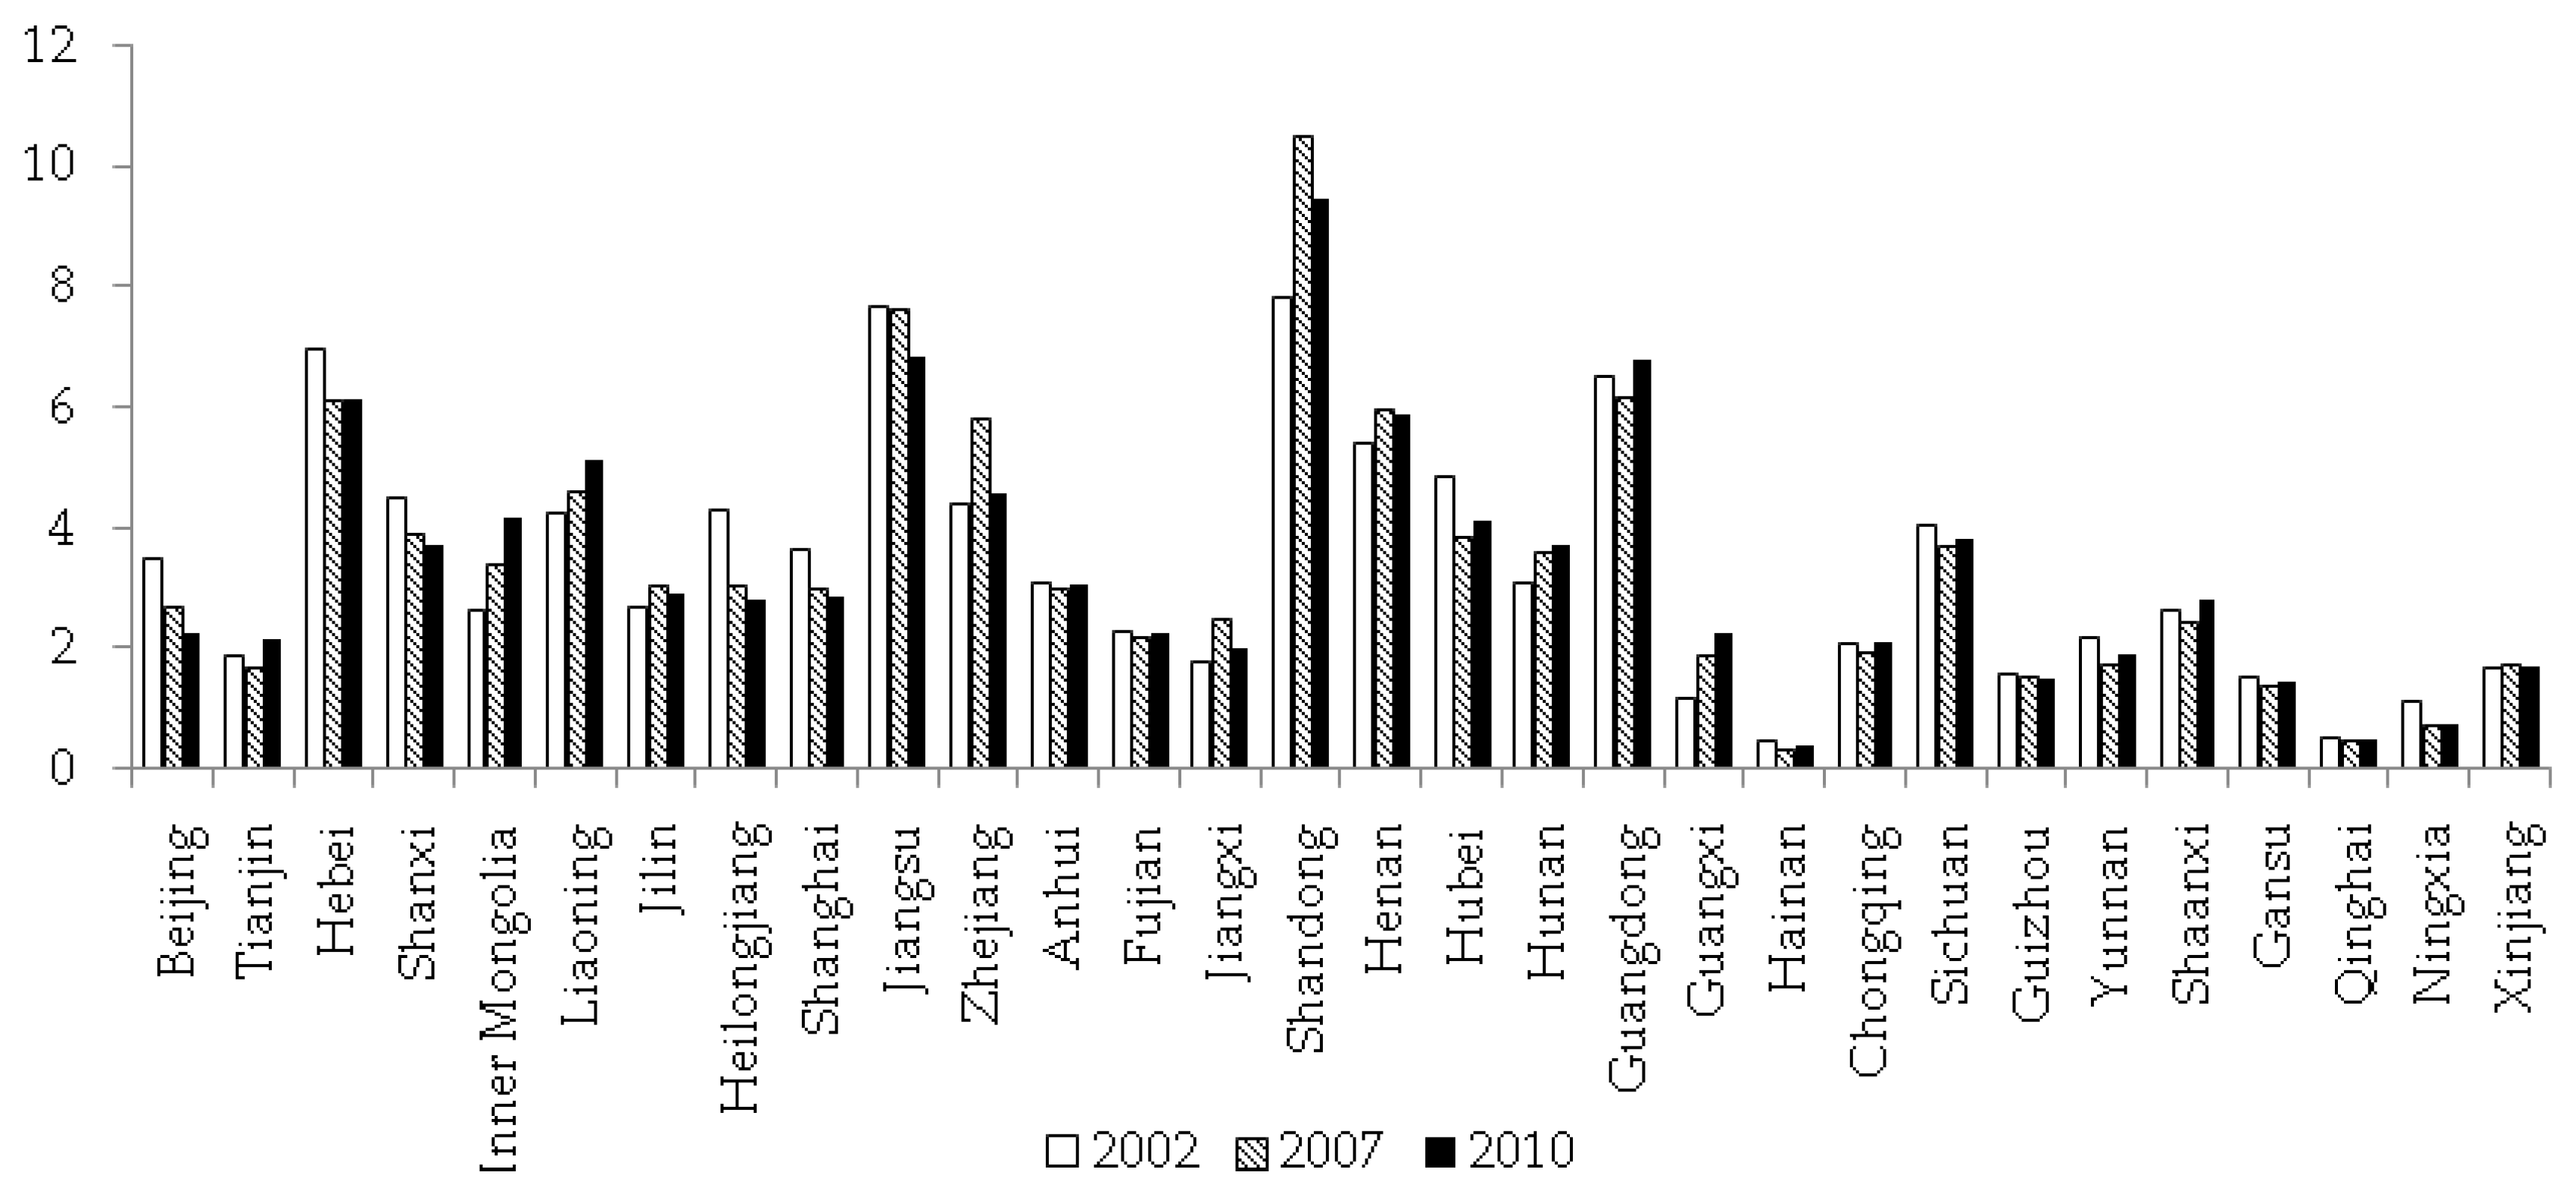
Figure 4.
The ratio of each province in total GDP in China in 2002, 2007, and 2010 (unit: %).
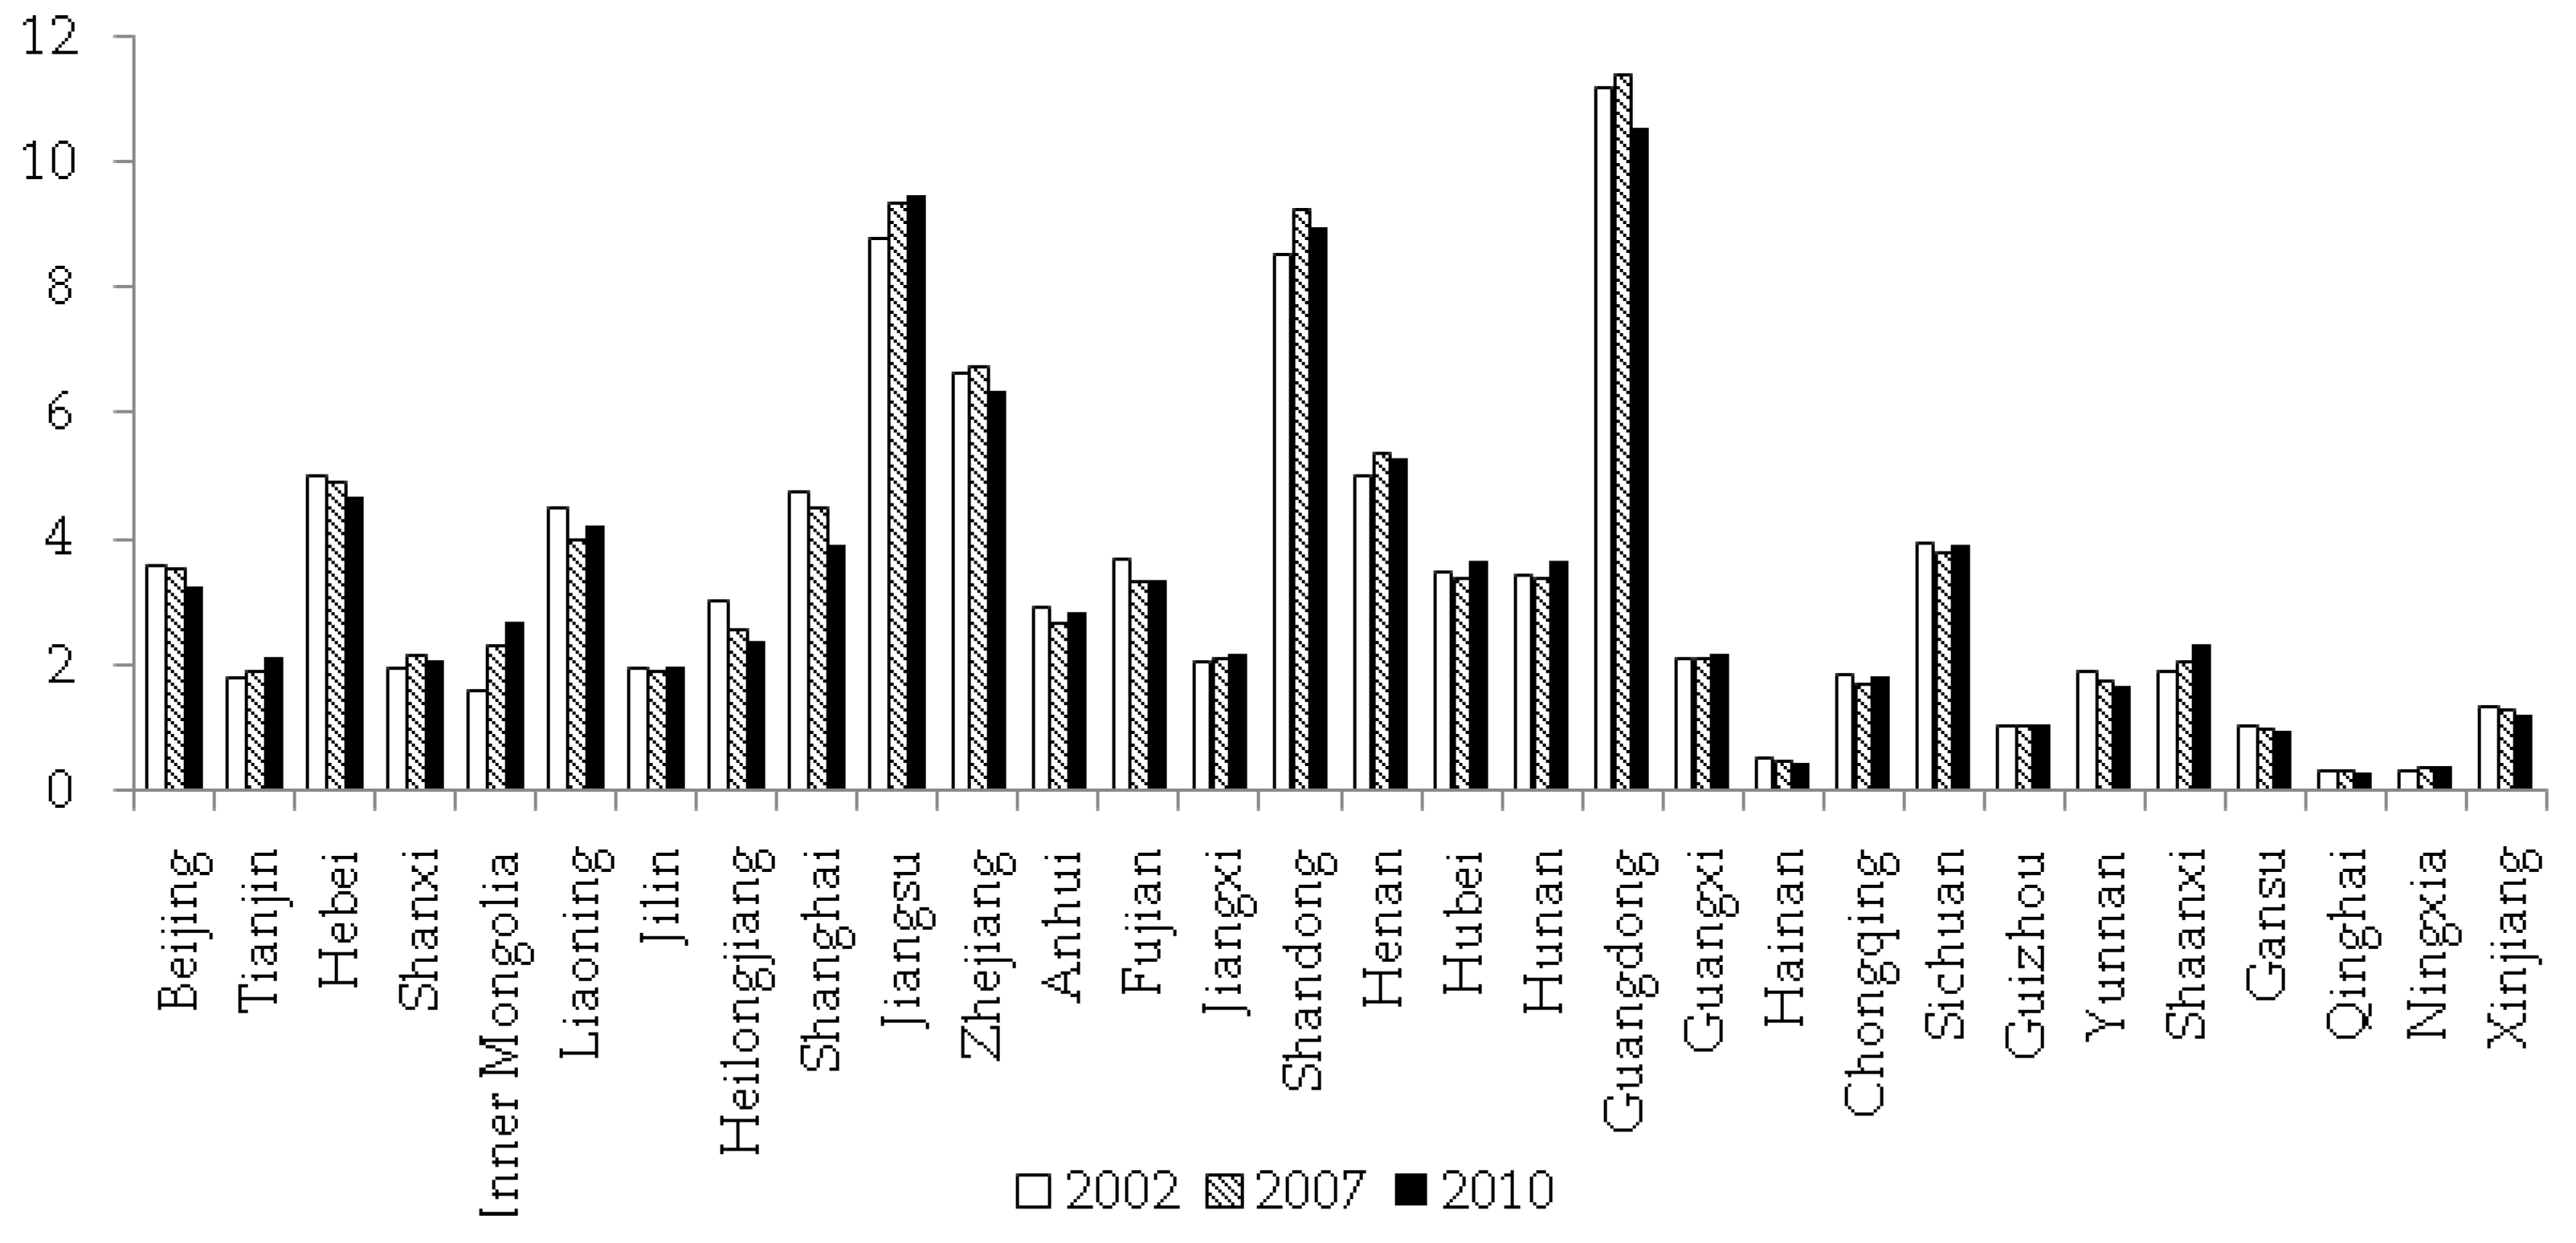
Figure 5.
The dynamic comparison of the CO2 emissions of each province under the principles of consumption and production. The vertical axis represents the rate of change, i.e., (CO2 emissions under the consumption principle − CO2 emissions under the production principle)/CO2 emissions under the production principle.

Figure 6.
The dynamic comparison of CO2 emissions of each province under the principles of value capture and production. The vertical axis in represents the rate of change, i.e., (CO2 emissions under the value capture principle − CO2 emissions under the production principle)/CO2 emissions under the production principle.
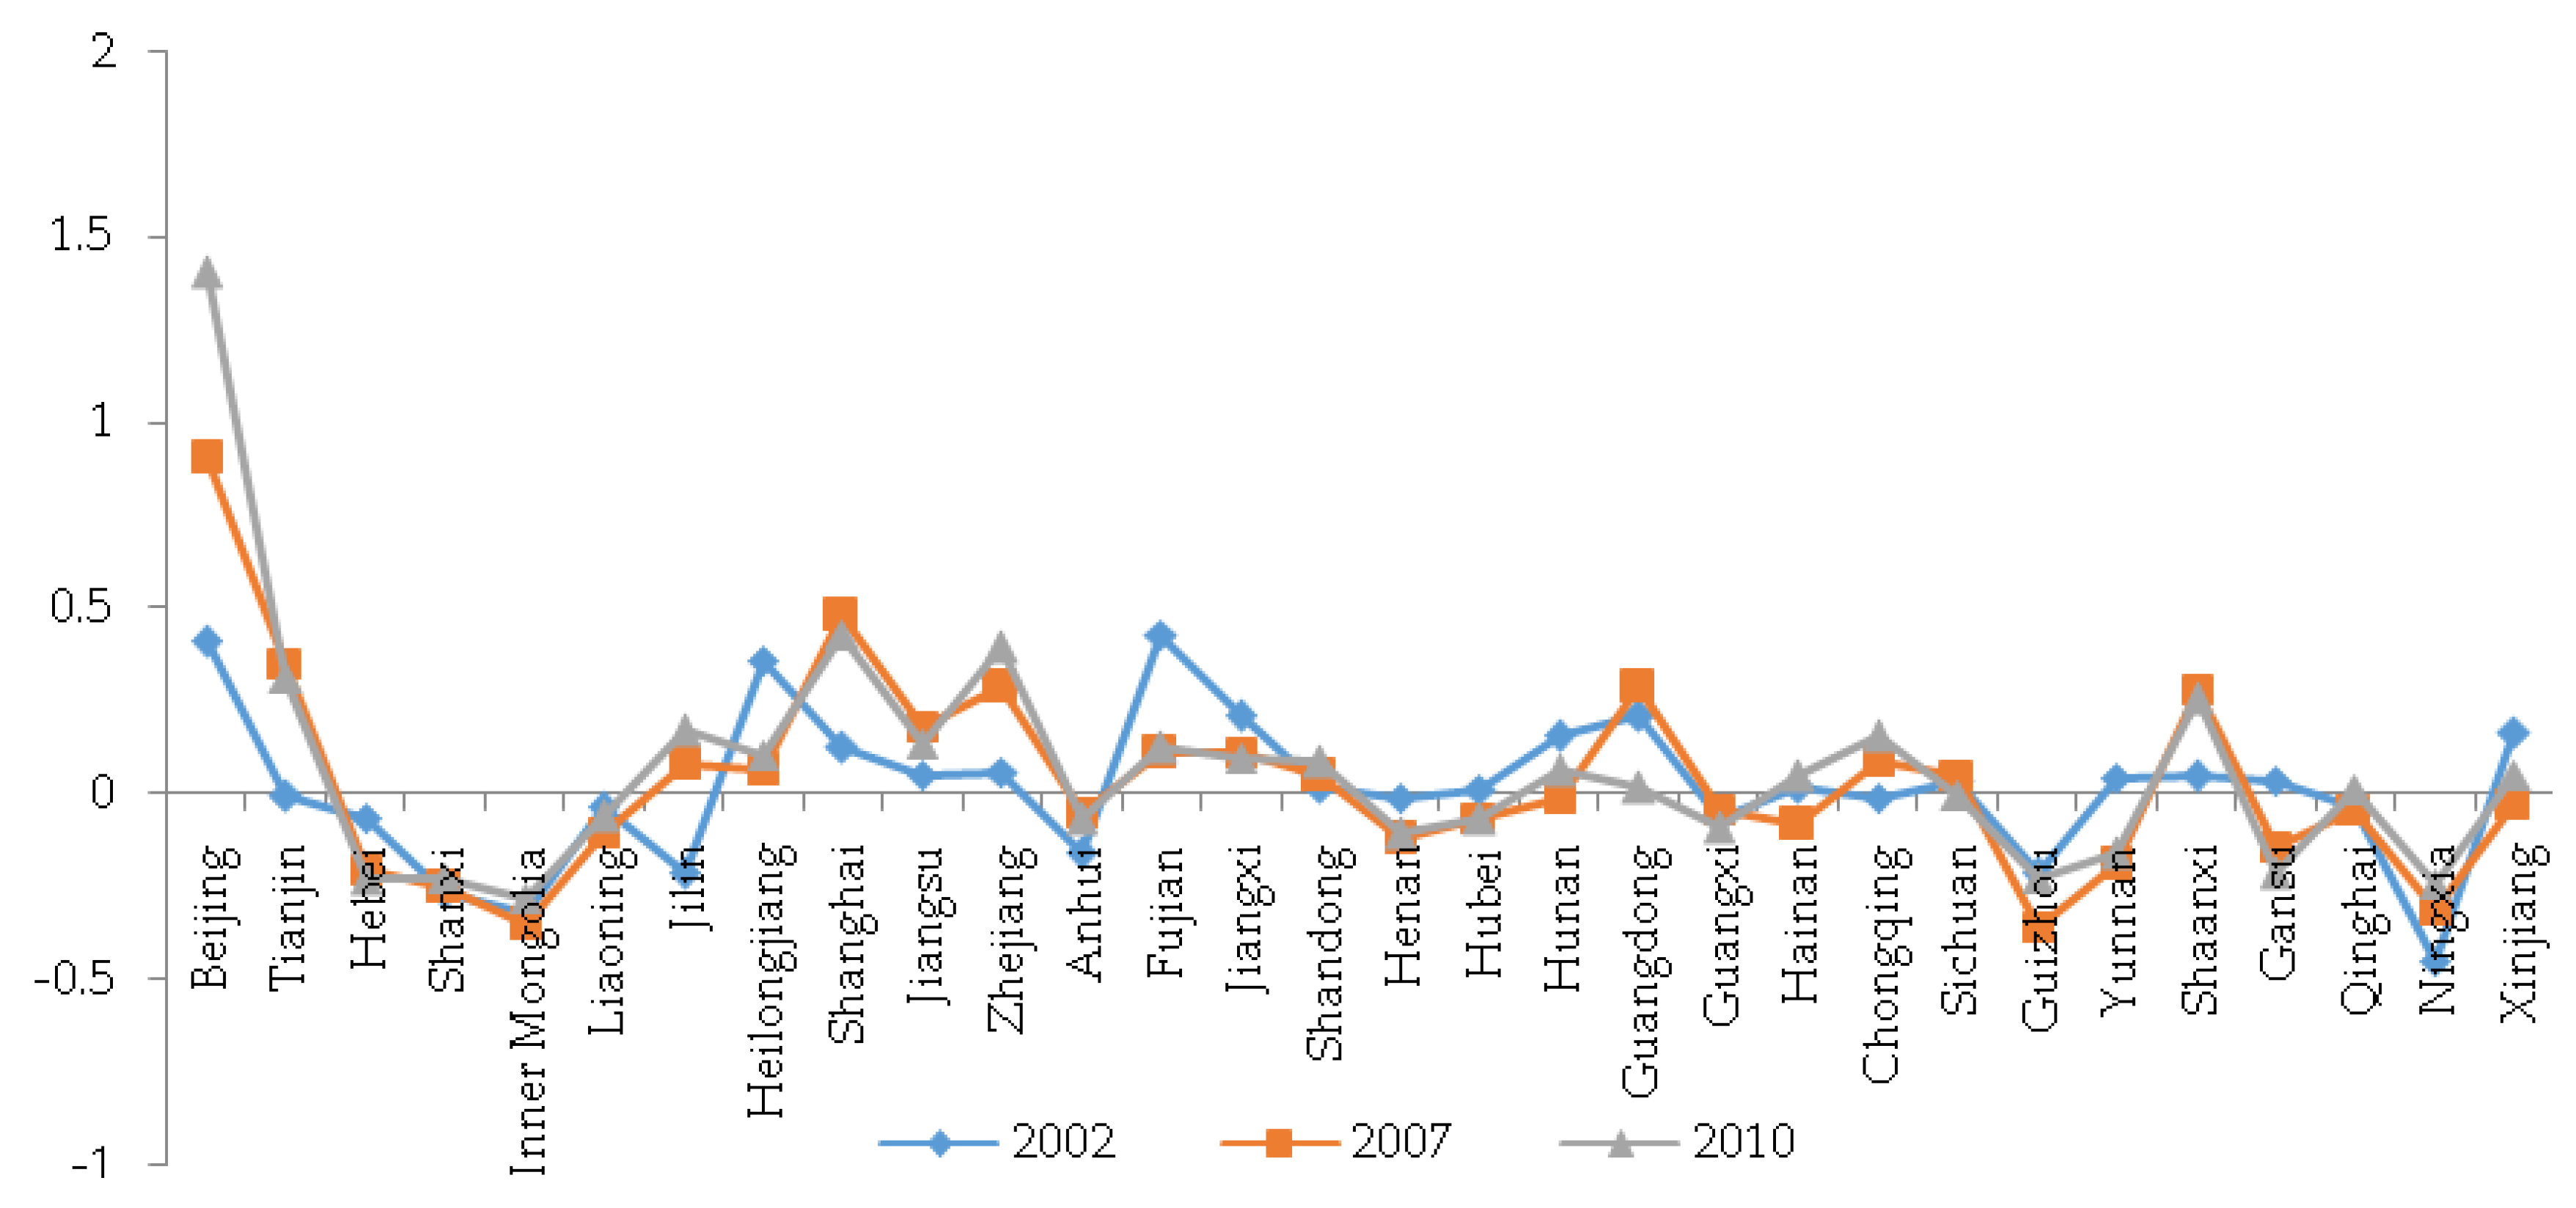
Figure 7.
The dynamic comparison of CO2 emissions of each province under the principles of value capture and consumption. The vertical axis represents the rate of change, i.e., (CO2 emissions under the value capture principle − CO2 emissions under the consumption principle)/CO2 emissions under the consumption principle.


Table 1.
Inter-provincial Environmental Input-Output Table in China.
| Intermediate Demands | Final Demands | Exports | Total Outputs | ||||||||
|---|---|---|---|---|---|---|---|---|---|---|---|
| P1 | P2 | Pn | P1 | P2 | Pn | ||||||
| Intermediate inputs | P1 | ||||||||||
| P2 | |||||||||||
| Pn | |||||||||||
| Imports | |||||||||||
| Value-added | |||||||||||
| Total inputs | |||||||||||
| CO2 emissions | |||||||||||
Note: P1 represents the first province, P2 is the second province, …, Pn is the nth province.
Table 2.
The sector distribution of the major carbon responsibility provinces under the value capture principle (%).
Table 2.
The sector distribution of the major carbon responsibility provinces under the value capture principle (%).
| Province | 2002 | 2007 | 2010 |
|---|---|---|---|
| Shan-dong | 30(15.7); 24(14.1); 1(10.5); 6(7.3); 12(7.2); 26(6.6); 16(6.5); 13(4.8); 22(4.4); 3(4.4) | 30(13.5); 24(9.8); 16(7.1); 12(6.4); 1(6.4); 13(6.3); 25(4.8); 6(4.4); 22(4.1); 14(4.0) | 30(14.3); 24(10.1); 12(7.0); 16(6.9); 1(6.7); 26(6.1); 6(5.4); 25(5.4); 14(4.8); 13(4.2) |
| Guang-dong | 30(18.6); 24(14.3); 22(8.1); 25(6.3); 1(6.3); 26(5.1); 13(4.8); 15(4.8); 12(4.5); 27(3.8) | 30(18.3); 24(11.9); 22(8.9); 12(6.4); 13(6.1); 26(5.9); 1(4.9); 25(4.8); 15(4.0); 18(3.9) | 30(18.9); 24(11.9); 22(7.7); 12(5.5); 25(5.3); 26(4.9); 13(4.4); 18(4.0); 1(3.9); 17(3.5) |
| Jiangsu | 30(16.0); 26(11.7); 24(11.5); 12(8.2); 22(7.0); 1(5.9); 13(4.8); 16(4.5); 14(4.4); 25(3.4) | 30(19.0); 24(12.0); 14(8.1); 12(7.7); 16(7.2); 26(5.6); 18(4.9); 1(4.3); 22(4.3); 25(3.8) | 24(13.8); 30(13.6); 16(8.1); 12(6.7); 18(5.8); 26(5.7); 14(5.6); 22(4.8); 25(4.5); 17(4.4) |
| Hebei | 30(11.0); 24(9.6); 1(9.6); 14(9.4); 25(8.8); 13(7.1); 16(5.7); 22(5.2); 12(5.1); 26(5.0) | 30(16.4); 14(11.1); 1(8.7); 24(8.5); 25(7.5); 22(6.3); 13(4.9); 16(4.8); 12(4.2); 26(3.9) | 30(14.2); 14(10.5); 24(8.7); 25(8.0); 1(7.3); 4(6.8); 22(5.5); 26(5.5); 12(5.0); 2(4.2) |
| Henan | 13(12.3); 1(10.7); 30(9.2); 24(9.0); 22(7.8); 25(6.7); 2(5.0); 26(4.9); 16(4.7); 12(3.6) | 30(11.3); 1(9.1); 13(9.0); 24(7.5); 14(6.6); 25(6.2); 16(5.3); 22(5.1); 6(4.9); 26(4.8) | 30(11.5); 13(9.9); 1(8.1); 24(7.9); 16(7.1); 2(6.5); 14(5.8); 6(5.6); 26(5.1); 12(5.0) |
Note: The numbers in brackets in Table 2 represent the percentage of carbon emissions, and the numbers outside the brackets are the sector codes. The meanings of the sector codes are defined as follows. 1: Agriculture; 2: Mining of coal; 3: Mining of oil and gas; 4: Mining of metal; 5: Mining of nonmetal; 6: Food and beverage; 7: Textile; 8: Wearing apparel, dressing, and dyeing of fur; 9: Wood and product of wood; 10: Paper and products for culture, education, and sports;11: Refined petroleum products, coking products, and coal gas and coal gas products; 12: Chemicals and chemical products; 13: Nonmetallic mineral products; 14: Basic metals; 15: Manufacture of fabricated metal products; 16: Machinery; 17: Transport equipment; 18: Electrical machinery and apparatus; 19: Communications, computer, and other electronic equipment and apparatuses; 20: Instruments, watches, and clocks; 21: Other industrial activities; 22: Production and distribution of electricity and heat; 23: Steam and hot water supply; 24: Construction; 25: Transportation and warehouse; 26: Wholesale and retail; 27: Hotels and restaurants; 28: Leasing and commercial services; 29: Research and experiments; 30: Other service activities.
© 2017 by the authors. Licensee MDPI, Basel, Switzerland. This article is an open access article distributed under the terms and conditions of the Creative Commons Attribution (CC BY) license (http://creativecommons.org/licenses/by/4.0/).
Share and Cite
MDPI and ACS Style
Xie, R.; Gao, C.; Zhao, G.; Liu, Y.; Xu, S. Empirical Study of China’s Provincial Carbon Responsibility Sharing: Provincial Value Chain Perspective. Sustainability 2017, 9, 569. https://doi.org/10.3390/su9040569
AMA Style
Xie R, Gao C, Zhao G, Liu Y, Xu S. Empirical Study of China’s Provincial Carbon Responsibility Sharing: Provincial Value Chain Perspective. Sustainability. 2017; 9(4):569. https://doi.org/10.3390/su9040569
Chicago/Turabian StyleXie, Rui, Chao Gao, Guomei Zhao, Yu Liu, and Shengcheng Xu. 2017. "Empirical Study of China’s Provincial Carbon Responsibility Sharing: Provincial Value Chain Perspective" Sustainability 9, no. 4: 569. https://doi.org/10.3390/su9040569
Note that from the first issue of 2016, this journal uses article numbers instead of page numbers. See further details here.