
What Causal Drivers Influence Carbon Storage in Shanghai, China’s Urban and Peri-Urban Forests?


1
College of Life and Environmental Sciences, Shanghai Normal University, Shanghai 200234, China
2
Urban Ecology and Envrionmental Center, Shanghai Normal University, Shanghai 200234, China
3
Biology Program, Facultad de Ciencias Naturalesy Matemáticas, Universidad del Rosario, location, Bogotá 111221492, Colombia
*
Author to whom correspondence should be addressed.
Sustainability 2017, 9(4), 577; https://doi.org/10.3390/su9040577
Submission received: 6 February 2017
/
Revised: 28 March 2017
/
Accepted: 7 April 2017
/
Published: 10 April 2017
(This article belongs to the Special Issue Nature-Based Solutions for Urban Challenges)
Abstract
:Studies have documented many biophysical factors that are correlated with urban forest carbon storage. This urban forest function is also increasingly being promoted as a nature-based solution for cities. While urbanization affects both the structure and function of urban forest ecosystems, quantitative analyses of specific casual drivers of carbon storage in urban versus peri-urban forests are scarce. To address this lack of information, we used field data of random plots located along an urban to rural gradient in Shanghai, China, region-specific biomass equations, and path analysis of commonly studied urban forest socioeconomic and ecological drivers to analyze their effects on above ground tree carbon storage. An urbanization index was also developed to quantitatively differentiate urban from peri-urban sites along the transect. Results show that in both urban and peri-urban forests, percent tree and shrub cover had a significant and positive effect on tree and shrub carbon, but tree and shrub density had an even greater effect. Further, tree and shrub species diversity had no effects on carbon storage, while the effects of species composition on tree and shrub carbon in urban forests was different from those in peri-urban areas. Peri-urban forests also exhibited a significant effect of percent tree and shrub cover on tree and shrub species diversity. This approach, using a path analysis of field and plot data and site-specific dendrometric and urbanization information, can be used to quantitatively identify little explored causal dependences between drivers and ecosystem services without relying exclusively on spatial land cover data often not available in developing countries.
1. Introduction
Urban forests are the sum of all trees, shrubs, and palms present in a city and are a key nature-based solution for mitigating climate change effects and providing other ecosystem services [1,2,3]. Forests and plant communities in peri-urban contexts are also increasingly experiencing disturbance through urbanizations and alteration of their composition, soils, and biogeochemical cycles [4,5,6,7,8,9,10]. Indeed, the structure, function and subsequent ecosystem services from urban forests are highly influenced by land use change and human decisions [11,12]. Urban forests and their ecosystem functions across the forested biomes of the world play an important role in the local urban and global carbon cycles; yet they can be directly and indirectly influenced by multiple factors including tree composition, urban forest structure, and related growth, mortality, and carbon emissions from decomposition and maintenance activities [2,3,13,14,15,16]. However, given the heterogeneity of urban forests, quantitative causal analyses or identification of key indicators and drivers influencing carbon storage in subtropical urban and rural or peri-urban forests have been little studied.
Previous urban forest ecosystem studies have documented a correlation between structure, composition, diversity and carbon storage, and similarly that tree cover and land use and land cover (LULC) are correlated to carbon storage [2,3,4,13,17,18]. Also, urban forest carbon storage is a key indicator when managing and planning for urban forests [7,19,20]. However, given the growing urbanization effects on forests literature and studies assessing the carbon storage of urban forests internationally [21,22,23] there is little information outside of developed and temperate Europe and North America regarding the quantitative relationships between tree carbon storage and urbanization [9,24]. Similarly, different levels of urbanization, urban morphologies LULC will also affect urban forest functions as seen in studies such as those of Dobbs et al. (2014) [11]. Thus, information on such dynamics are needed in places such as China due to its rapid urbanization, on-going large-scale tree planting projects, and the need to promote and conserve urban forests [6,7].
Most methods and models for estimating urban tree carbon storage are based on forest-grown trees and are then applied to urban trees [3,10]. Although correction factors and ratios are used to adjust for these differences, the growing body of literature mentioned above demonstrates that important environmental factors, such as temperature, growing-season length, CO2 concentration, and other biotic factors can differ substantially across urban to peri-urban gradients [25]. Thus, more than just correlating factors, identifying the direct and indirect causal factors driving carbon storage in both urban and peri-urban forests is also important for developing defendable management indicators, modeling variables, and predicting future changes in ecosystem function and services. Factors such as species composition [26], in particular urban tree types [13], and surface covers of the urban forest, have been documented as influencing carbon storage and will differ within cities [15].
However, understanding such causal relationships is complex, as the effects of socio-economic and ecological drivers on urban forest function are driven by interactions between direct and indirect biotic and abiotic factors [11,27,28]. Accordingly, Timilsina et al. (2014a) used path analysis (PA) to better quantify such direct and indirect causes on urban forest carbon storage in subtropical San Juan, Puerto Rico. Methods such as structural equation modeling (SEM) or PA are regularly used for causal analyses in ecological studies and can model the effects of both direct and indirect influences [29]. Another method used to investigate the effect of urbanization on ecological patterns and processes is the urban–rural gradient approach [30]. Urban gradient studies have utilized several sampling methods to represent urban intensity gradients and to differentiate urban from non-urban areas [9,31].
Yet, we know of few studies that quantitatively analyze causal factors, as opposed to correlations, of carbon storage in urban and peri-urban forests using more progressive quantitative techniques; for instance, PA and urban-rural gradients. In order to address this dearth of information, our objective was to analyze the differences in aboveground carbon storage between urban and peri-urban forests and quantify the influence of specific drivers such as percent tree and shrub cover, tree and shrub species diversity, number of tree and shrub individuals per hectare (i.e., density), and tree and shrub species composition. In the below study, a PA approach was used to develop a causal model based on the urban forest ecosystem literature and data at the plot-level across an urban to peri-urban gradient in Shanghai, China. Specifically, we hypothesize that first, percent tree and shrub cover will affect tree and shrub carbon storage directly and indirectly via their effect on tree and shrub species diversity, tree and shrubs density and tree and shrub species composition. Secondly, tree and shrubs density will influence carbon storage directly and indirectly via its influence on tree and shrub species composition and diversity. Finally, we hypothesize that tree and shrub carbon storage is directly affected by tree and shrub species composition and diversity.
A better understanding of the socioeconomic and ecological (i.e., socio-ecological) drivers behind carbon storage in urban ecosystems will provide land managers with necessary information on how to design more effective management objectives and policies that incorporate forests as an urban nature-based solution. This information is key in rapidly urbanizing areas of the subtropics and developing world. Additionally, such an approach can be used to explore the role of socio-ecological drivers on urban ecosystem function and services without the need for digital land use and land cover polygon data; information often not easily accessible in many contexts in low and middle income countries.
2. Methods
2.1. Study Area
The study area is an urban to rural transect—56 km × 11 km—located in Shanghai, China (latitude 30.80°N–31.23°N, longitude 121.43°E–121.54°E). It starts at Shanghai’s urban core, known as People’s Square, and extends southward in to the urban periphery ending at the north shore of Hangzhou Bay, encompassing a total area of 616 km2. We refer to this as an urban to peri-urban transect hereafter. The transect passes through five administrative districts: the city center of Shanghai, Pudong new area, Minhang, Fengxian, and Jinshan; and accounts for all urban to peri-urban land cover types found in the region (Figure 1). The study area has a typical subtropical monsoon climate and a distinct seasonal temperature pattern with a mean annual temperature of 18 °C and a mean annual rainfall of approximately 1158 mm [32].
Shanghai has a population of 23 million, or 3800 inhabitants per km2, is located on an alluvial plain at the outlet of the Yangtze River, and its urbanization processes are typical of modern Chinese cities [33]. Remnant, natural vegetation has been drastically altered by centuries of human activities with just some small patches of natural secondary forests remaining in Sheshan Hill and Jinshan Island [34]. A large number of non-native trees, shrubs, forbs, and grass species were introduced in the study area in the past [35]. From 1980 to 2008, the Shanghai area experienced a loss of 29% of cultivated land cover, while its built area and forest land cover increased by 222% and 110%, respectively. Such changes were primarily due to China’s economic development and related population growth and land reform policies [33,36].
Currently, Shanghai’s urban forest is comprised of roughly 113 tree species, 85 shrubs, and 534 grass taxa [37,38], while zonal vegetation in Shanghai is mixed deciduous and evergreen broadleaf forests. Shanghai’s urban forest composition is mostly comprised of 68 common tree species, among which the 6 most common tree species are Cinnamomum camphora, Pinaceae cedrus, Platanus acerifolia, Metasequoia glyptostroboides, Magnolia grandiflora Linn., and Ginkgo biloba [38,39]. Several recent large-scale tree planting projects have been implemented and are increasing forest cover in the Shanghai metropolitan area [33].
2.2. Field Data Collection
This study used both field, plot and commonly available socio-ecological data to characterize forest and landscape attributes along the study transect. Given the urban densities typical of Chinese cities, green space distribution was not uniform across our study area. Thus, we used a stratified random sampling method for allocating plots [40] using Arcgis (version 10.0, ESRI, Redlands, CA, USA), according to the area of the different land-use types: public green (49 plots), residential green (54 plots), street trees (64 plots), garden nursery (12 plots) and other (90 plots). We allocated a total of 269 random, circular plots of 0.04 ha in the study transect to sample the tree population and measure plot characteristics following methods outlined in Zhao et al. (2013) [41]. From May to November 2012, plots were measured in the study transect (Figure 2); and data for each tree and shrub was collected and recorded. Tree measurements included: number of stems, species identification, diameter at breast height (diameter at 1.4 cm above the surface; DBH), total height, and condition. Plot-level, ocular measurements of tree and palm overstory, and shrub cover were collected, as well as an estimation of plot surface covers [41]. Woody plants were considered trees or palms if they had a DBH greater than 2.5 cm, otherwise they were considered a shrub regardless of species.
2.3. Urban–Peri-Urban Transect
Most plot-based urban forest structure studies in our literature review use LULC spatial polygons that vary in area and with various spatial resolutions in a geographic information system (GIS) to stratify and allocate plots. However, more local-scale and site-specific information on the degree of urbanization across the study transect can complement and better differentiate between truly urban and peri-urban sites [42]. Such LULC data are commonly not available in many developing countries. For example, sampling a study area with fixed area hexagon polygons is a common method for comparing and analyzing different spatial landscape metrics and reducing sampling bias due to edge effects [38,43]. Accordingly, we complemented our conventional plot allocation sampling approach and developed a hexagon-based sampling approach to better account for the social and biophysical characteristics along our urban to peri-urban gradient [44], each hexagon having an area of about 314 ha [40]. Specifically, to characterize each hexagon according to its degree of urbanization, we first analyzed seven commonly used urbanization indicators (Table 1) [22,45,46,47] with principal component analysis (PCA) using the SPSS statistical software (Version 17.0, SPSS Company, Chicago, IL, USA); which resulted in the following urbanization index (UI) equation:
where is urban index gradient value, i is a hexagon index and the indicator symbols are presented and described in Table 1. The PCA’s final gradient vector explained 78.25% of the variation in the seven variables.
Finally, we used a cluster analysis with the SPSS statistical software (Version 17.0) to characterize the urbanization gradient transect into two UI classes: urban and peri-urban (Figure 2). Specifically, using UI values, each individual hexagon was assigned into an urban (UI values = −0.10 to 1.81) or peri-urban (UI value = −5.52 to −2.94) class. The hexagons along the transect were then accordingly classified as either urban or peri-urban and were used as the analysis unit for calculating the different metrics in subsequent analyses.
2.4. Importance Values
Importance value (IV) is a comparative statistic that shows the status, function and authenticity of a species [48,49] and is regularly used to show the relative importance of a plant species according to percent density, dominance and frequency. Thus, the importance value for measured trees and shrubs was calculated as follows using Curtis and McIntosh’s approach [50,51]:
where DrA is relative abundance of species A, PrA is relative dominance of species A, and FrA is relative frequency of species A.
IVA = (DrA + PrA + FrA)/3
2.5. Tree and Shrub Carbon Storage Estimates
Urban tree canopy (UTC), the area covered by tree and shrub crowns in an urbanized area, is a commonly used measure of urban forest structure [17]. Specifically, UTC is the two-dimensional, orthogonal projection of tree and shrub canopies onto the plane of the ground surface [52]. In this study, UTC area was used as the conversion coefficient to calculate tree and shrub carbon storage in the study transect. Shrub carbon storage was calculated using Equation (5):
where SCi is plot-level shrub carbon storage (Mg) in the plot (i = 1, 2, 3, ..., 169), SUTCi is shrub crown cover (ha) in the plot (i = 1, 2, 3, ..., 169), expressed as values between 0 and 1, and P is 19.76 Mg ha−1; the average shrub biomass as calculated in the southern Qinling Mountains [53]. Finally, Cc is the conversion coefficient of dry plant biomass to carbon storage, which is assumed to be 0.5.
We estimated biomass using a tree volume-derived method [53,54,55,56] based on Zhao et al.’s [33] biomass formula developed in China to assess carbon storage. This equation estimates biomass:
where B and V are biomass (Mg ha−1) and volume (m3 ha−1), respectively for a forest type, a and b are constants (Appendix A).
In Equation (7), TCi is tree carbon storage (Mg) per plot (i = 1, 2, 3, ..., 169), Bi is total biomass of trees per plot (i = 1, 2, 3, ..., 169), and Cc is the conversion coefficient of dry plant biomass and carbon storage, which is assumed to be 0.5. Based on Equations (5)–(7), tree and shrub carbon storage (Ci) was calculated using Equation (8):
where Ci is total carbon storage (Mg) in the plot (i = 1, 2, 3, ..., 169) and SCi and TCi are shrub and tree carbon storage (Mg) in the plot (i = 1, 2, 3, ..., 169), respectively.
2.6. Species Diversity and Composition Variables
We characterized tree and shrub species diversity at the plot-level. Tree and shrub species diversity was estimated using the Shannon–Wiener index (SHDI) which used number of tree and shrub individuals in every plot with the Equation (9):
where pi is the proportion of species i in the plot, and i is the species number (1–k). We also determined plot-level tree–shrub species composition [57] with a PCA method with the number of tree and shrub individuals/species in each plot. Firstly, we used tree and shrub species number per plot to calculate the covariance matrix and then chose the variability of species and abundance of each plot as orthogonal axes. Since the first principal component axis explains most of the variation, we used it to measure the species composition for this analysis [58]. In this paper, we chose tree-shrub density (number ha−1) to reflect the plot-level stand density.
2.7. Statistical Analyses and Path Analysis
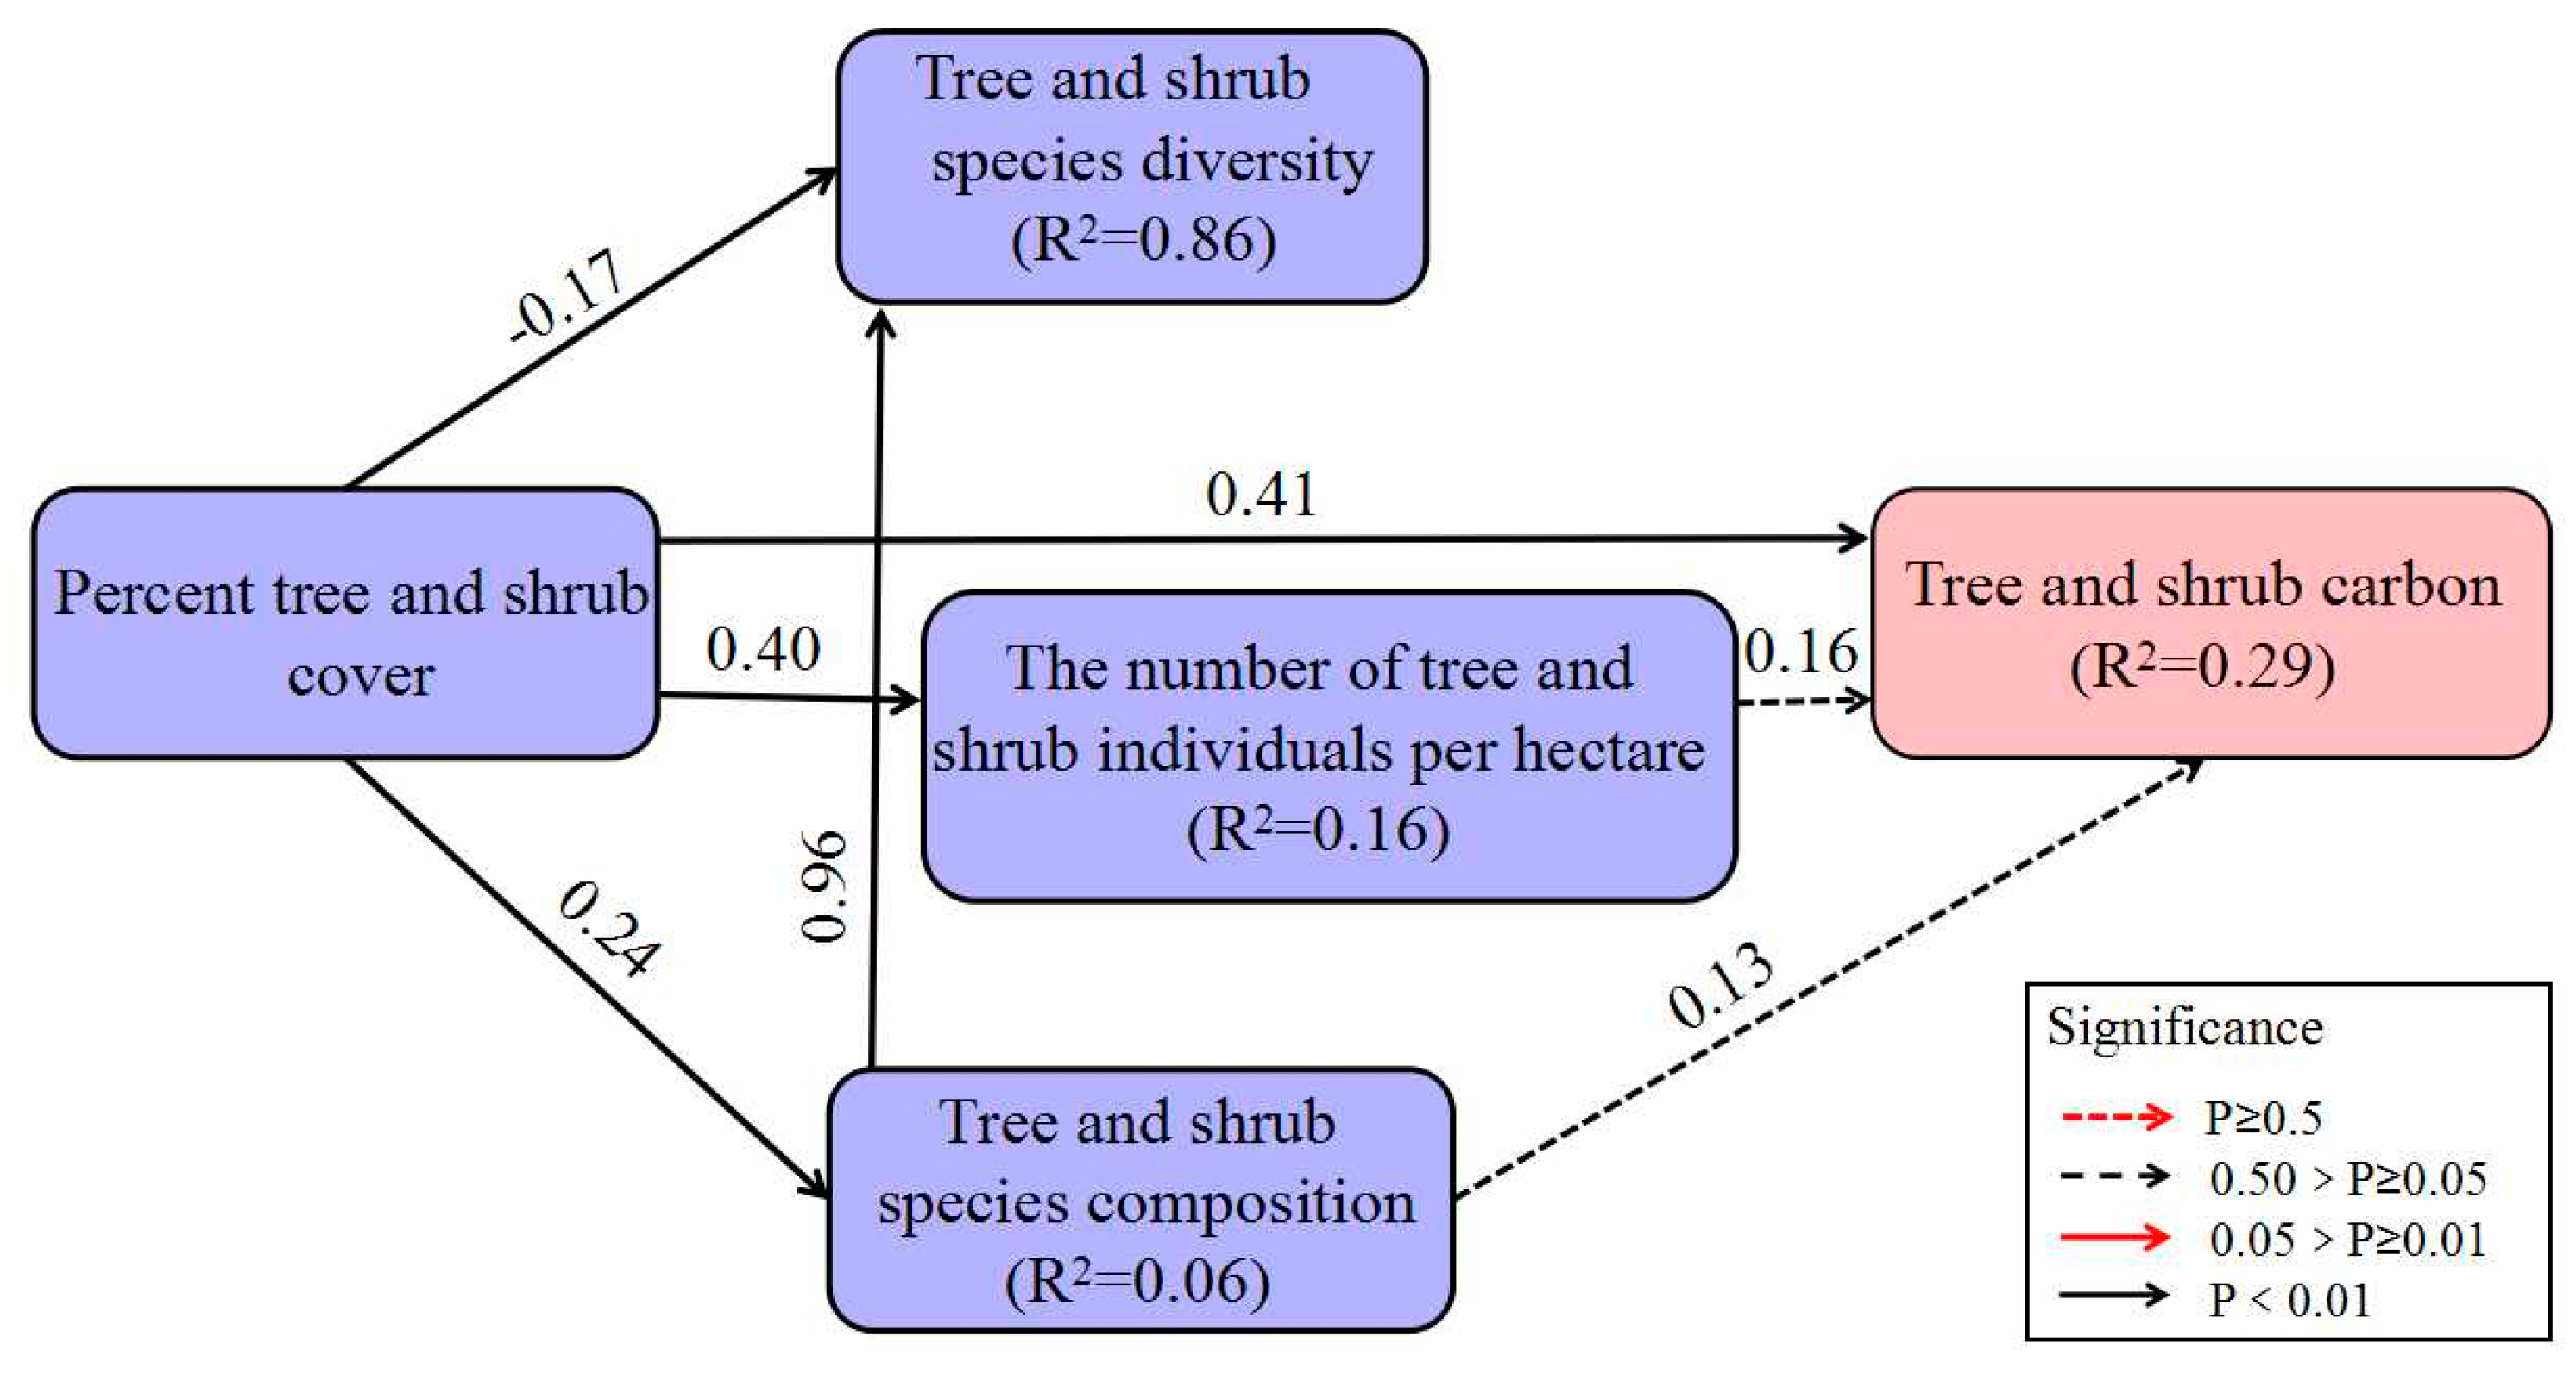
In PA, an initial diagram model is first developed using knowledge of a system to exhibit the causality among variables [29,59]. The hypothetical model (Figure 3) provides a covariance matrix that can then be used to compare expected with observed data, thereby testing the hypothesized model. Accordingly, we used Timilsina et al.’s [58] PA model for carbon storage of North American subtropical urban forest as our test PA. In the model, we validated the effect of generally reported causal drivers of tree and shrub carbon storage (Figure 3).
We used the SAS procedure analysis of moment structure (AMOS 17.0) to analyze the driver effects of these drivers on plot-level tree and shrub carbon storage. We analyzed Timilsina et al.’s [58] hypothetical model and the other commonly studied urban forest socio-ecological drivers with the undermentioned variables and their correlation: tree and shrub carbon, tree and shrub species diversity, percent tree and shrub cover, the number of tree and shrub individuals per hectare (i.e., tree-shrub density) and tree and shrub species composition. Akaike’s information criteria (AIC) provided a stepwise procedure to choose the best model [57]. The following fit statistics were used to ensure that models were not biased. Model fit was tested following the minimum discrepancy divided by degrees of freedom (CMIN/DF; <0.05 indicates good model fit), a comparative fit index (CFI; >0.90 indicates good model fit), estimate of the non-centrality parameter (NCP; =0.000 indicates good model fit), root mean square error of approximation (RMSEA; <0.05 indicates good model fit), Akaike’s information criterion, Browne–Cudeck’s Criterion, and finally Bayes information criterion, (AIC, BCC, BIC; the index of default model less than independence model) [60].
3. Results
3.1. Tree and Shrub Carbon Storage
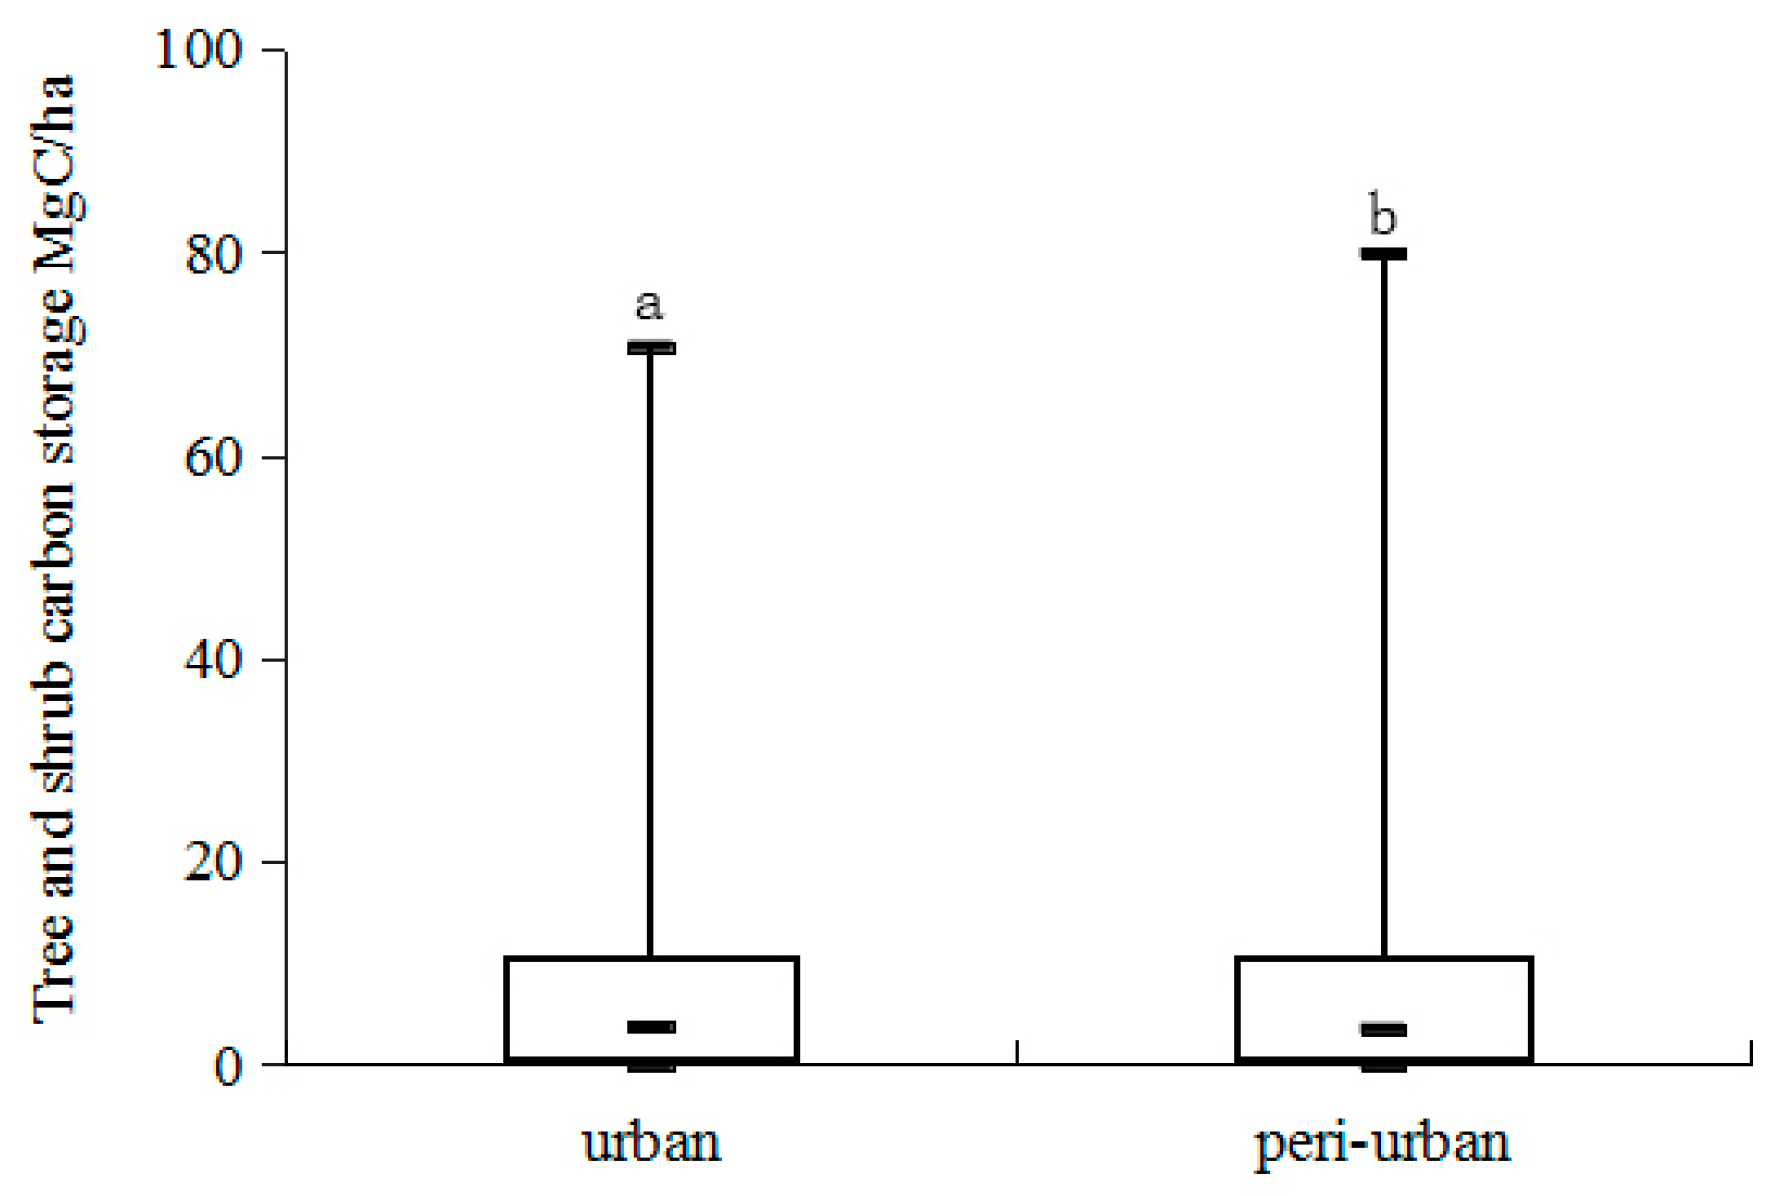
Figure 4 shows tree and shrub carbon storage in Shanghai’s urban and peri-urban forests and the differences between them. Overall, urban tree and shrub carbon ranged between 0 and 70.75 Mg C/ha, while in peri-urban areas it ranged from 0 to 79.94 Mg C/ha. Average tree and shrub carbon storage was greater in peri-urban forests (9.81 Mg C/ha) than in urban areas (8.92 Mg C/ha).
3.2. Urban and Peri-Urban Forest Composition and Structure
3.2.1. Species Composition
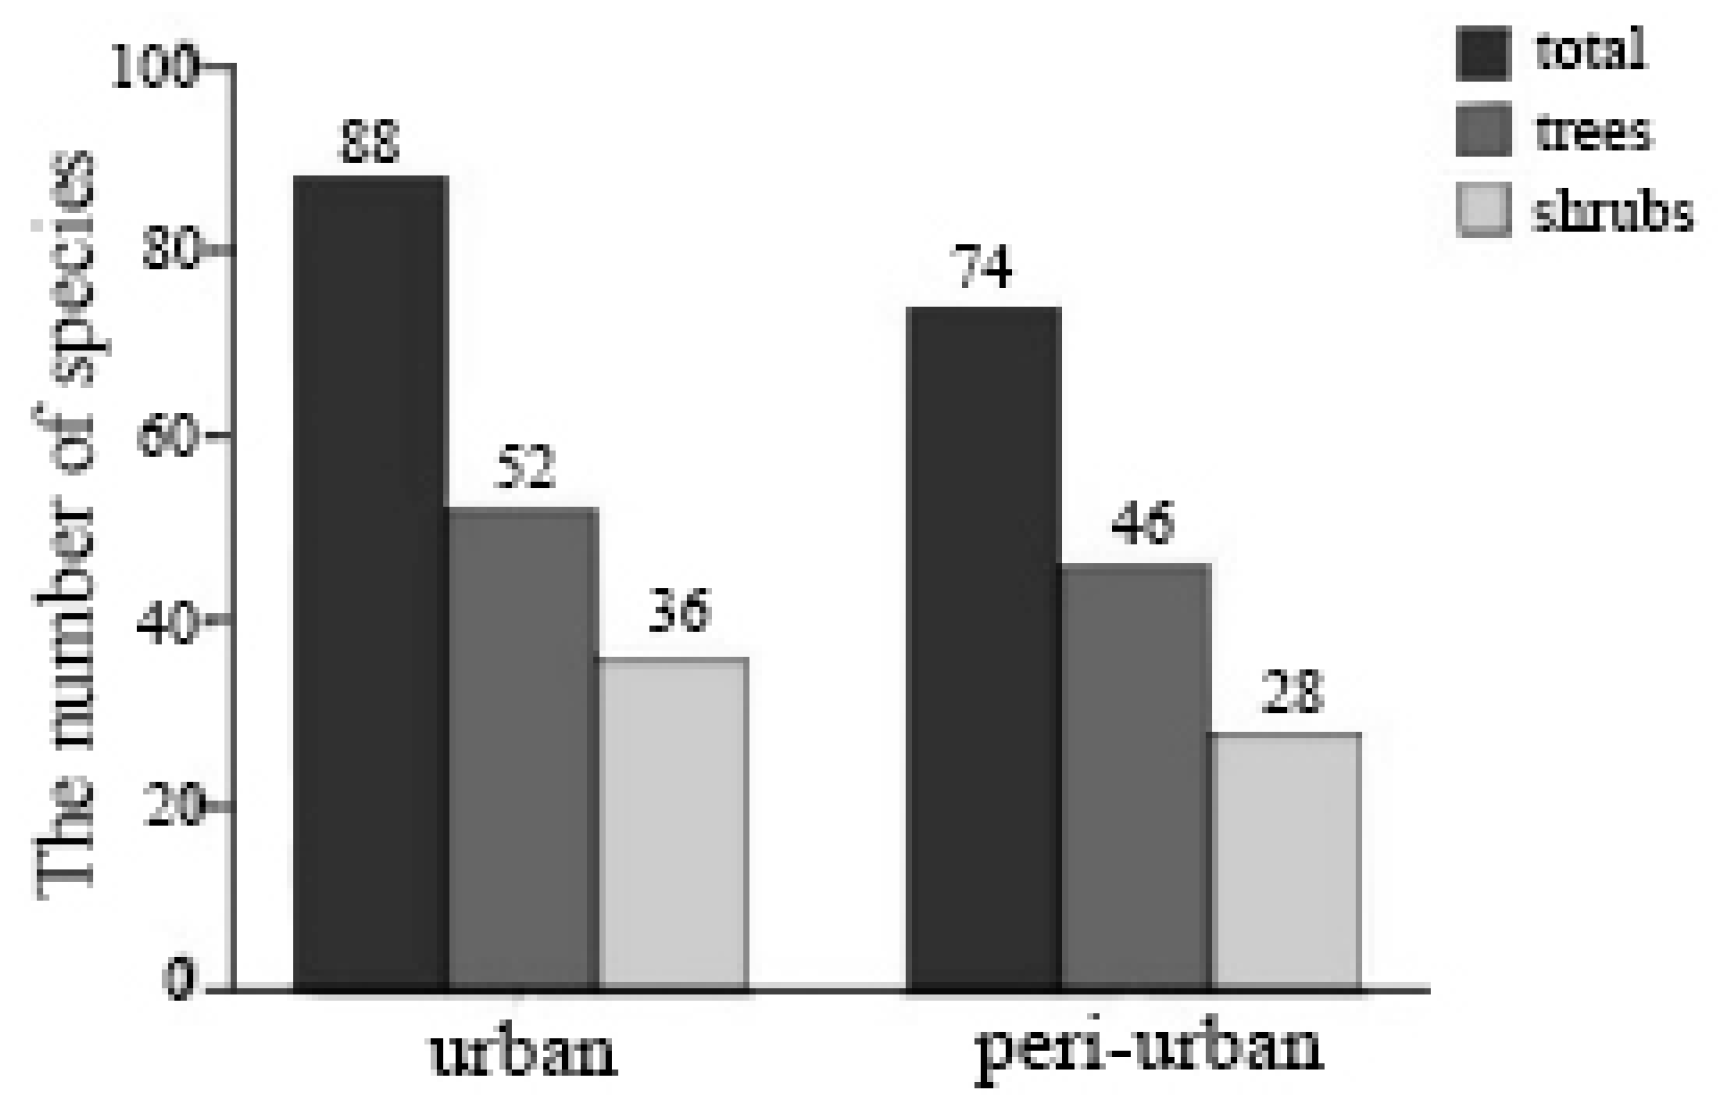
Our plot based sampling found trees and shrubs from 90 species belonging to 74 genera and 50 families in the study transect. Among these were 58 tree species belonging to 50 genera, 34 families; and 59 shrub species belonging to 51 genera, 39 families. We note that since a criterion of DBH > 2.5 cm differentiated a tree from a shrub, a given species could have both a tree and shrub form. The number of trees species in urban and peri-urban forests were 52 and 46, while the numbers of shrub species in urban and peri-urban forests were 36 and 28, respectively (Figure 5).
3.2.2. The Importance Values, Structural and Composition Characteristics
Table 2 shows the 10 tree species with the highest IVs in Shanghai’s urban and peri-urban forests. Cinnamomum camphora (L.) Presl. was the most common tree in both urban and peri-urban areas and as a subtropical evergreen broad-leaved tree, has strong ornamental and cultural values in Shanghai and is well adapted to urban environments. Metasequoia glyptostroboides, introduced in 1958 as an ornamental garden tree, is also common in wetland and in peri-urban areas, while Osmanthus sp. has mostly ornamental uses in urban areas. Table 3 shows that shrub composition is similar in that 6 of the 10 species with the highest importance values are found in both urban and peri-urban forest sites; they are: Buxus sinica var. parvifolia M. Cheng, Nerium indicum Mill. Phyllostachys viridis, Osmanthus sp., Pittosporum tobira, and Buxus megistophylla Levl. Table 4 lists the average number of tree and shrub individuals per hectare, tree and shrub species diversity, percent tree and shrub cover and tree and shrub species composition in urban and peri-urban sites. Except for the average number of tree and shrub individuals per hectare and tree and shrub species composition in peri-urban forests, all values for all the other metrics were greater in peri-urban forests. The variability in the number of woody plant individuals per hectare was high due to the inclusion of shrub individuals in our metric.
3.3. Path Analysis of Drivers of Urban Forest Carbon Storage
Our PA model 1 had a χ2 = 3.636, df = 4, p = 0.459 and paths shown in solid lines in Figure 5 are statistically significant, while dashed lines represent those paths that were not significant; the standardized path coefficient is displayed along the lines. Table 5 and Table 6 show the regression weights and standardized effects for the PA in urban forests, respectively.
The best model for predicting urban forest tree and shrub carbon storage is Model 1 (Figure 6). Since some non-significant paths in the model were resulting in in poorer fit indices, statistically insignificant paths in the model were kept as part of the analyses. This was indicated by CMIN/DF of <0.05, an NCP of 0.00, a RMSEA of <0.05, a CFI of 1.0, and AIC, BCC, BIC of the index of default model were less than the independent model. Results show that there was significant difference in the effects of different factors on urban forest carbon storage (Table 5).
The paths for Model 1 (Figure 6) for urban forests revealed that percent tree and shrub cover had a positive and significant (p < 0.05) effect on tree and shrub species composition, the number of tree and shrub individuals per hectare, and tree and shrub carbon (Table 5). Tree and shrub cover explained 85% of the variation in tree and shrub species diversity, but only 14% of the variation in tree and shrub species composition and 17% of the variation is tree-shrub density (Figure 6). Indeed, tree and shrub species composition and the number of tree and shrub individuals per hectare also affected tree and shrub carbon positively. Meanwhile, percent tree and shrub cover had direct and indirect effects on carbon (Table 6), with the indirect effect through the number of tree and shrub individuals per hectare and tree and shrub species composition being less influential (0.044) than its direct effect (0.267; Table 6).
Our model 2 for peri-urban forests had a χ2 = 3.823, df = 3, p = 0.281 and shows paths in solid lines as being statistically significant, while dashed lines represent paths that were not significant and the standardized path coefficient are shown adjacent to its path line. Table 7 and Table 8 show the regression weight and standardized effects, respectively.
Overall, we found that urban and peri-urban forests had different drivers influencing tree and shrub carbon storage as indicated by all model paths not being significant. Our analysis showed that the best model predicting tree and shrub carbon storage in peri-urban areas was Model 2 (Figure 7). Some non-significant paths were removed from the model which resulted in poorer fit indices, hence as previously mentioned, statistically insignificant paths in the models were kept (Figure 7; statistically significant paths are shown in bold). This was indicated by an CMIN/DF of <0.05, a NCP of 0.023, an RMSEA of <0.05, and a CFI of 0.997, as well as the AIC, BCC, and BIC values in the default model being were less than those of the independent model.
We also found that percent tree and shrub cover had both a significant direct (0.408) and indirect (0.093) effect on tree and shrub carbon storage in both urban and peri-urban forests (Table 7 and Table 8 and Figure 7). The direct effect of percent tree and shrub cover was higher than its indirect effect via tree-shrub density (Table 8). However, because tree and shrub species composition paths to tree and shrub carbon were not significant, we can presume that the number of tree and shrub individuals per hectare can be an intermediate variable of the indirect effect. In contrast to our urban Model 1 (Figure 6), our peri-urban Model 2 (Figure 7) shows a significant effect of percent tree and shrub cover on tree and shrub species diversity. It also shows a positive effect (0.13) of tree and shrub species composition on tree and shrub carbon, but a negative effect (−0.05) on tree and shrub carbon in Model 1 (Figure 6), that was however not significant.
4. Discussion
As reported by Timilsina et al. [15,58], urban forest studies regularly use urban tree cover as a metric or correlate for ecosystem structure, function and services [61]. Similarly, studies of urban forest carbon storage and sequestration have typically used plot data at the landscape level, that are stratified using GIS according to multi resolution LULC type polygons [2,6,18,21,40]. Overall, we found that the tree and shrub carbon storage in Shanghai’s peri-urban forests (9.81 MgC/ha) was greater than in urban areas (8.92 MgC/ha; Figure 4). Our results will differ from other studies, however. For example, in nearby subtropical Hangzhou China, C storage was 30.3 MgC/ha [18]. Also, Horn et al. [24] and Timilsina et al. [15] report an average of 17.8 and 63.0 MgC/ha for urban forests in subtropical Orlando and Gainesville US, respectively.
Since the aim of this study was to analyze the drivers of above-ground tree-shrub carbon storage in urban and peri-urban forests in a subtropical context, it is difficult to compare our results with those of other studies. For example, Nowak et al. [61] report whole tree (i.e., above and below ground) C storage for mostly temperate urban areas in the US in g/m2 of tree cover as does Lv et al. [6] for urban forests in northeast China. Additionally, different international studies will use different biomass equations, root-to-shoot ratios, remote sensing images with varying spatial resolution, and vegetation components (trees and/or shrubs and/or herbaceous) in reporting their estimates for different biomes, thus making comparisons difficult [13,18,21].
Overall, tree and shrub cover in Shanghai had a significant, positive effect on tree and shrub carbon storage but also on tree and shrub species composition, tree and shrub species diversity, and the number of tree and shrub individuals per hectare (Table 2 and Table 4). We do note that tree and shrub cover had both direct and indirect effects on urban forest carbon storage, with indirect effects via the number of tree and shrub individuals per hectare being more influential than percent tree and shrub cover alone. However, there were differences in the effects of the same path, or in the relative influence of drivers of carbon storage between urban and peri-urban forests. Thus, increasing tree and shrub cover, particularly in peri-urban forests, can be an influential measure of increasing forest carbon storage.
Timilsina et al. [58] also found that the relationship between urban tree cover and carbon storage was not direct. Dense, understory vegetation, invasive tall shrubs, and monocots (e.g., palms) with low biomass can also result in over estimates of tree cover in aerial images of the same area [13]. Zhang et al. [24] did show that individual tree carbon storage increased with decreasing tree density, shrub carbon storage increased with increasing tree and shrub species density, and carbon storage in all forest carbon pools (including standing vegetation, litter, and soil carbon) increased with decreasing tree and shrub density. Liu et al. [62] showed that urban forest aboveground carbon storage and carbon sequestration increased according to tree and shrub density.
Our results show that tree-shrub diversity had not significantly affected carbon storage. Similar dynamics have been observed in San Juan, Puerto Rico [58]. Tree and shrub species composition had a negative effect on tree and shrub carbon storage in urban forests (−0.05), but the effect was positive in peri-urban areas (0.13), that were not significant. This might be explained by the shorter ornamental tree and tall shrub composition that predominates in urban areas (Table 2 and Table 3). While larger, remnant or shade-providing trees predominate in peri-urban forests such as Magnolia grandiflora Linn., Chimonanthus praecox (Linn.) Link, and Cercis chinensis Bunge (Table 2 and Table 3).
We hypothesized that percent tree and shrub cover, tree and shrub density, tree and shrub species diversity and composition might affect carbon storage directly and indirectly. Moreover, Nowak et al. [17] in a study of carbon storage in US urban forests have also shown that two dominant factors affecting carbon storage density were tree and shrub density and diameter distribution. However, we did not analyze for the effects of tree diameter distribution and basal area in our path analysis model, two key, but little studied, correlates used in urban tree biomass estimates. The impact of some other biotic and abiotic driers of carbon storage were, however, not analyzed, including fertilization, soil quality, land use polices and ordinances, and other human management-maintenance activities. However, as stated earlier, national-level urban forest assessments do use tree cover as an index for estimating carbon storage [58,61] and other urban forest structural characteristics [5]. Currently, Shanghai’s urban forest cover is lower than the national average [39]. Thus, increasing peri-urban forest cover and density with specific trees and shrubs species can be a viable nature-based solution for mitigating CO2 emissions from Shanghai.
In other parts of China, Lv et al. [6] also found that tree C storage was greater, while soil organic carbon was the lowest in Harbin China’s temperate peri-urban forests. Ren et al. [7] also documented that suburban areas in Xiamen City, China stored a greater portion of carbon than did urban forests in the city core. However, to our knowledge, other than Timilsina et al. [58], there are no other studies that quantitatively analyze the different causal drivers behind tree carbon storage using PA or SEM or for that matter analyze the differences in aboveground tree-shrub carbon storage according to urban and peri-urban forest contexts.
5. Conclusions
Our integrated approach using field, plot and socio-ecological data to estimate tree and shrub carbon storage and to differentiate urban from non-urban sites using an urban–rural gradient and a local-scale hexagon-based urbanization index, instead of GIS land use cover polygons, can provide a potentially useful method for assessing other drivers of urban ecosystem service provision and demand across urbanization gradients. However, one limitation in our study is that we did not account for, or analyze, the causal role of ground vegetation covers (e.g., turf), soils, stand age, diameter distribution, and other biophysical drivers. Similarly including other socio-ecological drivers in our PA could have also elucidated other influences.
As such, future research can analyze the influence of other causal biotic and abiotic factors that drive carbon storage such as soil quality, fertilization, land use policies, human preferences and other management activities. In general, lower-density forests have a high potential for carbon sequestration. Hence, according to different stages of succession, the vegetation density is a key management objective that can be used to optimize community structure, improve habitat conditions, promote growth, and improve the carbon storage of the whole urban forest.
Our study presents a quantitative approach that can be used to better understand the site-specific carbon dynamics of urban forest and other ecosystem services and disservices. The use of plot-level data and a hexagon-based urbanization index instead of LULC data with varying sized polygons, provides a means of quantitatively understanding drivers of urban ecosystem services without relying on remotely sensed data from disparate scales and resolution. Our findings do show that understanding the influence of structural drivers such as percent tree and shrub cover on functions like carbon storage can be complex. Our study’s approach and findings do however contribute towards a better understanding of the complexities behind these processes and for giving land managers better information to design management objectives and policies that incorporate forests as an urban nature-based solution.
Acknowledgments
This research was funded by National Natural Science Foundation of China (No. 31100354, No. 41271554 and No. 41571047). We thank Banggu Liao for providing the LANDSAT imagery data and Jiahong Wen for providing the data of population, and Qian Zhao, Zhuangpeng Yuan and Zhengxian Liu who assisted with field data collection and Jun Gao and Wenpeng Lin for their constructive comments.
Author Contributions
Min Zhao designed the experiments; Min Zhao and Xin Yao performed the experiments and analyzed the data; Xin Yao wrote the manuscript; Min Zhao and Francisco J. Escobedo contributed to the writing and revision of the manuscript. All authors have read and approved the final manuscript.
Conflicts of Interest
The authors declare no conflict of interest.
Appendix A

Table A1.
Allometric coefficents for calculating tree biomass in Equation (6) [33].
Table A1.
Allometric coefficents for calculating tree biomass in Equation (6) [33].
| Tree Taxa or Type | Equation (6) Coefficients | |
|---|---|---|
| a | B | |
| Cunninghamia lanceolata | 0.808 | 0.0067 |
| P. massoniana, P. yunnanensis | 1.428 | 0.0014 |
| Larix | 0.94 | 0.0026 |
| Picea, Abies | 0.56 | 0.0035 |
| P. tabulaeformis | 0.32 | 0.0085 |
| P. armandii | 0.542 | 0.0077 |
| Other oines and conifer forests | 1.393 | 0.0008 |
| Cypress | 1.125 | 0.0002 |
| Mixed conifer and deciduous forests | 2.558 | −0.0038 |
| Populus | 0.587 | 0.0071 |
| Betula | 0.975 | 0.001 |
| Quercus | 0.824 | 0.0007 |
| Cinnamomum, Phoebe | 0.76 | 0.0012 |
| Casuarina | 0.807 | −0.0001 |
| Sassafras, Eucalyptus and mixed broad-leaf forests | 0.727 | −0.0012 |
| Nonmerchantable woods | 0.98 | −0.0007 |
| Tsuga, Cryptomeria, Keteleeria etc. | 1.749 | −0.00002 |
References
- Liu, C.F.; Li, X.M.; He, X.Y. Concept discussion and analysis of urban forest. Chin. J. Ecol. 2003, 22, 146–149. (In Chinese) [Google Scholar]
- Hutyra, L.R.; Yoon, B.; Alberti, M. Terrestrial carbon stocks across a gradient of urbanization: A study of the Seattle, WA region. Glob. Chang. Biol. 2011, 17, 783–797. [Google Scholar] [CrossRef]
- Strohbach, M.W.; Haase, D. Above-ground carbon storage by urban trees in Leipzig, Germany: Analysis of patterns in a European city. Landsc. Urban Plan. 2012, 104, 95–104. [Google Scholar] [CrossRef]
- Churkina, G. Modeling the carbon cycle of urban systems. Ecol. Model. 2008, 216, 107–113. [Google Scholar] [CrossRef]
- Imhoff, M.L.; Bounoua, L.; DeFries, R.; Lawrence, W.T.; Stutzer, D.; Tucker, C.J. The consequences of urban land transformation on net primary productivity in the United States. Remote Sens. Environ. 2004, 89, 434–443. [Google Scholar] [CrossRef]
- Lv, H.; Wang, W.; He, X.; Xiao, L.; Zhou, W.; Zhang, B. Quantifying tree and soil carbon stocks in a temperate urban forest in northeast China. Forests 2016, 7, 200. [Google Scholar] [CrossRef]
- Ren, Y.; Wei, X.; Wei, X.H.; Pan, J.Z.; Xie, P.P.; Peng, D.; Zhao, J.Z. Relationship between vegetation carbon storage and urbanization: A case study of Xiamen, China. For. Ecol. Manag. 2011, 261, 1214–1223. [Google Scholar] [CrossRef]
- Solomon, S.; Qin, D.; Manning, M.; Chen, Z.; Marquis, M.; Averyt, K.B.; Tignor, M.; Miller, H.L. Contribution of Working Group I to the Fourth Assessment Report of the Intergovernmental Panel on Climate Change; Cambridge University Press: Cambridge, UK, 2007. [Google Scholar]
- Theobald, D.M. Placing exurban land use change in a human modification framework. Front. Ecol. Environ. 2004, 2, 139–144. [Google Scholar] [CrossRef]
- Zhao, S.; Da, L.; Tang, Z.; Fang, H.; Song, K.; Fang, J. Ecological consequences of rapid urban expansion: Shanghai, China. Front. Ecol. Environ. 2006, 4, 341–346. [Google Scholar] [CrossRef]
- Dobbs, C.; Nitschke, C.R.; Kendal, D. Global drivers and tradeoffs of three urban vegetation ecosystem services. PLoS ONE 2014, 9, e113000. [Google Scholar] [CrossRef] [PubMed]
- Hanson, C.; Yonavjak, L.; Clarke, C.; Minnemeyer, S.; Boisrobert, L.; Leach, A.; Schleeweis, K. Southern Forests for the Future; World Resources Institute: Washington, DC, USA, 2010. [Google Scholar]
- Escobedo, F.; Varela, S.; Zhao, M.; Wagner, J.; Zipperer, W. Analyzing the efficacy of subtropical urban forests in offsetting carbon emissions from cities. Environ. Sci. Policy 2010, 13, 362–372. [Google Scholar] [CrossRef]
- Schedlbauer, J.L.; Munyon, J.W.; Oberbauer, S.F.; Gaiser, E.E.; Starr, G. Controls on ecosystem carbon dioxide exchange in short- and long-hydroperiod Florida Everglades freshwater marshes. Wetlands 2012, 32, 801–812. [Google Scholar] [CrossRef]
- Timilsina, N.; Staudhammer, C.L.; Escobedo, F.J.; Lawrence, A. Tree biomass, wood waste yield, and carbon storage changes in an urban forest. Landsc. Urban Plan. 2014, 127, 18–27. [Google Scholar] [CrossRef]
- Yin, K.; Lu, D.S.; Tian, Y.C. Evaluation of Carbon and Oxygen Balances in Urban Ecosystems Using Land Use/Land Cover and Statistical Data. Sustainability 2015, 7, 195–221. [Google Scholar] [CrossRef]
- Nowak, D.J.; Daniel, E.C. Carbon storage and sequestration by urban trees in the USA. Environ. Pollut. 2002, 116, 381–389. [Google Scholar] [CrossRef]
- Zhao, M.; Kong, Z.; Escobedo, F.; Gao, J. Impacts of urban forests on offsetting carbon emissions from industrial energy consumption for Hangzhou, China. J. Environ. Manag. 2010, 91, 807–813. [Google Scholar] [CrossRef] [PubMed]
- McPherson, E.G.; Nowak, D.; Heisler, G.; Grimmond, S.; Souch, C.; Grant, R.; Rowntree, R. Quantifying urban forest structure, function, and value: The Chicago Urban Forest Climate Project. Urban Ecosyst. 1997, 1, 49–61. [Google Scholar] [CrossRef]
- Buyantuyev, A.; Wu, J. Urbanization alters spatiotemporal patterns of ecosystem primary production: A case study of the Phoenix metropolitan region, USA. J. Arid Environ. 2009, 73, 512–520. [Google Scholar] [CrossRef]
- Davies, Z.G.; Dallimer, M.; Edmondson, J.L.; Leake, J.R.; Gaston, K.J. Identifying potential sources of variability between vegetation carbon storage estimates for urban areas. Environ. Pollut. 2013, 183, 133–142. [Google Scholar] [CrossRef] [PubMed]
- Dobbs, C.; Escobedo, F.; Zipperer, W. A framework for developing urban forest ecosystem services and goods indicators. Landsc. Urban Plan. 2011, 99, 196–206. [Google Scholar] [CrossRef]
- Raciti, S.M.; Hutyra, L.R.; Rao, P.; Finzi, A.C. Inconsistent definitions of “urban” result in different conclusions about the size of urban carbon and nitrogen stocks. Ecol. Appl. 2012, 22, 1015–1035. [Google Scholar] [CrossRef] [PubMed]
- Zhang, C.; Tian, H.Q.; Pan, S.F.; Liu, M.J.; Lockaby, G.; Schilling, E.B.; Stanturf, J. Effects of forest regrowth and urbanization on ecosystem carbon storage in a rural–urban gradient in the southeastern United States. Ecosystem 2008, 11, 1211–1222. [Google Scholar] [CrossRef]
- Pickett, S.T.A. Urban ecological systems: Scientific foundations and a decade of progress. J. Environ. Manag. 2011, 92, 331–362. [Google Scholar] [CrossRef] [PubMed]
- Horn, J.; Escobedo, F.J.; Hinkle, R.; Hostetler, M.; Timilsina, N. The role of composition, invasives, and maintenance emissions on urban forest carbon stocks. Environ. Manag. 2015, 55, 431–442. [Google Scholar] [CrossRef] [PubMed]
- Hall, J.M.; Holt, T.V.; Daniels, A.E.; Balthazar, V.; Lambin, E.F. Trade-offs between tree cover, carbon storage and floristic biodiversity in reforesting landscapes. Landsc. Ecol. 2012, 27, 1135–1147. [Google Scholar] [CrossRef]
- Lawton, J.H. What do species do in ecosystems? Oikos 1994, 71, 367–374. [Google Scholar] [CrossRef]
- Shipley, B. Cause and Correlation in Biology: A User’s Guide to Path Analysis, Structural Equations and Casual Inference, 1st ed.; Cambridge University Press: Cambridge, UK, 2000; pp. 100–126. [Google Scholar]
- McDonnell, M.J.; Pickett, S.T.A. Ecosystem Structure and Function along Urban-Rural Gradients: An Unexploited Opportunity for Ecology. Ecology 1990, 71, 1231–1237. [Google Scholar] [CrossRef]
- McIntyre, N.E.; Knowles-Yánez, K.; Hope, D. Urban ecology as an interdisciplinary field: Differences in the use of “urban” between the social and natural sciences. Urban Ecosyst. 2000, 4, 5–24. [Google Scholar] [CrossRef]
- Liang, H.; Chen, X.S.; Yin, X.J.; Da, L.J. The spatial-temporal pattern and influencing factors of negative air ions in urban forests, Shanghai, China. J. For. Res. 2014, 25, 847–856. [Google Scholar] [CrossRef]
- Zhao, M.; Zhou, G.S. Carbon storage of forest vegetation in China and its relationship with climate factors. Clim. Chang. 2006, 74, 175–189. [Google Scholar] [CrossRef]
- Gao, J. Study on the basic characteristics of natural vegetation regionalization and protection of Shanghai. Geogr. Res. 1997, 16, 82–88. (In Chinese) [Google Scholar]
- Wang, Z.; Cui, X.; Yin, S.; Shen, G.R.; Han, Y.J.; Liu, C.J. Characteristics of carbon storage in Shanghai’s urban forest. Chin. Sci. Bull. 2013, 58, 1130–1138. (In Chinese) [Google Scholar] [CrossRef]
- Cui, L.; Shi, J. Urbanization and its environmental effects in Shanghai, China. Urban Clim. 2012, 2, 1–15. [Google Scholar] [CrossRef]
- Shen, L.Y. Studies and Assessments on Vegetation Characteristics in Urban Forest of Shanghai. Ph.D. Thesis, Nanjing Forestry University, Nanjing, China, 2008. (In Chinese). [Google Scholar]
- Tian, Y.H.; Jim, C.Y.; Tao, Y.; Shi, T. Landscape ecological assessment of green space fragmentation in Hong Kong. Urban For. Urban Green. 2011, 10, 79–86. [Google Scholar] [CrossRef]
- Xu, F.; Liu, W.H.; Ren, W.L.; Zhong, Q.C.; Zhang, G.L.; Wang, K.Y. Effects of community structure on carbon fixation of urban forests in Shanghai, China. Chin. J. Ecol. 2010, 29, 439–447. (In Chinese) [Google Scholar]
- Zhao, Q.; Zhao, M. Carbon storage in urban green space—A case of “urban-to-rural” gradient in Shanghai. Resour. Environ. Yangtze Basin 2015, 24, 531–538. (In Chinese) [Google Scholar]
- Zhao, M.; Escobedo, F.J.; Wang, R.; Zhou, Q.; Lin, W.; Gao, J. Woody vegetation composition and structure in peri-urban Chongming Island, China. Environ. Manag. 2013, 51, 999–1011. [Google Scholar] [CrossRef] [PubMed]
- McDonnell, M.J.; Hahs, A.K. The use of gradient analysis studies in advancing our understanding of the ecology of urbanizing landscapes: Current status and future directions. Landsc. Ecol. 2008, 23, 1143–1155. [Google Scholar] [CrossRef]
- De Clercq, E.M.; De Wulf, R.; Van Herzele, A. Relating spatial pattern of forest cover to accessibility. Landsc. Urban Plan. 2007, 80, 14–22. [Google Scholar] [CrossRef]
- Birch, C.P.D.; Oom, S.D.; Beecham, J.A. Rectangular and hexagonal grids used for observation, experiment and simulation in ecology. Ecol. Model. 2007, 206, 347–359. [Google Scholar] [CrossRef]
- Hahs, A.K.; McDonnell, M.J. Selecting independent measures to quantify Melbourne’s urban–rural gradient. Landsc. Urban Plan. 2006, 78, 435–448. [Google Scholar] [CrossRef]
- Tenneson, K. The Residential Urban Forest: Linking Structure, Function and Management; University of Washington: Seattle, WA, USA, 2013. [Google Scholar]
- Qureshi, S.; Haase, D.; Coles, R. The Theorized Urban Gradient (TUG) method—A conceptual framework for socio-ecological sampling in complex urban agglomerations. Ecol. Indic. 2014, 36, 100–110. [Google Scholar] [CrossRef]
- Cao, W.; Li, Y.; Wang, S.L.; Yu, X.; Zhu, C.; Liu, T. Community type and species diversity of broadleaved-Korean pine mixed forest in Northeast China. Chin. J. Appl. Ecol. 2007, 18, 2406–2411. [Google Scholar]
- Han, Y.G.; Ren, Y.; Han, Y.L. Study on diversity of lawn community under arboreous forest. J. Inner Mong. For. Sci. Technol. 2008, 34, 21–31. (In Chinese) [Google Scholar]
- Curtis, J.T.; McIntosh, R.P. The interrelations of certain analytic and synthetic phytosociological characters. Ecology 1950, 31, 434–455. [Google Scholar] [CrossRef]
- Curtis, J.T.; McIntosh, R.P. An upland forest continuum in the prairie-forest border region of Wisconsin. Ecology 1951, 32, 476–493. [Google Scholar] [CrossRef]
- Walton, J.T.; Nowak, D.J.; Greenfield, E.J. Assessing urban forest canopy cover using airborne or satellite imagery. Arboricult. Urban For. 2008, 34, 334–340. [Google Scholar]
- Fang, J.Y.; Liu, G.H.; Xu, S.L. Biomass and net production of forest vegetation in China. Acta Ecol. Sin. 1996, 16, 497–508. (In Chinese) [Google Scholar]
- Zhou, G.S.; Wang, Y.H.; Jiang, Y.L.; Yang, Z.Y. Estimating biomass and net primary production from forest inventory data: A case study of Chian’s Larix forests’. For. Ecol. Manag. 2002, 169, 149–157. [Google Scholar] [CrossRef]
- Fang, J.Y.; Liu, G.H.; Xu, S.L. Forest biomass of China: An estimation based on the biomass–volume relationship. Ecol. Appl. 1998, 8, 1084–1091. (In Chinese) [Google Scholar] [CrossRef]
- Fang, J.Y.; Wang, Z.M. Forest biomass estimates at regional and global levels, with special reference to China’s forest biomass. Ecol. Res. 2001, 16, 587–592. (In Chinese) [Google Scholar] [CrossRef]
- Jonsson, M.; Wardle, D.A. Structural equation modeling reveals plant-community drivers of carbon storage in boreal forest ecosystems. Biol. Lett. 2009, 6, 116–119. [Google Scholar] [CrossRef] [PubMed]
- Timilsina, N.; Escobedo, F.J.; Staudhammer, C.L.; Brandeis, T. Analyzing the causal factors of carbon stores in a subtropical urban. Ecol. Complex. 2014, 20, 23–32. [Google Scholar] [CrossRef]
- Bollen, K.A. Structural Equations with Latent Variables; John Wiley & Sons: New York, NY, USA, 1989. [Google Scholar]
- Wu, M.L. Structural Equation Model: The Operation and Application of AMOS, 1st ed.; Chongqing University Press: Chongqing, China, 2009; pp. 115–158. (In Chinese) [Google Scholar]
- Nowak, D.J.; Greenfield, E.J.; Hoehn, R.E.; Lapoint, E. Carbon storage and sequestration by trees in urban and community areas of the United States. Environ. Pollut. 2013, 178, 229–236. [Google Scholar] [CrossRef] [PubMed]
- Liu, C.F.; Li, X.M. Carbon storage and sequestration by urban forests in Shenyang, China. Urban For. Urban Green. 2012, 11, 121–128. [Google Scholar] [CrossRef]
Figure 1.
The Shanghai, China study area and location of the urban–peri-urban transect. Lower left image is a LANDSAT image taken on 14 June 2000 and we note that pink colors are densely, urbanized high impervious surface cover areas while green areas are non-urban vegetated areas.
Figure 1.
The Shanghai, China study area and location of the urban–peri-urban transect. Lower left image is a LANDSAT image taken on 14 June 2000 and we note that pink colors are densely, urbanized high impervious surface cover areas while green areas are non-urban vegetated areas.
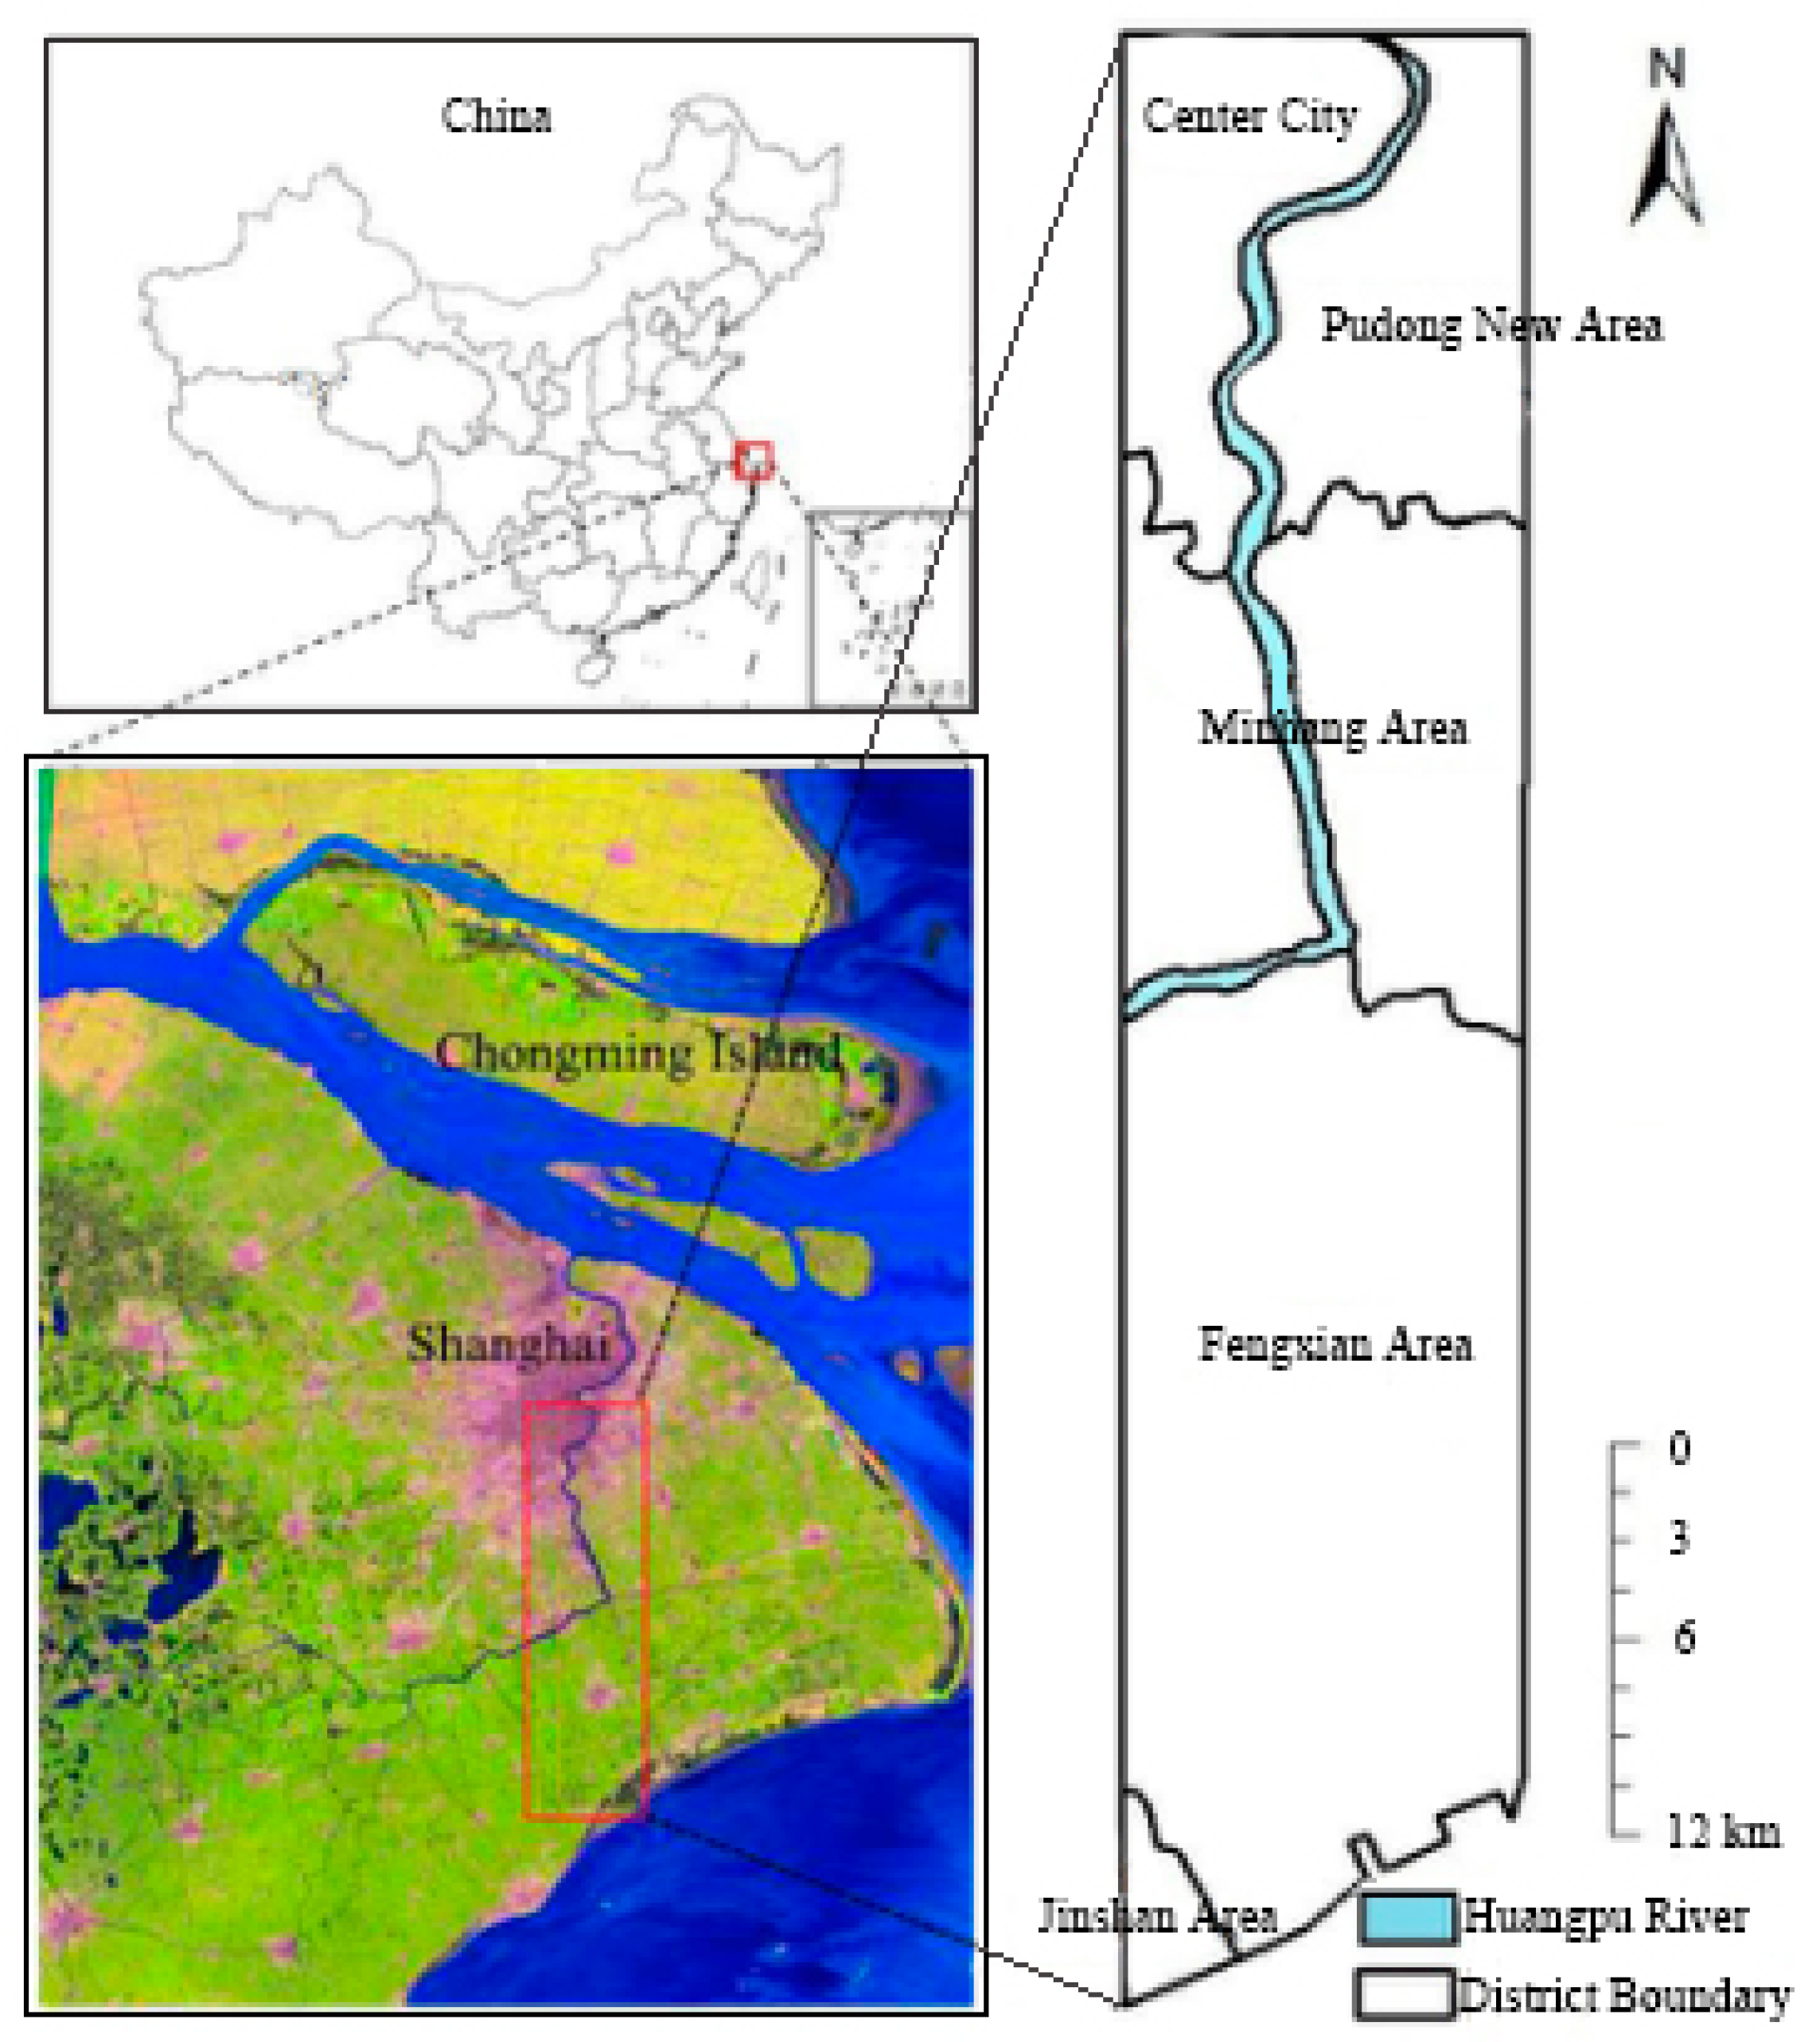
Figure 2.
Distribution and locations of field sample plots (left) and related urbanization index hexagons (right) in the Shanghai, China urban to peri-urban transect indicating specific urban (values of −0.10 to 1.81) or peri-urban (values of −5.52 to −2.94) hexagons or sites.
Figure 2.
Distribution and locations of field sample plots (left) and related urbanization index hexagons (right) in the Shanghai, China urban to peri-urban transect indicating specific urban (values of −0.10 to 1.81) or peri-urban (values of −5.52 to −2.94) hexagons or sites.
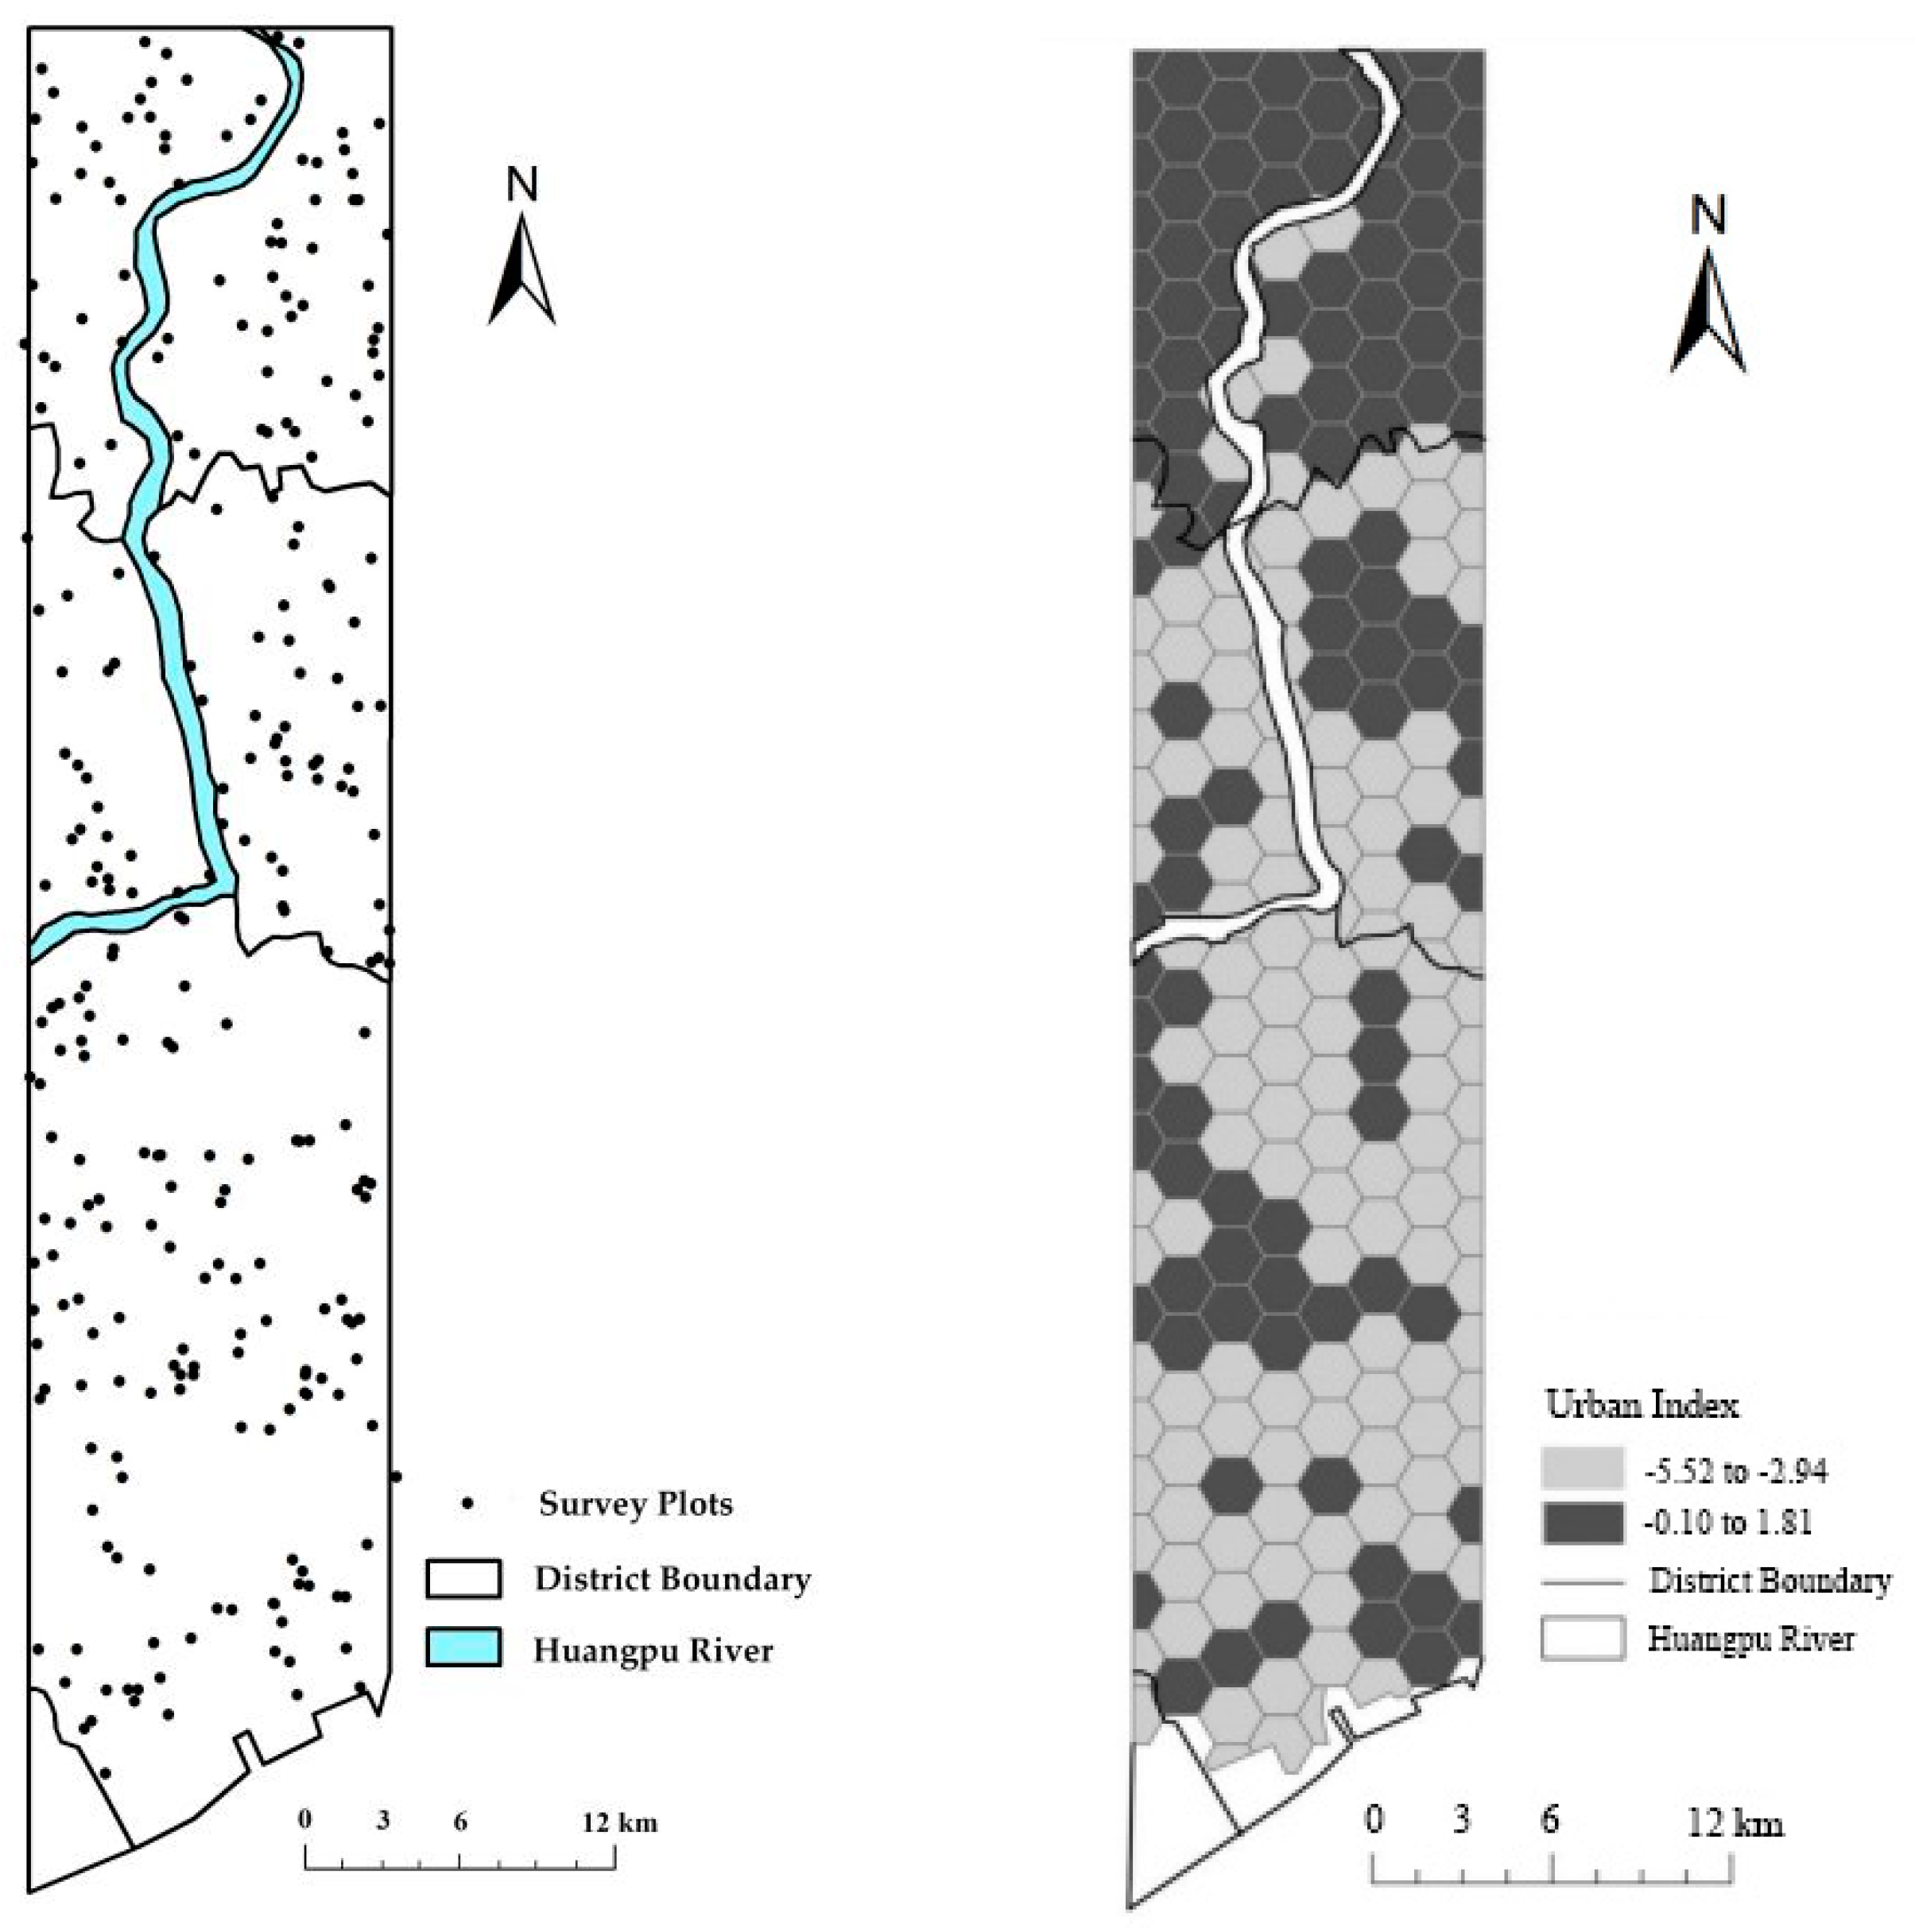
Figure 3.
Path analysis model for drivers of Shanghai China’s urban forest carbon storage.
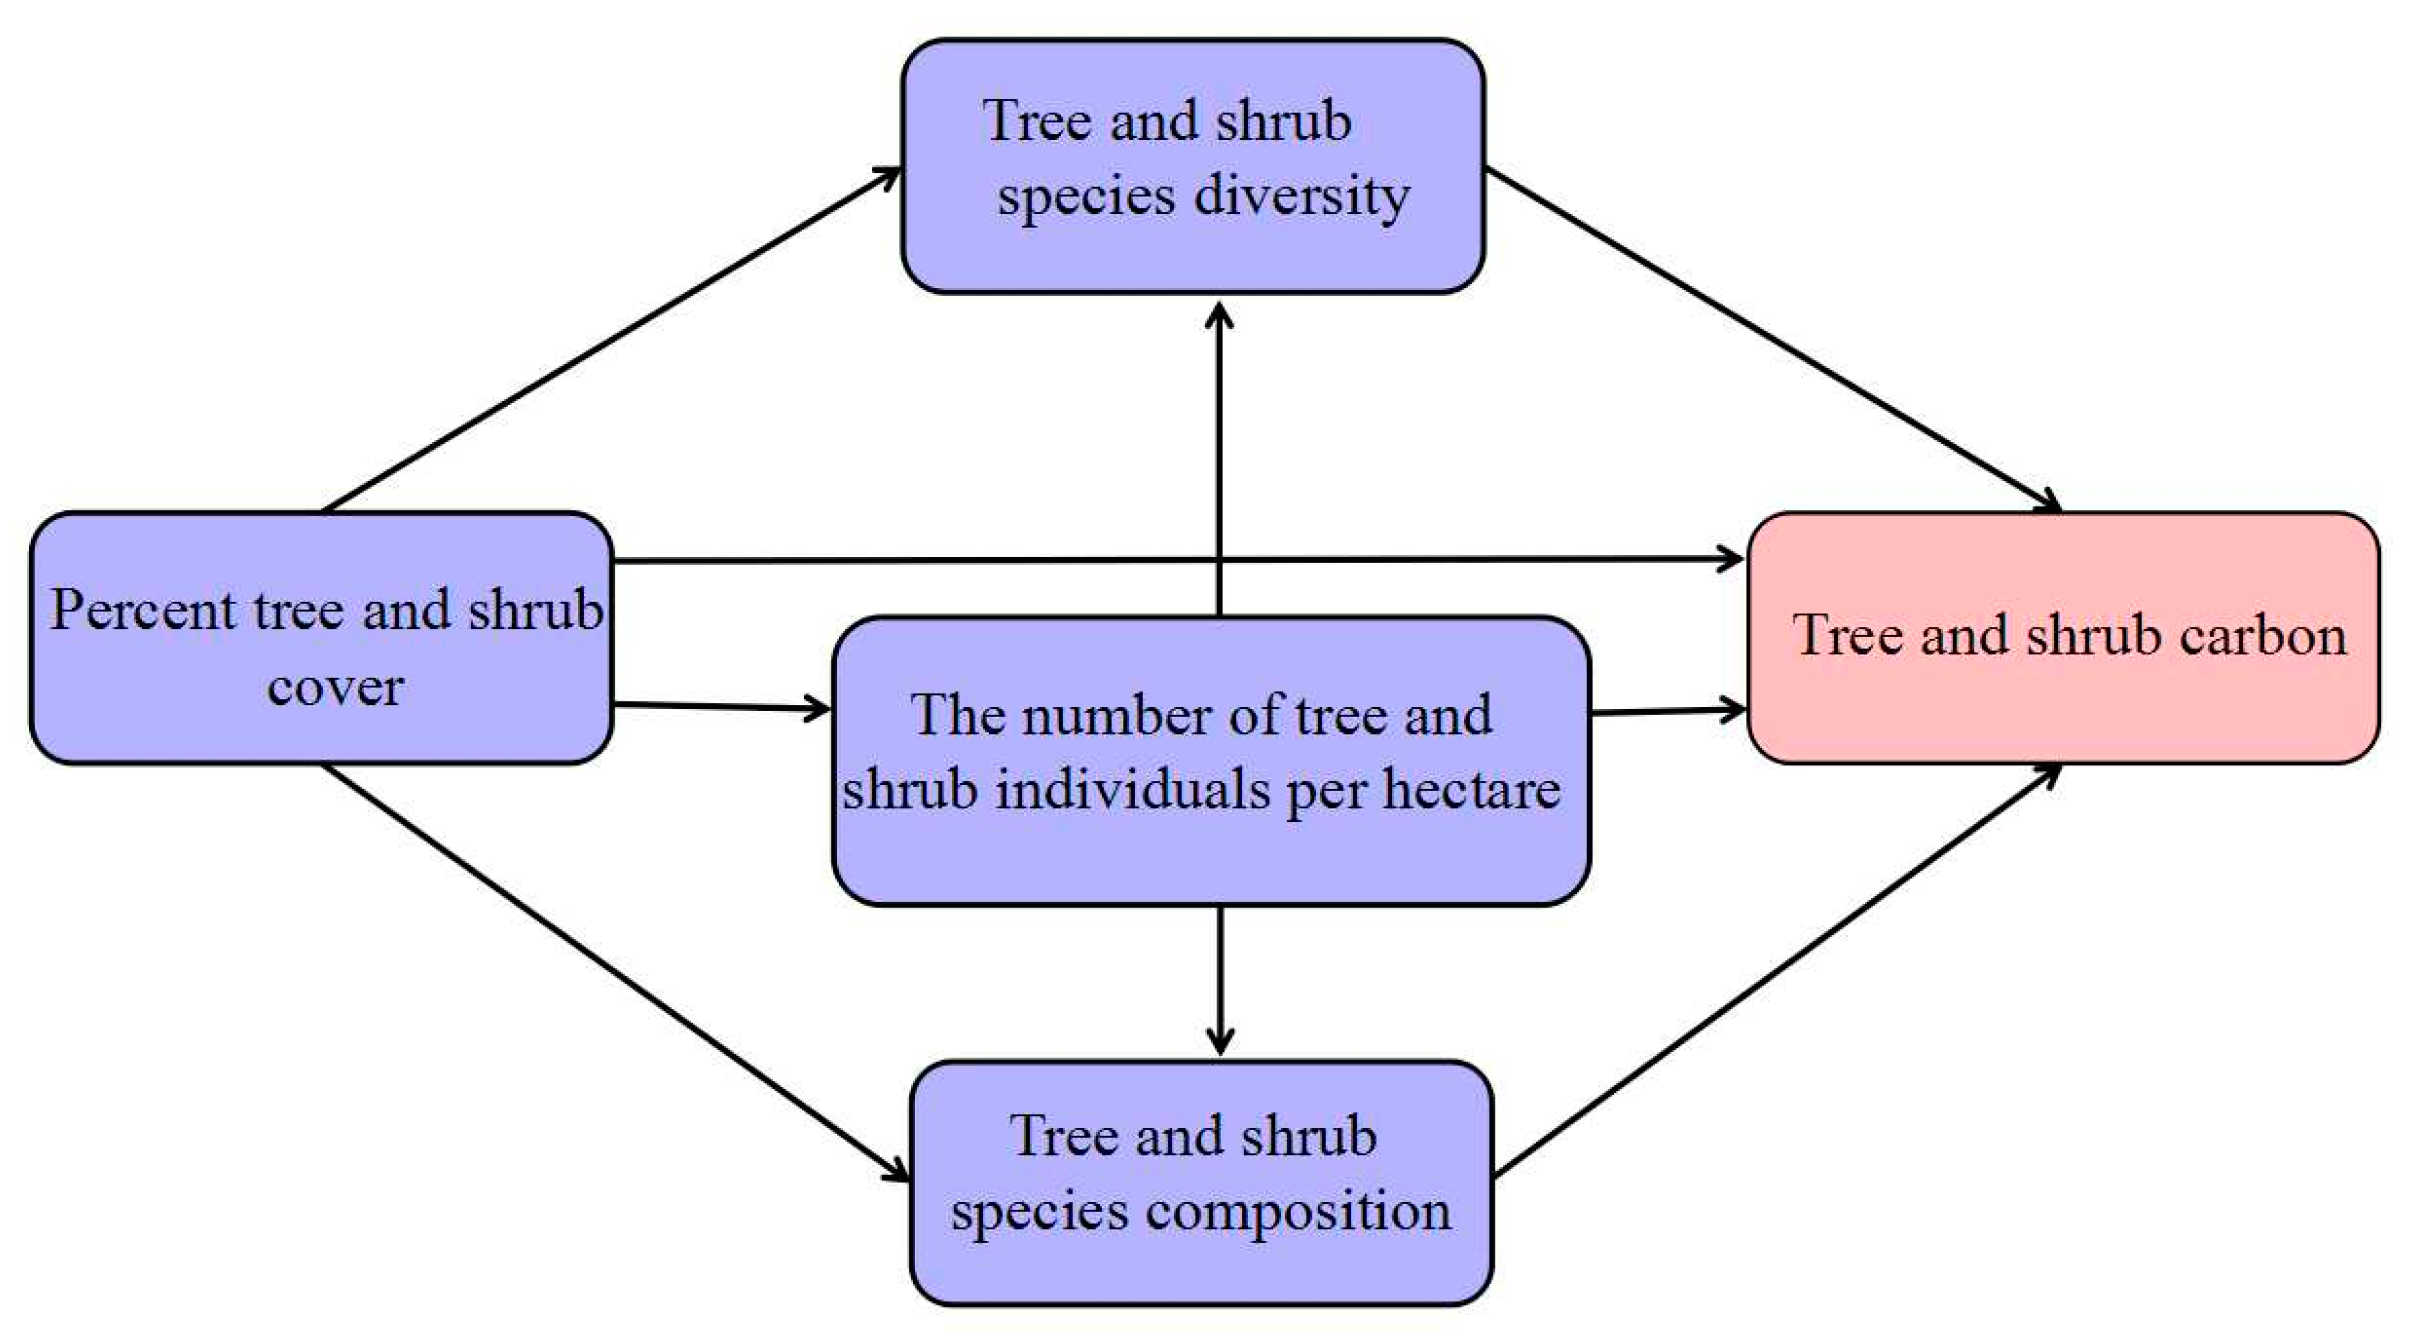
Figure 4.
Tree and shrub carbon storage in urban and peri-urban forests. “a” and “b” mean the difference of the tree and shrub carbon storage in urban and peri-urban forests was significant (p < 0.05).
Figure 4.
Tree and shrub carbon storage in urban and peri-urban forests. “a” and “b” mean the difference of the tree and shrub carbon storage in urban and peri-urban forests was significant (p < 0.05).

Figure 5.
The number of tree and shrub species in an urban and peri-urban transect in Shanghai, China.
Figure 5.
The number of tree and shrub species in an urban and peri-urban transect in Shanghai, China.

Figure 6.
Model 1 with results of path analysis for drivers of carbon storage in Shanghai China’s urban forests. Values along the lines are the standardized coefficient for that specific path.
Figure 6.
Model 1 with results of path analysis for drivers of carbon storage in Shanghai China’s urban forests. Values along the lines are the standardized coefficient for that specific path.
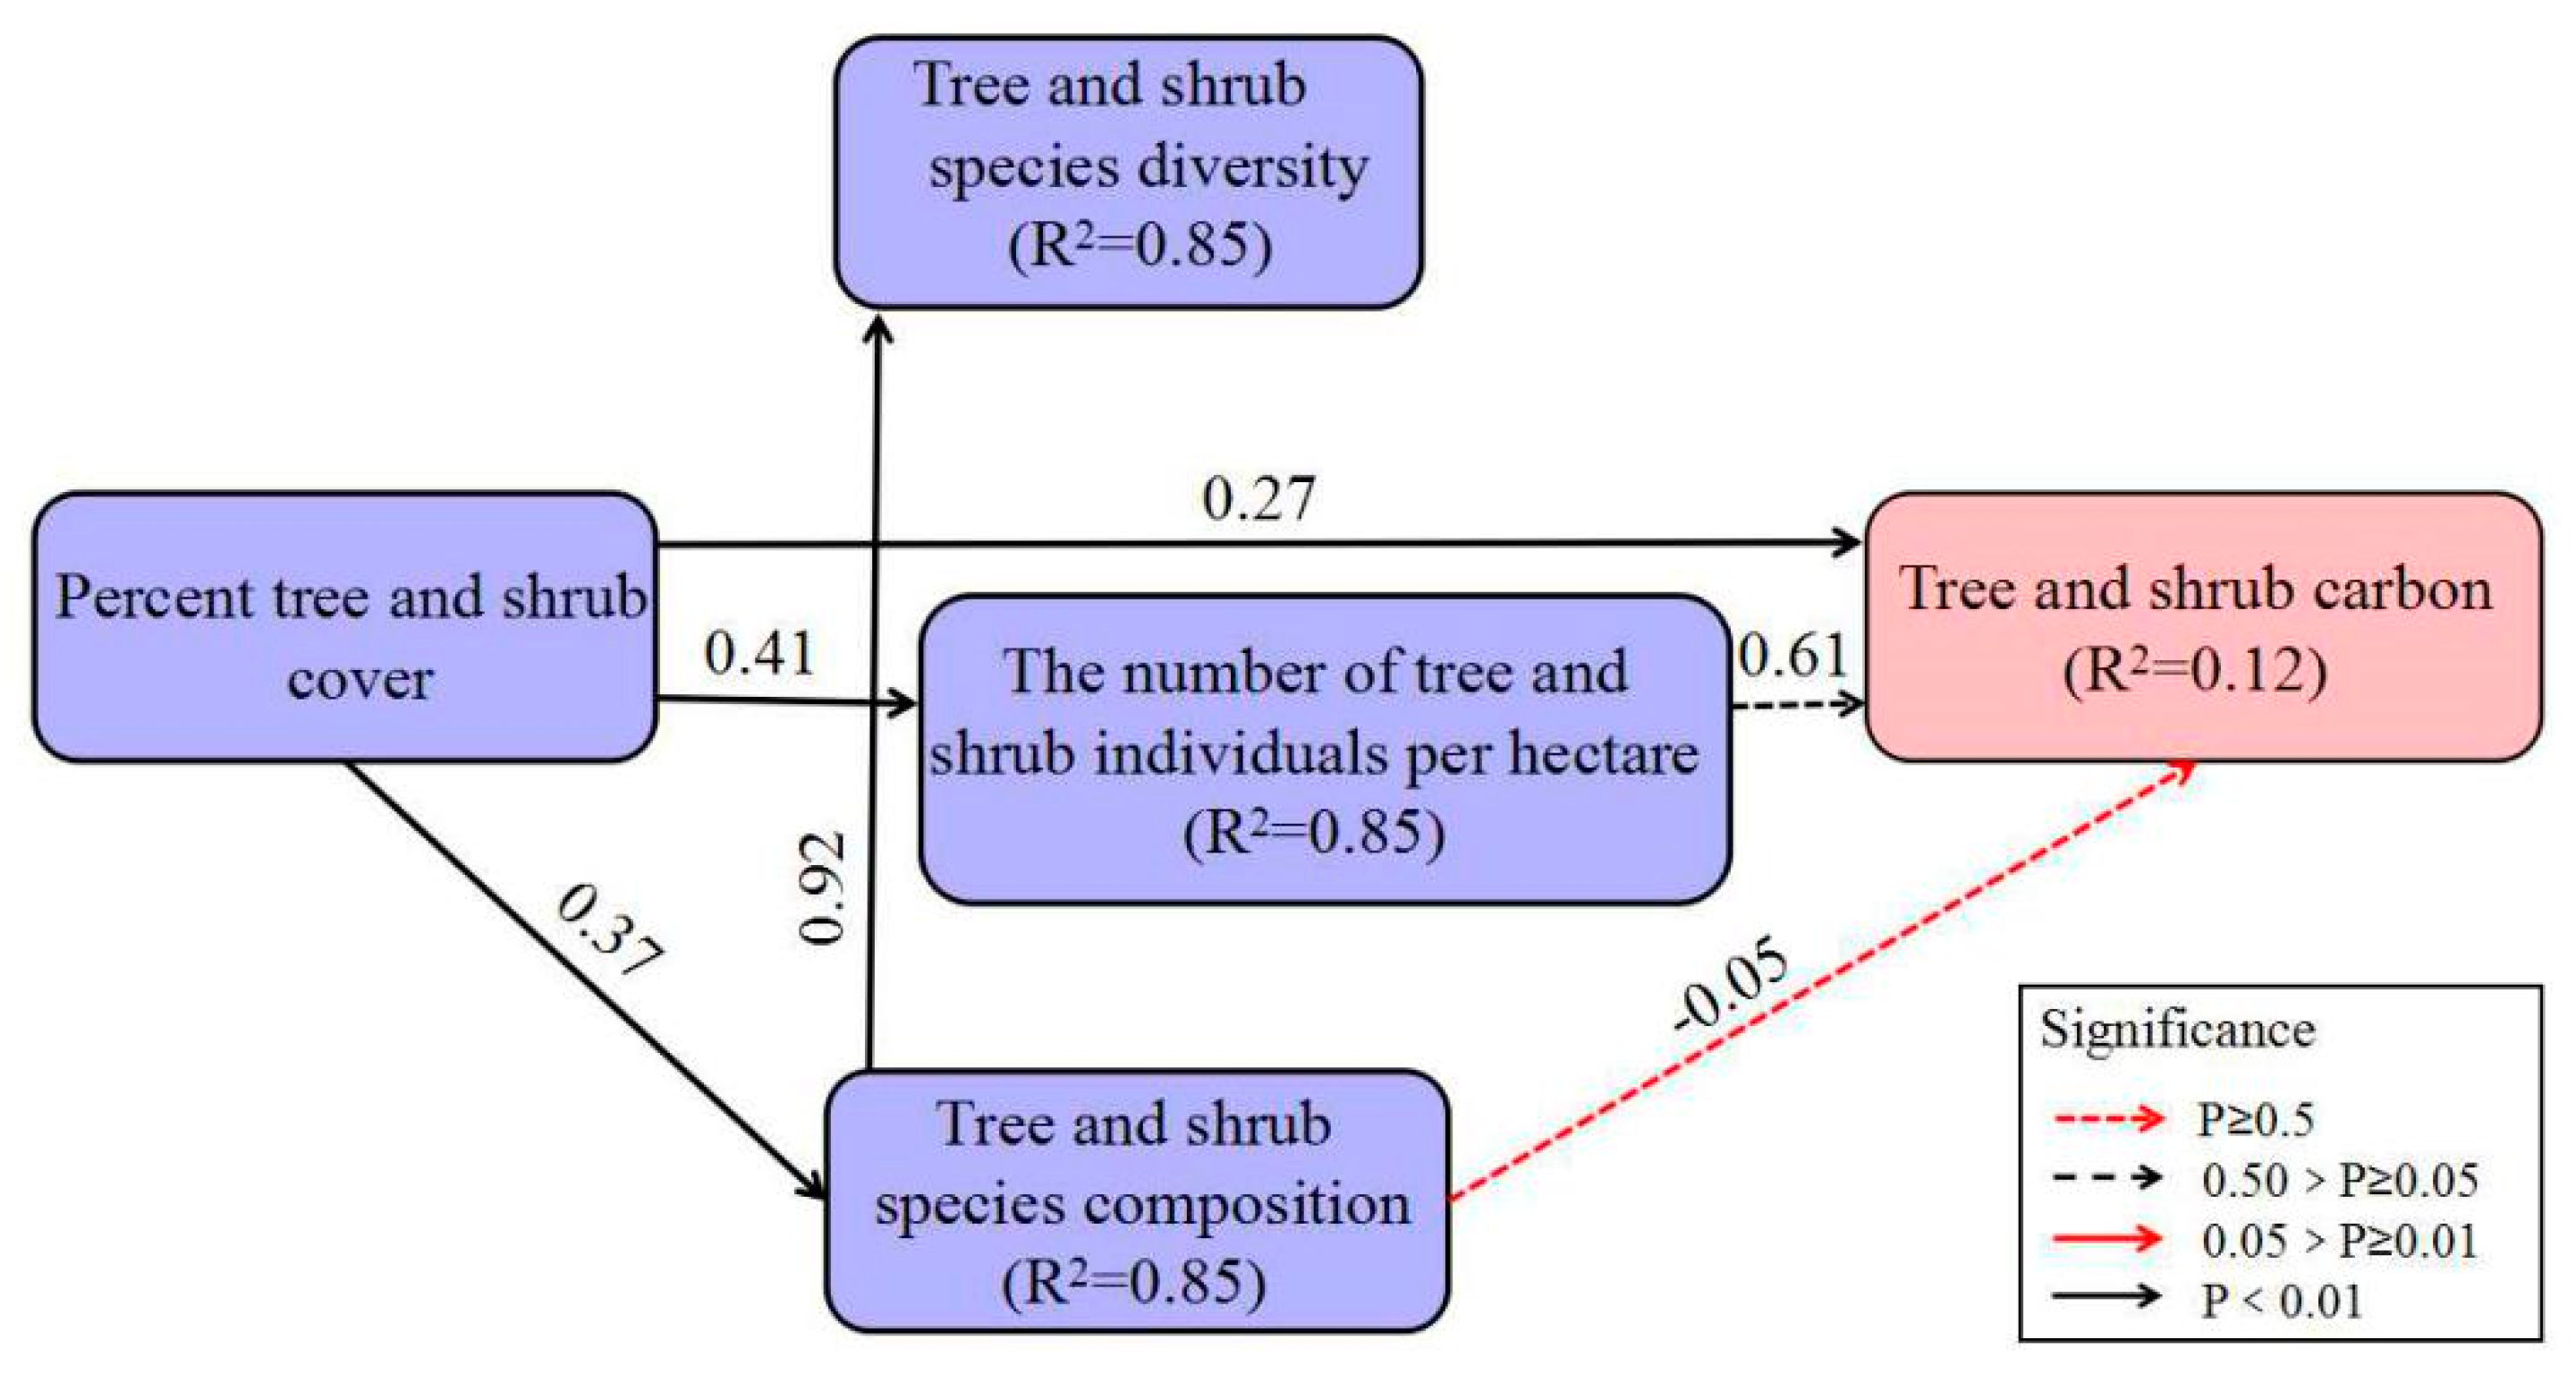
Figure 7.
Model 2 with path analysis results for influential drivers of peri-urban forest stores in Shanghai, China. Values along the lines are the standardized coefficient for that specific path.
Figure 7.
Model 2 with path analysis results for influential drivers of peri-urban forest stores in Shanghai, China. Values along the lines are the standardized coefficient for that specific path.

Table 1.
Selected indicators for an urbanization index used to characterize the urban–peri-urban gradient of Shanghai, China’s urban forests.
Table 1.
Selected indicators for an urbanization index used to characterize the urban–peri-urban gradient of Shanghai, China’s urban forests.
| Measure | Formula | Description |
|---|---|---|
| Percent impervious surface area (; %) a | Areas covered by buildings, roads and impermeable areas (concrete, asphalt). The measure represents the average impervious surface calculated at the pixel level from Qureshi et al.’s impervious surface fraction image [47] | |
| Road density (; %) a | Percent road network in the hexagon | |
| Residential building density (; %) a | Percent residential dwellings in the hexagon | |
| Largest patch index (; %) b | Area (A) of largest patch in the hexagon | |
| Percent urban population (; %) | Percent urban relative to total population (Sixteenth national census, 2014) | |
| Mean patch index () b | Mean patch area (a) in the hexagon | |
| Shannon diversity index () b | An index of land-cover diversity based on plot-level tree and shrub species richness (p) |
a Index was calculated in ArcGIS 10.0 (ESRI, Redlands, CA, USA) and using an orthophotomap with a resolution of 0.25 m. b Index was calculated in Fragstates 3.3 using 2 m raster data.
Table 2.
The importance values (IV) of tree species in urban and peri-urban forests in Shanghai, China.
Table 2.
The importance values (IV) of tree species in urban and peri-urban forests in Shanghai, China.
| Urban | Peri-Urban | |||
|---|---|---|---|---|
| Rank | Species | IV | Species | IV |
| 1 | Cinnamomum camphora (L.) Presl. | 37.00 | Cinnamomum camphora (L.) Presl. | 29.27 |
| 2 | Metasequoia glyptostroboides | 7.71 | Eriobotrya japonica (Thunb.) Lindl. | 5.03 |
| 3 | Osmanthus sp. | 6.50 | Pinus sp. | 5.02 |
| 4 | Cedrus deodara | 4.25 | Metasequoia glyptostroboides | 4.75 |
| 5 | Platanus orientalis | 4.25 | Magnolia grandiflora Linn. | 4.47 |
| 6 | Elaeocarpus decipiens | 3.57 | Ginkgo biloba | 3.77 |
| 7 | Ginkgo biloba | 3.03 | Amygdalus persica L. | 3.05 |
| 8 | Populus L. | 2.81 | Populus L. | 2.96 |
| 9 | Ilex latifolia Thunb. | 2.79 | Cedrus deodara | 2.26 |
| 10 | Trachycarpus fortunei | 2.25 | Ilex latifolia Thunb. | 2.05 |
Table 3.
The importance values (IV) of shrub species in Shanghai China’s urban and urban forests.
| Urban | Peri-Urban | |||
|---|---|---|---|---|
| Rank | Species | IV | Species | IV |
| 1 | Buxus sinica var. parvifolia M. Cheng | 7.95 | Chimonanthus praecox (Linn.) Link | 8.93 |
| 2 | Nerium indicum Mill. | 6.43 | Prunus Cerasifera Ehrhar f. atropurpurea (Jacq.) Rehd. | 7.66 |
| 3 | Acer palmatum Thunb. | 5.20 | Phyllostachys viridis | 7.00 |
| 4 | Phyllostachys viridis | 5.09 | Osmanthus sp. | 6.68 |
| 5 | Fatsia japonica (Thunb.) Decne. et Planch | 4.38 | Distylium racemosum Sieb. et Zucc. | 6.27 |
| 6 | Osmanthus sp. | 4.24 | Nerium indicum Mill. | 5.82 |
| 7 | Loropetalum chinense var. rubrum | 4.17 | Buxus megistophylla Levl. | 5.14 |
| 8 | Pittosporum tobira | 3.62 | Cercis chinensis Bunge | 5.02 |
| 9 | Buxus megistophylla Levl. | 3.16 | Buxus sinica var. parvifolia M. Cheng | 4.48 |
| 10 | Aucuba japonicaVariegata | 3.00 | Pittosporum tobira | 3.29 |
Table 4.
Structural and compositional characteristics of Shanghai China’s urban and peri-urban (PU) forests.
Table 4.
Structural and compositional characteristics of Shanghai China’s urban and peri-urban (PU) forests.
| Forest | Factor | Average | Maximum | Minimum | Standard Error |
|---|---|---|---|---|---|
| Urban | The number of tree and shrub individuals per hectare (number ha−1) | 818.62 | 6725.00 | 25.00 | 1068.29 |
| Tree and shrub species diversity | 3.09 | 13.00 | 0.00 | 2.36 | |
| Percent tree and shrub cover (%) | 38.85 | 8.00 | 0.00 | 1.69 | |
| Tree and shrub species composition a | 0.40 | 0.90 | 0.00 | 0.31 | |
| PU | The number of tree and shrub individuals per hectare (number ha−1) | 825.21 | 5950.00 | 25.00 | 1082.30 |
| Tree and shrub species diversity | 0.29 | 0.84 | 0.00 | 0.29 | |
| Percent tree and shrub cover (%) | 50.35 | 100.00 | 0.00 | 37.09 | |
| Tree and shrub species composition a | 1.69 | 150.00 | 0.00 | 38.85 |
a Plot-level tree and shrub composition is defined following the approach of Jonsson and Wardle [57] that is based on a principal component analysis (PCA) with the number of tree and shrub individuals per species in every plot.
Table 5.
Regression weights for the path analysis for drivers of carbon storage in Shanghai China’s urban forests.
Table 5.
Regression weights for the path analysis for drivers of carbon storage in Shanghai China’s urban forests.
| Paths | Estimate | S.E. | p | |
|---|---|---|---|---|
| From | To | |||
| Percent tree and shrub cover | Tree and shrub species composition | 0.023 | 0.005 | *** |
| Percent tree and shrub cover | The number of tree and shrub individuals per hectare | 0.467 | 0.086 | *** |
| Tree and shrub species composition | Tree and shrub species diversity | 0.244 | 0.009 | *** |
| Percent tree and shrub cover | Tree and shrub carbon (Mg C ha−1) | 0.100 | 0.033 | 0.003 |
| The number of tree and shrub individuals per hectare | Tree and shrub carbon (Mg C ha−1) | 0.051 | 0.028 | 0.065 |
| Tree and shrub species composition | Tree and shrub carbon (Mg C ha−1) | −0.318 | 0.493 | 0.519 |
*** p < 0.001.
Table 6.
Standardized effects for a path analysis for drivers of carbon storage in Shanghai China’s urban forests.
Table 6.
Standardized effects for a path analysis for drivers of carbon storage in Shanghai China’s urban forests.
| Total Effects | Direct Effects | Indirect Effects | |
|---|---|---|---|
| Percent tree and shrub cover | 0.311 | 0.267 | 0.044 |
| The number of tree and shrub individuals per hectare | 0.157 | 0.157 | 0.000 |
| Tree and shrub species composition | −0.054 | −0.054 | 0.000 |
Table 7.
Regression weights for path analysis results for influential drivers of peri-urban forest stores in Shanghai, China.
Table 7.
Regression weights for path analysis results for influential drivers of peri-urban forest stores in Shanghai, China.
| Paths | Estimate | S.E. | p | |
|---|---|---|---|---|
| From | To | |||
| Percent tree and shrub cover | Tree and shrub species composition | 0.011 | 0.004 | 0.007 |
| Percent tree and shrub cover | The number of tree and shrub individuals per hectare | 0.448 | 0.094 | *** |
| Tree and shrub species composition | Tree and shrub species diversity | 0.150 | 0.008 | *** |
| The number of tree and shrub individuals per hectare | Tree and shrub carbon (Mg C ha−1) | 0.043 | 0.029 | 0.067 |
| Percent tree and shrub cover | Tree and shrub carbon (Mg C ha−1) | 0.154 | 0.033 | *** |
| Tree and shrub species composition | Tree and shrub carbon (Mg C ha−1) | 1.118 | 0.697 | 0.109 |
| Percent tree and shrub cover | Species diversity | −0.001 | 0.000 | *** |
*** p < 0.001.
Table 8.
Standardized effects for path analysis results for influential drivers of peri-urban forest stores in Shanghai, China.
Table 8.
Standardized effects for path analysis results for influential drivers of peri-urban forest stores in Shanghai, China.
| Driver | Total Effects | Direct Effects | Indirect Effects |
|---|---|---|---|
| Percent tree and shrub cover | 0.501 | 0.408 | 0.093 |
| The number of tree and shrub individuals per hectare | 0.155 | 0.155 | 0.000 |
| Tree and shrub species composition | 0.128 | 0.128 | 0.000 |
© 2017 by the authors. Licensee MDPI, Basel, Switzerland. This article is an open access article distributed under the terms and conditions of the Creative Commons Attribution (CC BY) license (http://creativecommons.org/licenses/by/4.0/).
Share and Cite
MDPI and ACS Style
Yao, X.; Zhao, M.; Escobedo, F.J. What Causal Drivers Influence Carbon Storage in Shanghai, China’s Urban and Peri-Urban Forests? Sustainability 2017, 9, 577. https://doi.org/10.3390/su9040577
AMA Style
Yao X, Zhao M, Escobedo FJ. What Causal Drivers Influence Carbon Storage in Shanghai, China’s Urban and Peri-Urban Forests? Sustainability. 2017; 9(4):577. https://doi.org/10.3390/su9040577
Chicago/Turabian StyleYao, Xin, Min Zhao, and Francisco J. Escobedo. 2017. "What Causal Drivers Influence Carbon Storage in Shanghai, China’s Urban and Peri-Urban Forests?" Sustainability 9, no. 4: 577. https://doi.org/10.3390/su9040577
Note that from the first issue of 2016, this journal uses article numbers instead of page numbers. See further details here.