1. Introduction
With the progress of industrialization and urbanization, China’s rapidly increasing use of energy has received much attention in recent years, and has contributed to 28% of global carbon emissions in 2014 [
1]. Under the pressure of global warming, the Chinese government has positively taken multifaceted actions to reduce carbon emissions, which include the commitment to reduce carbon emissions by 40–45% in 2020 compared to 2005, to make carbon emission reach their peak at around 2030, and signing the Paris Agreement in 2016. It is necessary to identify the characteristics of different energy consumption sectors before making policies. Though the industrial sector is the major energy consumer over the last three decades, residential energy consumption has grown rapidly along with the increasing income, accounting for 20% in 2014 [
2]. The overall people’s living standard has improved greatly aside with the development of China’s economy. However, there is still a very large gap between urban and rural energy consumption, including energy consumption quantity, energy structure, end-use devices, and usage patterns [
3,
4,
5]. In rural areas, energy poverty is an important problem that needs to be solved urgently due to its adverse effects on human health and the environment [
6], particularly in developing countries [
7,
8,
9,
10].
China has a large population, and 44% of the population lived in rural areas in 2015 [
11], who have been suffering great harm from the use of solid fuels (mainly biomass and coal) [
12,
13]. Since the early 1980s, the Chinese government has invested plenty of resources to improve the efficiency and to cleanse the rural energy structure, such as the construction of biogas, the implementation of mini-hydropower plants, and the development and diffusion of biomass gasification stations. The most notable effort is the National Improved Stove Program (NISP); this program promised to offer rural households more efficient biomass stoves, which is beneficial to the environment and human health. Though those programs have made great achievements in improving the level of rural energy consumption, difficulties still exist and constrain the development of these programs [
14,
15,
16].
There are many studies related to rural energy consumption, including energy consumption structure, energy poverty, characteristics of energy usage, air pollution and health impacts, and construction of new energy sources, especially focusing on developing countries [
17,
18,
19]. In China, extensive studies on rural energy consumption have been conducted in several aspects. One branch of them is engaged to describe the characteristics of rural energy consumption on regional differences, changing of energy structure, energy consumption of end-use, and affecting factors at the county level or in key provinces and regions [
20,
21,
22]. Several studies focus on cooking fuel choice based on micro-survey data due to its high percentage of total energy consumption [
23,
24,
25]. The development of constructing new energy sources and cleansing biomass is also an important approach to improve the energy structure and living standards of rural households, and several papers discuss the opportunity, constraints, and implications of clean energy [
26,
27,
28]. Additionally, the analysis of health effects, well-being, and economic and environmental costs resulting from carbon emissions and indoor air pollution induced by solid fuel combustion are of great concern to researchers [
29,
30,
31,
32]. This paper is closely related to describing the characteristics of rural energy consumption, and there are many studies focus on energy consumption level and structure, end-use activities, which provide a profile of rural energy consumption [
33,
34,
35]. This paper contributes to describing the characteristics of rural energy consumption and the detailed usage behaviors by remedying the data limitation of previous studies through a detailed questionnaire design, offering in-depth reasons related to different fuel choices of end-use activities, which can provide some intuitions for decision-making.
The rest of this paper is organized as follows:
Section 2 describes the field survey design and the descriptive analysis of the data used in this paper;
Section 3 presents the different fuel choice and usage behaviors in different end-use activities;
Section 4 explores the factors affecting the fuel choice of rural residents; and
Section 5 gives this paper’s conclusions and some implications for the government.
2. Field Survey Design and Descriptive Analysis
2.1. Field Survey Design
Conducting residential energy consumption studies rely on large-scale data, especially the micro-survey data at the household level. In other countries, particularly in developed countries, government agencies regularly collect data on energy-related characteristics and usage patterns of nationally-representative samples of households, offering strong support for decision-making. For example, the US Energy Information Administration started to survey US households’ energy usage in 1978, based on which abundantly-informative studies have been conducted. However, few surveys have been conducted nationally and periodically on residential energy consumption in China. Some researchers conduct micro-surveys with specific focus in some areas, which plays an important role in analyzing residential energy consumption.
The data used in this paper is from a field survey that was organized by the Center for Energy and Environment Policy Research of the Beijing Institute of Technology. It was conducted in July and August 2016 in order to collect detailed information about energy use in rural areas. The questionnaire was designed with comprehensive and detailed questions related to daily energy consumption, including household demographics, dwelling characteristics, kitchen appliances, number and use of energy-consuming products, energy choice for different end-use activities, consumption of different fuels, residents’ health, and recognition of the environment.
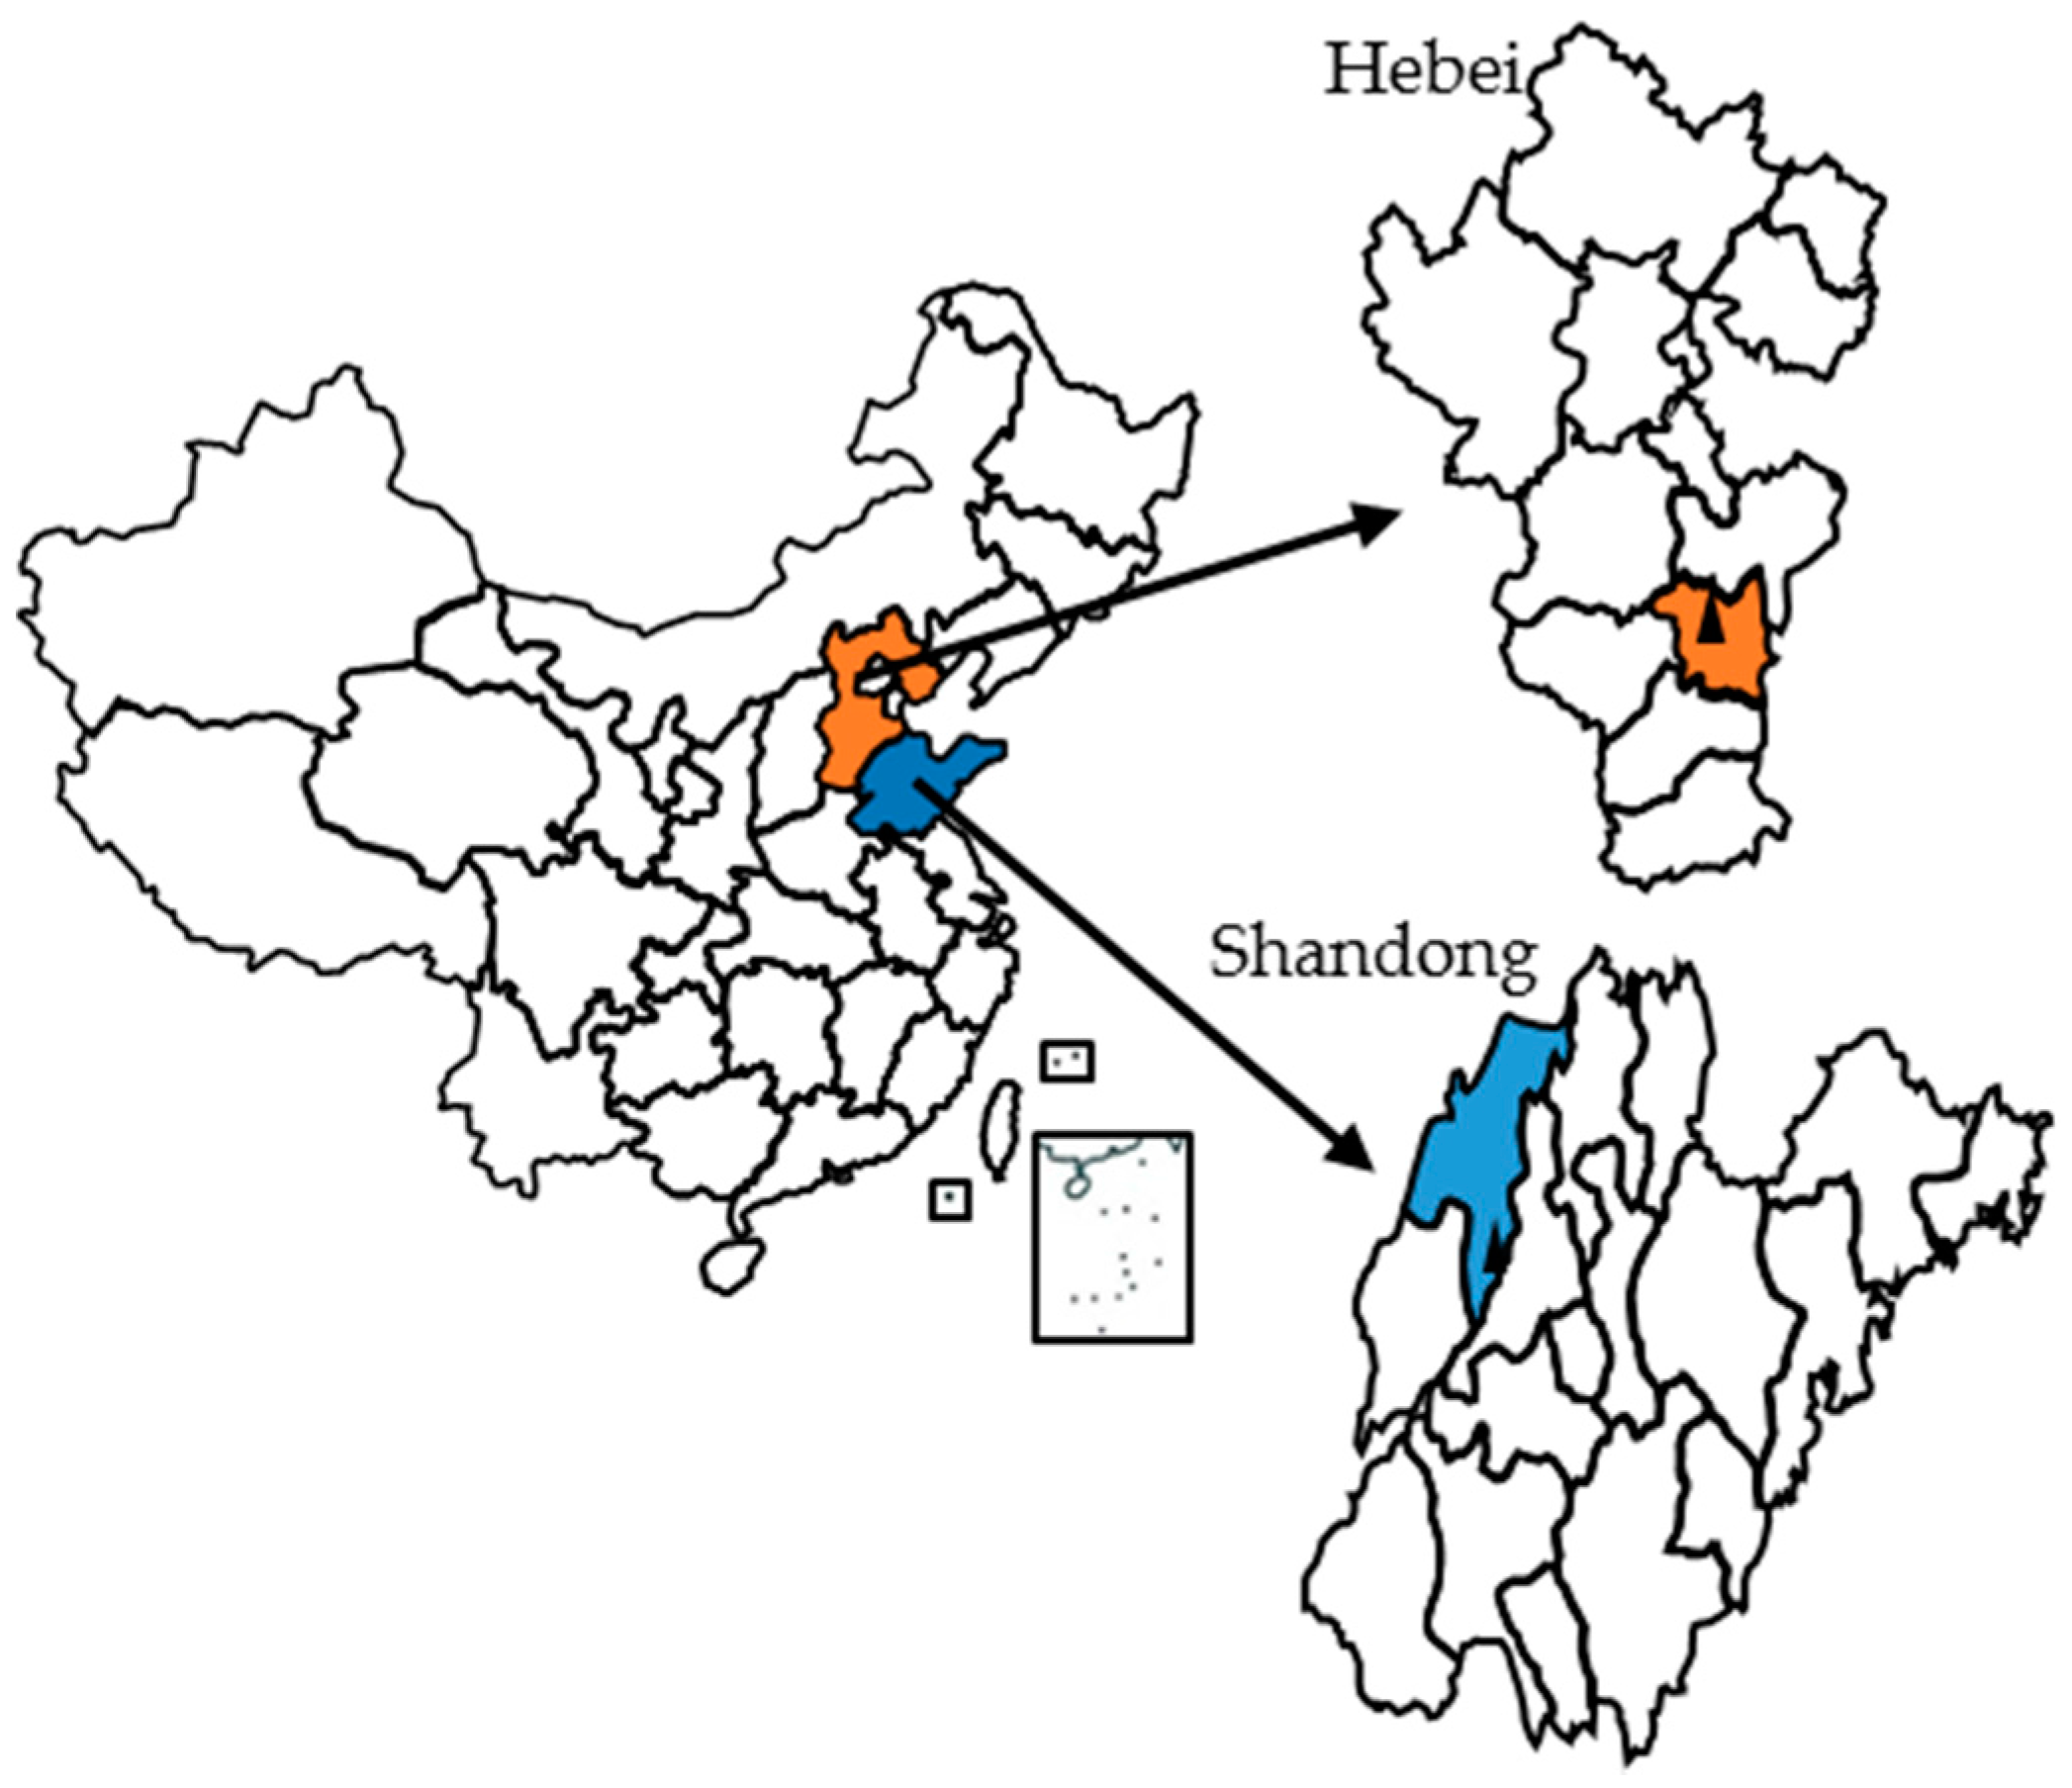
A multistage cluster sampling method was used in this field survey. First, we chose Qihe County in Shandong Province and Wuqiang County in Hebei Province. Both of the provinces are located in Northern China. Then, townships were randomly drawn from Qihe and Wuqiang counties. Villages were chosen, finally, and villages in this survey are defined with a code of “220” according to the region and urban/rural classification by the National Bureau of Statistics of China, which refer to villages as less-developed. Households in this survey contain those who live in primary residence for over half year in each of the selected villages, exclude households that work in other place for more than half year. Under the support of the local village committee, a family member, householder, or his wife, usually, who is knowledgeable about energy use in each household, was required to join this survey in the local committee. The interview took 30 min per household, on average. Finally, 730 households were surveyed and 717 samples were eligible, with a high response rate of 98%. Additionally, we also collected 1924 pieces of personal information of people living in the home over six months of the year, but family members who were working outside for a long time, or boarding at school, were not in our consideration. In this field survey, measures of quality assurance were implemented at each step of data collection, including extensive training of interviewers about the survey procedures and questionnaire, picture assistance, data validity, and consistency checks.
2.2. Descriptive Analysis
Qihe County is located in the northwest of Shandong province, which is close to the provincial capital Jinan. The total area of Qihe is 1411 square kilometers, and with a total population of 0.78 million people. Qihe lies on the north bank of the lower reaches of Yellow River, and it is an important food production area of Shandong. The forest coverage is approximately 47%. Qihe County has seen rapid growth, economically, due to its abundant resources, advantageous location, developed traffic, and it is one of the National Hundred Strong Counties in China. Wuqiang County is located in the southeast of Hebei province, the total area is 445 square kilometers, with a total population is 0.219 million people. It is a key county in the national plan for poverty alleviation through development work. As
Figure 1 shows, both of them are parts of the North China Plain, located in the temperate monsoon region. The cumulative annual average temperature of Qihe and Wuqiang is 13.7 °C and 12.8 °C, respectively, and the cumulative daily mean temperature of Qihe is −2 °C and, in Wuqiang, is −4 °C.
A descriptive statistical analysis of household social-economic characteristics has been presented in
Table 1. In our survey, Qihe County has a sample of 391 observations from six different villages, and Wuqiang County has 326 observations from four villages. On average, 3.55 people are registered in each permanent residence booklet per household, while only 2.54 people eat together every day. Family members working outside or living in dormitories have been excluded in our survey, and there is a slight difference between the two counties. The male percentage and average age in our survey of Wuqiang County is lower than that of Qihe County, as there are more household members working outside, and people working outside are usually male in Wuqiang. The average schooling years of the householder is below six years, which is just the education level of primary school, being higher in Wuqiang County than in Qihe County. The average annual income of the surveyed households is 21,223 Yuan, and the median is 13,644 Yuan, which indicates the gap between the rich and the poor. Additionally, households of Qihe County have a higher average income than that of Wuqiang County because of its better economic development level. The percentage of households that have one or more family members working outside over six months in Qihe County is higher than Wuqiang County. Most of the household members rely on agriculture for a living in the two counties, which accounts for 73%, in total, and some families have part-time work in slack farming seasons.
In this survey, dwellings of the same village are usually designed and constructed uniformly, including area size, structure, construction materials, and floor height. Most households own one dwelling with one story; only 12% households have two dwellings, and 95% of dwellings are self-built. More than half of the dwellings were built before 2000, and most of them have a service life of less than 20 years. Total area and net area of per household is 288 m2 and 92 m2. The net area per capita in Qihe and Wuqiang are 39 m2 and 26 m2, respectively.
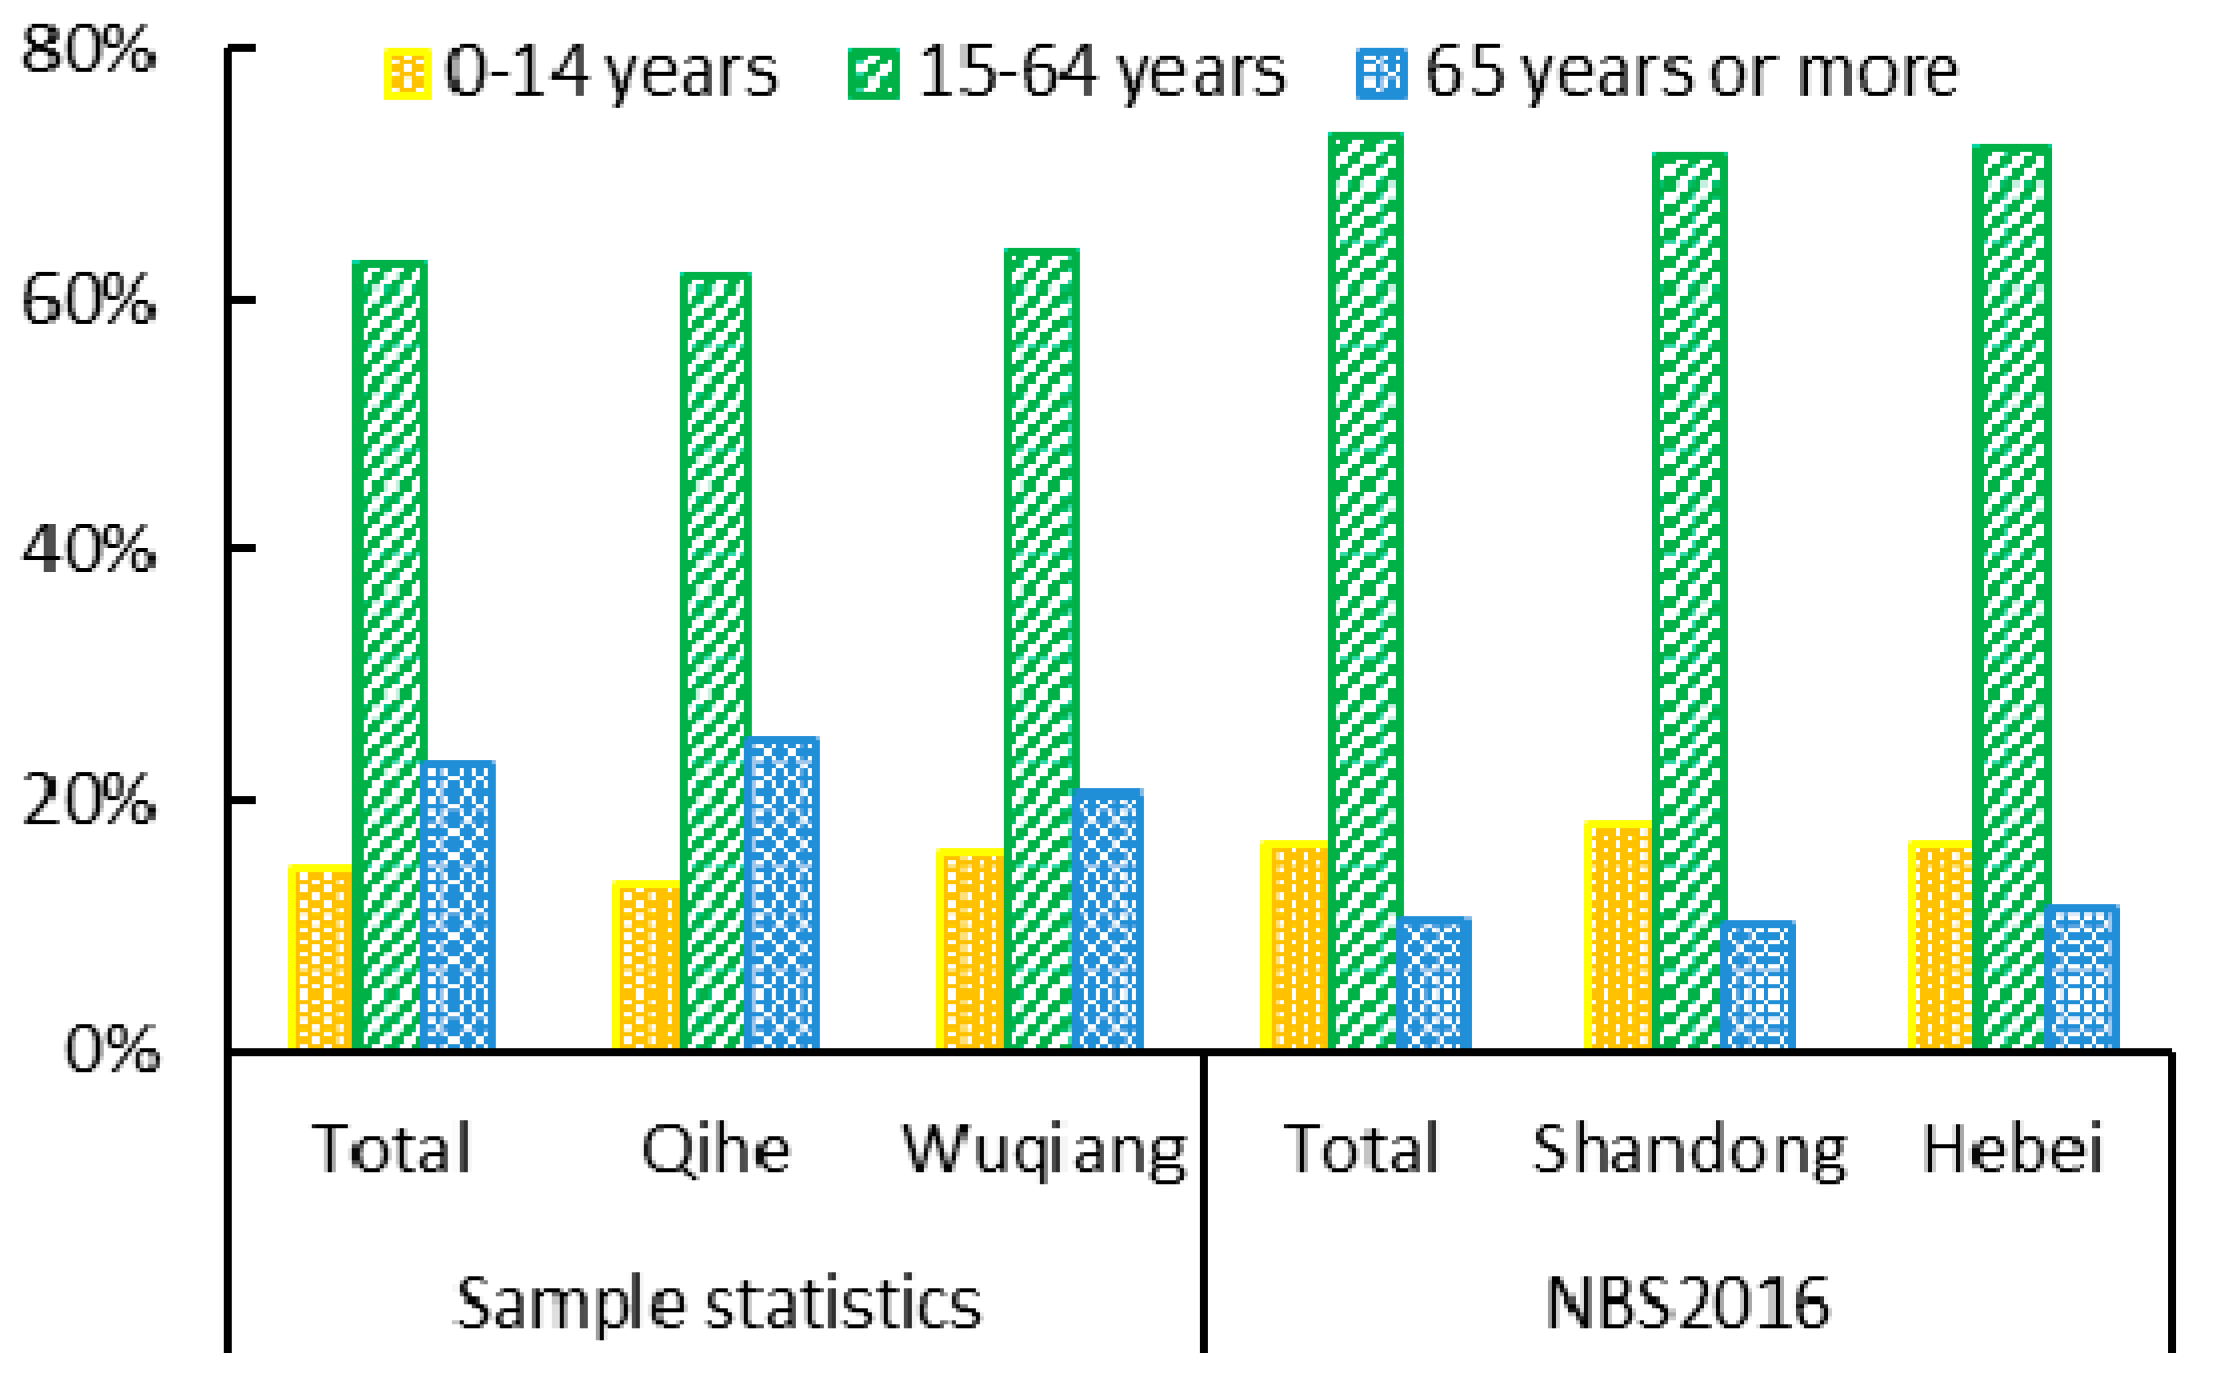
As this survey is engaged to describe the household energy consumption for daily life, we collected demographic information of the people living in the primary residence over six months; thus, this is the group of the left-behind, who have a direct connection to energy consumption. We conducted a comparative analysis of the age structure between this survey and the National Bureau of Statistics (NBS) to demonstrate the characteristics of people who are left behind in
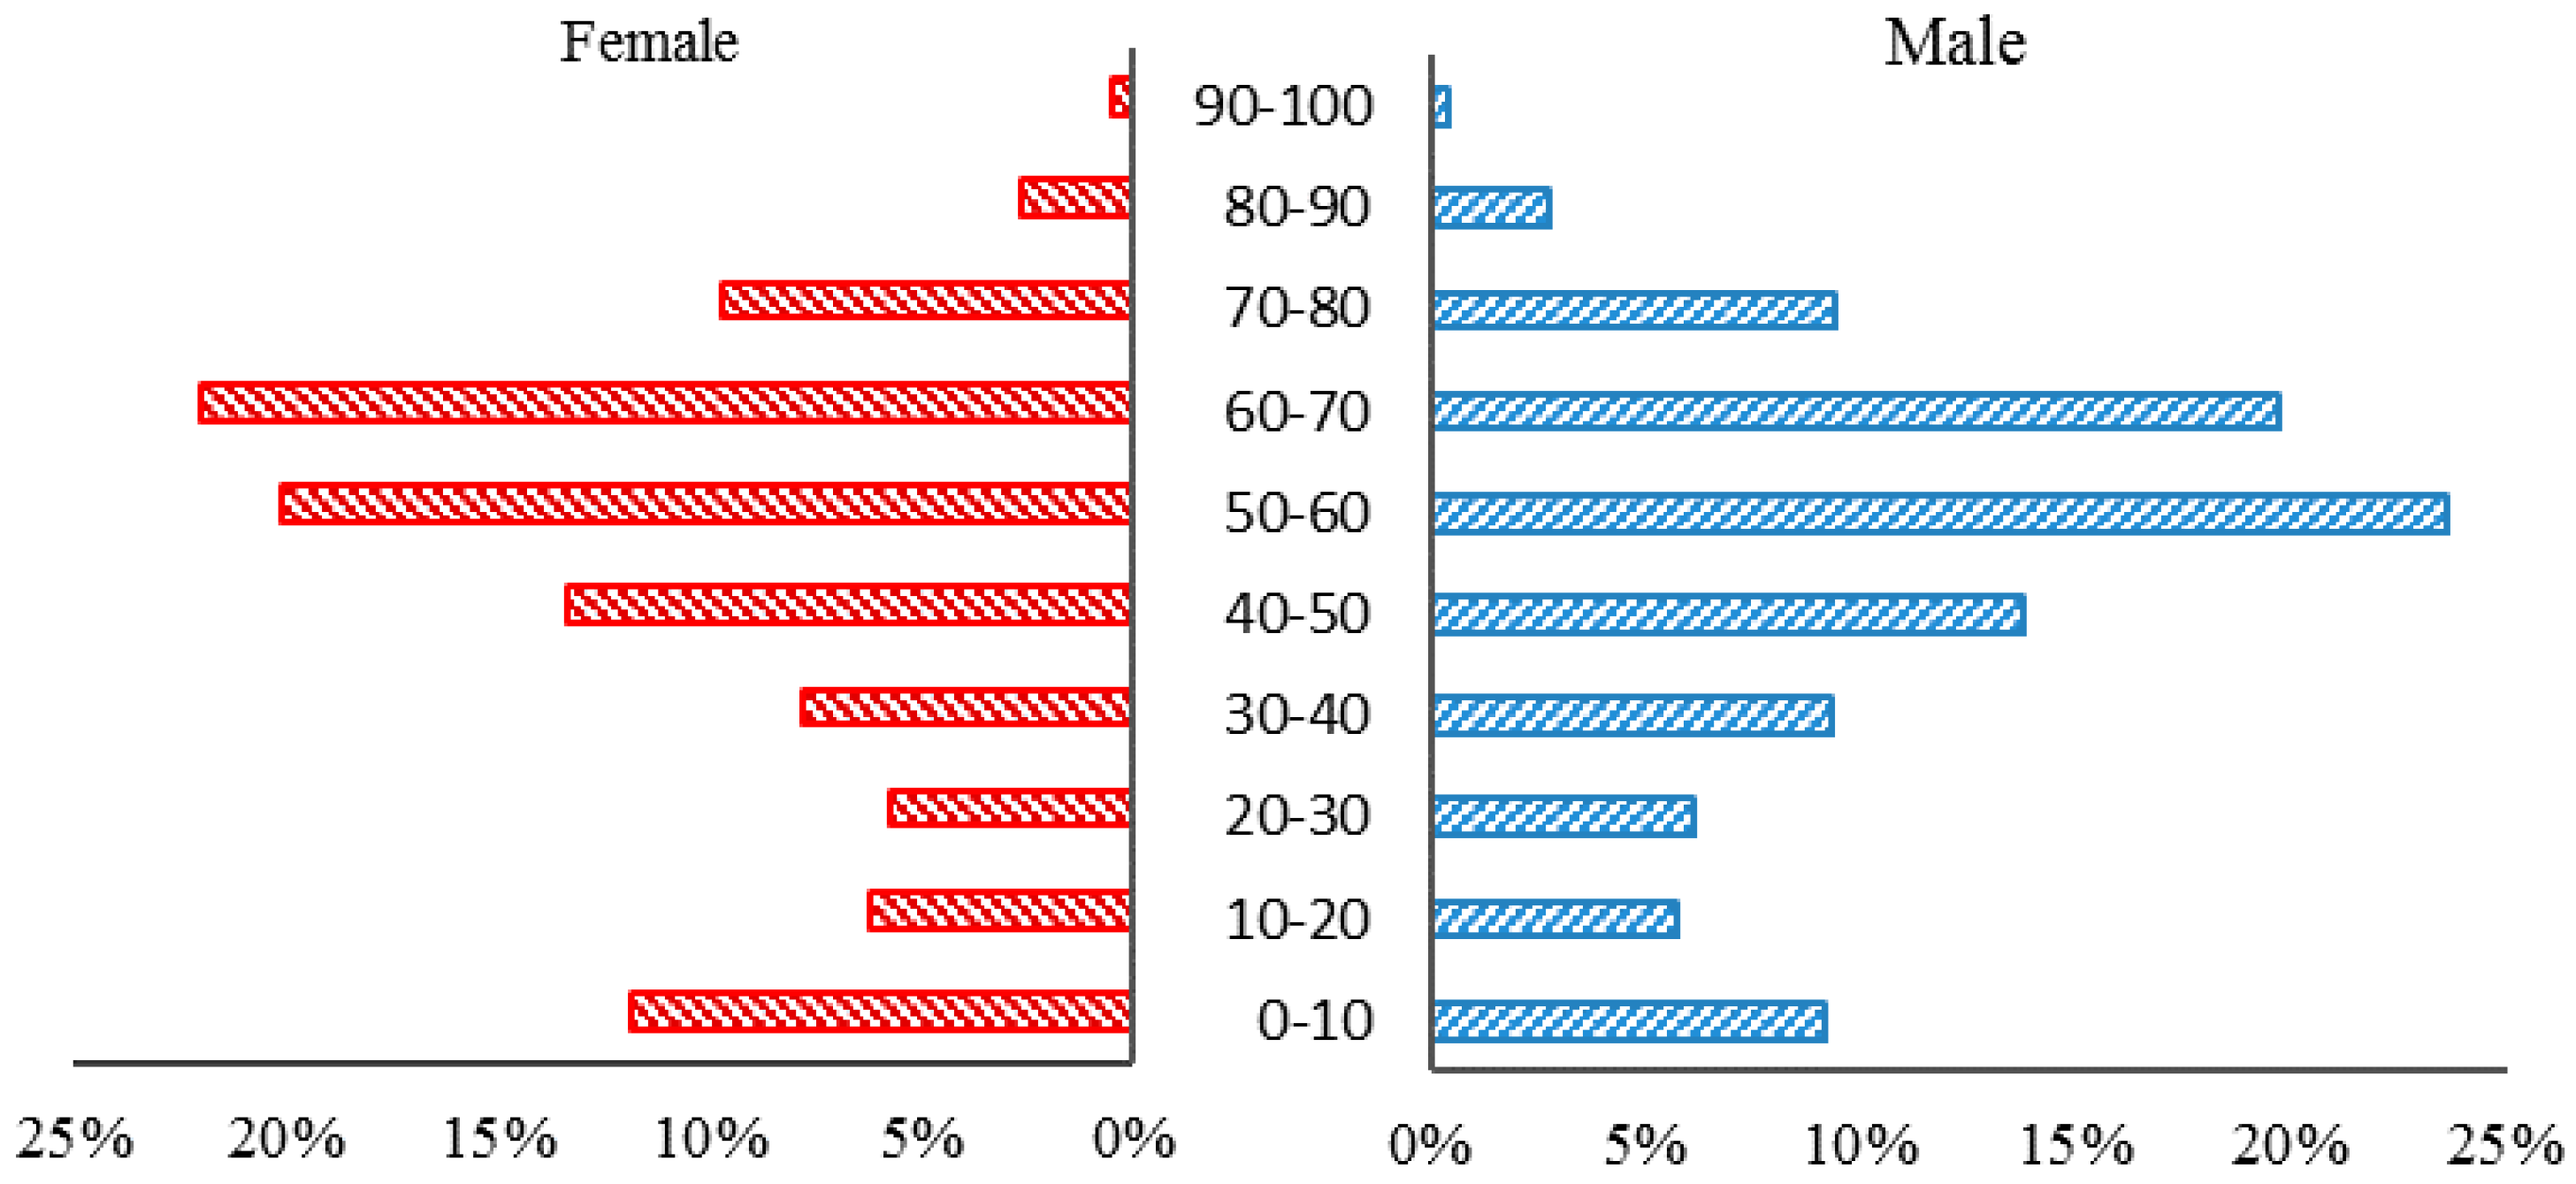
Figure 2. Firstly, people aged over 65 years in our survey account for 23%, more than twice as high as that of the NBS statistic (10%); on the other hand, the labor force population is smaller in our survey for people working outside. Secondly, the percentage of people under 14 years in our survey is smaller, as some children live with their parents who are working outside, or live in a boarding school. Thirdly, the age of the left-behind concentrates in the range of 50–70 years of age, accounting for 43% of the total, as
Figure 3 presents. Due to the majority of the left-behind being elderly or children, it is difficult to acquire an accurate amount of fuel consumption due to their limited recognition [
35]; thus, we use the primary fuel choice to substitute the quantity of different end-use fuels.
3. Fuel Choice and Usage Behavior of Different End-Use
3.1. Cooking Stoves
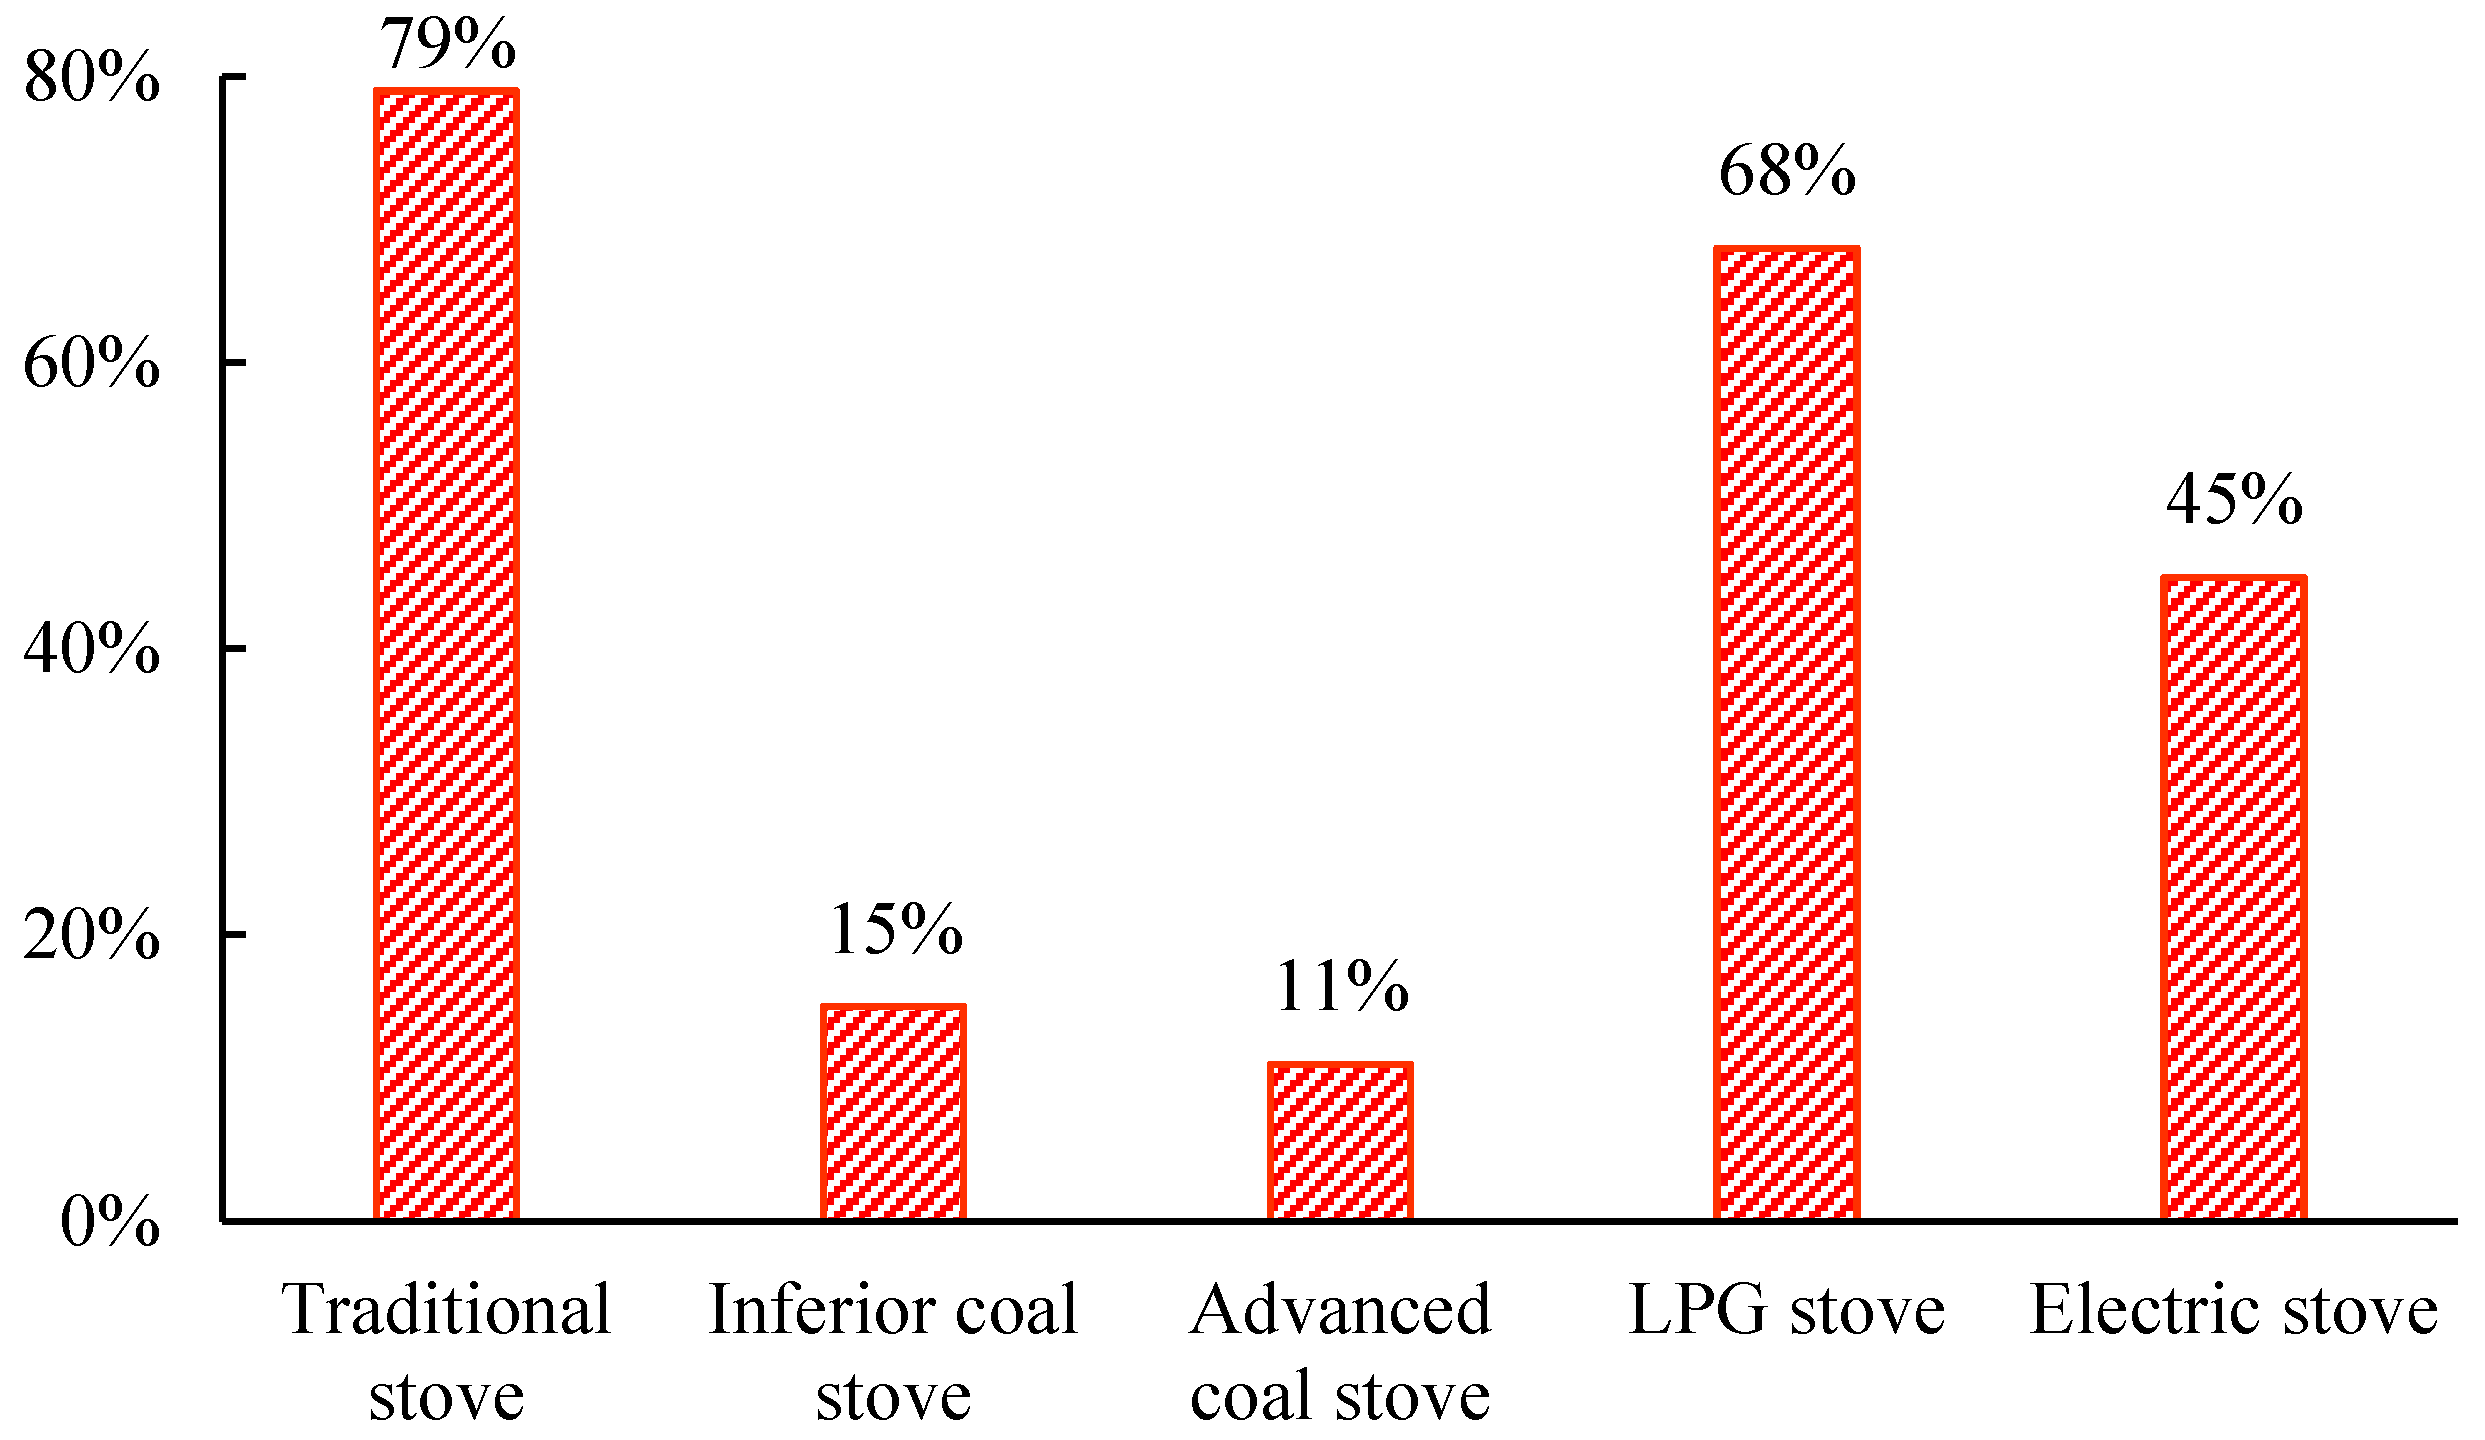
In rural areas, there are several types of cooking stoves for different fuels, including traditional stoves for biomass (mainly wood and crop residue), coal stoves (including inferior and advanced, a coal stove without a chimney is defined as an inferior coal stove, thus the advanced coal stove is equipped with a chimney), LPG stoves, and electric stoves. Many households use different stoves in different times and situations.
Figure 4 provides sample statistics on household stove use, and we find that the traditional stove is widely used in rural areas, accounting for 79%, which is mainly used for staple food, such as steaming bread with a frequency of three times a month, or making porridge every day. The second commonly-used stove is the LPG stove, accounting for 68%. Many households use it for sautéing dishes once or twice a day. Forty-five percent of households use electric stoves for cooking, which can be used to cook dishes, and 74% of households own an electric rice cooker. In addition, about 15% of households use an inferior coal stove and 11% use an advanced coal stove to cook, usually in winter. Inferior coal stoves with poor ventilation can lead to serious impacts on indoor air quality when used it to cook or heat space.
3.2. Cooking Fuel Choice of the Current Situation
Cooking activity is a main component of people’s daily life, and this activity usually consumes plenty of energy. According to other’s research, the percentage of energy used to cook is as high as 43% of the total energy used in rural areas, which is far beyond that in the urban areas of China and developed countries [
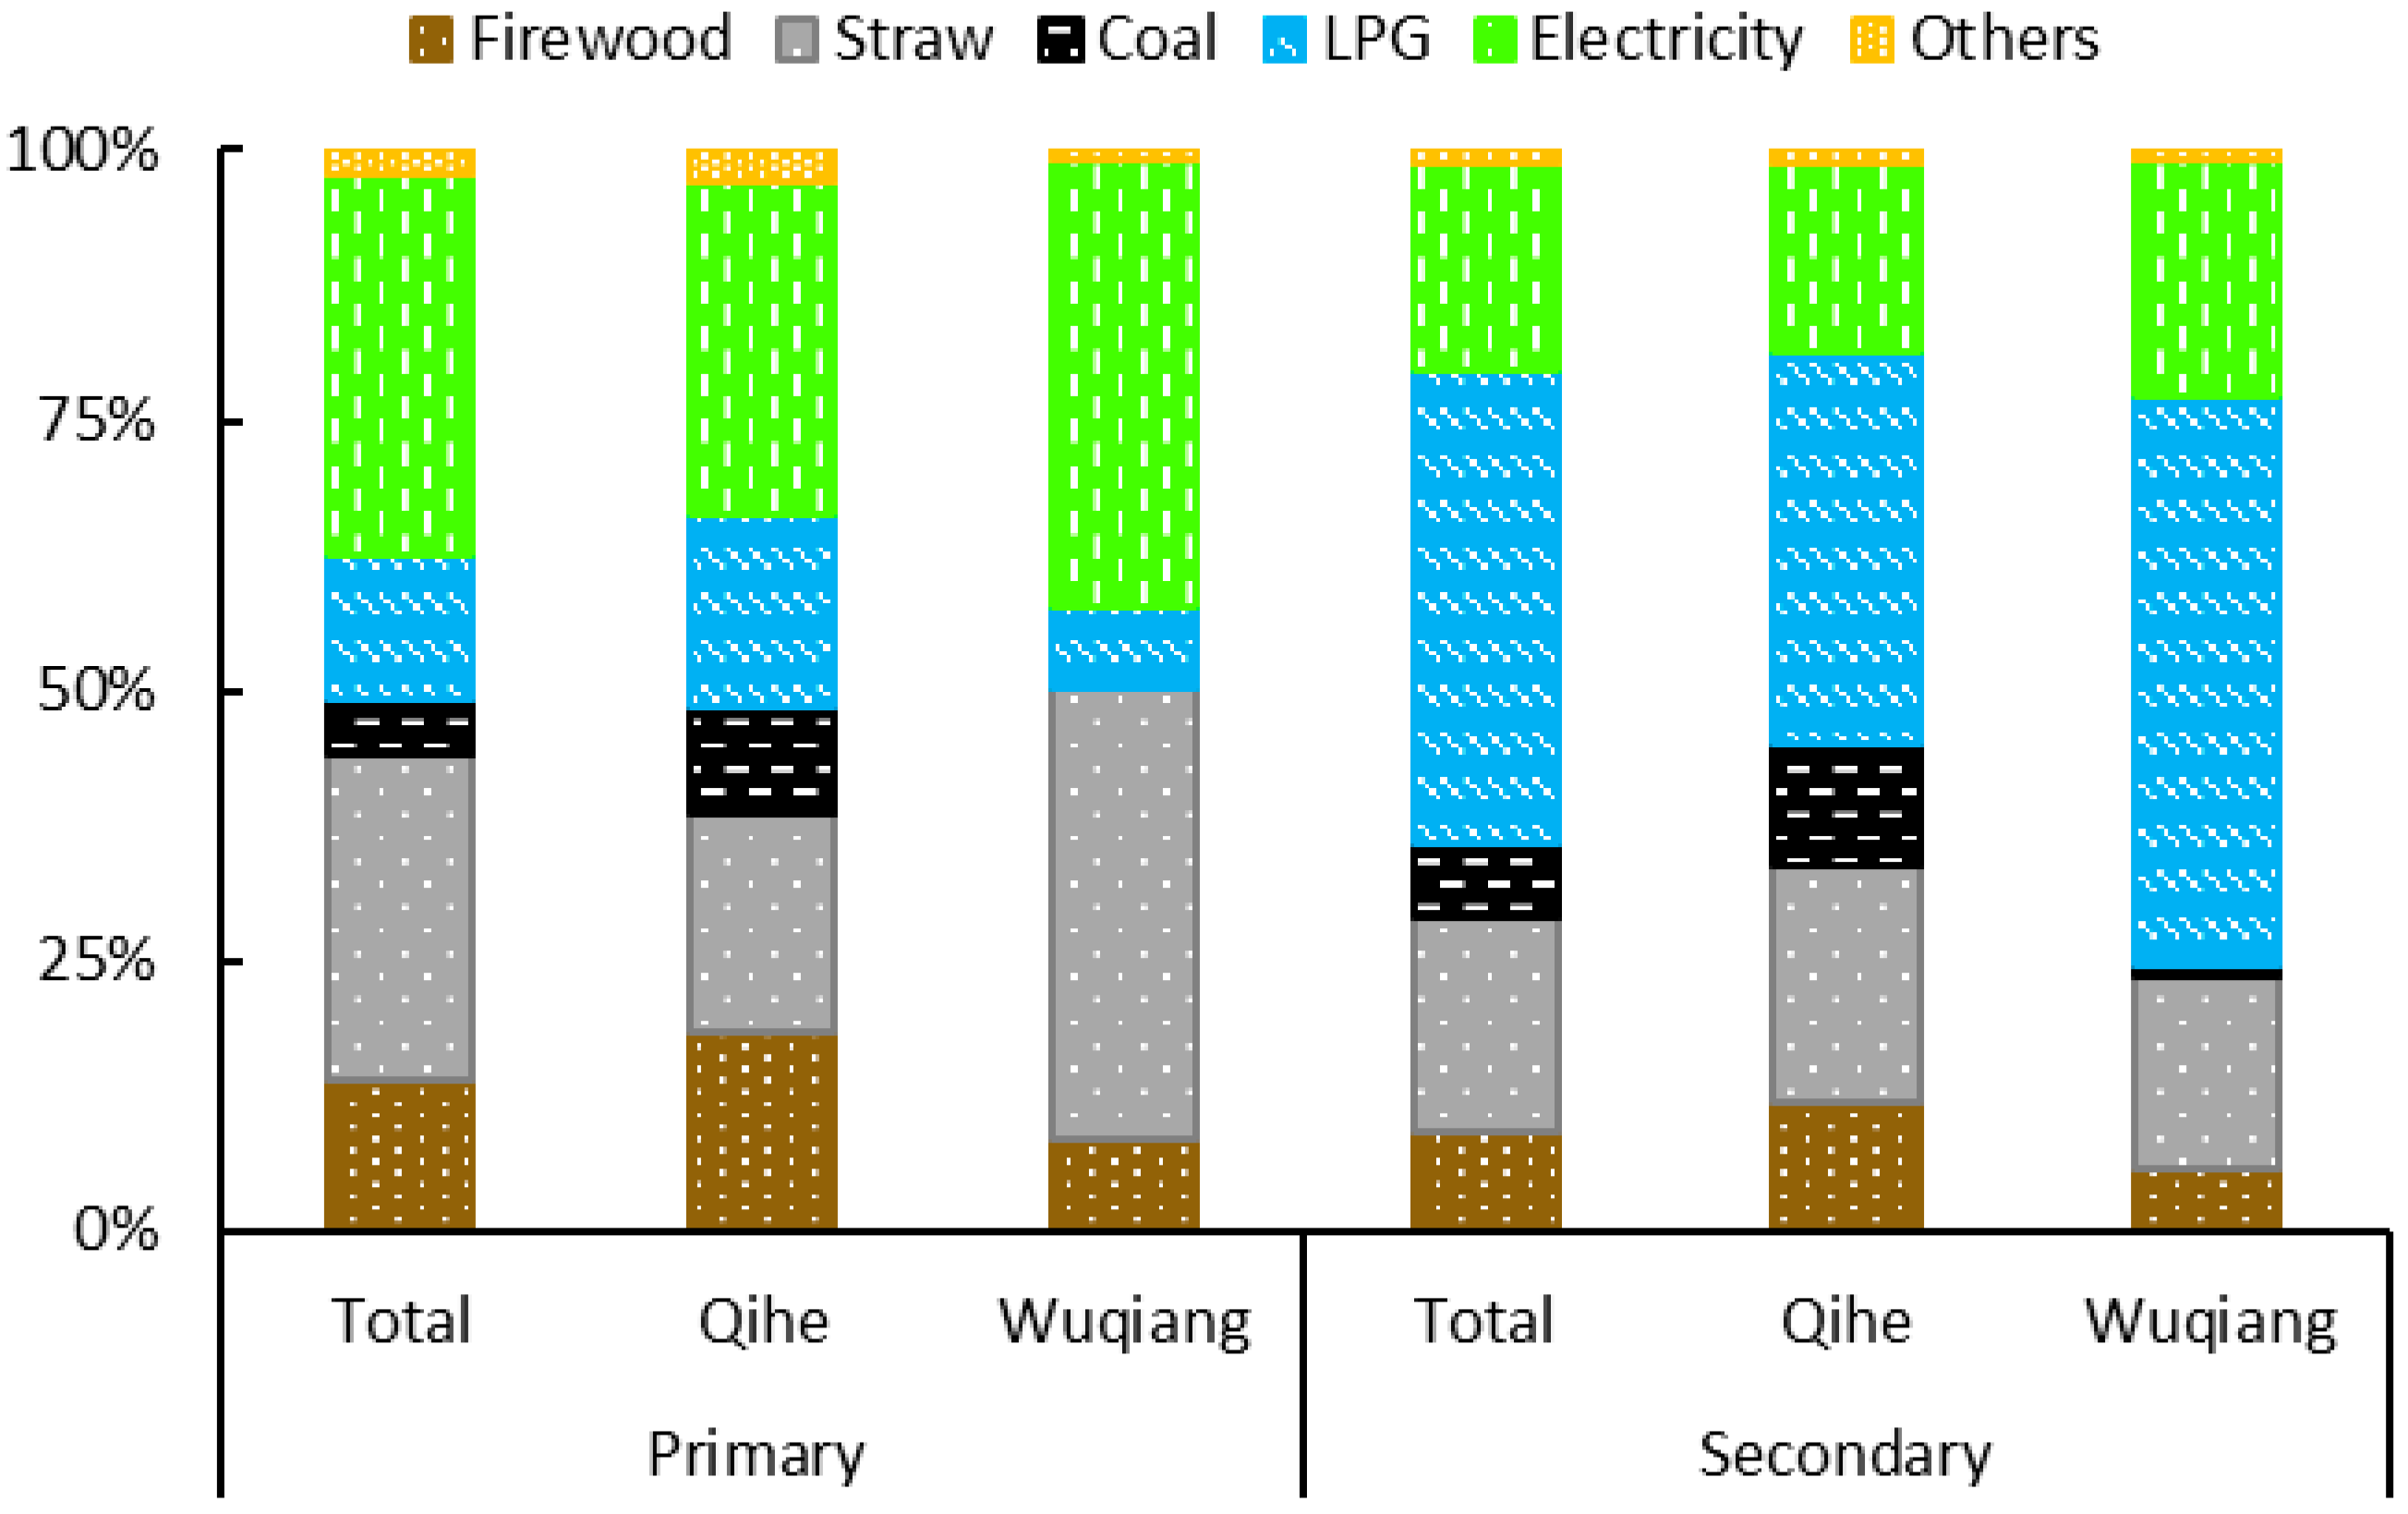
33].
Figure 5 presents the proportion of different cooking fuel choices in 2016, and we can see that rural residents use diversified fuels for cooking, including firewood, straw, coal, LPG, electricity, etc. As for the primary cooking fuel, about 14% and 30% of households choose firewood and straw, and straw is more widely used in rural areas. Only 5% of households choose coal, and households that use LPG and electricity comprise 13% and 35%, respectively. Biomass is the dominant fuel choice for cooking among all energy sources, which is consistent with others’ research [
23]. There exist some differences between the two counties: more households choose firewood and LPG as the primary cooking fuel in Qihe, while more households use straw and electricity in Wuqiang, and fewer households choose coal as a cooking fuel.
When referring to the secondary cooking fuel, the five types of fuels account for 9%, 20%, 6%, 44%, and 19%, respectively. In making a comparison between primary and secondary cooking fuel choice, it is obvious that more households choose biomass and electricity as primary cooking fuel, while LPG is usually taken as a secondary cooking fuel. This indicates, to some extent, that households have different usage preferences for different fuels when other fuels are available.
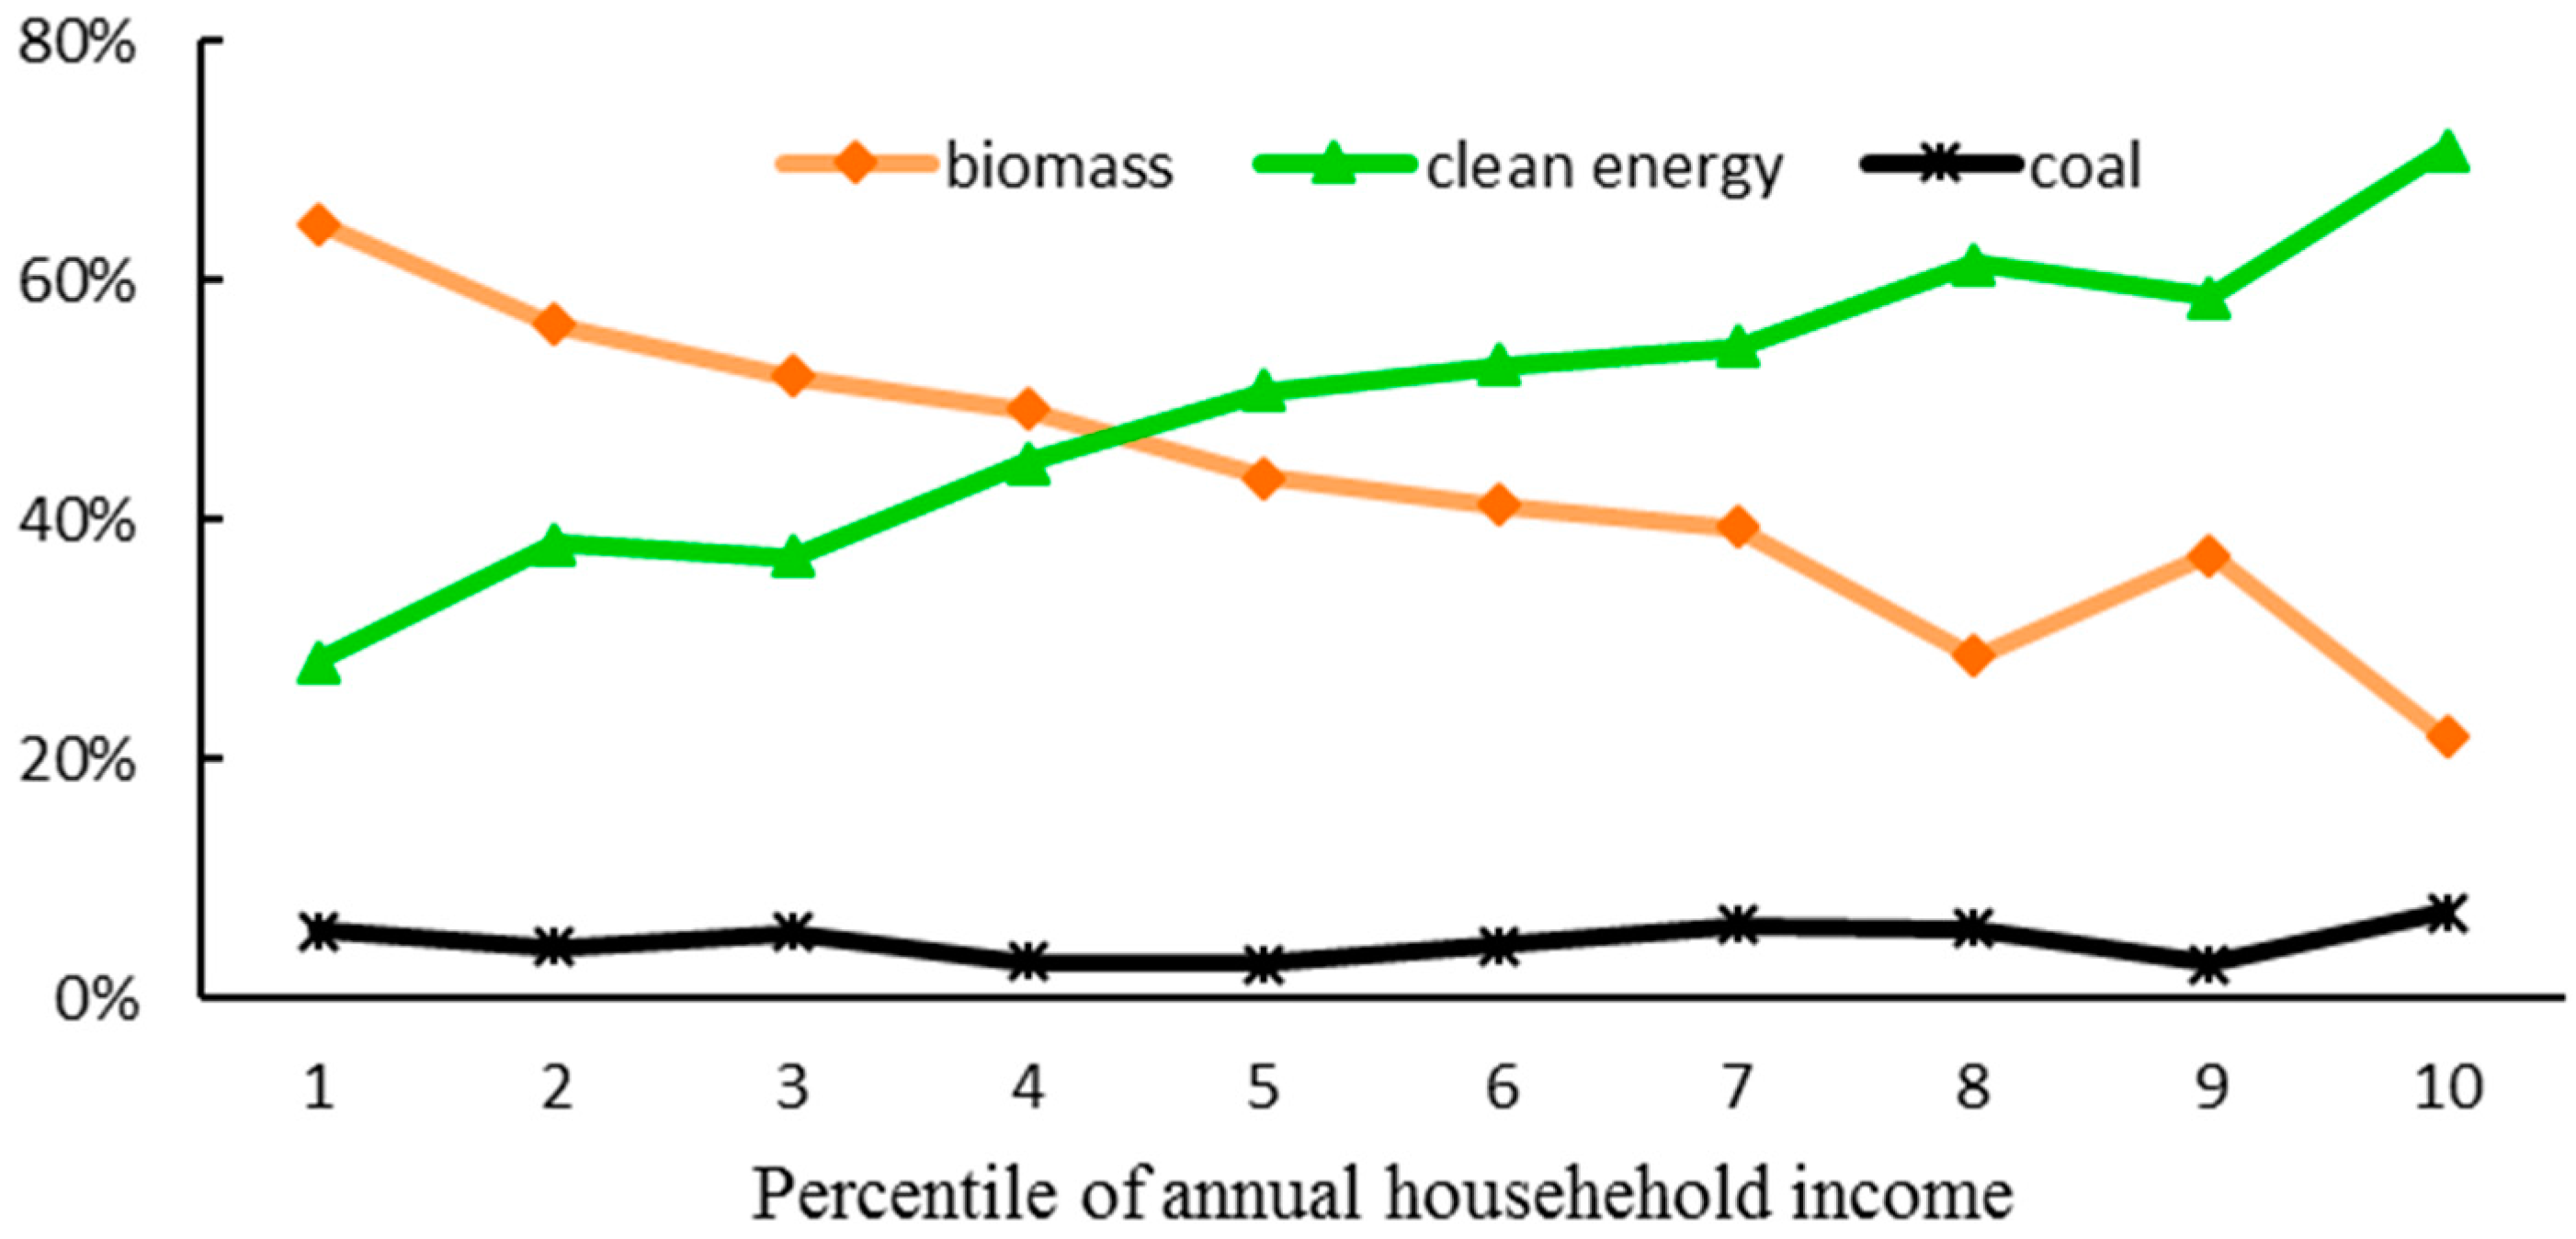
More specifically, nearly half of households choose solid fuels (mainly biomass and coal) as the primary cooking fuel, and the rest choose clean fuels (mainly LPG and electricity). Compared to primary cooking fuel choice, more households choose clean fuels as secondary cooking fuels, close to 63%, and Wuqiang is higher than Qihe. In rural areas, it is common to use a combination of fuels rather than use a single fuel to cook. When households choose solid fuels as the primary cooking fuel, the percentage that choose solid fuels as a secondary cooking fuel is 18%, while clean fuels account for 30%, and clean fuels are usually used as subsidiary fuels by those families. When households choose clean fuels as the primary cooking fuel, they are also more likely to prefer to use clean fuels as the secondary cooking fuel, which accounts for 34%. The combination of solid fuels and clean fuels is widely used to cook in rural areas, accounting for 48%, and fuel stacking still widely exists in rural areas [
36].
3.3. Changes of Cooking Fuel Choice
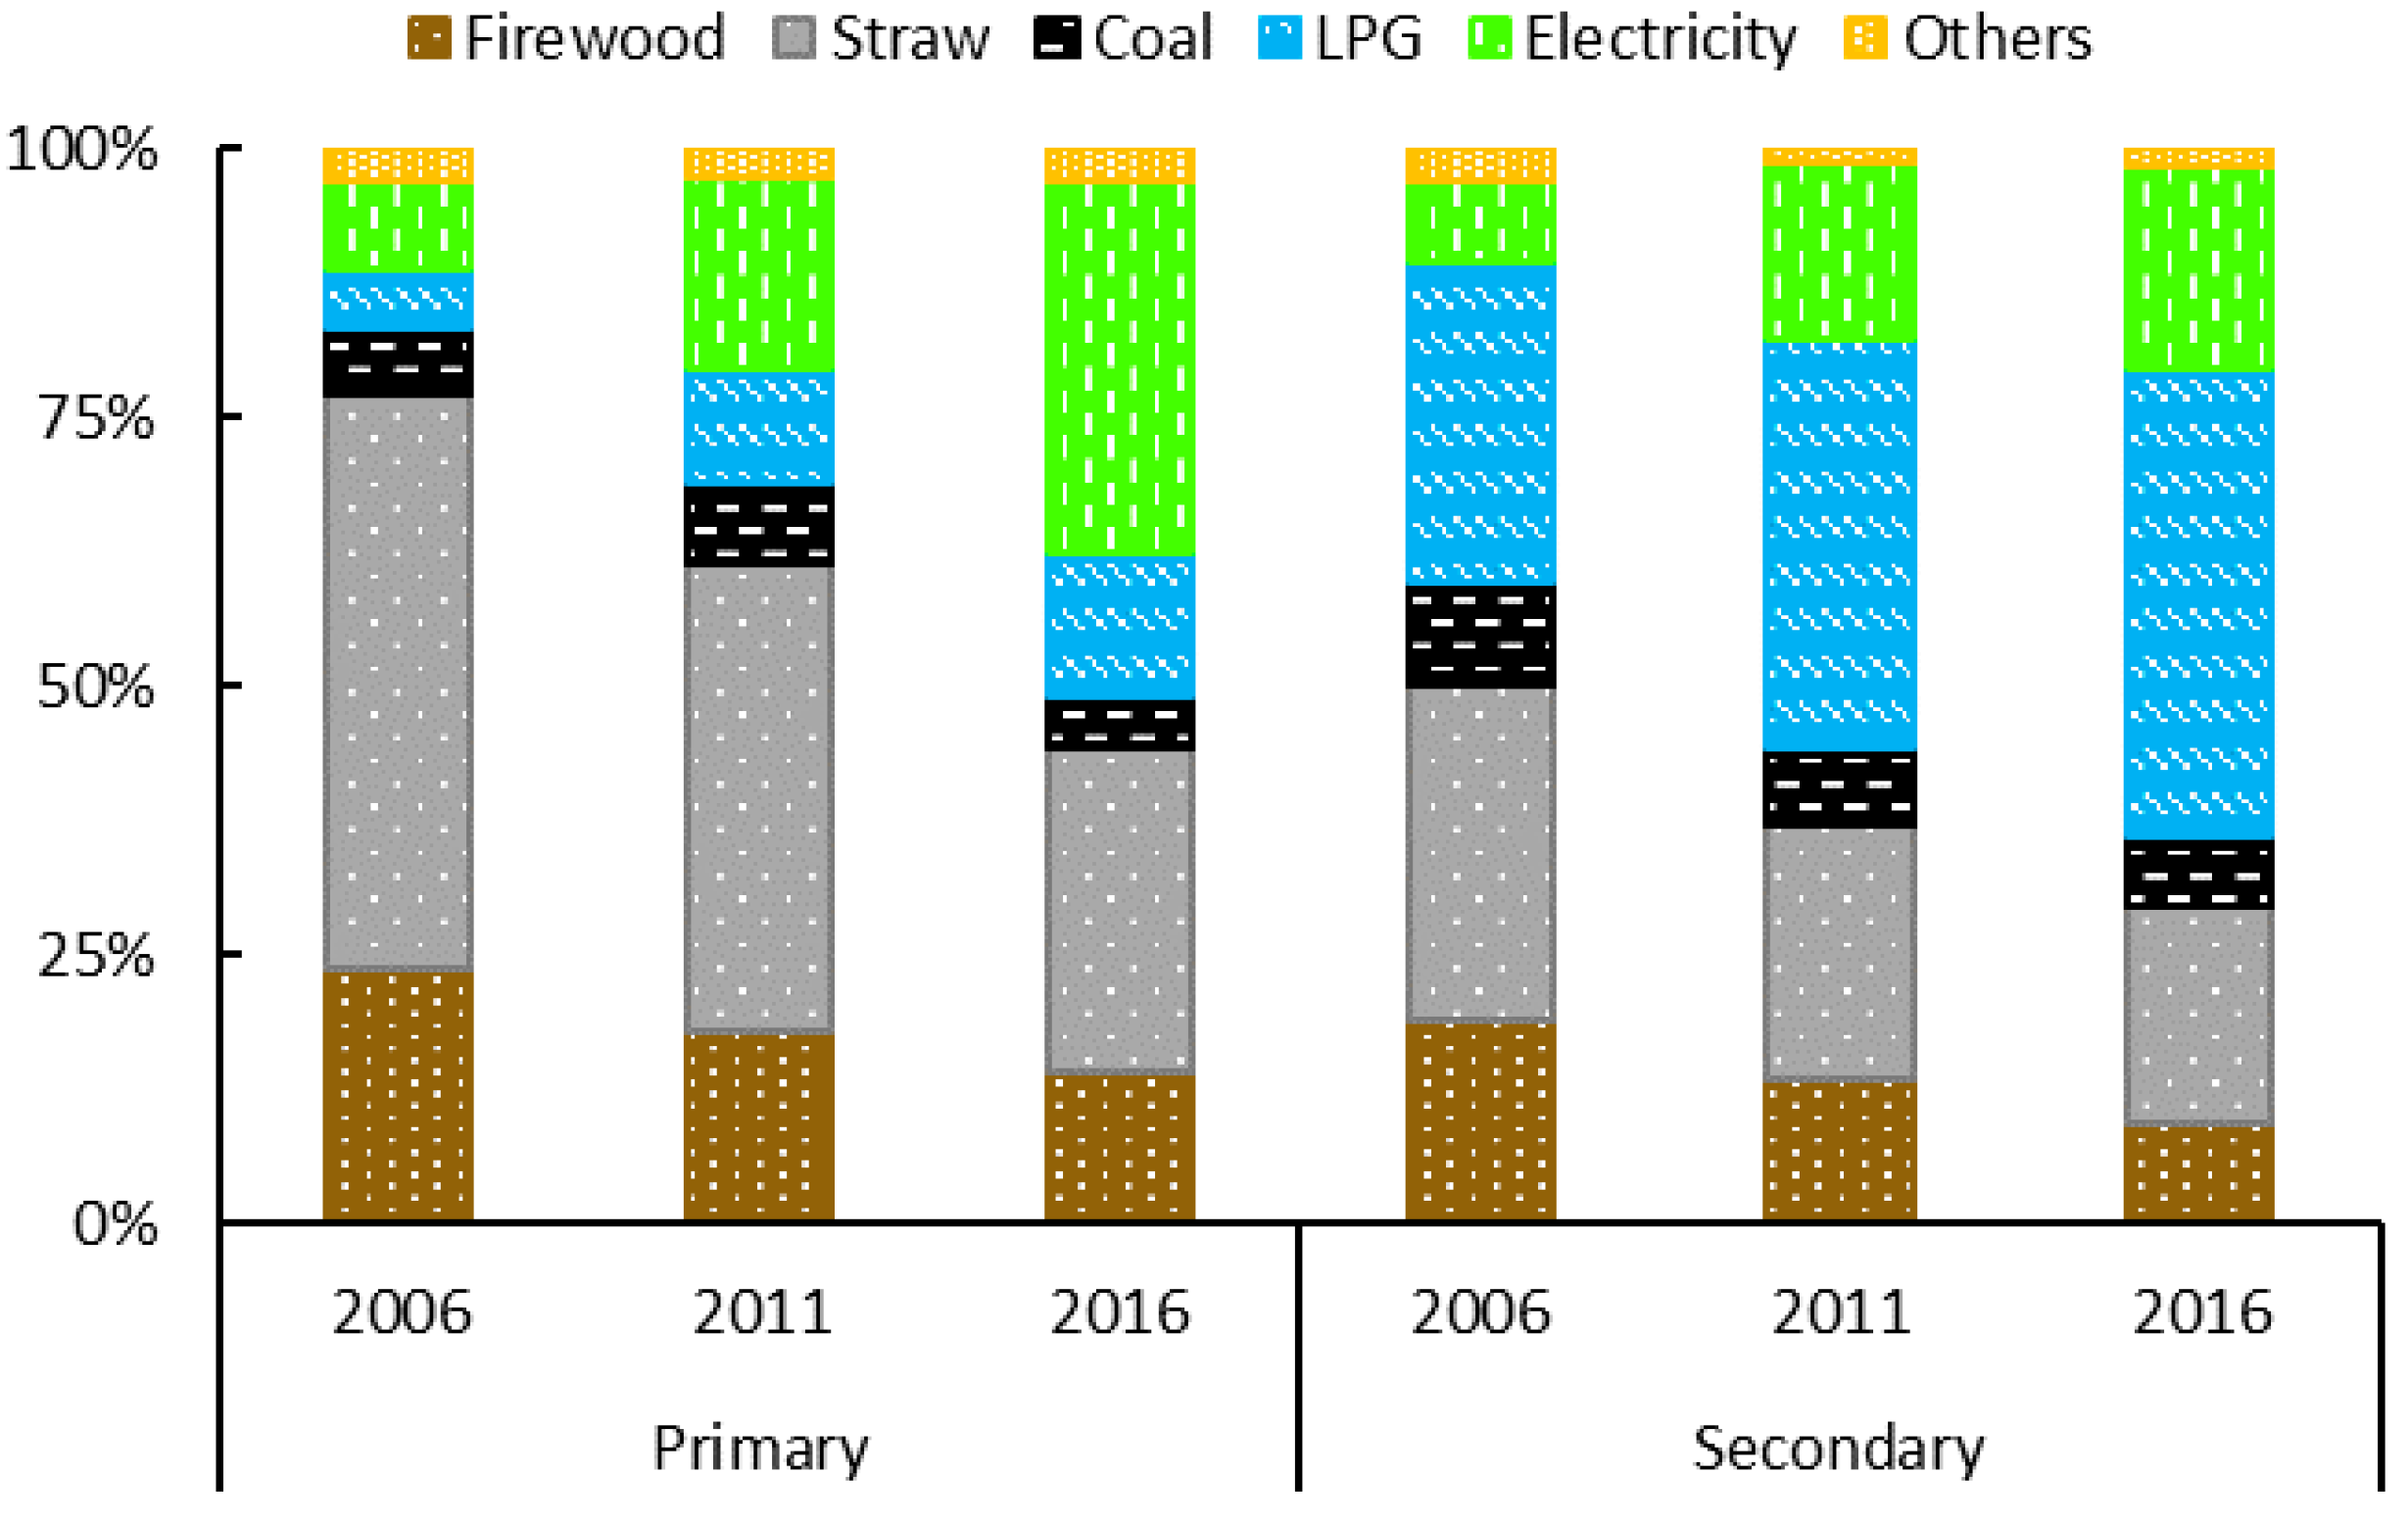
Figure 6 describes the trend of different cooking fuels in 2006, 2011, and 2016, which indicates that the percentage of households using solid fuels decreased, and clean fuels increased regardless of primary and secondary choices in the past 10 years. This trend is closely connected to the development of the Chinese economy, leading to the improvement of personal income and living standards. More specifically, though firewood and straw have decreased by 40% and 43%, respectively, in the past 10 years, they still have a large share (44%) in 2016, which is consistent with common results that biomass is still the main fuel choice to cook in rural areas [
30]. On the contrary, the percentage of clean fuels is less than 50%, despite LPG and electricity each largely increasing by more than one times and three times in primary cooking fuel, respectively. In conclusion, the cooking fuel transition follows the general rule, changing from traditional energy to modern energy sources [
22,
37].
3.4. Water Heating
Water heating includes drinking water, bathing, and washing clothes and tableware, and this is a basic need for daily life. In this study, we analyze the fuel choice of hot drinking water and bathing.
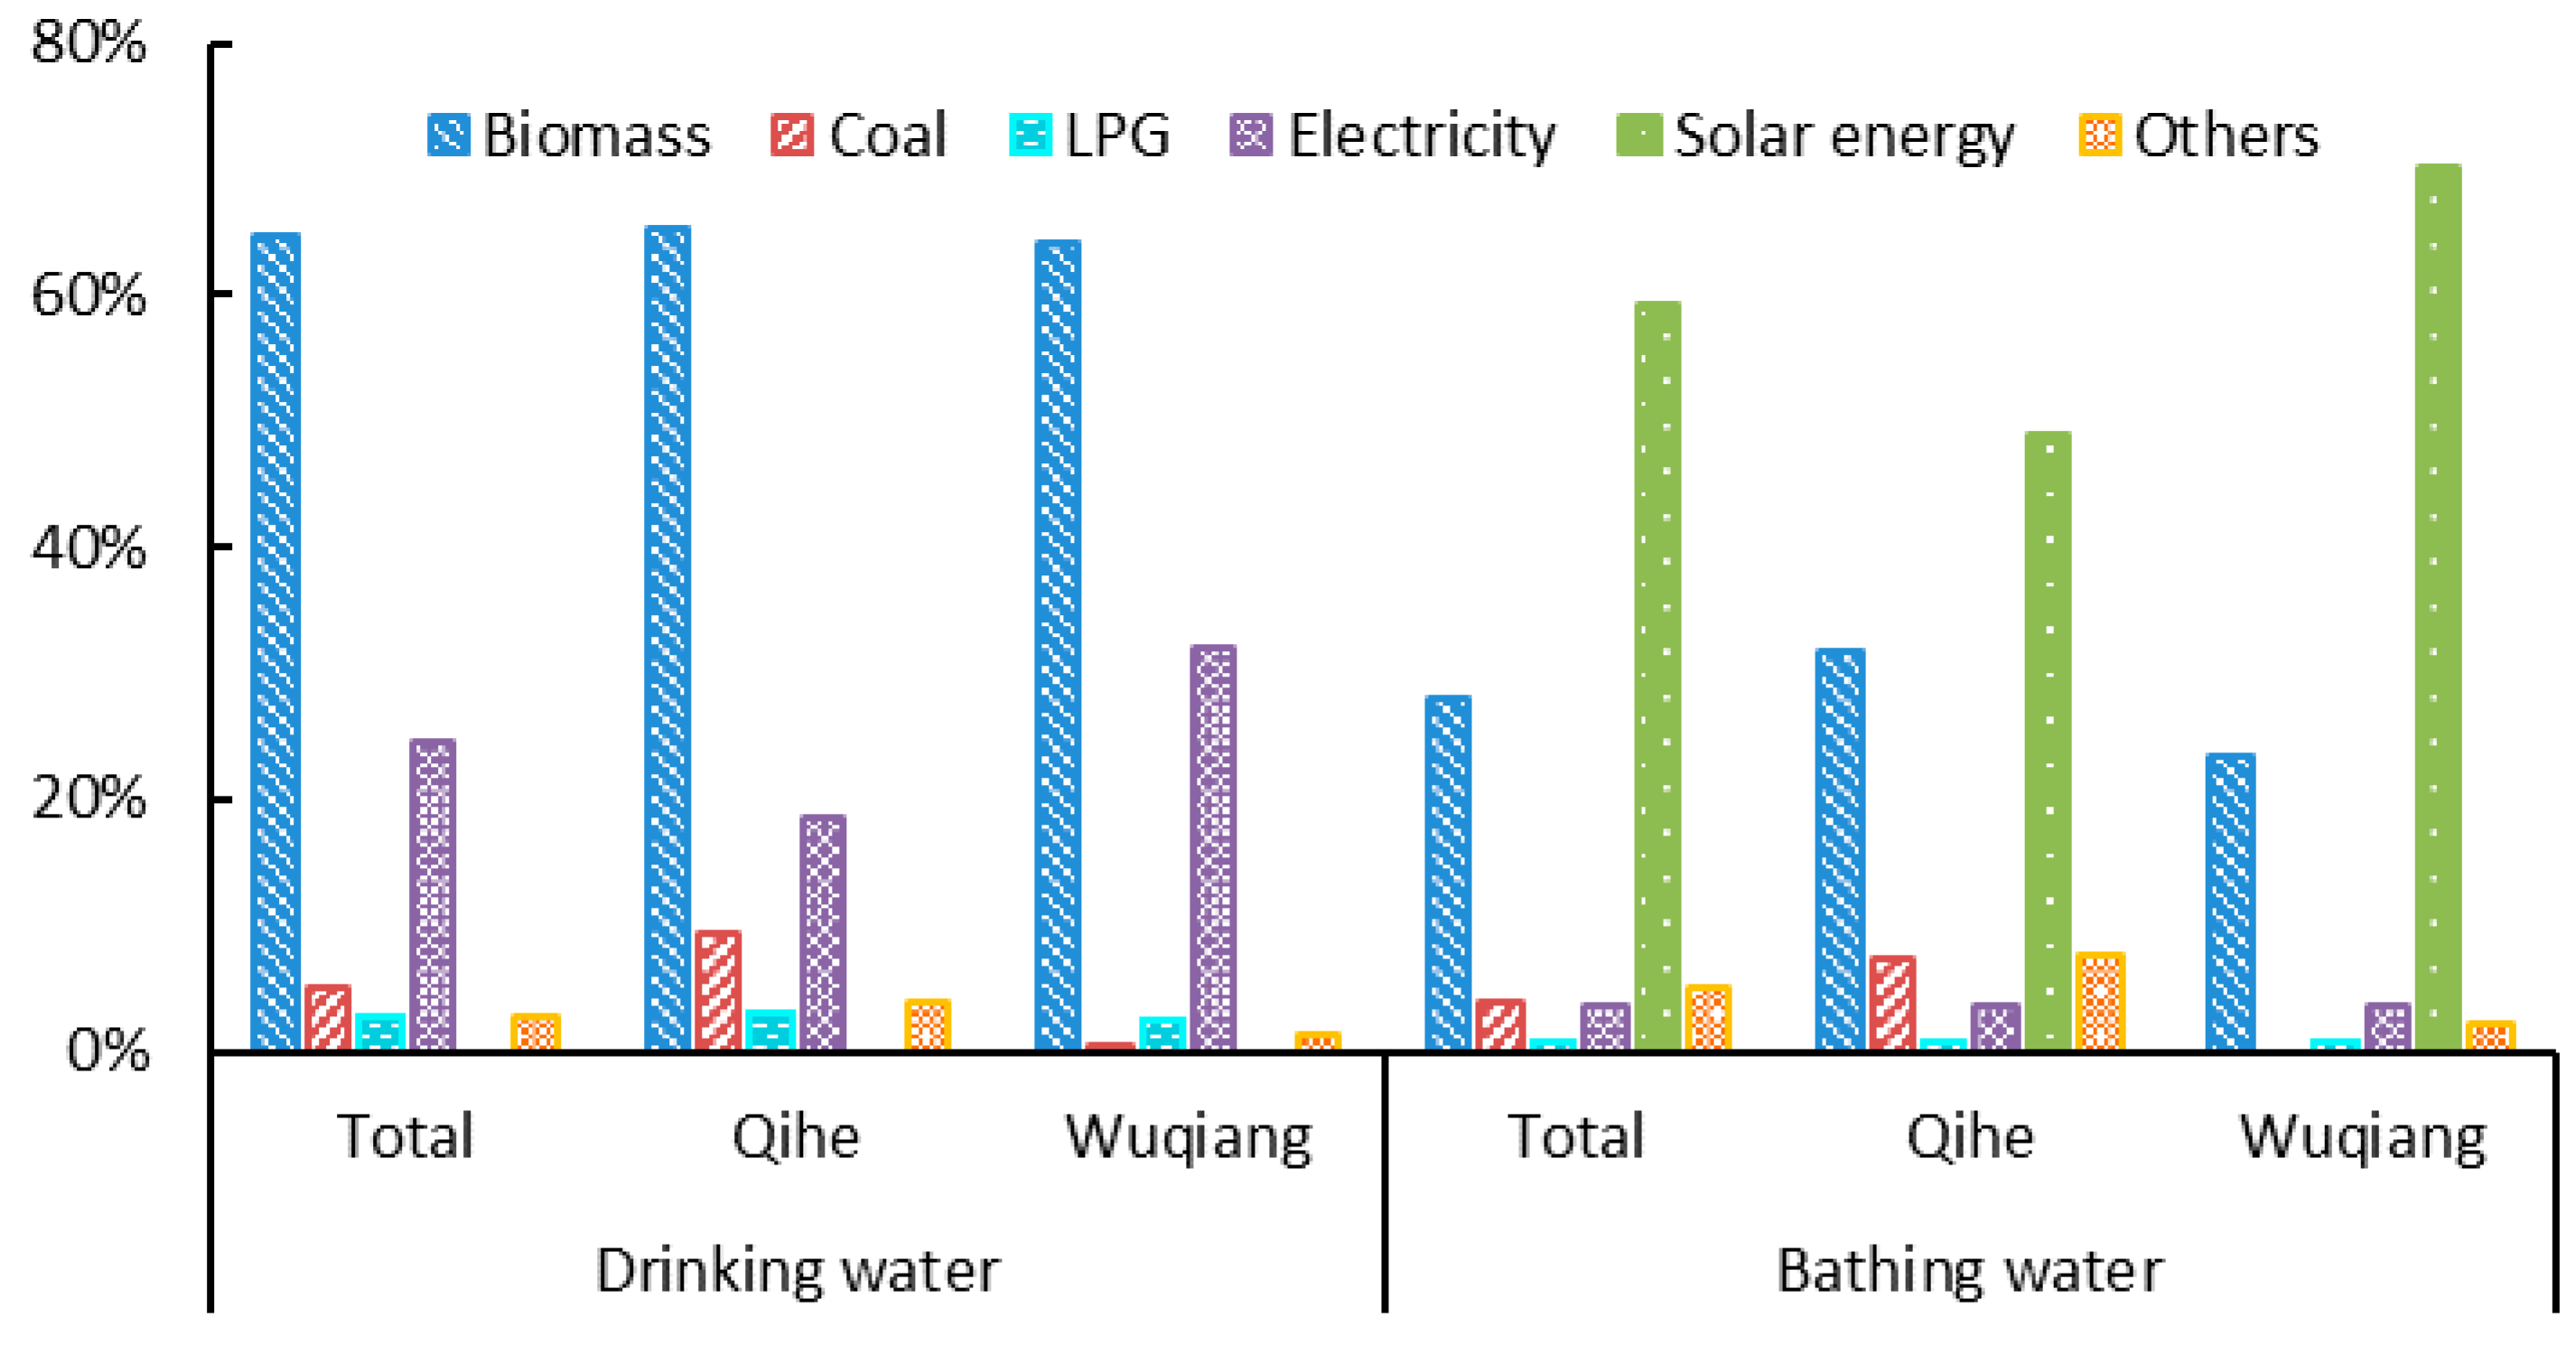
Figure 7 shows that almost 65% of households use biomass to boil drinking water, and the second fuel used is electricity, accounting for 25%; the rest of the fuels maintain just a small percentage. It is more efficient and convenient to use electricity to boil water than biomass according to our knowledge, but the percentage of using biomass is greater than electricity. We find that households usually use a commercial firewood stove to boil water for basic needs, universally, and they tend to place it outdoors and use it frequently. Additionally, the percentage of electricity used to boil drinking water is higher in Wuqiang than that of Qihe, and the coal usage is less, which may be caused by different policy restrictions.
Unlike hot drinking water, households usually use solar energy for bathing, which accounts for 59%, and the second most frequently used fuel is biomass, accounting for 28%. Furthermore, solar energy is more widely used in Wuqiang, because the ownership of solar water heaters per 100 households is 36% and 44% in Qihe and Wuqiang, respectively. We find that many households use an iron bucket to absorb solar energy for their bathing needs in Wuqiang, which is convenient and inexpensive.
3.5. Space Heating and Cooling
Qihe and Wuqiang are located in the Northern China, and the temperature is low in winter, thus, there is a great demand for space heating. Though the Chinese government began to provide a centralized heating system in 1958, the policy only focused on city-wide centralized heating to northern cities [
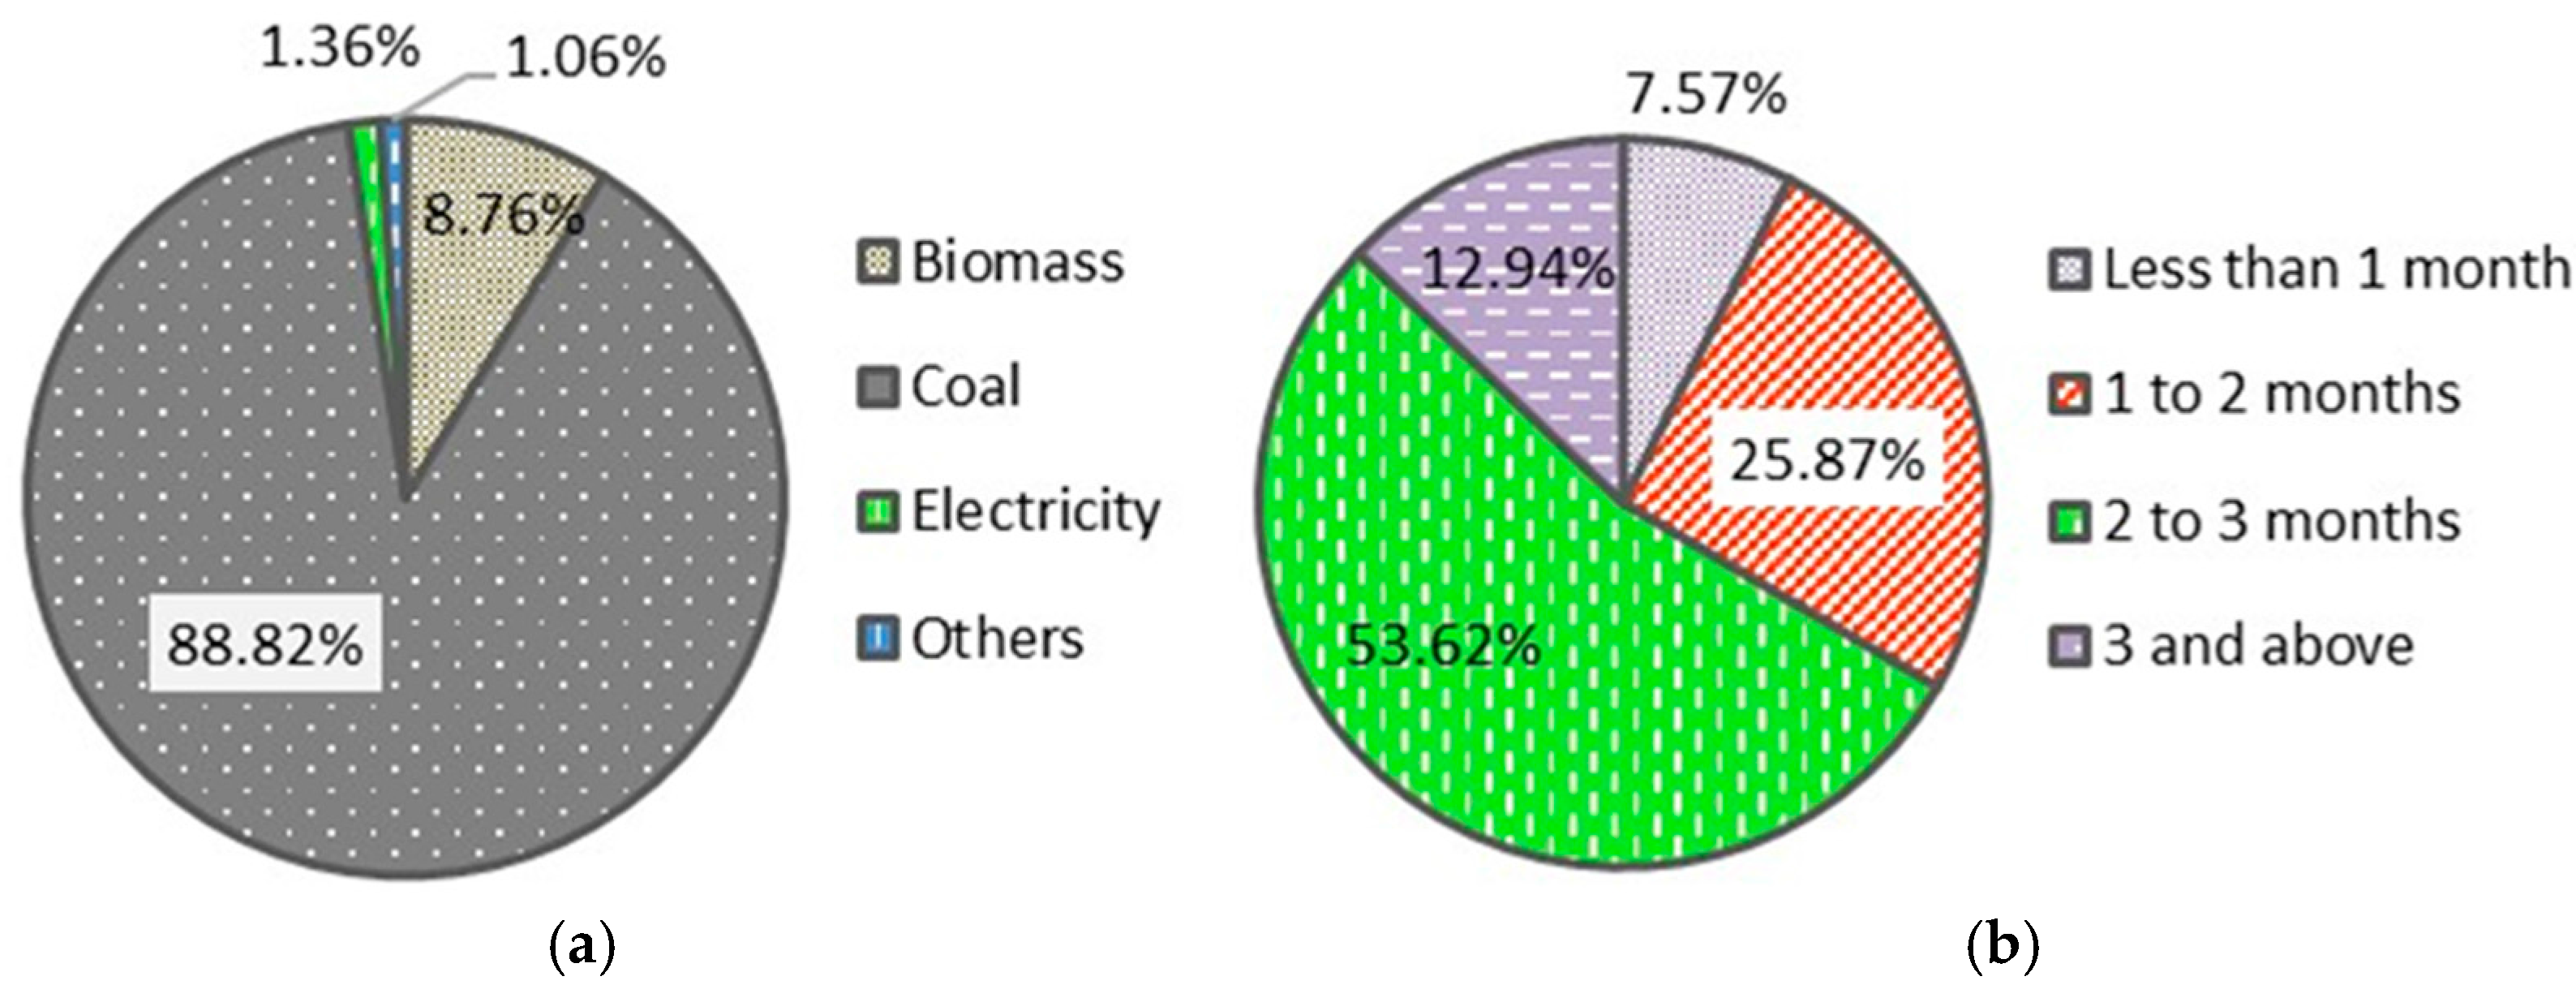
38]. In rural areas, people take measures to keep warm by themselves. In our survey, more than 92% households use different devices for their space heating demands, including a coal stove, a traditional Kang, an electric heating fan, and air conditioning, while the rest have no space heating. A coal stove is the most common device which mainly burns coal, accounting for as much as 89% of households, as shown in
Figure 8a. Nine percent of households burn biomass in traditional kangs to heat their bed, and households hardly use electricity for space heating even if they own air conditioners. Generally, space heating devices are commonly used from November to March. In our survey,
Figure 8b shows about 26% households use it for two months, 53% for three months, and only 13% use it for more than three months in Wuqiang County, which is a frugal consumption.
Air conditioning is the most common appliance for space cooling in urban areas, while electric fans are more widely used in rural areas for their cheap price. In our survey, more than 70% of households use electric fans for space cooling, 6% households use air conditioning, and the rest do not have space cooling.
3.6. Appliances
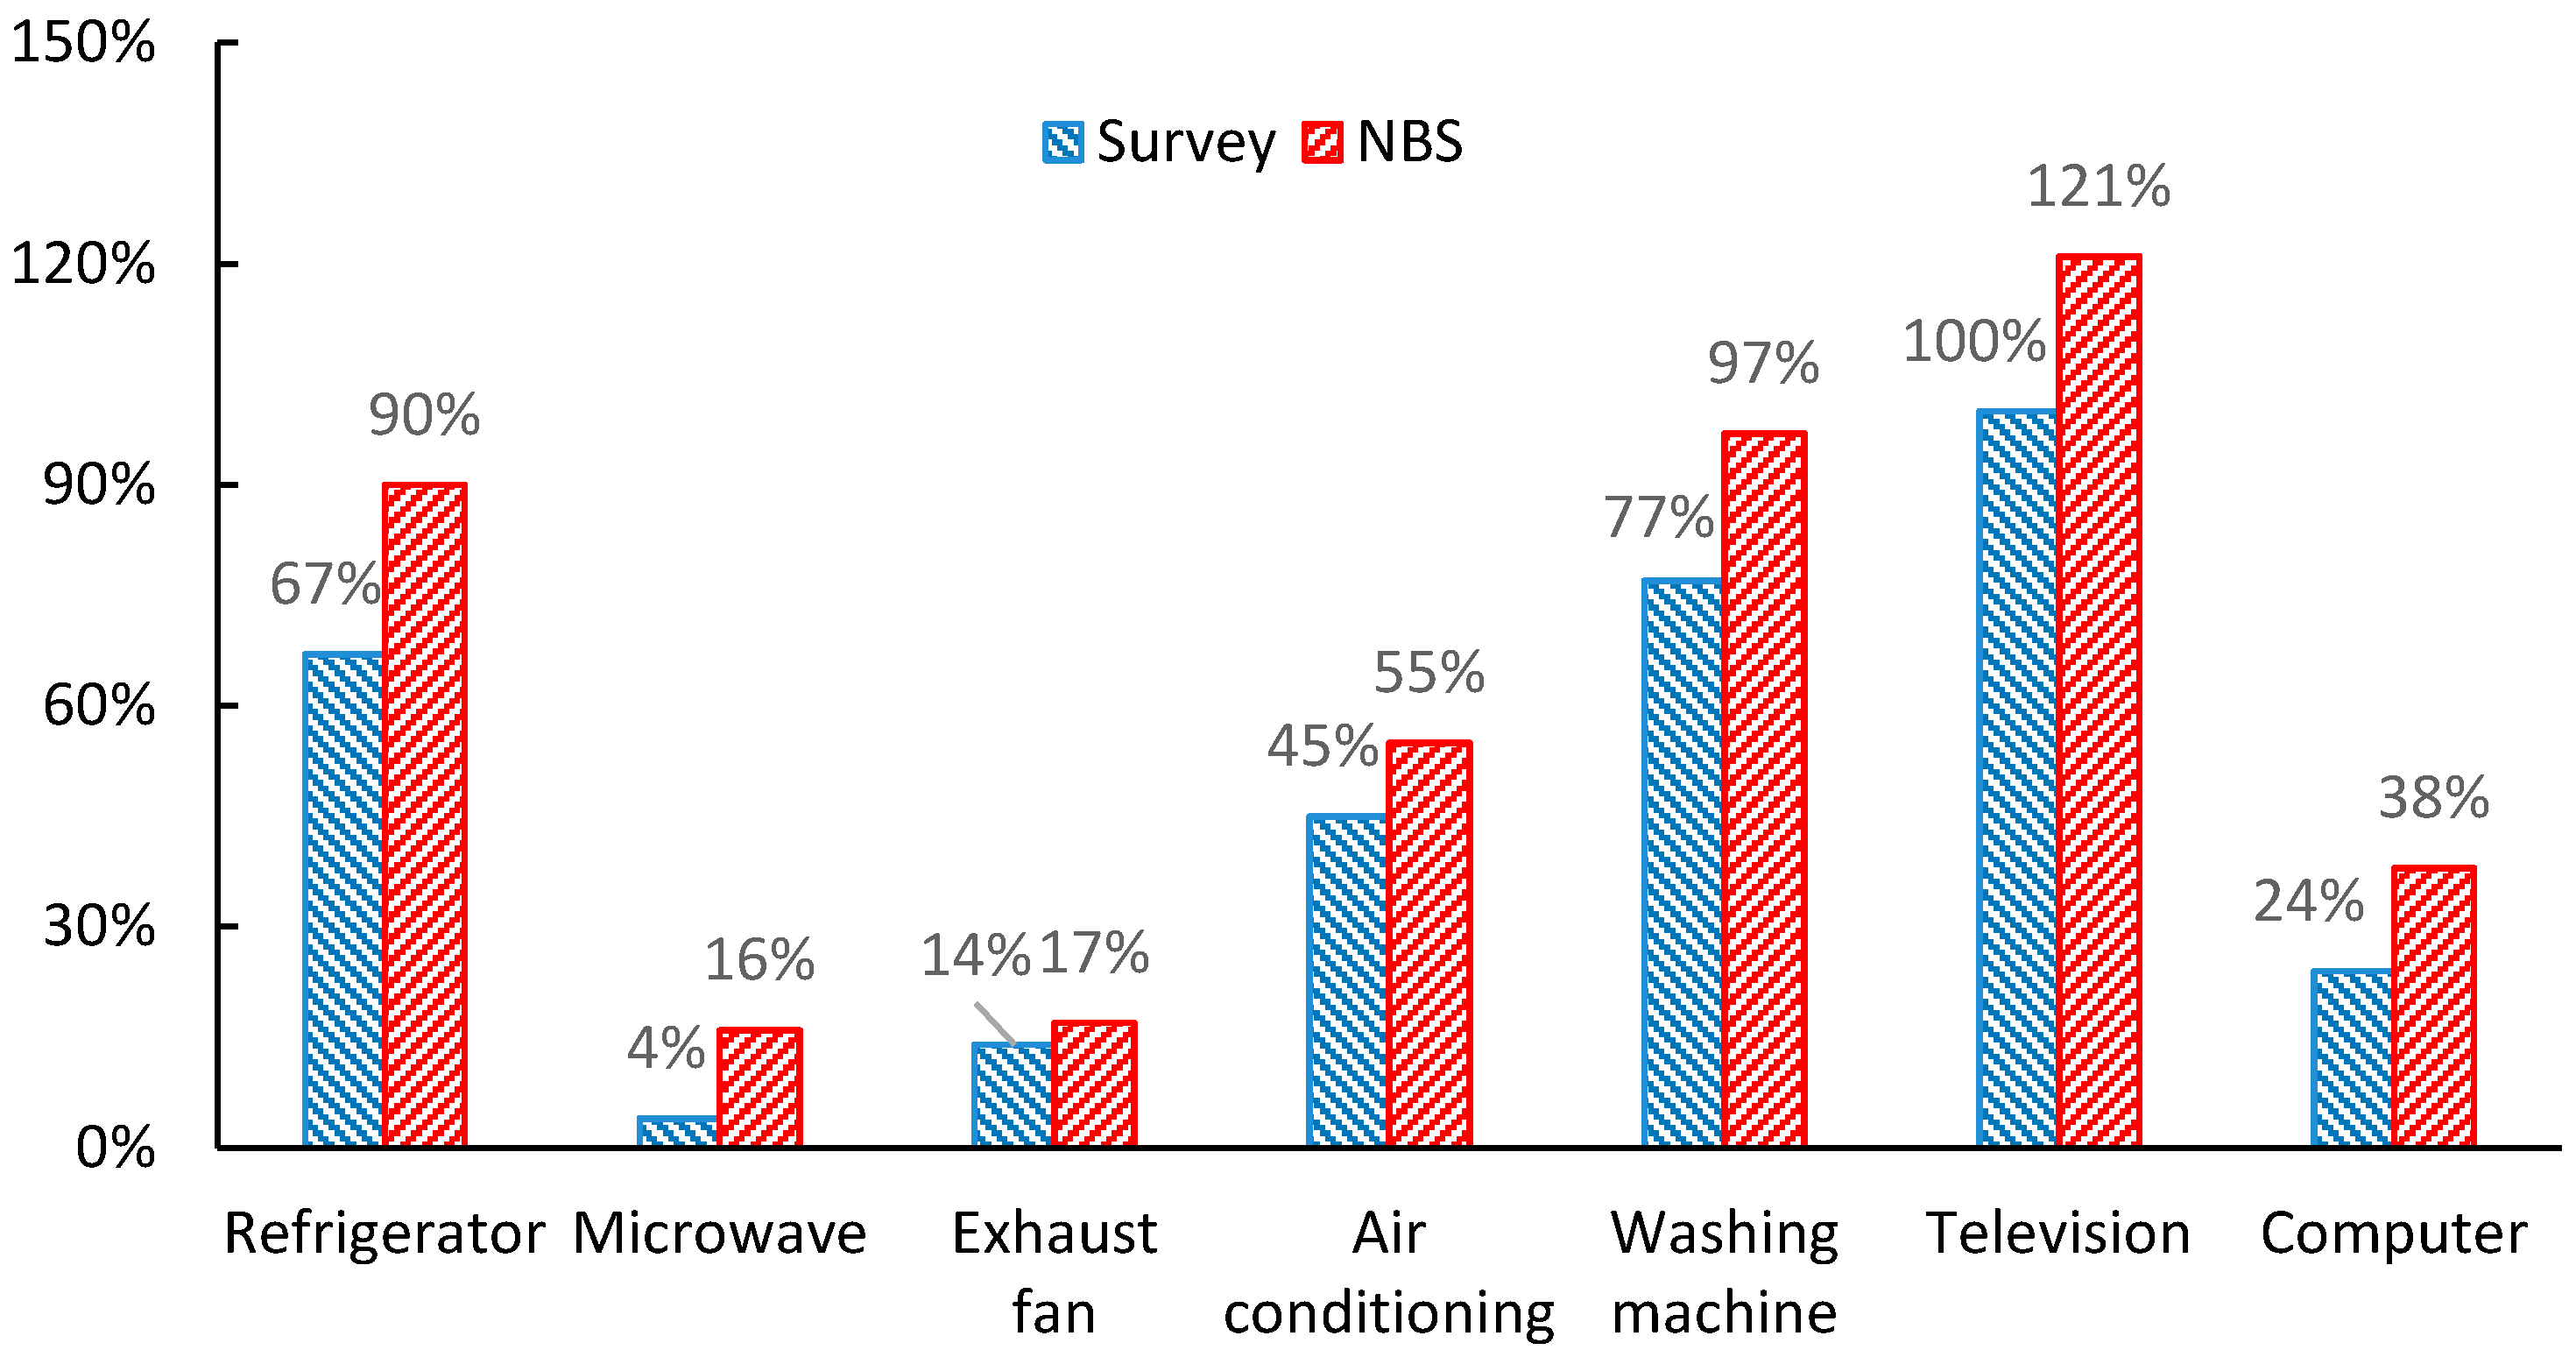
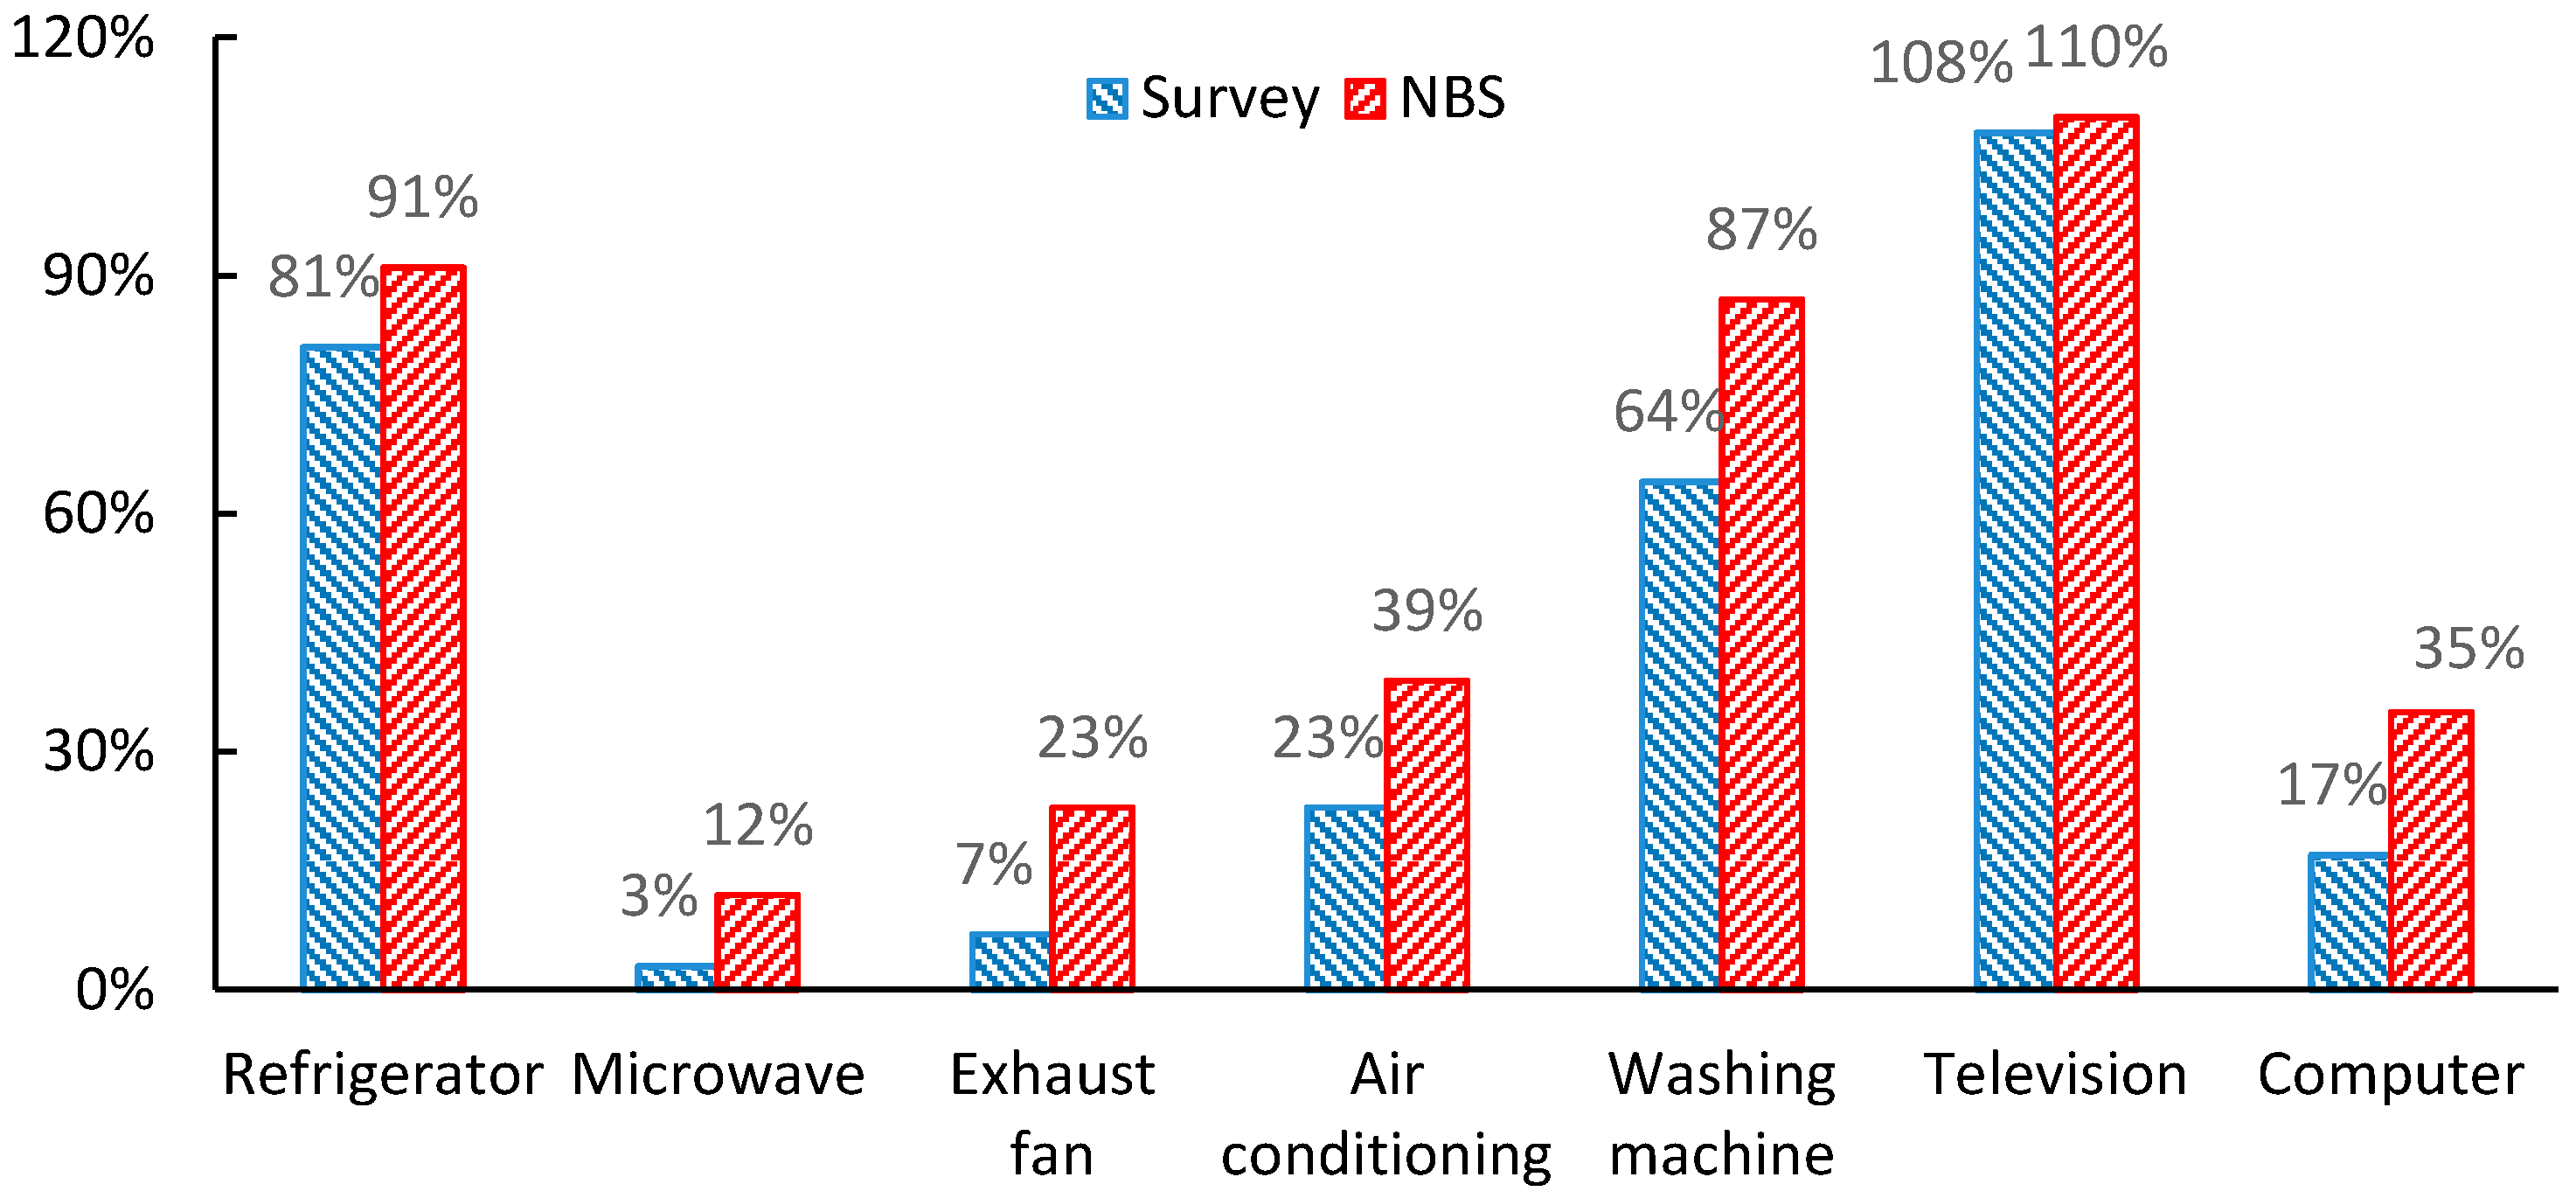
With the improvement of rural living standards, the usage of home appliances has become universal, and ownership of appliances can reflect household wealth and electricity consumption. In our survey, refrigerators, televisions, and washing machines are common in rural households, and the ownership of such appliances per 100 households account for 74%, 105%, and 69%, respectively. While ownerships of air conditioning, microwaves, exhaust fans, and computers are low, accounting for just 33%, 3%, 10%, and 20%, respectively, we find that appliances for basic needs are used universally in rural areas, but possession rates of other appliances for hedonistic needs are low, and generally owned by wealthier households.
Figure 9 and
Figure 10 show the ownership of different appliances per 100 rural households in Qihe and Wuqiang. In Qihe County, ownership of refrigerators, televisions, and computer is higher than that of Wuqiang, while Wuqiang has a higher percentage of exhaust fans, washing machines, and air conditioners, which is consistent with the data published by NBS. In our survey, ownership of appliances are lower than that of NBS, especially with respect to microwaves, exhaust fans, air conditioners, and computers, which is because our survey focuses on less-developed villages, while the NBS’ data represents the whole province.
Energy efficiency labels have proved to be a powerful program to reduce energy consumption in developed countries [
39,
40]. In this survey, the types of refrigerators and air conditioners of households purchased was included, and the percentage of refrigerators and air conditioners that are energy-efficient account for 60% and 63%, respectively, while about 10% of households know little about energy efficiency. We find that China’s energy efficiency program has a wide recognition in recent years, but there is still space to improve.
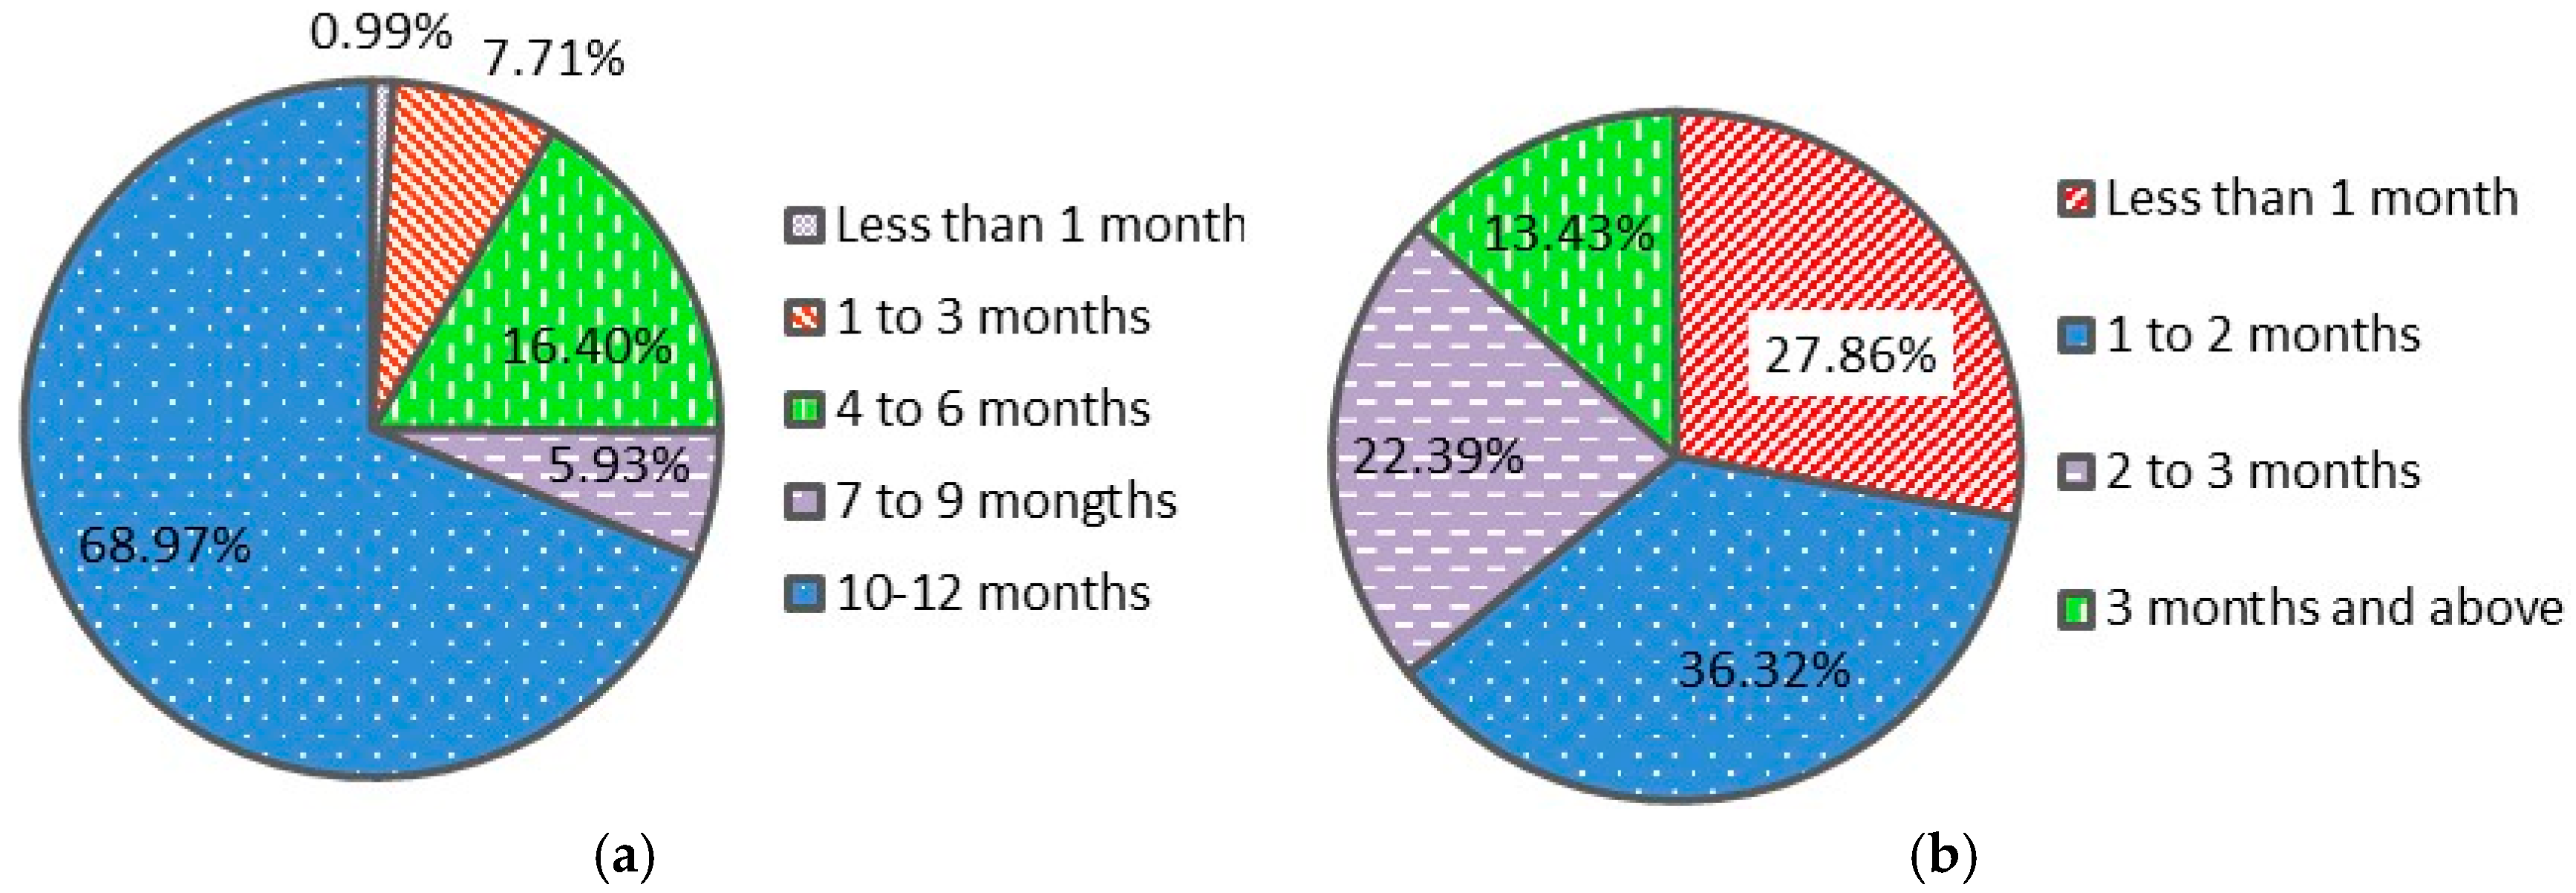
This survey also questioned households about the duration of the use of refrigerators and air conditioners, the usage behaviors of such appliances are presented in
Figure 11. More than 68% of households keep refrigerators on for more than 10 months of the year, and 66% of households keep it on all year. While the rest of households just use it for several months, only 25% of households use it for half the year or less. The percentage of households using air conditioning is also economical, as about 28% of households use it for less than one month, only 13% of households use it for three months or more in the summer, and almost 87% of households do not use air conditioning in the winter. Furthermore, they tend to turn it on for several hours during the hottest time of day.
5. Conclusions and Implications
This paper presents a descriptive analysis on rural energy consumption based on 717 observation surveys in two counties of Northern China, and we use primary fuel choice to substitute quantity for different end-use activities due to those left behind in rural areas are usually the elderly and children, who have limited recognition about energy consumption. We find that biomass (mainly wood and crop residue) is still the dominant fuel choice for cooking among coal, LPG, electricity, and others, accounting for 44%, and straw is more widely used than firewood in rural areas. Rural residents use diversified energy to cook, and they prefer to use a combination of fuels rather than a single one. Furthermore, nearly half of households choose solid fuels (mainly biomass and coal) as the primary cooking fuel, while the rest use clean fuels (mainly LPG and electricity) to cook, and the percentage of using clean energy is larger in the secondary cooking fuel choice, which indicates that clean energy is used more as an auxiliary energy source. In addition, the transition of cooking fuel choice follows the general rules of changes from traditional energy to modern energy. Secondly, biomass is also the common fuel used for water heating, and solar energy is widely used for bathing. Thirdly, coal is the most common fuel for space heating, accounting for nearly 90%, and even one-third of households have space heating for less than two months. Fourthly, the ownership of home appliances increased largely in recent years, and refrigerators, televisions, and washing machines are commonly used in rural areas, while ownership of air conditioning, microwaves, exhaust fans, and computers are much lower, and usage behaviors of some appliances are economical.
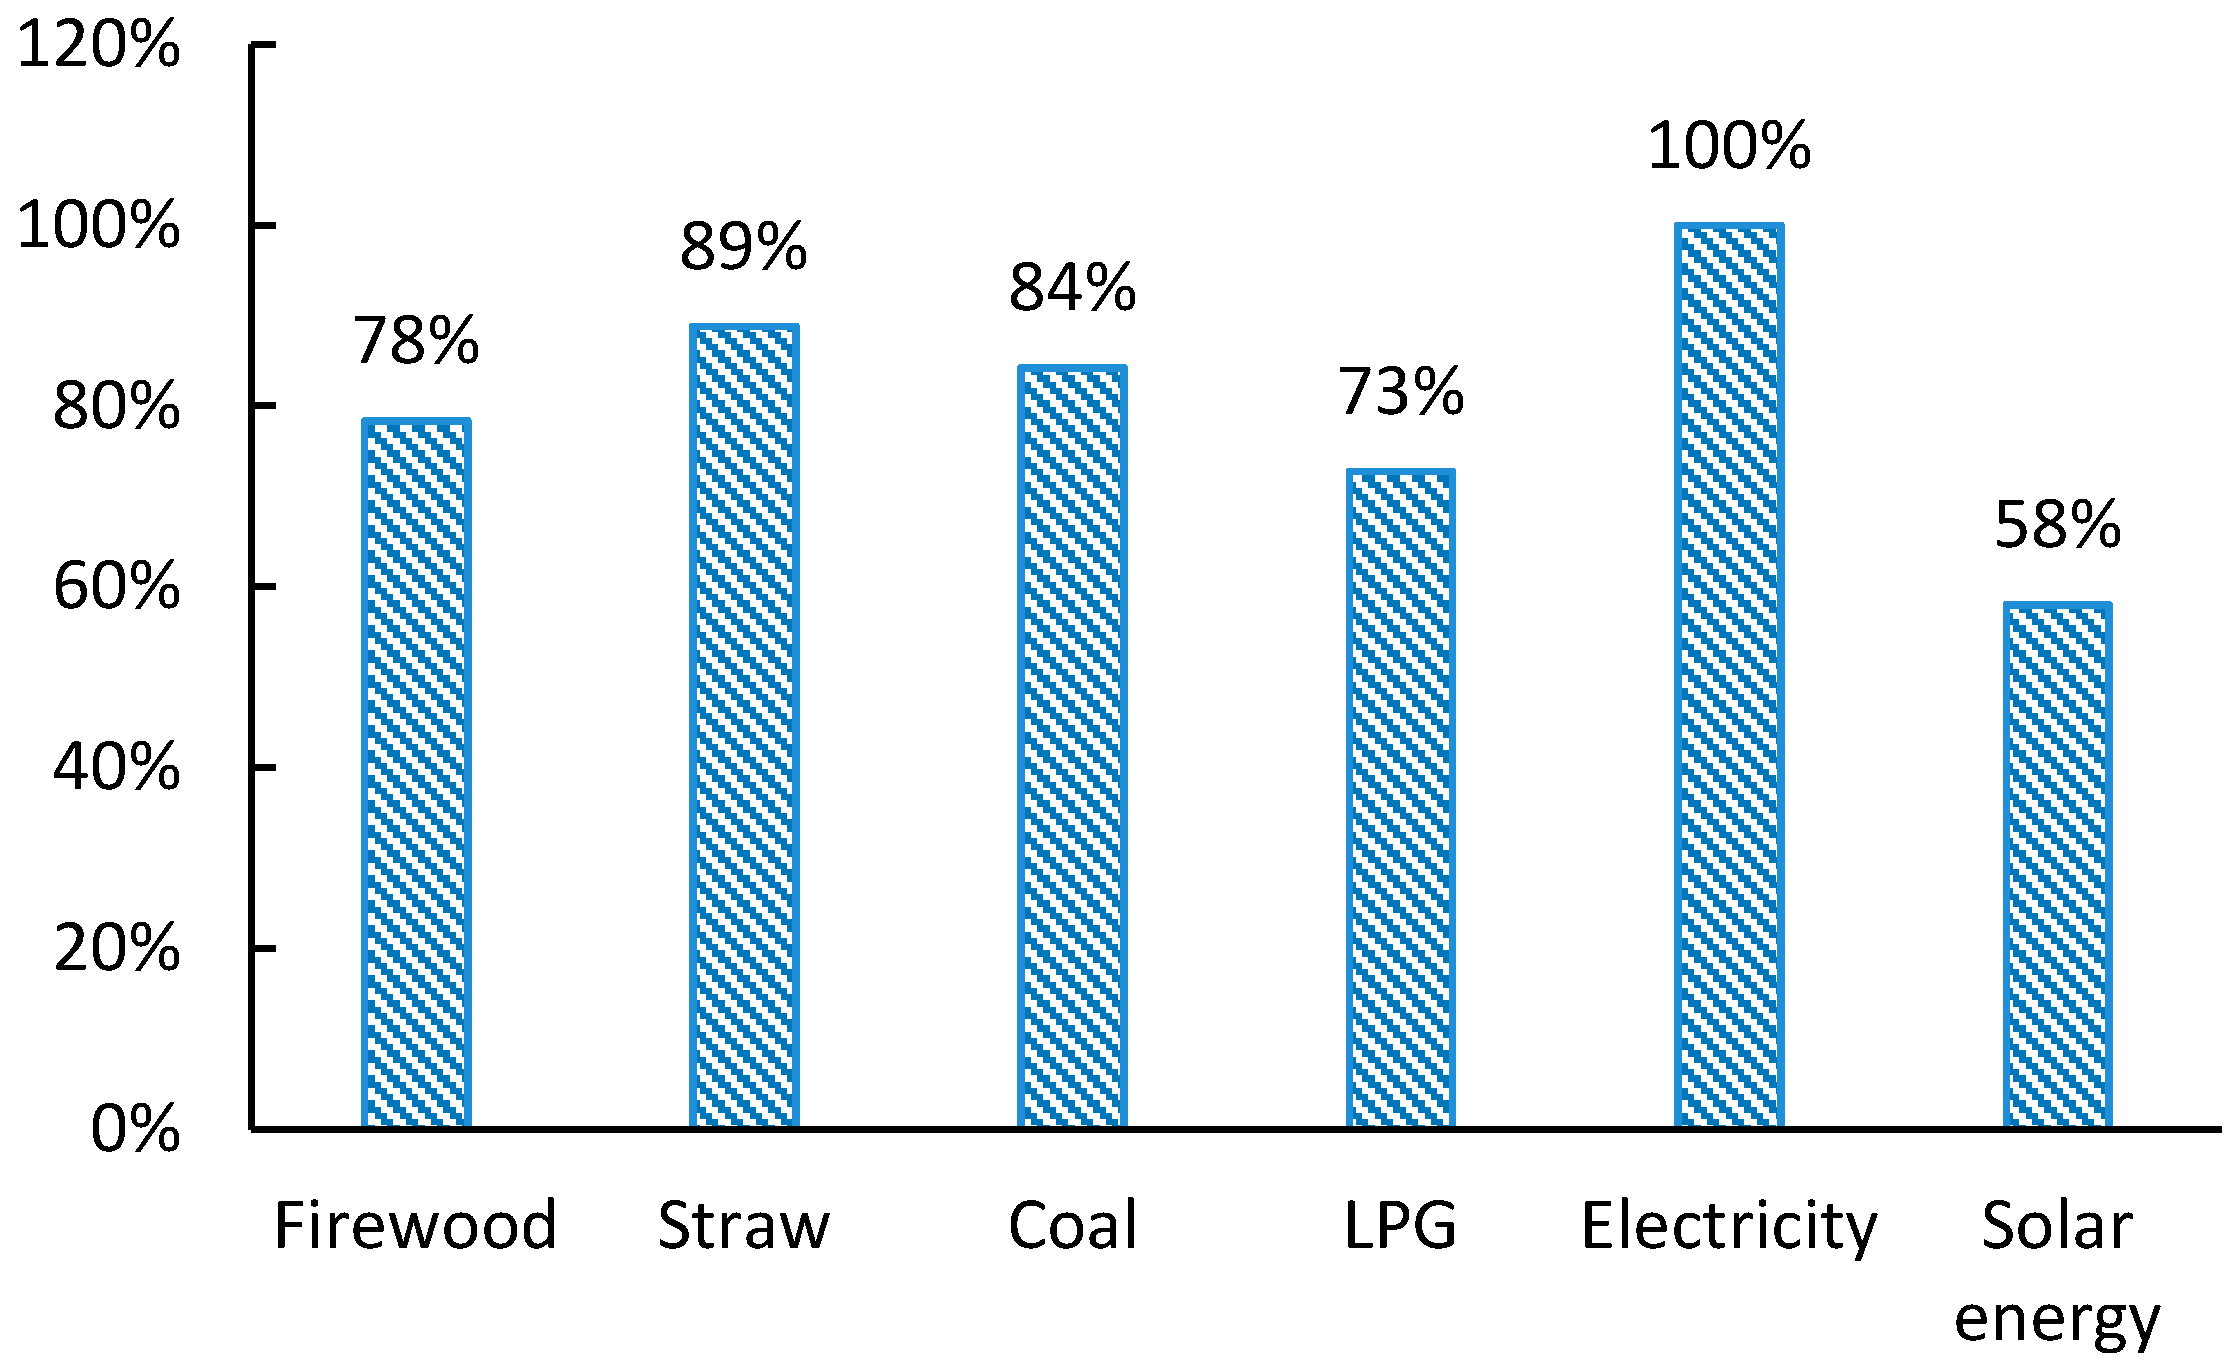
There are many factors influencing fuel choice in rural areas, including fuel accessibility, fuel price, income, and education. Nowadays, fuel accessibility has greatly increased in rural areas in recent years, and households use coal, LPG, electricity, and solar energy for any use, accounting for 84%, 73%, 100%, and 58%. Though clean fuels are conveniently accessible, nearly 50% of households still choose solid fuels as the primary cooking fuel, which is restricted by income to a great extent. Furthermore, usage habits and environmental recognition, age structure, and education level also influence this.
Solid fuels are still widely used in rural areas, biomass is mainly used for cooking, and coal is the primary fuel for space heating, which cause serious damage to the environment and health. The high percentage of biomass used to cook is related to several factors, including: (i) income restriction, as biomass is free; (ii) collection of biomass is no longer a time-consuming business, as straw is just a residue of agriculture crops; (iii) devices used to combust biomass are widely self-built in rural areas; (iv) rural residents tend to consume thriftily; (v) the usage habits of many households show many have used biomass to cook for decades, and meals cooked with biomass have better flavor; and (vi) the elderly tend to use biomass to cook due to their limited income and education.
It is urgent to transfer the energy structure in rural areas, and multiple actions can be taken. Firstly, solid fuels are widely used in rural areas, and this trend will not change greatly in the short-term due to its accessibility, affordability, convenience, and habituation. Therefore, it is necessary to make biomass clean in some food production areas, the opportunity and potential of transforming the use of biomass have greatly enhanced with improved technology and increased financial support, such as biogas, liquid biofuels, and biomass gasification [
44,
45,
46]. Second, taking advantage of new energy, especially solar energy. We find that the initial purchase cost impedes households from using solar energy more frequently and efficiently, and government can provide some subsidy for households to install solar energy devices. Third, we find residents have limited knowledge about air pollution and its related health effects, and the government can disseminate information on the source of indoor air pollution, and improve residents’ recognition about the damage of combusting solid fuels by figures and videos in consideration of their limited educational level, guiding them to reduce the usage of biomass, and open windows or maintain good ventilation when using it. Additionally, we find that fuel accessibility of commercial energy has improved greatly in rural areas, but fuel affordability is still fragile, and soil fuel is mainly used by low income households, and the government can offer some fuel subsidy to households where the per capita income is below the poverty line, which is a proper form of poverty alleviation.


 ,
, 


