
Improving the Diagnosis Accuracy of Hydrothermal Aging Degree of V2O5/WO3–TiO2 Catalyst in SCR Control System Using an GS–PSO–SVM Algorithm

1
Hubei Key Laboratory of Advanced Technology for Automotive Components, Wuhan University of Technology, Wuhan 430000, China
2
Hubei Collaborative Innovation Center for Automotive Components Technology, Wuhan 430000, China
*
Author to whom correspondence should be addressed.
Sustainability 2017, 9(4), 611; https://doi.org/10.3390/su9040611
Submission received: 21 December 2016
/
Revised: 10 April 2017
/
Accepted: 11 April 2017
/
Published: 14 April 2017
(This article belongs to the Section Sustainable Chemical Engineering and Technology)
Abstract
:Selective catalytic reduction (SCR) is one of the most effective technologies used for eliminating NOx from diesel engines. This paper presents a novel method based on a support vector machine (SVM) and particle swarm optimization (PSO) with grid search (GS) to diagnose the degree of aging of the V2O5/WO3–TiO2 catalyst in the SCR system. This study shows the aging effect on the performance of a NH3 slip based closed-loop SCR control system under different aging factors (α), which are defined by the SCR reaction rate (). A diagnosis of the performance of GS–PSO–SVM has been presented as compared to SVM, GS–SVM and PSO–SVM to get reliable results. The results show that the average prediction diagnosis accuracy of the degree of catalytic aging is up to 93.8%, 93.1%, 92.9% and 92.0% for GS–PSO–SVM, PSO–SVM, GS–SVM and SVM respectively. It is demonstrated that GS–PSO–SVM is able to identify the SCR catalyst’s degree of aging, to ultimately assist with fault tolerance in the aging of the SCR catalyst.
1. Introduction
Diesel engines are widely used in most commercial vehicles owing to their high thermal efficiency and considerable fuel economy. However, as one of the main pollutants from a diesel engine, emission of nitrogen oxides (NOx) will give rise to photochemical smog, which is harmful to the environment and human beings. Therefore, the reduction of NOx emissions from diesel engine becomes one of the most important objectives for the after-treatment system. In order to solve this problem, a urea based selective catalytic reduction (Urea–SCR) is regarded as the most promising and efficient technique for NOx reduction [1,2,3,4], which can control the NOx emission through the SCR reaction between NH3 (decomposed from urea) and NOx. Nevertheless, owing to the fact that NH3 is also a kind of pollutant, the trade-off between NOx conversion efficiency and NH3 leakage should be taken into consideration.
Researchers have proposed some effective control strategies to handle the trade-off issue, including the open-loop control strategy [5,6] and the closed-loop control strategy [7,8,9,10,11,12,13,14,15]. The authors in reference [5] propose an improved open-loop injection control strategy to make the NOx conversion efficiency higher than 75% by taking into account the NH3 storage in the SCR system. Reference [6] provides an open loop, non-sensor based fuzzy logic urea dosage controller, which can maximize NOx emission reduction and limit the amount of ammonia slip. Nevertheless, under the proposed stricter emission regulations Euro–V, the performance of the SCR system under the open-loop control strategy can’t fulfill the requirement [8]. Thus, the closed-loop control strategy is developed to meet stricter standards. In reference [11], the control system based on NH3 sensor feedback is analyzed via simulation by comparing it to a NOx sensor feedback control system. The results indicate they exhibit similar performance on emission control. Reference [12] presents a model-based control system using an embedded real-time SCR model and a NH3 sensor. The simulation and test results demonstrate the advantages of this control approach for fulfilling both NOx emission requirements and NH3 leakage limits. Reference [13] develops an NH3 coverage ratio observer based on NOx sensor measurements in a feedback loop to achieve good performance of the SCR system. Reference [14] proposes a model-based ammonia storage control strategy based on NOx sensor feedback to strike a better balance between high NOx reduction efficiency and low ammonia slip. Reference [15] presents a catalyst-temperature-based control strategy to control the average ammonia storage level. The results demonstrate that the control strategy works reasonably well under the test cycle. As a result, the closed-loop control strategy has remarkable performance in further reducing NOx emission without NH3 leakage exceeding the limit. However, in recent years, researchers have focused on studying the control strategy based on NOx sensor feedback but there are few reports about NH3-based closed-loop control strategy. In this study, a NH3-based closed-loop control strategy is proposed to maximize the NOx conversion efficiency with the NH3 leakage approaching the limits.
Hydrothermal aging of the catalyst, which is known as one of the negative impacts on catalytic activity after considerable service time of the SCR catalyst, will significantly degrade emission reduction capability of a SCR system. If the hydrothermal aging effect on the catalyst is not considered in an SCR control strategy, NOx emission and NH3 leakage will obviously increase. Hence, a great deal of studies regarding the hydrothermal aging of SCR catalysts have been conducted. The authors in Reference [16] prepare the V2O5/WO3–TiO2 catalysts by conventional impregnation (VWTi-con) and ultrasound-assisted impregnation methods (VWTi-HUST) respectively. After a hydrothermal treatment, the results show that there is a significant loss of NO reduction activity for VWTi-con, while VWTi-HUST still has good hydrothermal stability. The work in Reference [17] studies SCR activity with the V2O5/WO3–TiO2 catalyst in different V2O5 loadings in a fresh state and a hydrothermal aging state. Reference [18] investigates the hydrothermal stability of a V2O5/WO3–TiO2 catalyst. After hydrothermal treatment at 670 °C in 5% H2O/air for 64 h, V2O5/WO3–TiO2 the catalyst shows poor NH3–SCR activity especially in the high-temperature condition. Reference [19] investigates the physicochemical characteristics according to hydrothermal aging of a V2O5/WO3–TiO2 catalyst. The results show that after hydrothermal aging at 800 °C for 24 h, particles in the V2O5/WO3–TiO2 catalyst are agglomerated and the NOx conversion capability of the V2O5/WO3–TiO2 catalyst decreases significantly. Liu et al. [20] prepare the V2O5/WO3–TiO2 catalyst by wetness impregnation method, and it is hydrothermally aged at 750 °C in 10 vol % H2O/air for 24 h. The result shows that the NOx removal ability of the V2O5/WO3–TiO2 catalyst is severely and negatively affected by hydrothermal aging over the entire measured temperature range. From the above, the existing studies mainly focus on the experimental investigation of aging effects on SCR performance with different catalysts. Nevertheless, research on the quantitative identification of catalyst aging degree, which can be applied in the modification of a SCR control strategy, remains scarce. Recently, Ma et al. [21] present two observers for estimating the aging condition of a SCR system, which have good performance when estimating the degree of aging under various aging conditions. However, it is a model-based diagnosis method for identifying the degree of aging of a SCR system, which means the diagnosis accuracy partly relies on the model precision. To resolve this issue, the numerical diagnosis method has been further developed in recent years. The support vector machine (SVM), based on statistical learning theory, is one of the high-accuracy numerical diagnosis methods [22]. Furthermore, to obtain better diagnosis accuracy, the SVM combined with some optimization algorithms, such as SVM combined with grid search (GS) [23,24], SVM combined with particle swarm optimization (PSO) [24,25] and etc., are proposed. Reference [25] presents a PSO–SVM method for bearing fault diagnosis and it shows high classification accuracy and less computing time in fault diagnosis. In Reference [23], authors present a GS–SVM fault diagnosis method and it is demonstrated that GS–SVM shows advantage over PSO–SVM in both classification accuracy and computation efficiency. In this study, in order to further improve the diagnosis accuracy, a numerical method on the basis of a SVM combined with both PSO and GS algorithms is proposed to diagnose the aging condition of a SCR system.
Against the background given above, the objective of this paper is to propose a novel numerical method called GS–PSO–SVM for diagnosing the degree of aging of the V2O5/WO3–TiO2 catalyst, which can be utilized to reconfigure the control law of the SCR system for fault tolerance in future work. Furthermore, the SVM, GS–SVM and PSO–SVM are proposed to give prominence to the good performance of GS–PSO–SVM.
2. Experimental Setup and Data Processing
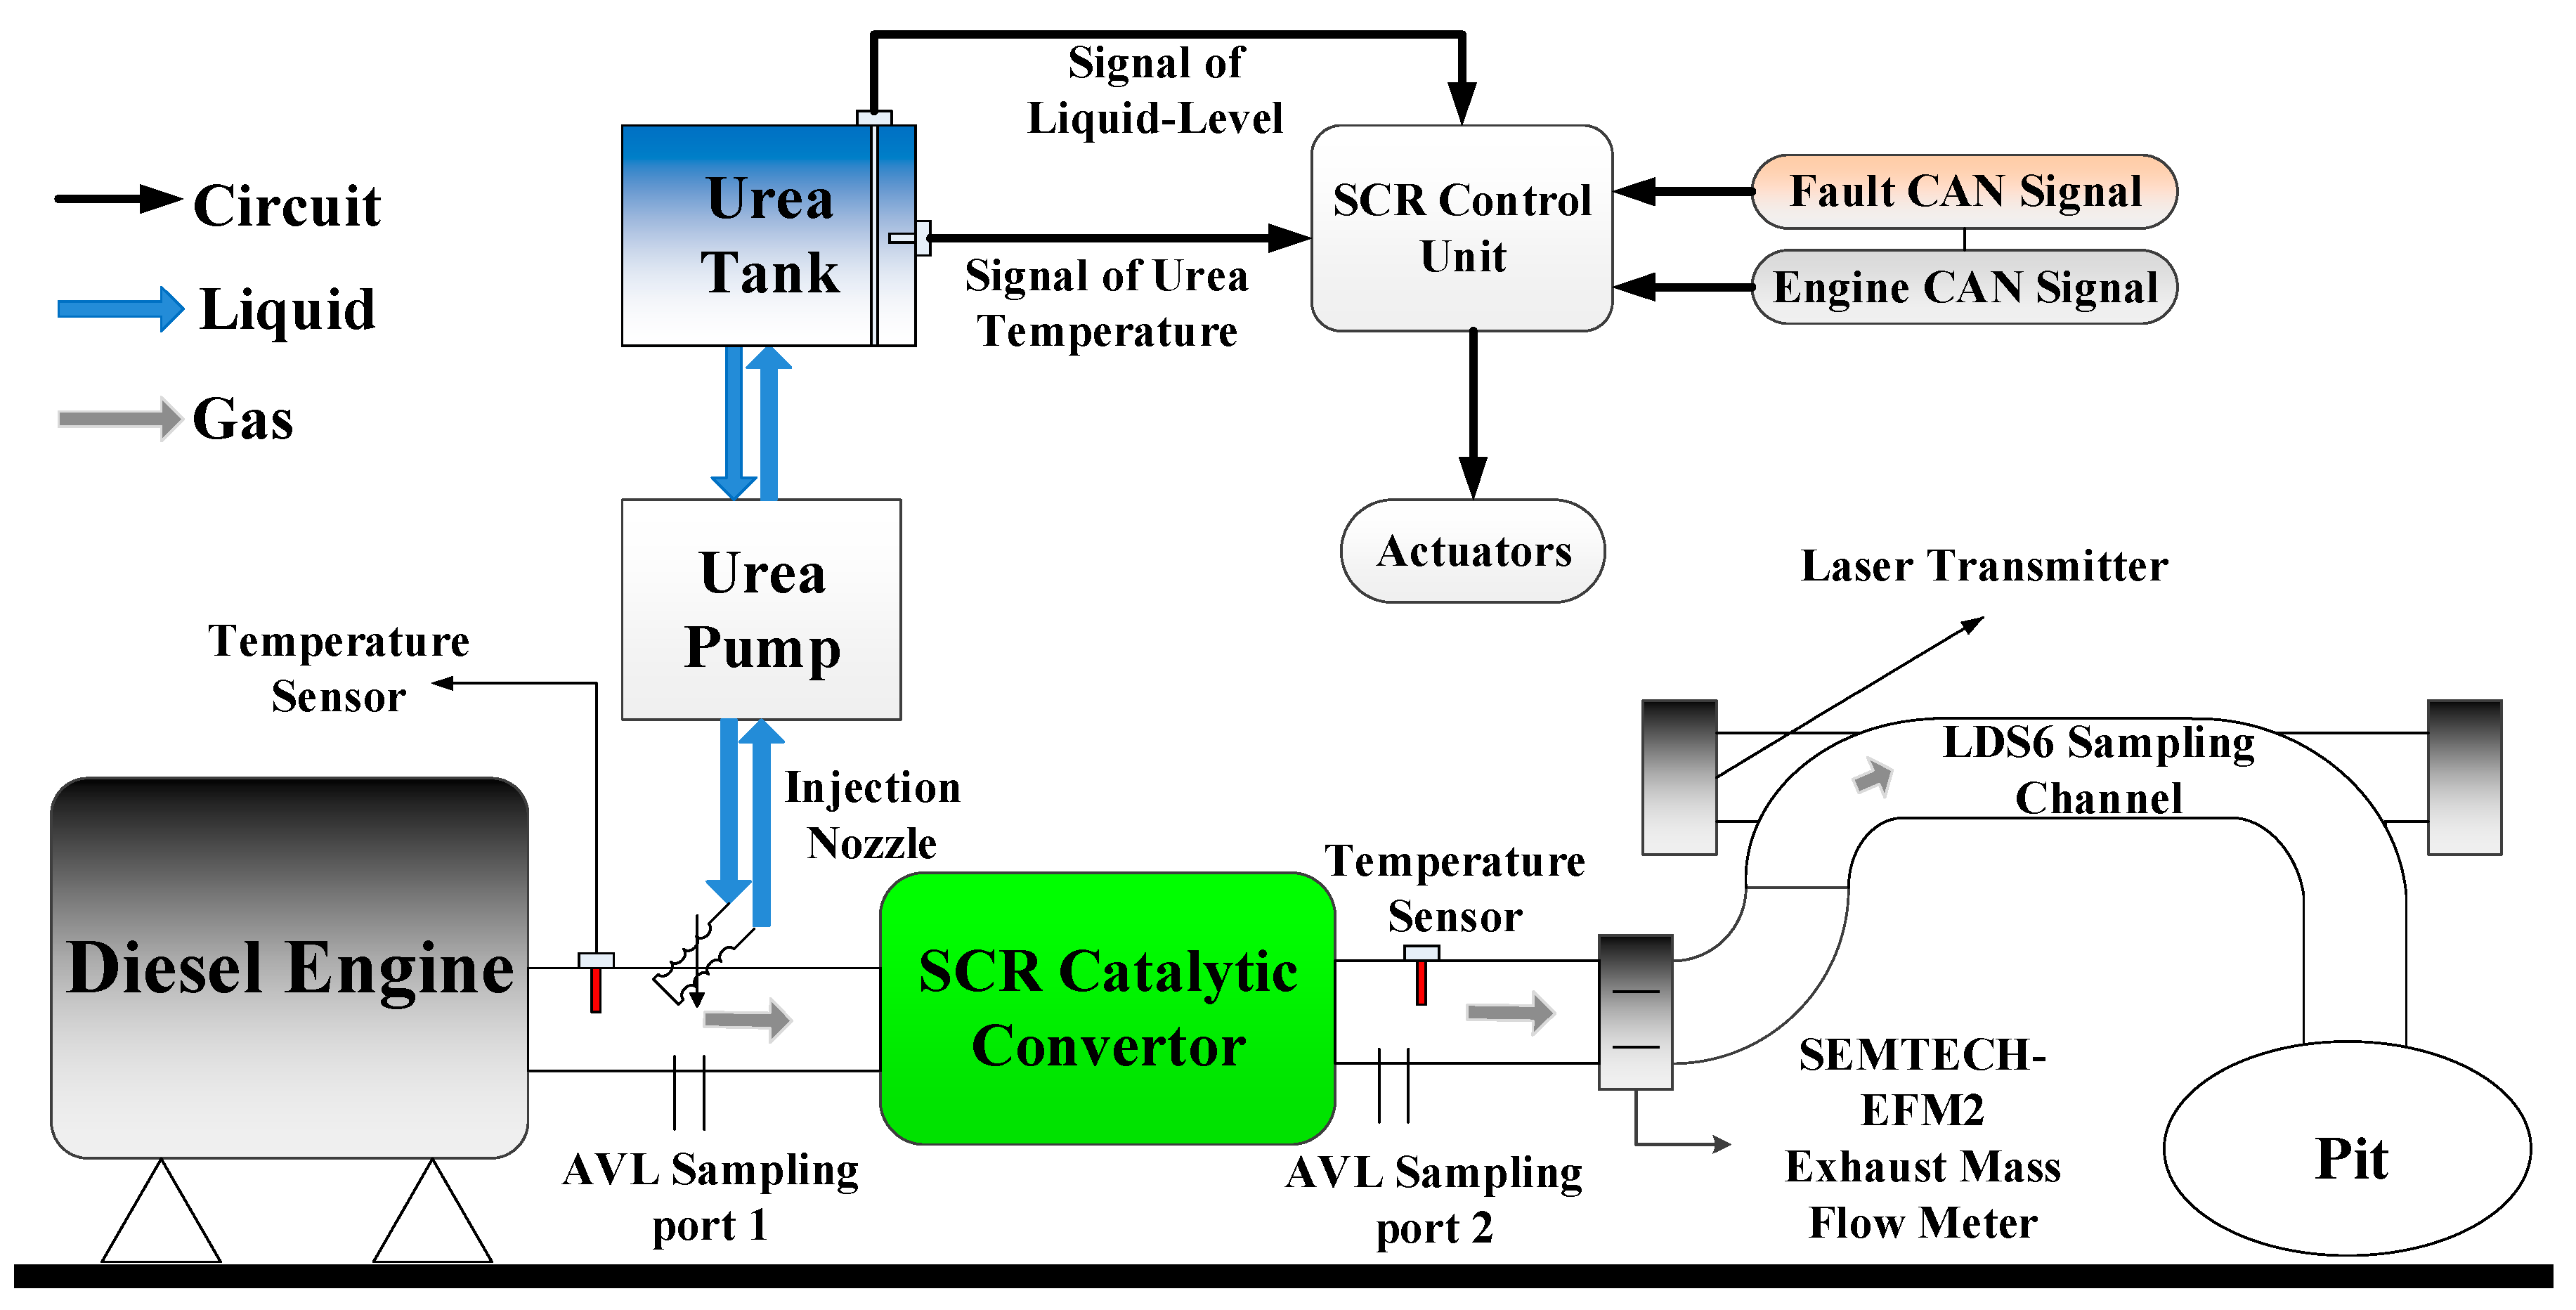
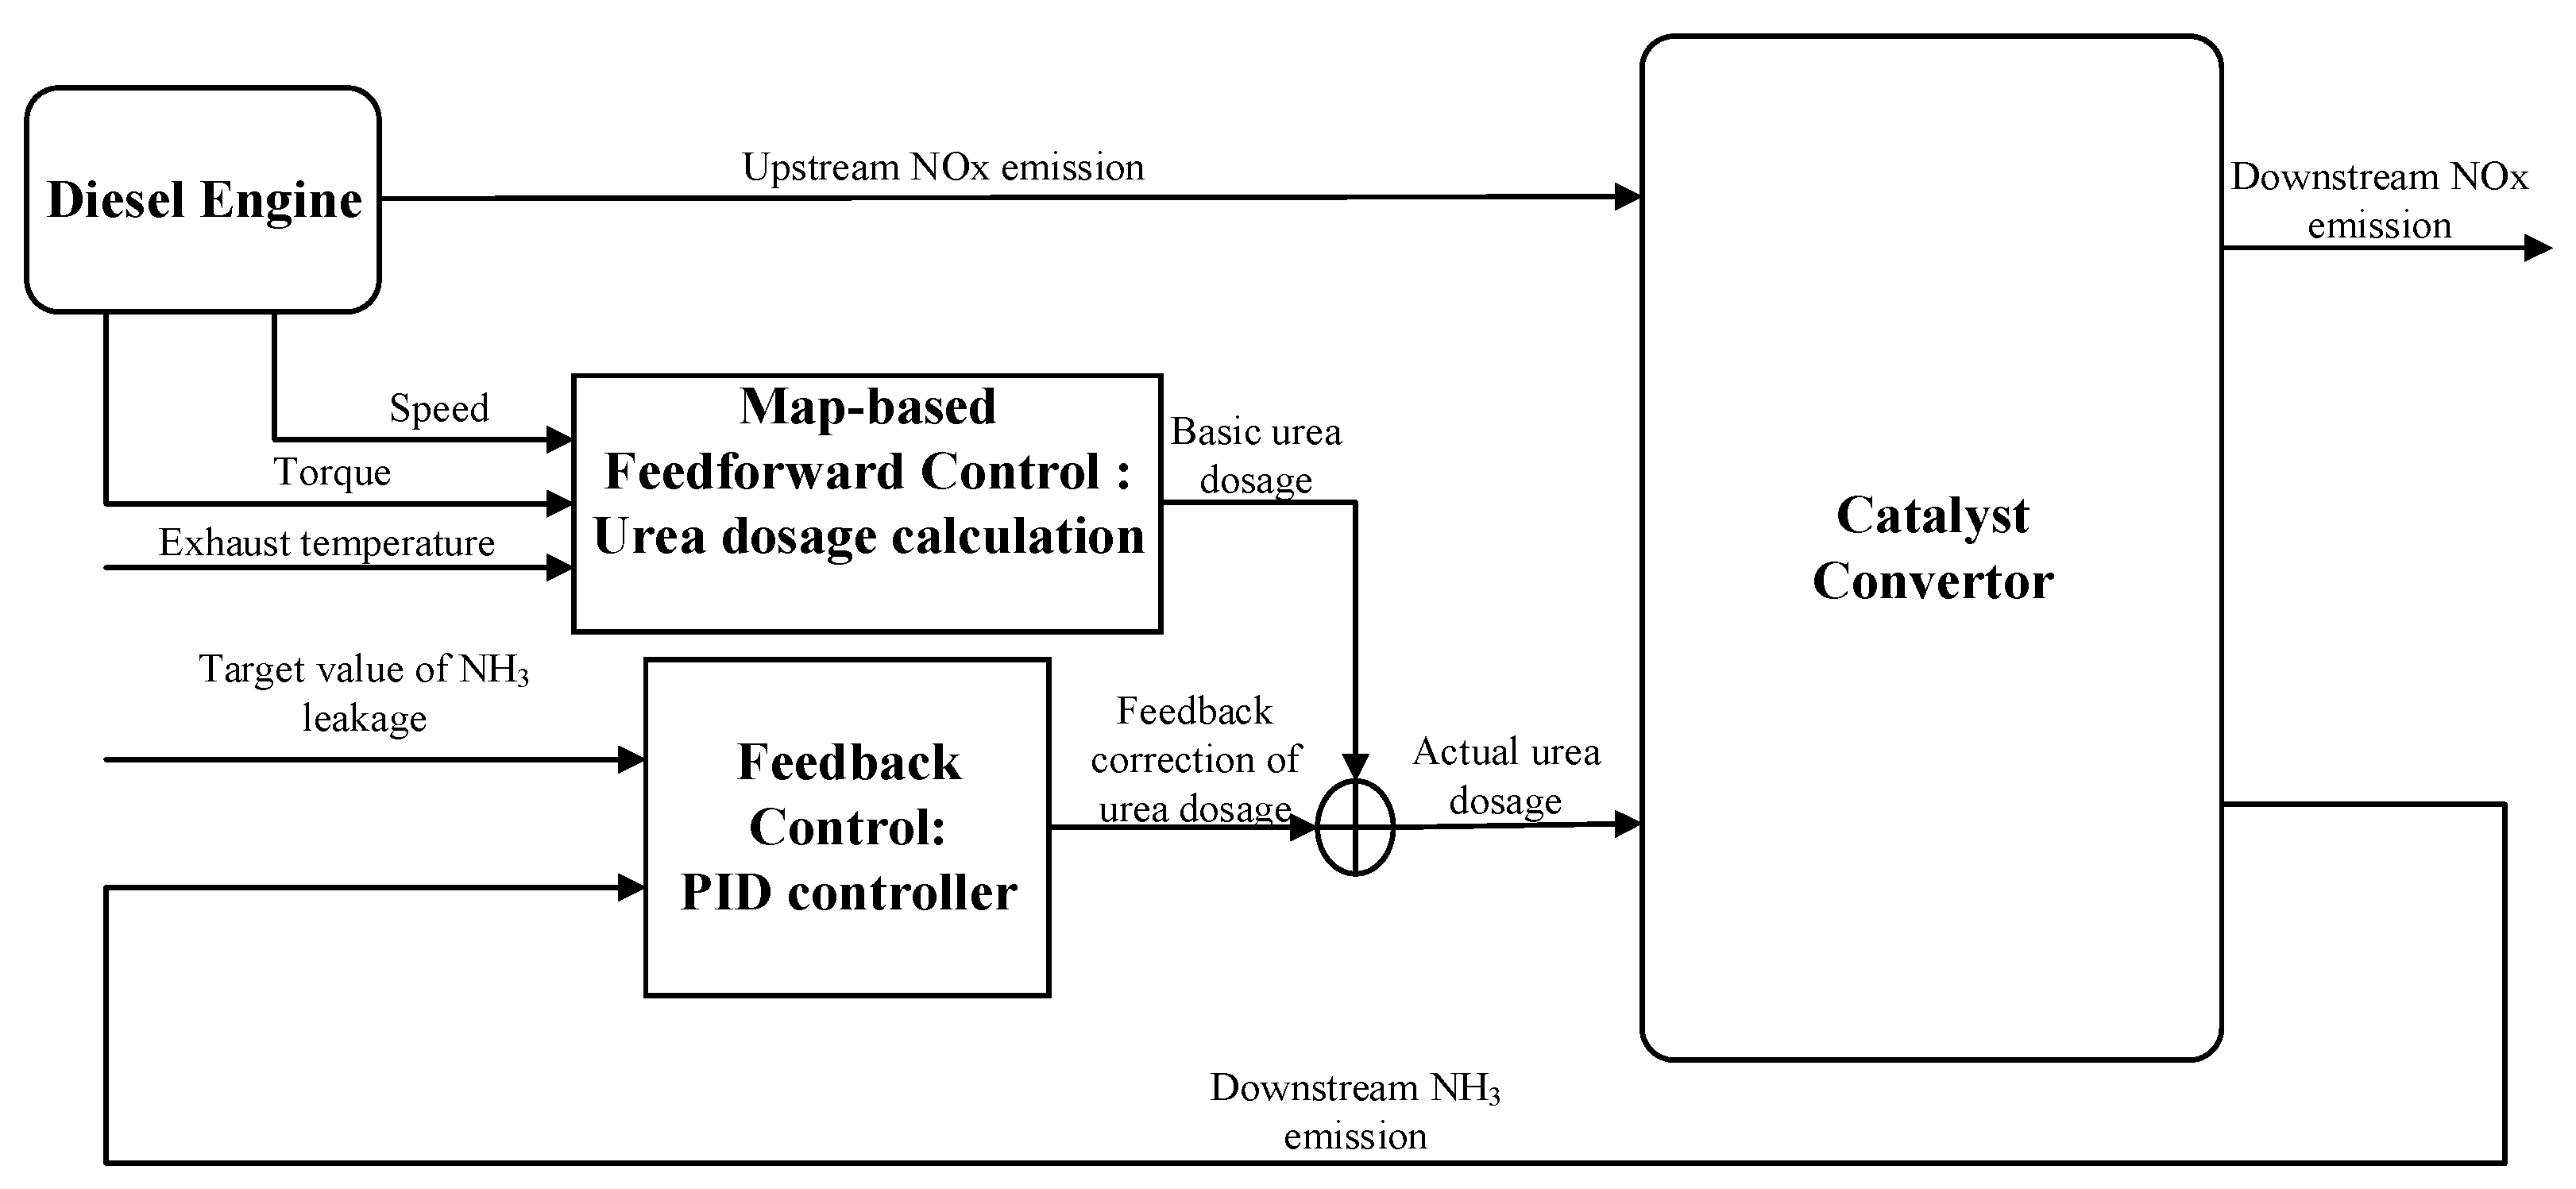
The schematic of the experimental setup is shown in Figure 1. The experimental setup mainly consists of an AVL PUMA OPEN test bench, 6-cylinder YC6J-42 diesel engine, a 13.5 L commercial V2O5–WO3/TiO2 catalyst (active phase V2O5–WO3/TiO2, cell density 400 cpsi, surface area 61.67 m2/g), the electronic control unit, the urea dosing control unit, and related measuring equipment. The main specifications of the diesel engine and the measuring equipment are presented in Table 1 and Table 2 respectively. Moreover, the test is on the basis of the NH3-based closed-loop control strategy (Figure 2), which can keep the NH3 leakage around a constant to improve the NOx conversion efficiency as far as possible. However, emissions regulations limit the mean NH3 leakage to under 10 ppm. Hence, to be conservative, the NH3 leakage is kept about 9 ppm in the NH3 closed-loop control strategy.
The test data was obtained by running the diesel engine on an AC electrical dynamometer. The after-treatment system is equipped with SEMTECH-EFM2, temperature sensors and AVL DiGas 4000 light and LDS6. SEMTECH-EFM2 was used to measure the exhaust mass flow. The temperature sensors and AVL DiGas 4000 light, which were used for measuring the exhaust temperature and NOx respectively, were located both upstream and downstream of the catalyst converter. Meanwhile, LDS6 ammonia analyzer was used for measurement of NH3 leakage at the tailpipe. In addition, other parameters, including urea dosage, fuel supply per cycle and etc., were obtained from the CAN bus directly.
Generally, there are some numerical discrepancies among the measurable variables mentioned above, which can be collected in the test. In order to eliminate the negative effect caused by the dimension difference among variables, the normalization of test data is conducted, which can be described as follow:
where is one of the original variables, and are the minimum and maximum in respectively. is one of the normalized variables, which varies from 0 to 1.
3. Modeling
3.1. SCR Modeling
In this section the main operating principle of the SCR system and related reactions will be described. Based on the mass conservation law of the major reactions, a SCR model is constructed to study of the performance of the SCR system with effects of aging.
3.1.1. SCR Operation Principles
The main operating principle of the urea–SCR system is described as follows [26]: (1) the urea is injected into the exhaust tailpipe; (2) the aqueous urea is decomposed into gaseous NH3 when temperature is suitable; (3) the gaseous NH3 is adsorbed on the catalyst site; (4) the adsorbed NH3 reacts with NOx to form N2 and H2O.
As mentioned above, after the urea-to-NH3 conversion process, the gaseous NH3 will be adsorbed on the catalyst site and the desorption of NH3 from the catalyst site will occur simultaneously [27]. This reversible reaction can be described by Reaction (2):
where represents the free catalyst sites.
Reaction (3) is regarded as the standard SCR reaction, since the reaction rate is relatively fast in a conventional V2O5/WO3–TiO2 SCR catalyst and NO makes up 90% of NOx emissions in typical diesel exhaust [29]. Meanwhile, Reaction (4) is known as the fast SCR reaction, in which the reaction rate is approximately 10 times faster than that of standard SCR reaction.
Meanwhile, NH3 will react with O2 in the catalyst converter, which will lead to more urea consumption. The major NH3 oxidation reaction can be described as follow [30]:
3.1.2. SCR Modeling
It’s well known that the SCR catalyst convertor is a complex chemical reactor. For simplifying the SCR model, the following assumptions are made [31,32]:
- The components of exhaust gasses are regarded as homogeneous and incompressible ideal gas.
- The effect of variations in the water and oxygen concentration of the exhaust gas is negligible.
- The catalyst convertor can be divided into limited cells along the flow axis.
- All variables are homogeneous in each cell and only vary in the axis of catalyst convertor.
- The dynamic of adsorption/desorption reaction rate is much slower than other reactions.
- Only adsorbed NH3 will be involved in NOx removal reaction.
According to Arrhenius law, the rate of the main reaction can be modeled by following equations:
- Adsorption reaction
- Desorption reaction
- SCR reaction
- NH3 oxidation reaction
For convenience, defining:
Based on the mass conservation law, the NOx mass conservation equation, NH3 mass conservation equation and NH3 storage conservation equation can be can be represented in the following form [31]:
Reference [32] reports that the dynamics of the storage of components in the exhaust gas have been observed to be much faster than those of the storage of adsorbed NH3. Hence, the dynamic description of NOx and NH3 can be replaced by static elements. The simplified NOx and NH3 mass conservation equations are represented below. Meanwhile, in this study, the SCR is split into two cells because of its great balance between model complexity and model quality.
Based on the SCR model established above, the SCR aging effect model can be established as well to investigate the effect of a hydrothermally aged catalyst on SCR performance. There is no doubt that the NOx reduction activity of the SCR catalyst will significantly decrease after hydrothermal treatment [16,17,18,19,20]. NOx reduction activity of the SCR catalyst is a crucial index that can evaluate the degree of hydrothermal aging of the SCR catalyst. Obviously, the activity of the SCR reaction is the main factor that affects NOx conversion efficiency. Thus, the SCR reaction rate () is selected to reflect the degree of hydrothermal aging of the SCR catalyst in this paper and the aging factor (α) can be defined as below. Simultaneously, the SCR aging model can be described by Equation (15).
3.2. SVM Modeling and Optimization Method
As mentioned in Section 1, the support vector machine (SVM) is used in this study to diagnose the degree of aging of the catalyst. As an advanced machine learning method, SVM is widely used due to its remarkable features. A brief description of SVM theory is given next, and more details can be found in reference [33].
A support vector machine takes advantage of the kernel function to map the input data onto a high-dimensional feature space [34]. Therefore, the non-linear classification issue can be converted into a linear classification issue through non-linear feature mapping. After it has been trained by data samples, the SVM classifiers can be used to diagnose the degree of aging of a catalyst according to the measurable variables mentioned in Section 2.
The final optimal classification function used by SVM is:
where is the Lagrange multiplier, and is a feature vector corresponding to a training object. The element of feature vector and the constant b will be updated during the process of training. C is a penalty factor which indicates the degree of attention paid to outliers and determines the range of . is the kernel function, which mainly have four species. Among them, the Gaussian radial basis function is the most commonly used kernel function owing to its high efficiency in the modeling process.
The Gaussian radial basis function is:
where g is the parameter of the kernel function, which is as important as the penalty factor C. In addition, x and represent independent variables.
Based on the preceding discussion, there is no doubt that g and C are vital parameters in the SVM model, the selection of which can directly affect the performance of the SVM model. Hence, a multi-algorithm combined method is put forward to optimize the model parameters in this study.
Particulate swarm optimization (PSO) is a population-based stochastic optimization algorithm, which is initialized with a group of random particles and then searches for an optimum by updating the generations [35]. At each generation, each particle is updated by the personal best value (Pbest) and global best value (Gbest). The personal best value is the best solution obtained so far and the global best value is the best value gained so far by any particle in whole population. After that, the velocity and the position of a particle may be updated [35], which are calculated as follows:
where is the position of a particle and is the velocity of a particle. w (set as 1) is the inertia weight, which controls the effect of the previous particle’s velocity on the current one. and (set as 1.6 and 1.5 respectively) are the cognitive learning factor and social learning factor respectively, which are both defined as positive constants generally. represents the attraction for a particle that approaches toward its own success; represents attraction for a particle that moves toward the best of its neighbors. In addition, and are random number between 0 and 1, which are used to keep away from getting into the local optima [36].
Due to the high efficiency of the PSO algorithm in solving the optimization problem, it has been used to optimize the parameters (C and g) in the SVM model. Moreover, the k-fold cross-validated classification accuracy is selected as the fitness for PSO to verify the classification accuracy in the SVM model. The main objective of PSO is searching for the optimal C and g for the SVM model to achieve the maxima of the k-fold cross-validated classification accuracy of the training data. But, first of all, the ranges of each parameter need to be determined, which are almost set empirically so far. If the ranges are too wide, the optimization process may consume too much time. On the contrary, if the ranges are too narrow, the optimal parameters may be out of the ranges. Hence, a grid search is proposed to roughly determine the scope of parameters for the SVM model.
The procedure for optimizing the parameters for the SVM model by grid search and PSO was presented as follow:
Step 1: Grid search in the range of C [2−5, 215] and g [2−10, 210] is conducted according to the exponential sequences. The k-fold cross-validated classification accuracy of the training data for all pairs of C and g is evaluated for the SVM model, the rough scope of parameters for the SVM will be determined.
Step 2: A two-dimensional random initial population is created with each dimension representing C and g respectively. Additionally, the particles’ position and velocity are initialized as well.
Step 3: The fitness (the k-fold cross-validated classification accuracy of the training data) value of all populations is calculated, and then the personal best value and global best value at present are obtained.
Step 4: Based on the fitness level, the position and velocity of particles are updated to approach toward the optimal particle.
Step 5: Step 3 and Step 4 are repeated over and over again until one of the stopping criteria (obtaining a good enough fitness or reaching the maximal generation) is satisfied.
After these steps, the optimal parameters for the SVM model are obtained, which implies that the training process of the SVM model is completed.
4. Results and Discussion
4.1. SCR Model Validation
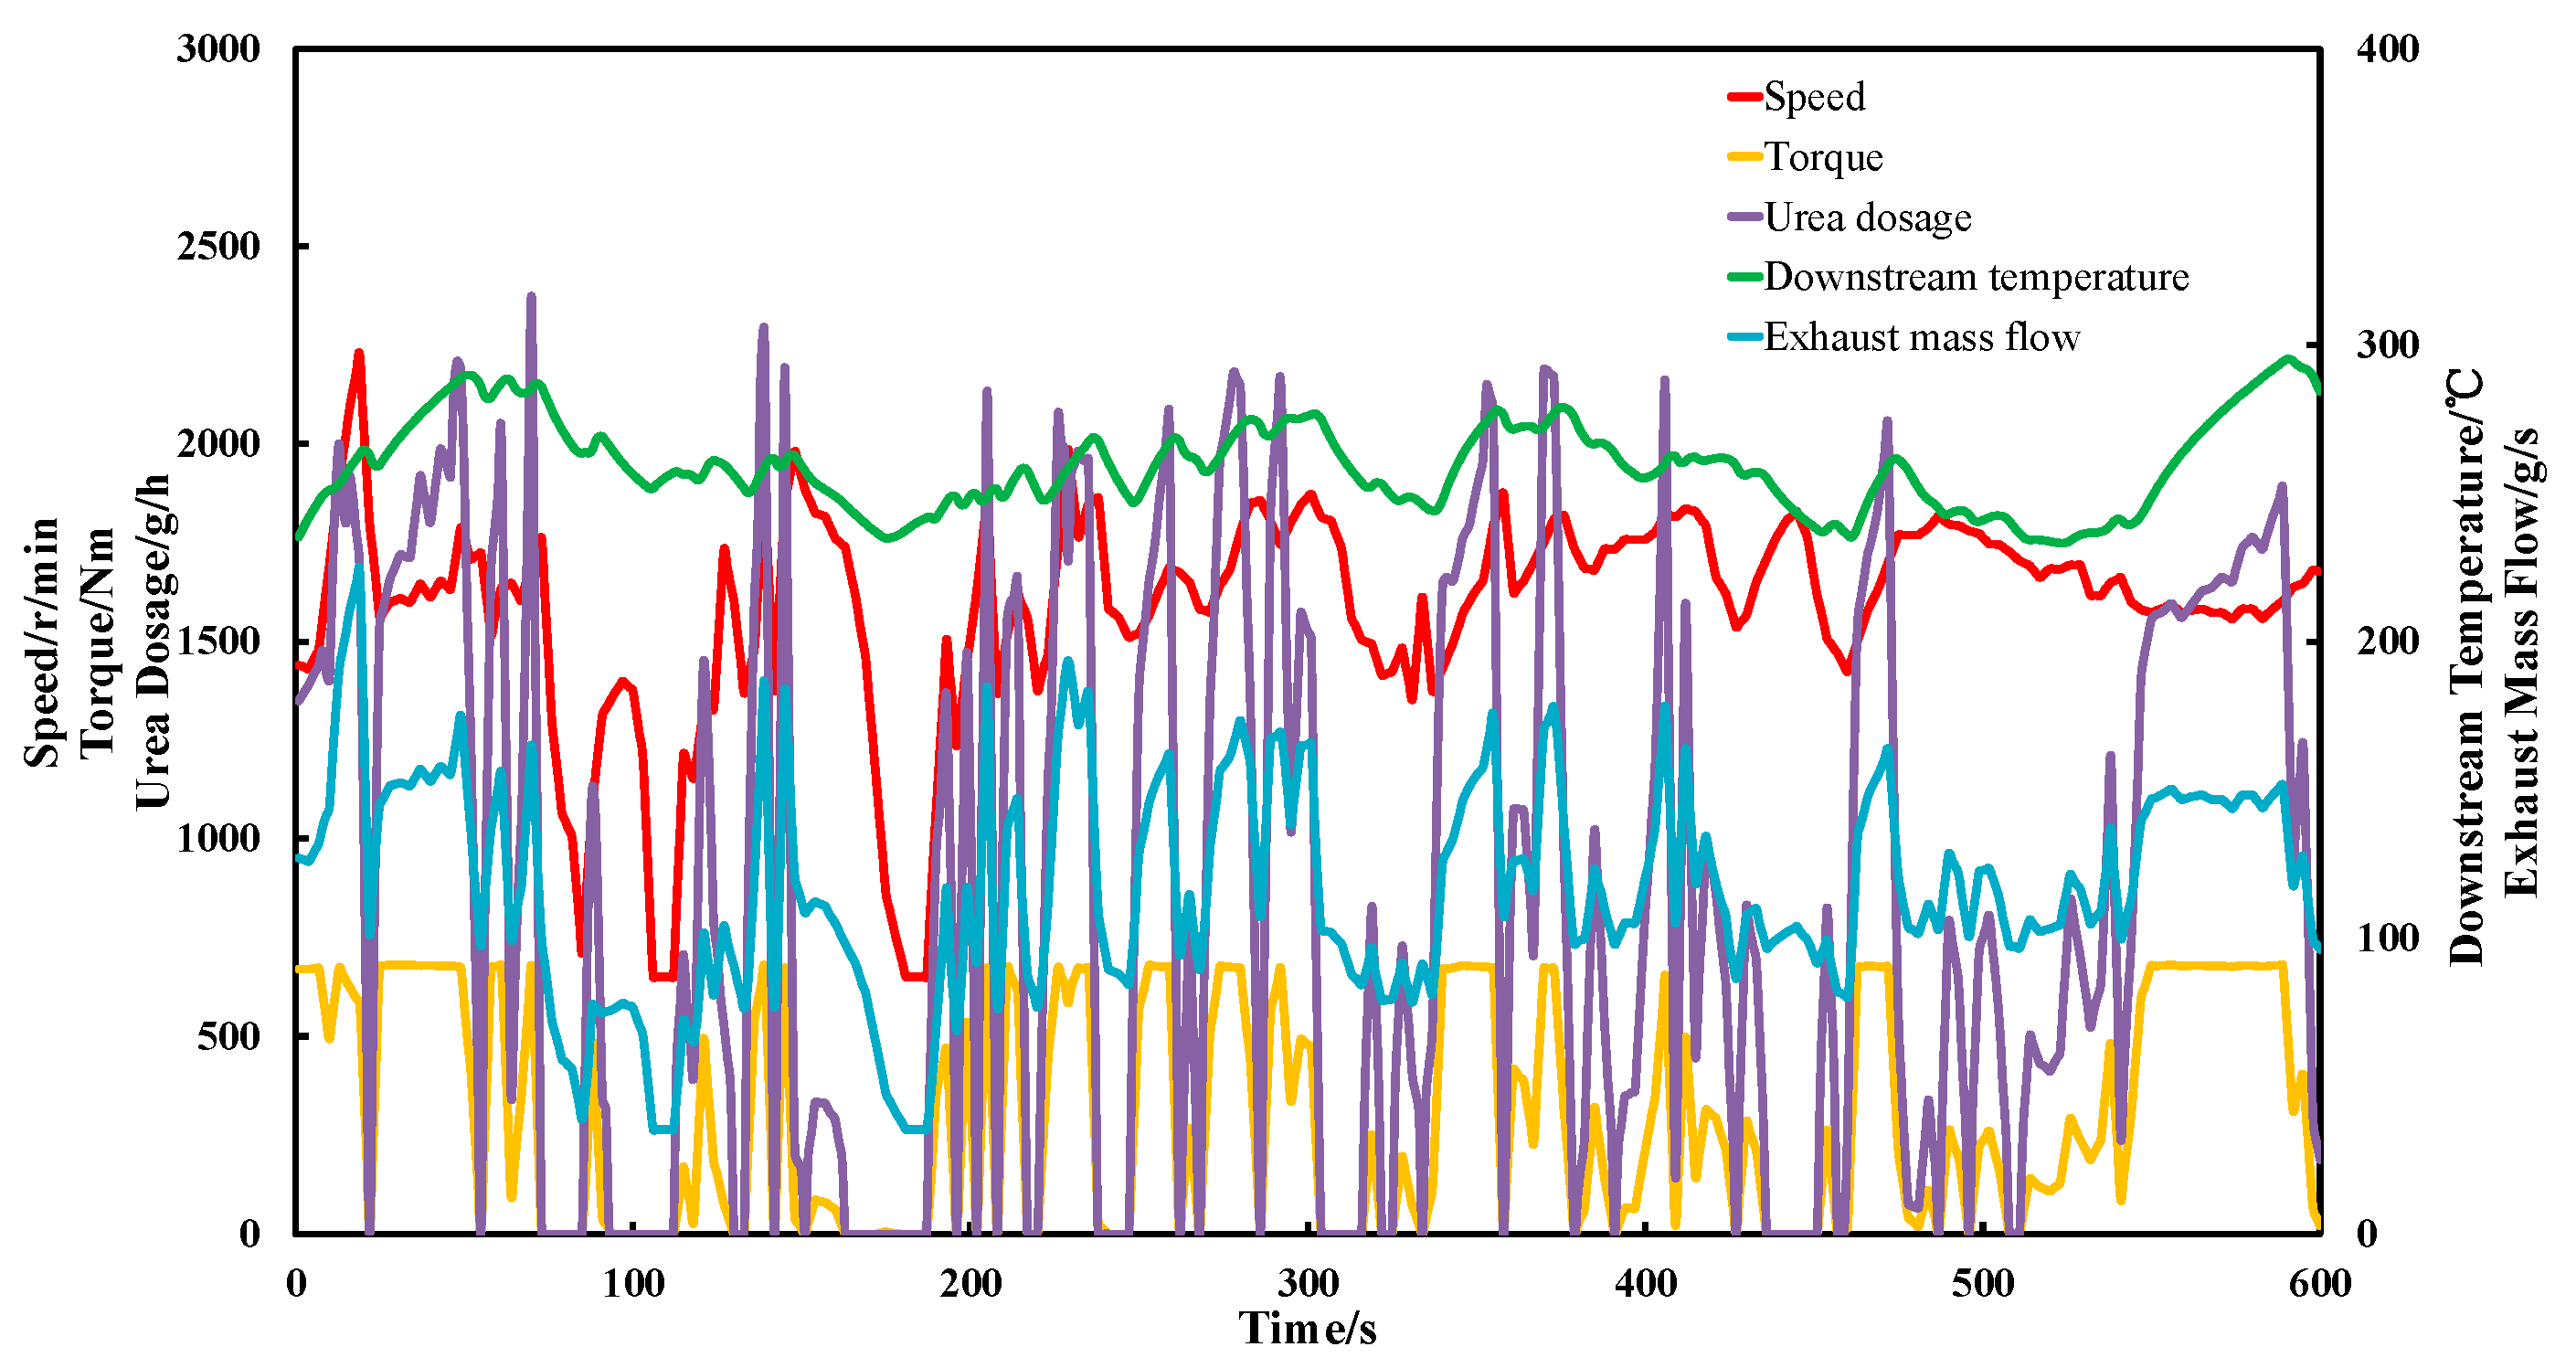
For the sake of verifying the SCR model, a transient state test of the diesel engine was conducted. This transient state test cycle, which is proposed on the basis of standard ETC (European Transient Cycle), contains both urban and suburban driving cycles. Owing to the fact that the operating condition of an engine in these two driving cycles will fluctuate wildly, it is difficult to predict the NOx and NH3 emission in such transient condition of engine. Hence, the prediction ability of the SCR model can be validated convincingly under the proposed transient state test cycle. Figure 3 shows the speed and torque in the transient state test. Furthermore, some major variables including exhaust mass flow, urea dosage, NOx emission upstream of the catalyst convertor, and temperature at the outlet of the catalyst convertor are illustrated in Figure 3 as well.
A comparison between the experimental and simulation results for NOx and NH3 concentration at the tailpipe is given in Figure 4. The simulation results can roughly match the experimental results, and the mean relative prediction error of NOx emission is 65% as shown in Figure 4a. It can be found, however, that the relative prediction errors of NOx emission at a few operating conditions, which only made up 9% of the total, are more than 100%. Apart from these large relative prediction errors, the mean relative prediction error of NOx emission is only 17.8%. As shown in Figure 4b, the SCR model can roughly predict NH3 leakage, and its mean relative prediction error is 11.2%. Overall, prediction errors of NOx and NH3 emission by the SCR model are relatively large due to the following reasons: (1) For ease of modeling several assumptions were proposed to simplify the SCR model, which will lead to prediction errors; (2) The operating conditions fluctuate violently over a period of time, which may cause the emissions to be unstable and difficult to predict.
In conclusion, the mean relative prediction error of NOx and NH3 emissions is a little bit large, but fortunately the trend of NOx and NH3 emissions in the simulation corresponds to that in the experiment. Therefore, this SCR model can be used to research the effect of aging on the performance of the SCR catalyst.
4.2. Simulation Study
4.2.1. Effect of Aging on SCR Performance
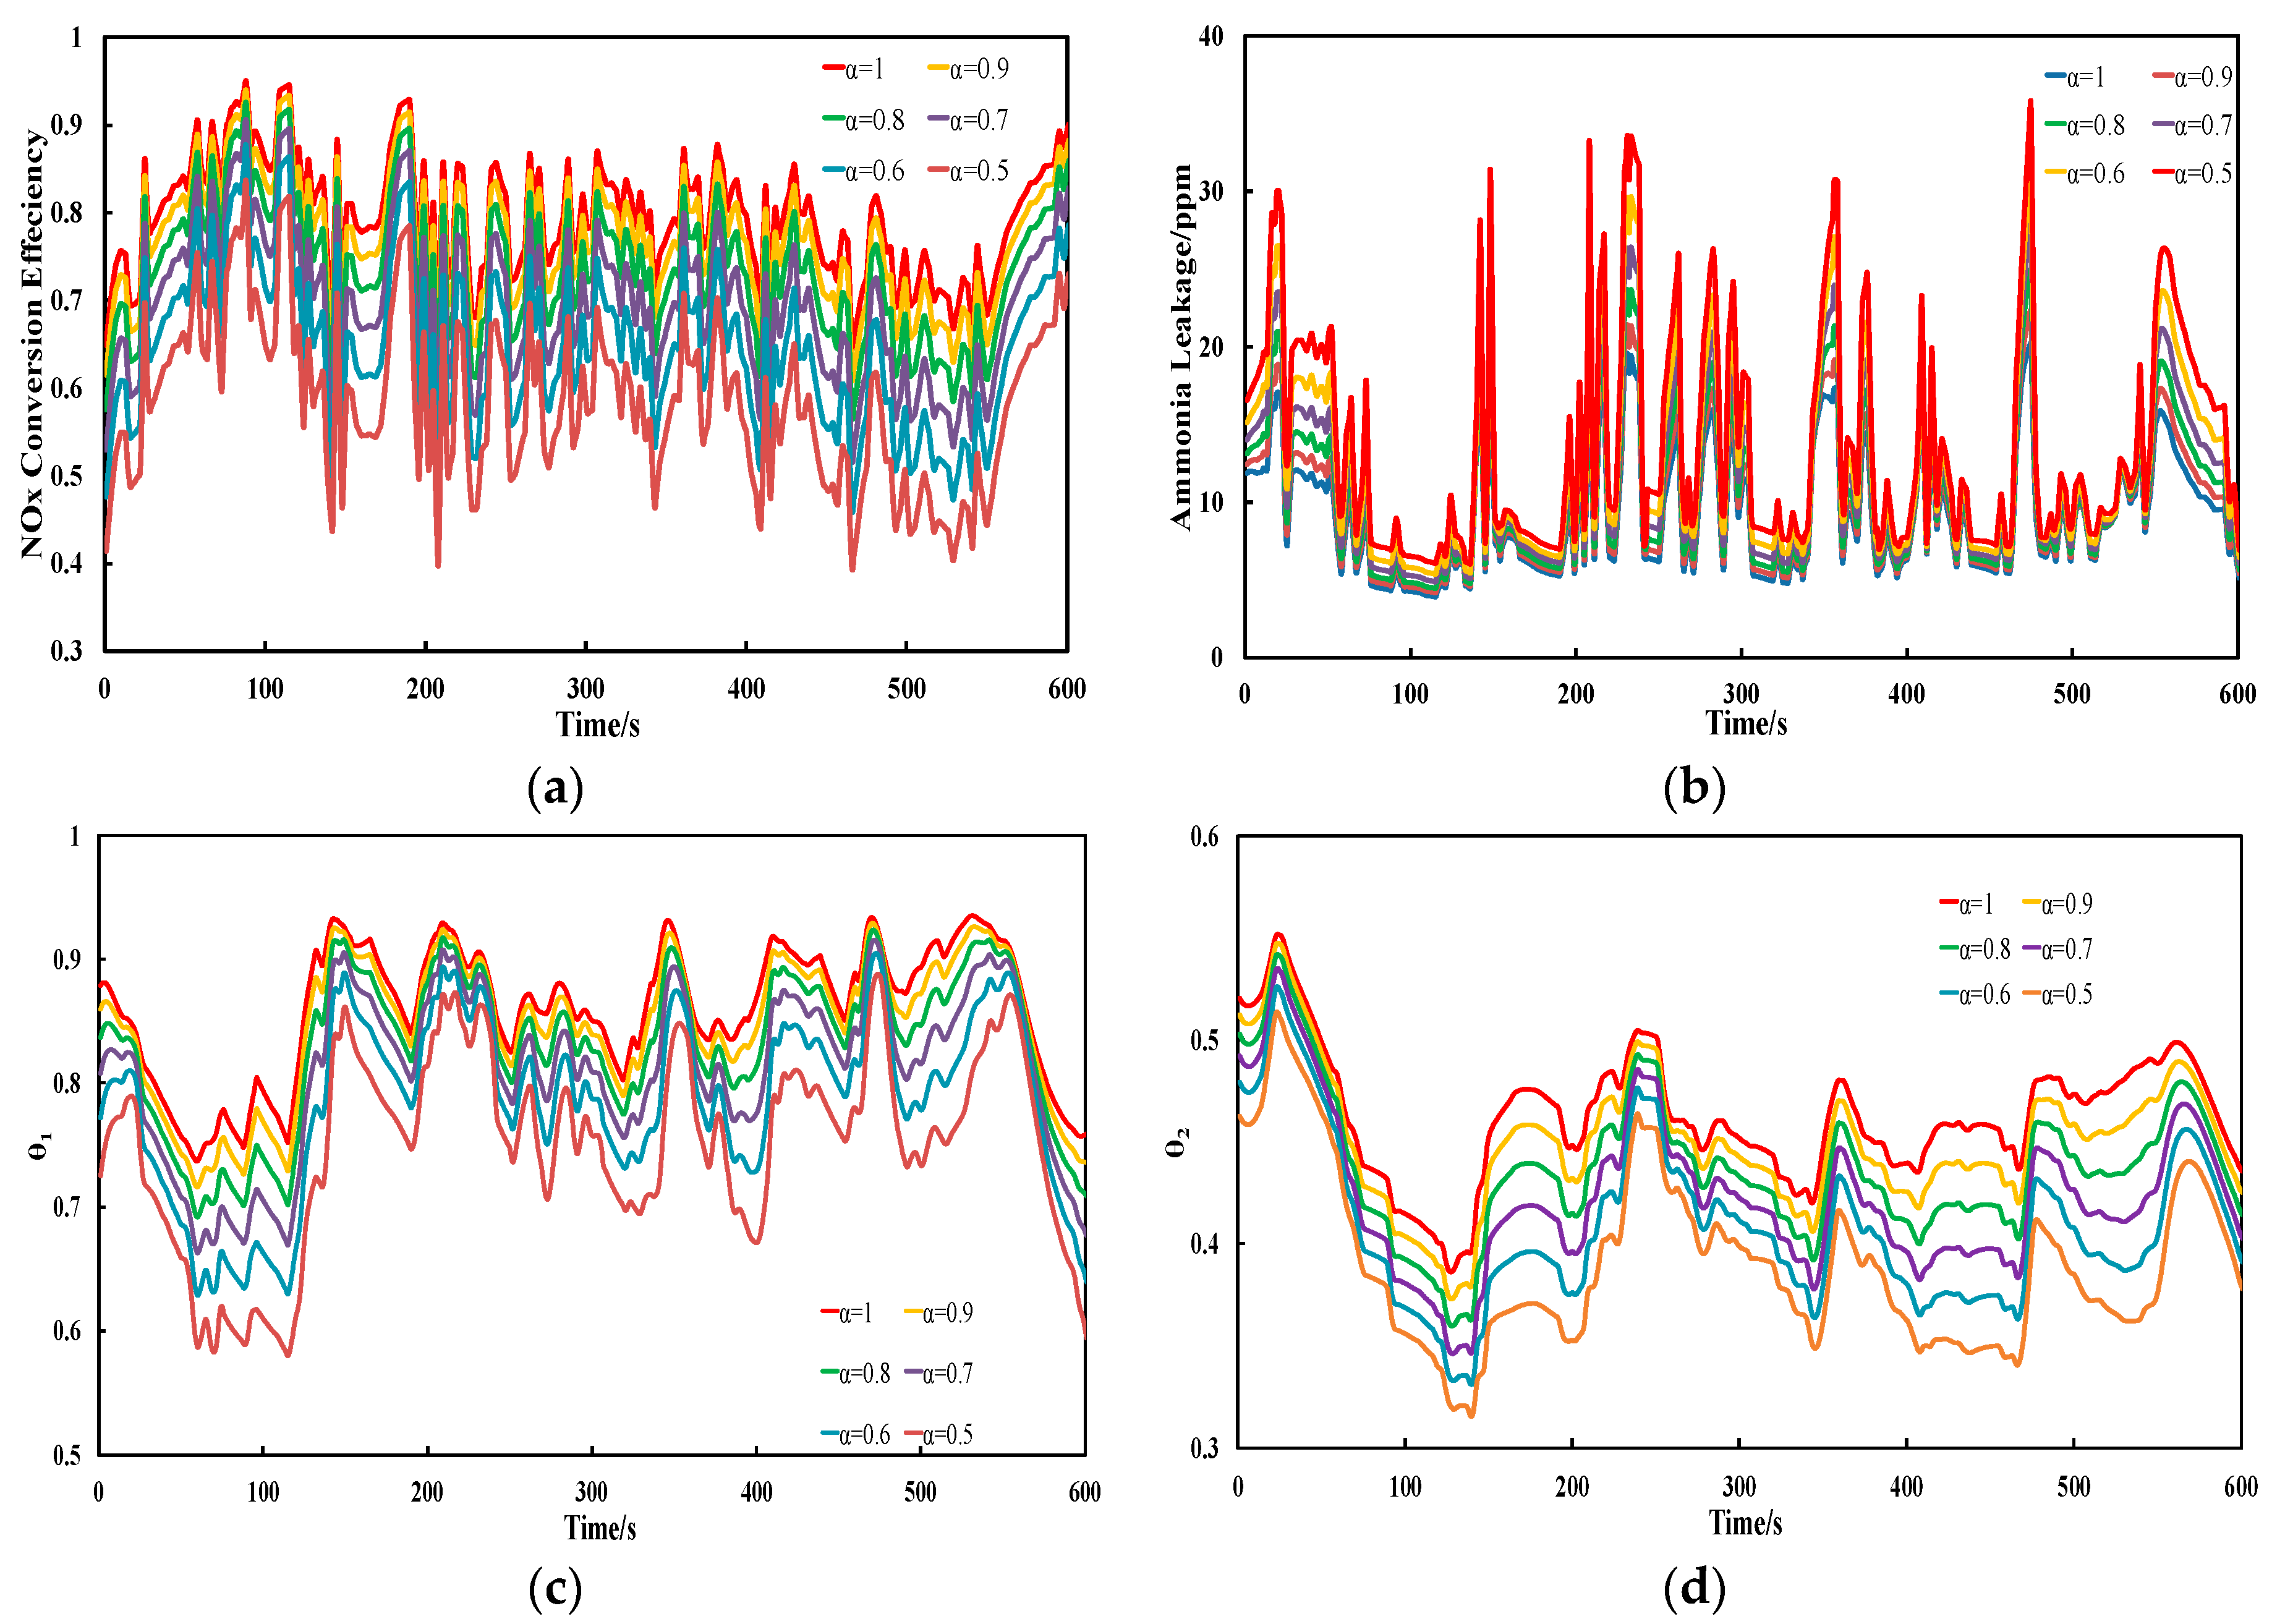
In order to investigate SCR performance of the V2O5/WO3–TiO2 catalyst under different degrees of aging, NOx concentration and NH3 leakage at the tailpipe, as well as NH3 coverage ratio, were simulated in different aging factors by Matlab/Simulink. Figure 5 indicates the SCR performance at different degrees of aging, which range from 0.5 to 1 at a step of 0.1. It is evident that the NOx conversion efficiency decreases with the decrease of α, as shown in Figure 5a. The mean NOx conversion efficiency at different aging factors is presented in Table 3. It can be found that the mean NOx conversion efficiency decreases faster with the aging of the catalyst. This may be due to the specific surface area of the catalyst decreasing faster with the aging of the catalyst, which will lead to faster reduction of surface density of vanadyl species. As shown in Figure 5b, it is obvious that the overall NH3 leakage increases with aging. Additionally, the evaluation indexes of NH3 leakage are shown in Table 3 as well. It can be found that the mean NH3 leakage and peak NH3 leakage increase with decreasing the aging factor. Due to emissions legislation which limits NH3 leakage and peak NH3 leakage to 10 and 25 ppm respectively, it is evident that NH3 emissions cannot meet the emissions regulations when the aging factor is less than 0.8. Moreover, the variance of NH3 leakage increases with the reduction of the aging factor as well; that is, the aging of the catalyst will make the closed-loop control system unstable. As shown in Figure 5c,d, θ1 is greater than θ2 totally, that is, NH3 is mainly stored at the first cell of catalyst. Meanwhile, with the aging of the catalyst, θ1 decreases larger and faster, but, in contrast, the variation of θ2 is not obvious relatively. It may be due to the fact that hydrothermal aging has a major effect on the first cell of the catalyst and a minor effect on the second cell of the catalyst.
4.2.2. Diagnosis of Aging of the Catalyst
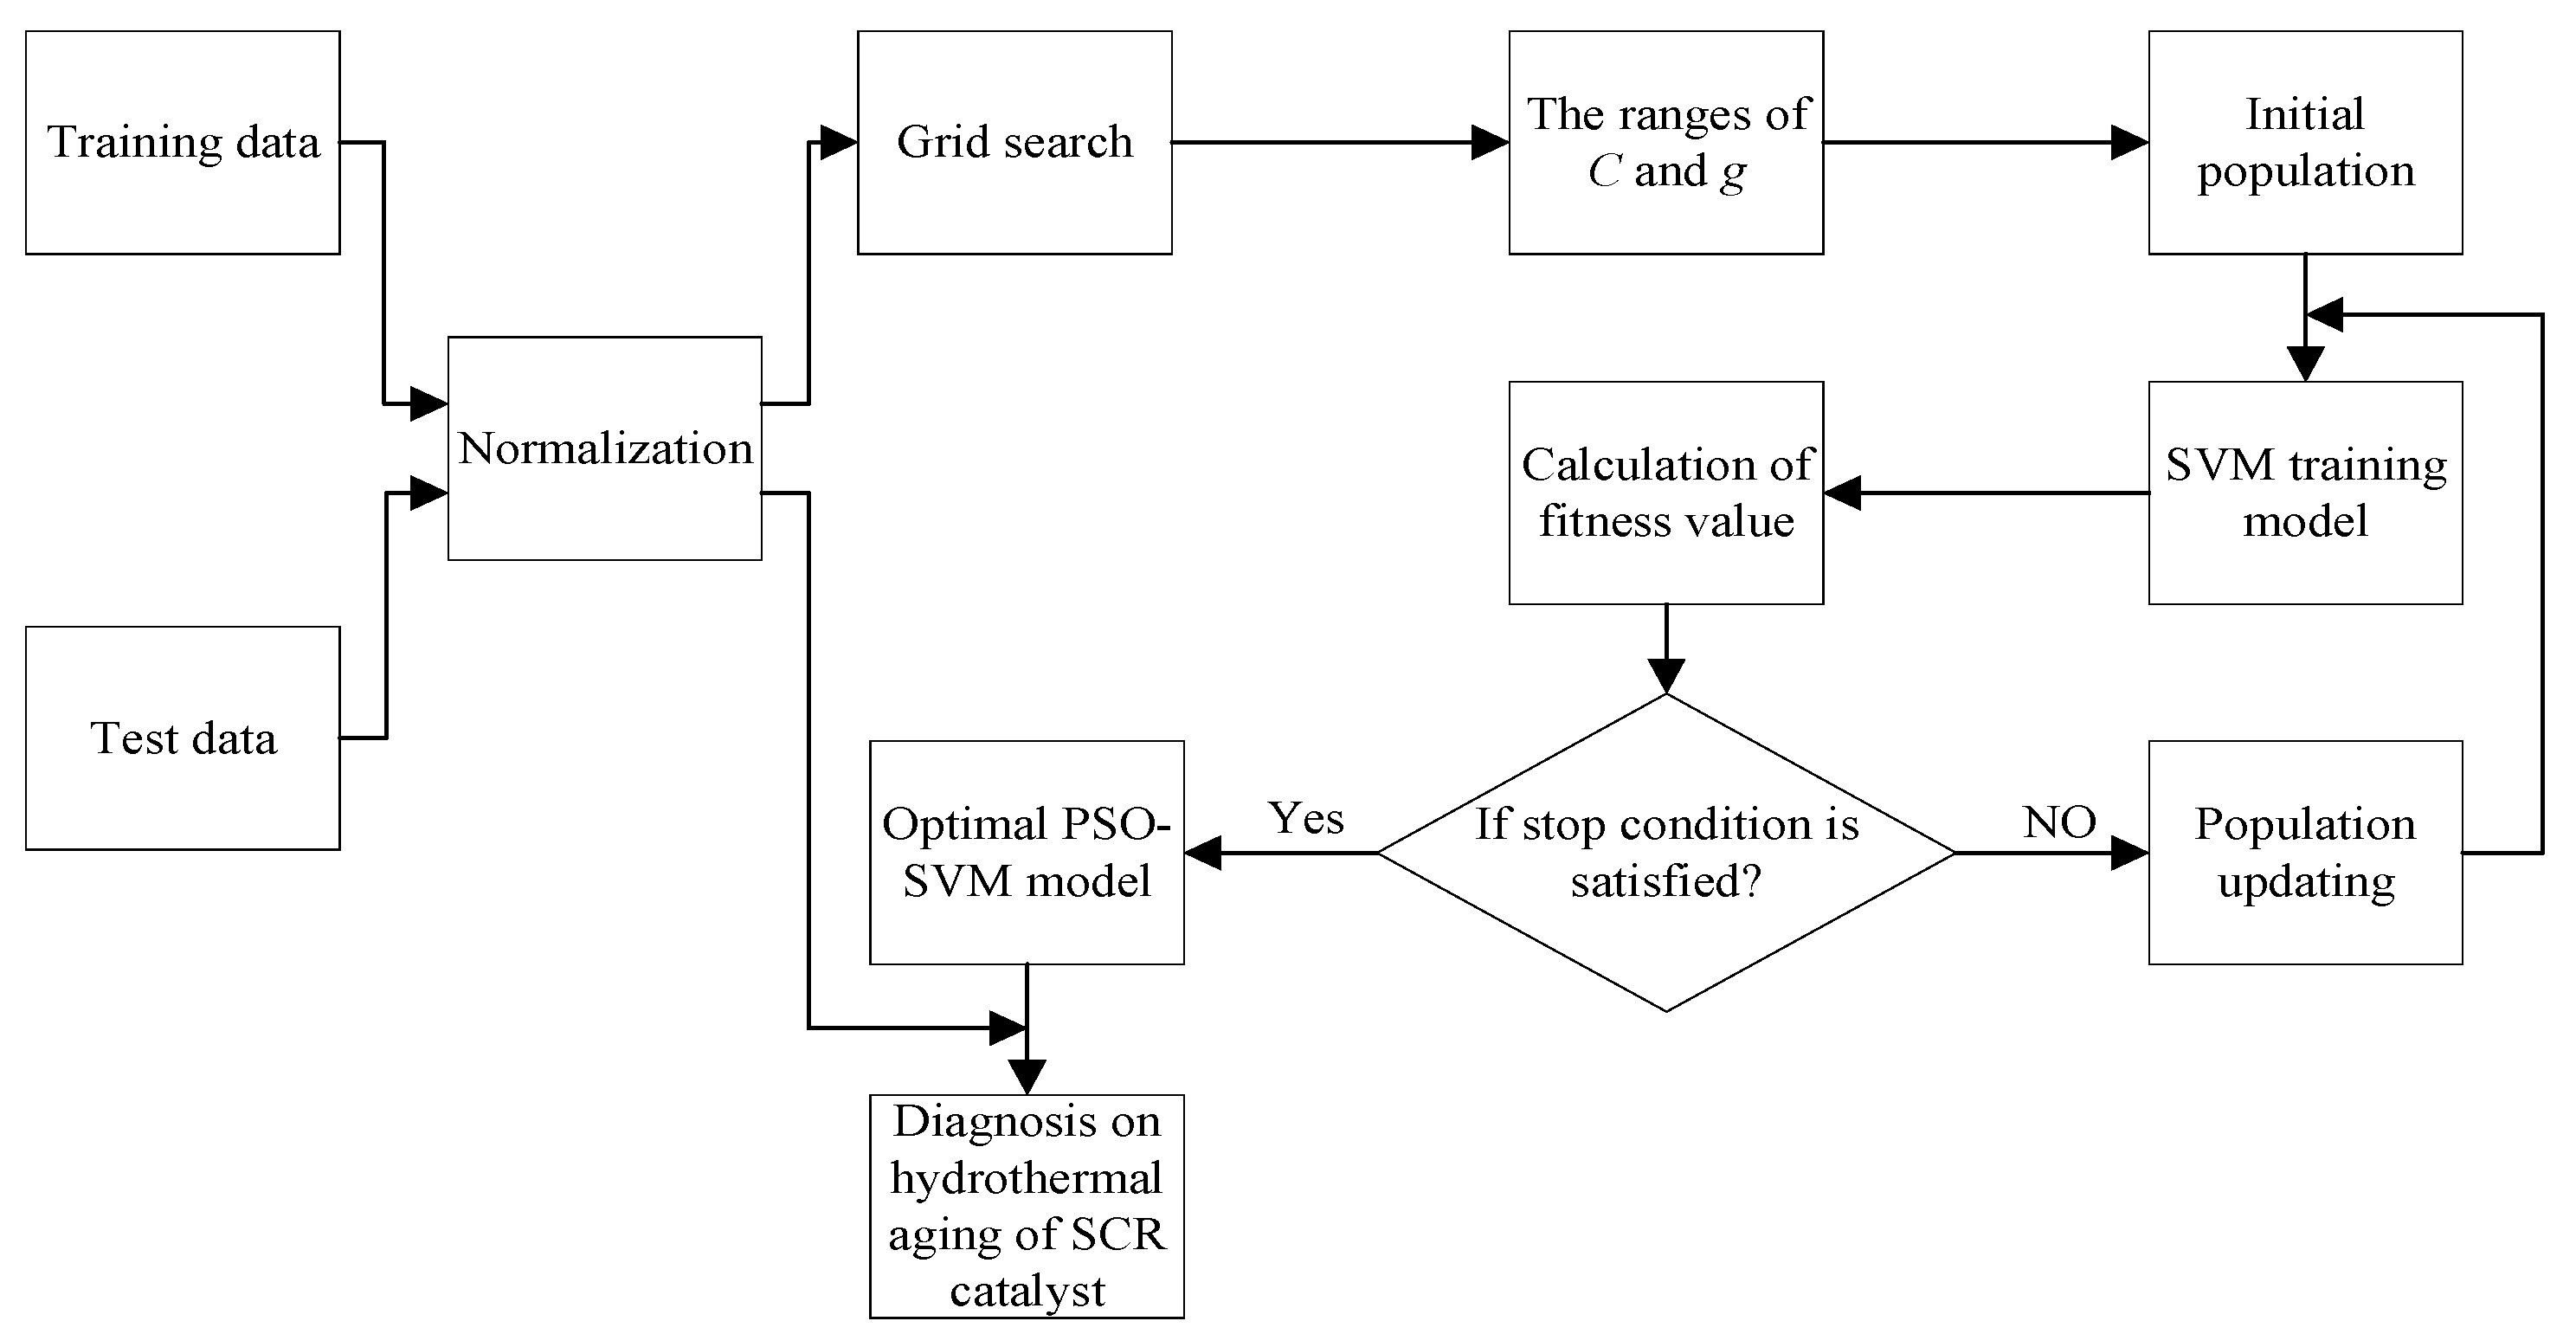
As discussed above, aging of the catalyst has a significant effect on SCR performance. Accurate identification of the degree of aging of the catalyst will contribute to fault tolerance of SCR control system or replacement of an aged catalyst. Hence, GS–PSO–SVM is utilized to diagnose the degree of aging of the catalyst. According to the procedures of SVM modeling and optimization, the first half of data samples and the second half of data samples (including urea dosage, NOx conversion efficiency, NH3 leakage, exhaust mass flow, upstream NOx concentration, and downstream temperature) at each aging factor (0.5 to 1 at step of 0.1) are selected as the training data and the test data respectively. Figure 6 shows the flow chart of processes for designing the GS–PSO–SVM model.
Figure 7 illustrates the rough selection results of the main parameters in a SVM classifier (C and g) through the GS method. It is obvious that in the range of C [24, 211] and g [2−1, 23], as well as C [210, 214] and g [20, 22], the classification accuracy of training data samples can be more than 98%; that is, the optimal c and g are probably to be located within these two ranges. Hence, as in the procedure mentioned above, the PSO algorithm is utilized to search precisely in the range of C [24, 211] and g [2−1, 23], as well as C [210, 214] and g [20, 22]. Then, the optimal c and g, which are obtained through PSO, will be applied in the SVM model to verify the diagnosis effect on hydrothermal aging of the SCR catalyst by testing the data samples.
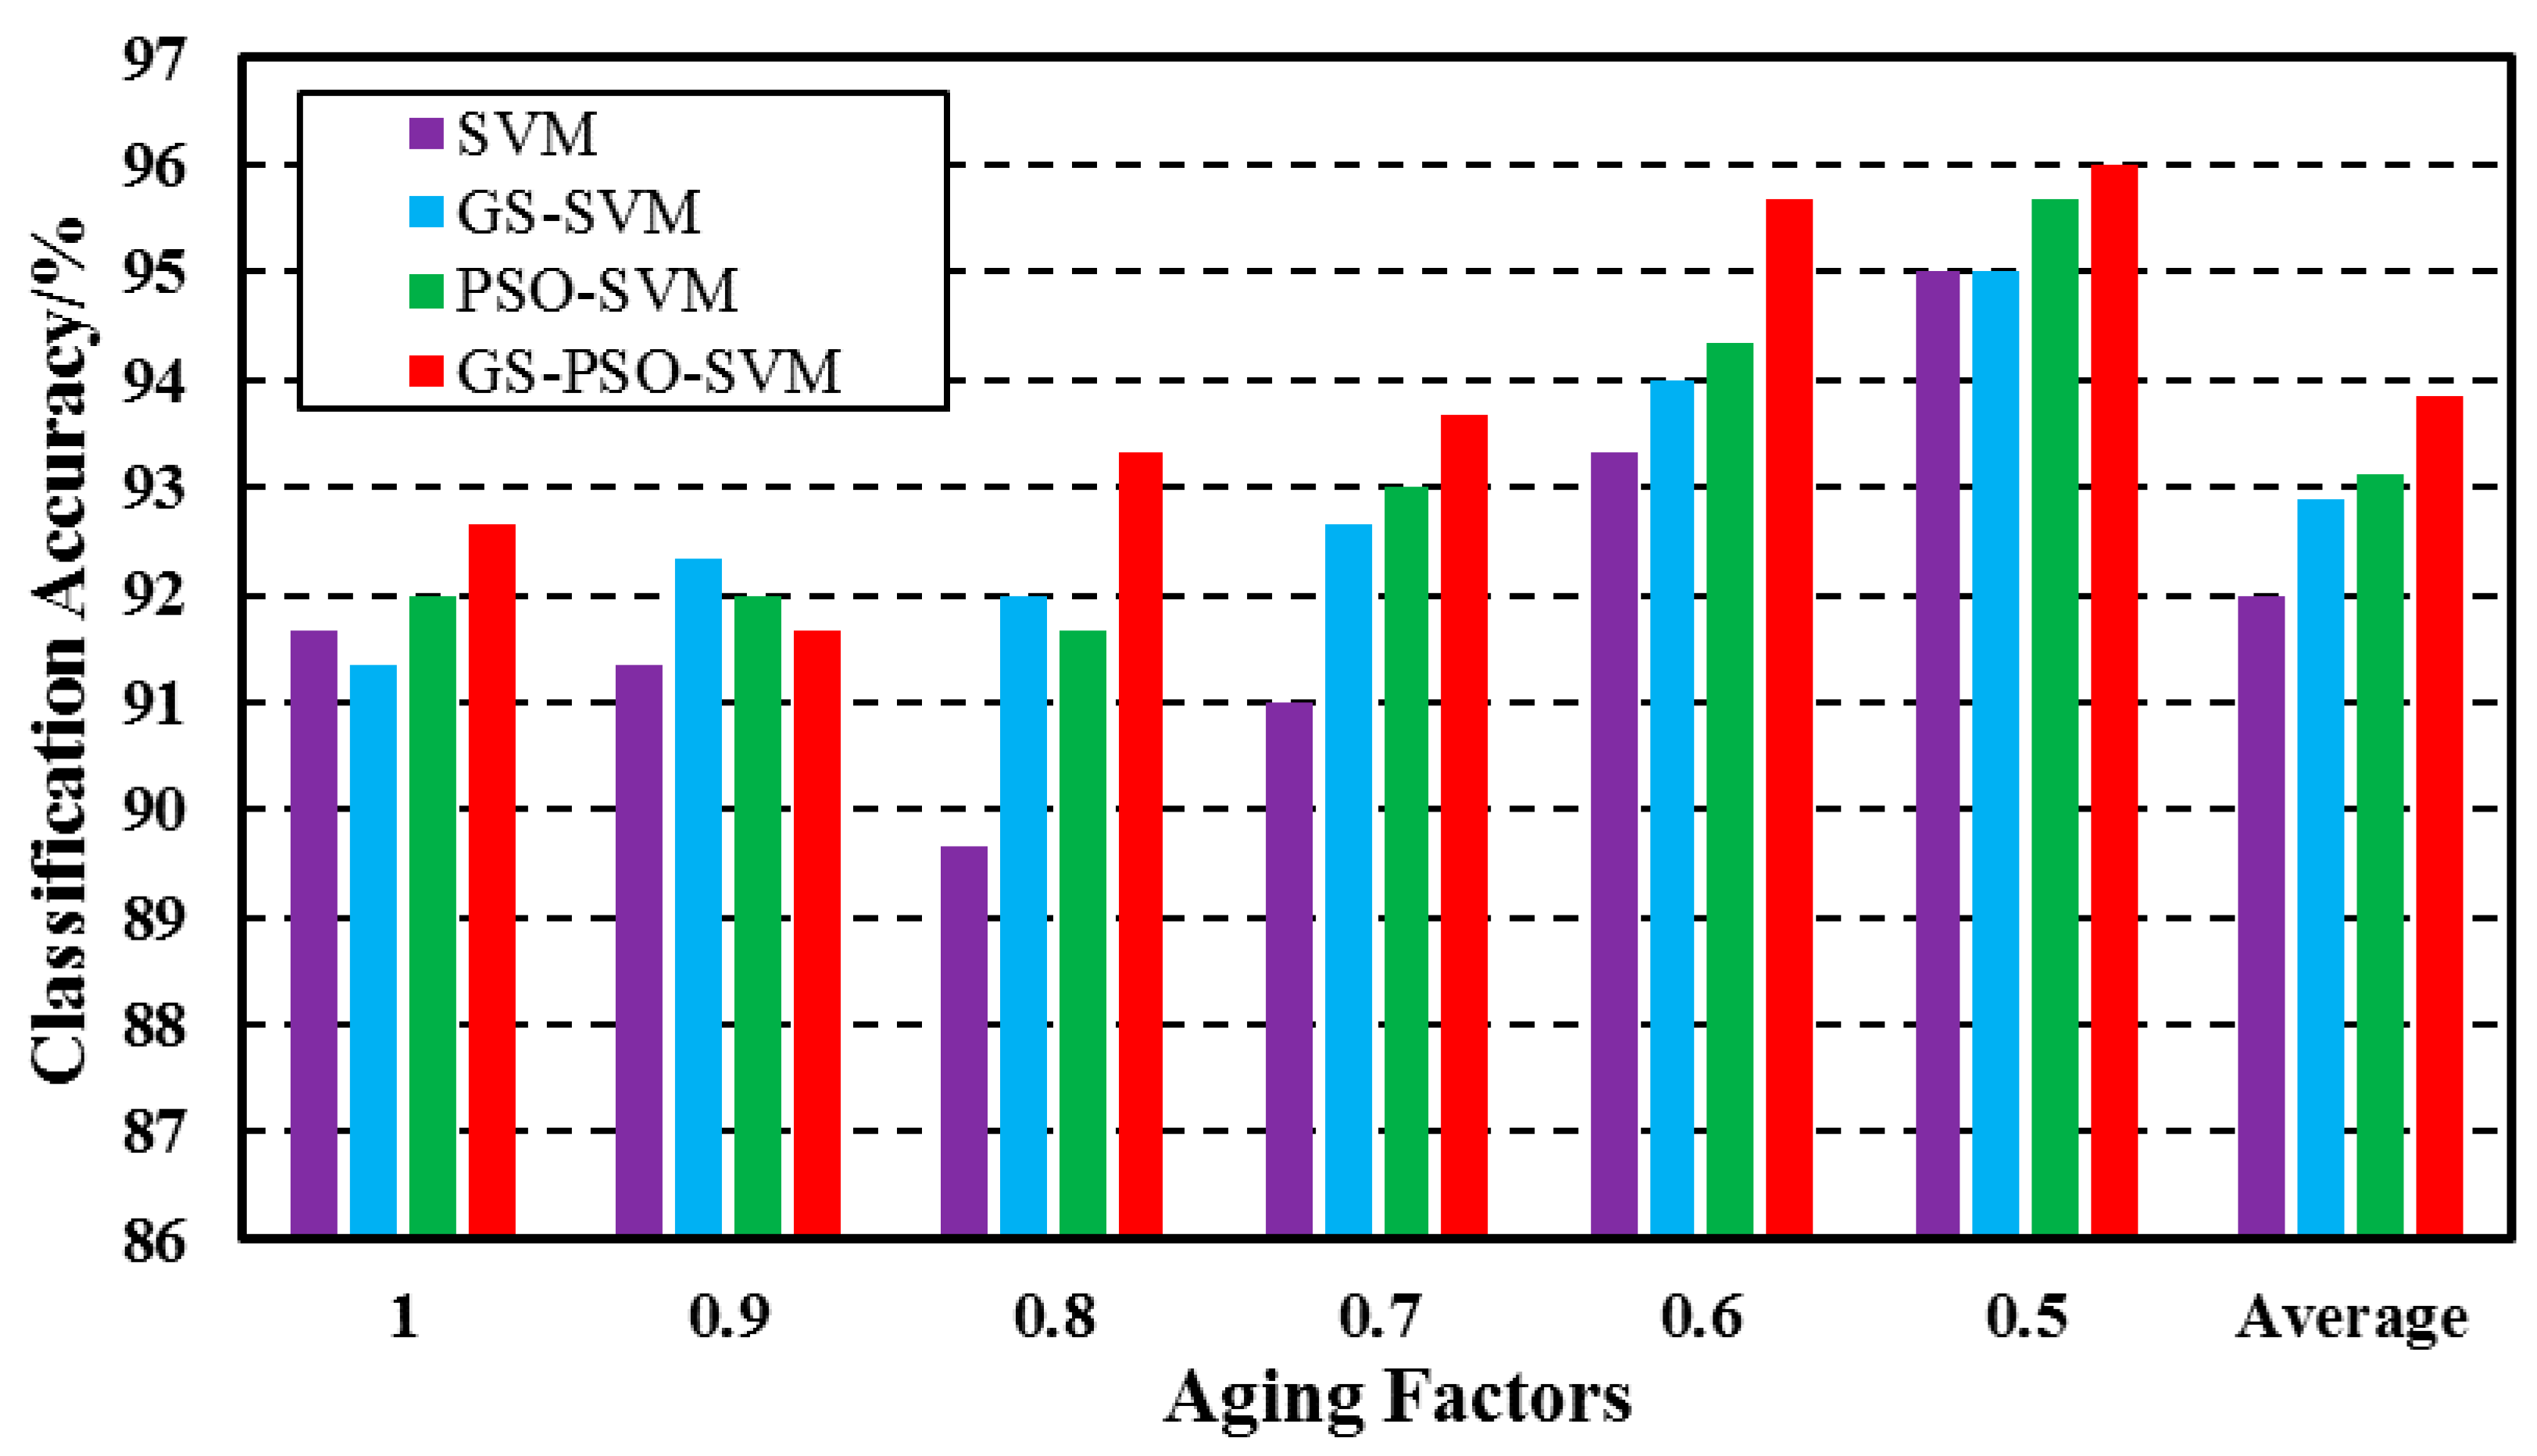
In this study, the SVM, GS–SVM and PSO–SVM are proposed as well to highlight the good diagnosis performance of GS–PSO–SVM. Figure 8 shows the performance of four different methods on diagnosing hydrothermal aging of the SCR catalyst. The diagnosis accuracy of the four algorithms in each degree of hydrothermal aging are given in Figure 8. It is evident that GS–PSO–SVM shows the best diagnosis performance in almost all of the hydrothermal aging factors. In contrast, SVM exhibits the worst classification accuracy in almost all of the degrees of hydrothermal aging. Meanwhile, it is obvious that PSO–SVM and GS–SVM have similar diagnosis performance in each of the hydrothermal aging factors. Furthermore, it can be found that with the decrease of the aging factor the diagnosis performance of the four algorithms on the degree of aging of the SCR catalyst has roughly a raising trend. As discussed in Section 4.2.1, the performance of the SCR system will reduce faster due to the hydrothermal aging of the SCR catalyst. When the degree of aging of the SCR catalyst is high, it may cause the obvious difference between the data samples under two adjacent aging factors. In this case, it may be easier for the algorithms to distinguish them. In addition, the average diagnosis accuracy of the four algorithms are illustrated in Figure 8 as well. As shown in Figure 8, the average diagnosis accuracy of GS–PSO–SVM, PSO–SVM, GS–SVM and SVM are 93.8%, 93.1%, 92.9% and 92.0% respectively, which indicates that GS–PSO–SVM exhibits better performance on diagnosing hydrothermal aging of the SCR catalyst than the others.
5. Conclusions
In this paper, a novel ensemble methodology involving the use of GS, PSO, and SVM, implemented in MATLAB, is presented for diagnosing the degree of hydrothermal aging of a V2O5/WO3–TiO2 catalyst in a SCR system. The various aspects of modeling and optimization have been discussed in detail. It can be concluded that:
- The SCR model has been built for the investigation, in a simulation, of the effect of an aging catalyst on SCR performance. It was validated under a NH3 based closed-loop control strategy by transient test data and the results show that this SCR model can roughly predict NOx emission and NH3 leakage at the outlet of a catalyst convertor.
- Considering that the activity of the SCR reaction is the main factor affecting NOx conversion efficiency, the SCR reaction rate () was selected as the major parameter affected by the hydrothermal aging and the aging factor (α) was defined simultaneously.
- The aging effect on the performance of a NH3 closed-loop SCR control system was studied by changing the aging factor (α). The result indicates that the aging of the SCR catalyst has significant negative impact on the performance of the SCR control system.
- To highlight the advantages of GS–PSO–SVM, this system was compared with PSO–SVM, GS–SVM and SVM. The results show that the diagnosis accuracy of GS–PSO–SVM, PSO–SVM, GS–SVM and SVM are 93.8%, 93.1%, 92.9% and 92.0% respectively. It indicates that GS–PSO–SVM exhibits better performance in the diagnosis of catalytic aging than PSO–SVM, GS–SVM or SVM.
Acknowledgments
This research is supported by National Natural Science Foundation (Grant No. 51406140). Without their help, it would be difficult to write this paper.
Author Contributions
All authors have contributed equally to the design of the research, data collection and analysis and the final preparation of the manuscript.
Conflicts of Interest
The authors declare no potential conflict of interest.
Definitions/Abbreviations
| NOx | Nitrogen oxide and dioxide |
| NH3 | Ammonia |
| Exhaust Gas specific constant | |
| R | Universal gas constant |
| T | Temperature in catalyst convertor |
| Exhaust mass flow | |
| Ambient pressure | |
| Number of SCR cell in the model | |
| ε | Ratio of gas to total convertor volume |
| Converter volume | |
| Concentration of active atoms with respect to converter volume | |
| Area of 1 mol of active surface atoms | |
| Sticking probability | |
| NH3 molar mass | |
| Pre-exponential factor of desorption | |
| Pre-exponential factor of SCR | |
| Pre-exponential factor of NH3 oxidation | |
| Activation energy of desorption | |
| Activation energy of SCR | |
| Activation energy of NH3 oxidation | |
| θ | Ammonia surface coverage |
| θ1 | Ammonia surface coverage in first cell of catalyst convertor |
| θ2 | Ammonia surface coverage in second cell of catalyst convertor |
| NOx concentration | |
| NH3 concentration | |
| Reaction rate of adsorption | |
| Reaction rate of desorption | |
| Reaction rate of SCR | |
| Reaction rate of NH3 oxidation | |
| NOx molar flow at inlet of catalyst convertor | |
| NH3 molar flow at inlet of catalyst convertor |
References
- Johnson, T.V. Review of Vehicular Emissions Trends. SAE Int. J. Engines 2015, 8, 1152–1167. [Google Scholar] [CrossRef]
- Prabhu, S.S.; Nayak, N.S.; Kapilan, N.; Hindasageri, V. An experimental and numerical study on effects of exhaust gas temperature and flow rate on deposit formation in Urea-Selective Catalytic Reduction (SCR) system of modern automobiles. Appl. Thermal Eng. 2017, 111, 1211–1231. [Google Scholar] [CrossRef]
- Åberg, A.; Widd, A.; Abildskov, J.; Huusom, J.K. Parameter estimation and analysis of an automotive heavy-duty SCR catalyst model. Chem. Eng. Sci. 2017, 161, 167–177. [Google Scholar] [CrossRef]
- Zhan, S.; Zhang, H.; Zhang, Y.; Shi, Q.; Li, Y.; Li, X. Efficient NH3-SCR removal of NOx with highly ordered mesoporous WO3(χ)-CeO2 at low temperatures. Appl. Catal. B Environ. 2017, 203, 199–209. [Google Scholar] [CrossRef]
- Gieshoff, J.; Schäfer-Sindlinger, A.; Spurk, P.C.; van den Tillaart, J.A.A.; Garr, G. Improved SCR Systems for Heavy Duty Applications. Available online: http://papers.sae.org/2000-01-0189/ (accessed on 10 April 2017).
- Adams, T.R. Development of an Open Loop Fuzzy Logic Urea Dosage Controller for use With an SCR Equipped HDD Engine; West Virginia University: Morgantown, WV, USA, 2008. [Google Scholar]
- Zhao, J.; Chen, Z.; Hu, Y.; Chen, H. Urea-SCR process control for diesel engine using feedforward-feedback nonlinear method. IFAC 2015, 48, 367–372. [Google Scholar] [CrossRef]
- Hu, J.; Zhao, Y.; Zhang, Y.; Shuai, S.; Wang, J. Development of Closed-Loop Control Strategy for Urea-SCR Based on NOx Sensors. Available online: http://papers.sae.org/2011-01-1324/ (accessed on 10 April 2017).
- Willems, F.; Cloudt, R. Experimental demonstration of a new model-based SCR control strategy for cleaner heavy-duty diesel engines. IEEE Trans. Control Syst. Technol. 2011, 19, 1305–1313. [Google Scholar] [CrossRef]
- Willems, F.; Cloudt, R.; van den Eijnden, E.; van Genderen, M.; Verbeek, R.; de Jager, B.; Boomsma, W.; van den Heuvel, I. Is Closed-Loop SCR Control Required to Meet Future Emission Targets? Available online: http://papers.sae.org/2007-01-1574/ (accessed on 10 April 2017).
- Devarakonda, M.; Parker, G.; Johnson, J.H.; Strots, V. Model-based control system design in a Urea-SCR aftertreatment system based on NH3 sensor feedback. Int. J. Autom. Technol. 2009, 10, 653–662. [Google Scholar] [CrossRef]
- Herman, A.; Wu, M.; Cabush, D.; Shost, M. Model Based Control of SCR Dosing and OBD Strategies with Feedback from NH3 Sensors. Available online: http://papers.sae.org/2009-01-0911/ (accessed on 4 April 2017).
- Bonfils, A.; Creff, Y.; Lepreux, O.; Petit, N. Closed-loop control of a SCR system using a NOx sensor cross-sensitive to NH3. J. Process Control 2014, 24, 368–378. [Google Scholar] [CrossRef]
- Feng, T.; Lu, L. The characteristics of ammonia storage and the development of model-based control for diesel engine urea-SCR system. J. Ind. Eng. Chem. 2015, 28, 97–109. [Google Scholar] [CrossRef]
- Opitz, B.; Bendrich, M.; Drochner, A.; Vogel, H.; Hayes, R.E.; Forbes, J.F.; Votsmeier, M. Simulation study of SCR catalysts with individually adjusted ammonia dosing strategies. Chem. Eng. J. 2015, 264, 936–944. [Google Scholar] [CrossRef]
- Pang, L.; Fan, C.; Shao, L.; Yi, J.; Cai, X.; Wang, J.; Kang, M.; Li, T. Effect of V2O5/WO3-TiO2 catalyst preparation method on NOx removal from diesel exhaust. Chin. J. Catal. 2014, 35, 2020–2028. [Google Scholar] [CrossRef]
- Marberger, A.; Elsener, M.; Ferri, D.; Kröcher, O. VOx Surface Coverage Optimization of V2O5/WO3-TiO2 SCR Catalysts by Variation of the V Loading and by Aging. Catalysts 2015, 5, 1704–1720. [Google Scholar] [CrossRef]
- Li, Z.; Li, J.; Liu, S.; Ren, X.; Ma, J.; Su, W.; Peng, Y. Ultra hydrothermal stability of CeO2-WO3/TiO2 for NH3-SCR of NO compared to traditional V2O5/WO3-TiO2 catalyst. Catal. Today 2015, 258, 11–16. [Google Scholar] [CrossRef]
- Seo, C.-K.; Choi, B. Physicochemical characteristics according to aging of Fe-zeolite and V2O5-WO3-TiO2 SCR for diesel engines. J. Ind. Eng. Chem. 2015, 25, 239–249. [Google Scholar] [CrossRef]
- Liu, X.; Wu, X.; Xu, T.; Weng, D.; Si, Z.; Ran, R. Effects of silica additive on the NH3-SCR activity and thermal stability of a V2O5-WO3/TiO2 catalyst. Chin. J. Catal. 2016, 37, 1340–1346. [Google Scholar] [CrossRef]
- Ma, Y.; Wang, J. Observer-based estimation of aging condition for selective catalytic reduction systems in vehicle applications. J. Dyn. Syst. Meas. Control 2017, 139, 21002. [Google Scholar] [CrossRef]
- Zhu, K.; Song, X.; Xue, D. A roller bearing fault diagnosis method based on hierarchical entropy and support vector machine with particle swarm optimization algorithm. Measurement 2014, 47, 669–675. [Google Scholar] [CrossRef]
- Gao, X.; Hou, J. An improved SVM integrated GS-PCA fault diagnosis approach of Tennessee Eastman process. Neurocomputing 2016, 174, 906–911. [Google Scholar] [CrossRef]
- An, R.; Yang, C.; Zhou, Z.; Wang, L.; Pan, Y. Comparison of different optimization methods with support vector machine for blast furnace multi-fault classification. IFAC 2015, 48–21, 1204–1209. [Google Scholar]
- Rajeswari, C.; Sathiyabhama, B.; Devendiran, S.; Manivannan, K. Bearing fault diagnosis using wavelet packet transform, hybrid PSO and support vector machine. Procedia Eng. 2014, 97, 1772–1783. [Google Scholar] [CrossRef]
- Zhang, H.; Wang, J. Ammonia coverage ratio and input simultaneous estimation in ground vehicle selective catalytic reduction (SCR) systems. J. Frankl. Inst. 2015, 352, 708–723. [Google Scholar] [CrossRef]
- Ruggeri, M.P.; Nova, I.; Tronconi, E. Experimental and modeling study of the impact of interphase and interphase diffusional limitations on the DeNOx efficiency of a V-based extruded catalyst for NH3–SCR of Diesel exhausts. Chem. Eng. J. 2012, 207–208, 57–65. [Google Scholar] [CrossRef]
- Hsieh, M.-F.; Wang, J. Development and experimental studies of a control-oriented SCR model for a two-catalyst urea-SCR system. Control Eng. Pract. 2011, 19, 409–422. [Google Scholar] [CrossRef]
- Zhang, H.; Wang, J. Removal of NOx sensor ammonia cross sensitivity from contaminated measurements in Diesel-engine selective catalytic reduction systems. Fuel. 2015, 150, 448–456. [Google Scholar] [CrossRef]
- Devarakonda, M.; Parker, G.; Johnson, J.H.; Strots, V.; Santhanam, S. Adequacy of Reduced Order Models for Model-Based Control in a Urea-SCR Aftertreatment System. Available online: http://papers.sae.org/2008-01-0617/ (accessed on 4 April 2017).
- Schar, C.M.; Onder, C.H.; Geering, H.P. Control of an SCR catalytic converter system for a mobile heavy-duty application. IEEE Trans. Control Syst. Technol. 2006, 14, 641–653. [Google Scholar] [CrossRef]
- Stadlbauer, S.; Waschl, H.; Re, L.D. Adaptive SCR Model for MPC Control Including Aging Effects. Available online: http://papers.sae.org/2015-01-1045/ (accessed on 4 April 2017).
- Dibike, Y.B.; Velickov, S.; Solomatine, D.; Abbott, M.B. Model induction with support vector machines: introduction and applications. J. Comput. Civ. Eng. 2001, 15, 208–216. [Google Scholar] [CrossRef]
- Liu, B.; Hu, J.; Yan, F.; Turkson, R.F.; Lin, F. A novel optimal support vector machine ensemble model for NOx emissions prediction of a diesel engine. Measurement 2016, 92, 183–192. [Google Scholar] [CrossRef]
- Stoppato, A.; Cavazzini, G.; Ardizzon, G.; Rossetti, A. A PSO (particle swarm optimization)-based model for the optimal management of a small PV(Photovoltaic)-pump hydro energy storage in a rural dry area. Energy 2014, 76, 168–174. [Google Scholar] [CrossRef]
- Delgarm, N.; Sajadi, B.; Kowsary, F.; Delgarm, S. Multi-objective optimization of the building energy performance: A simulation-based approach by means of particle swarm optimization (PSO). Appl. Energy 2016, 170, 293–303. [Google Scholar] [CrossRef]
Figure 1.
The schematic of the experimental setup.

Figure 2.
NH3-based closed-loop control strategy.

Figure 3.
Variables in transient test cycle.

Figure 4.
Comparison between experimental and predicted values from simulation for downstream NOx (a) and NH3 concentration (b).
Figure 4.
Comparison between experimental and predicted values from simulation for downstream NOx (a) and NH3 concentration (b).
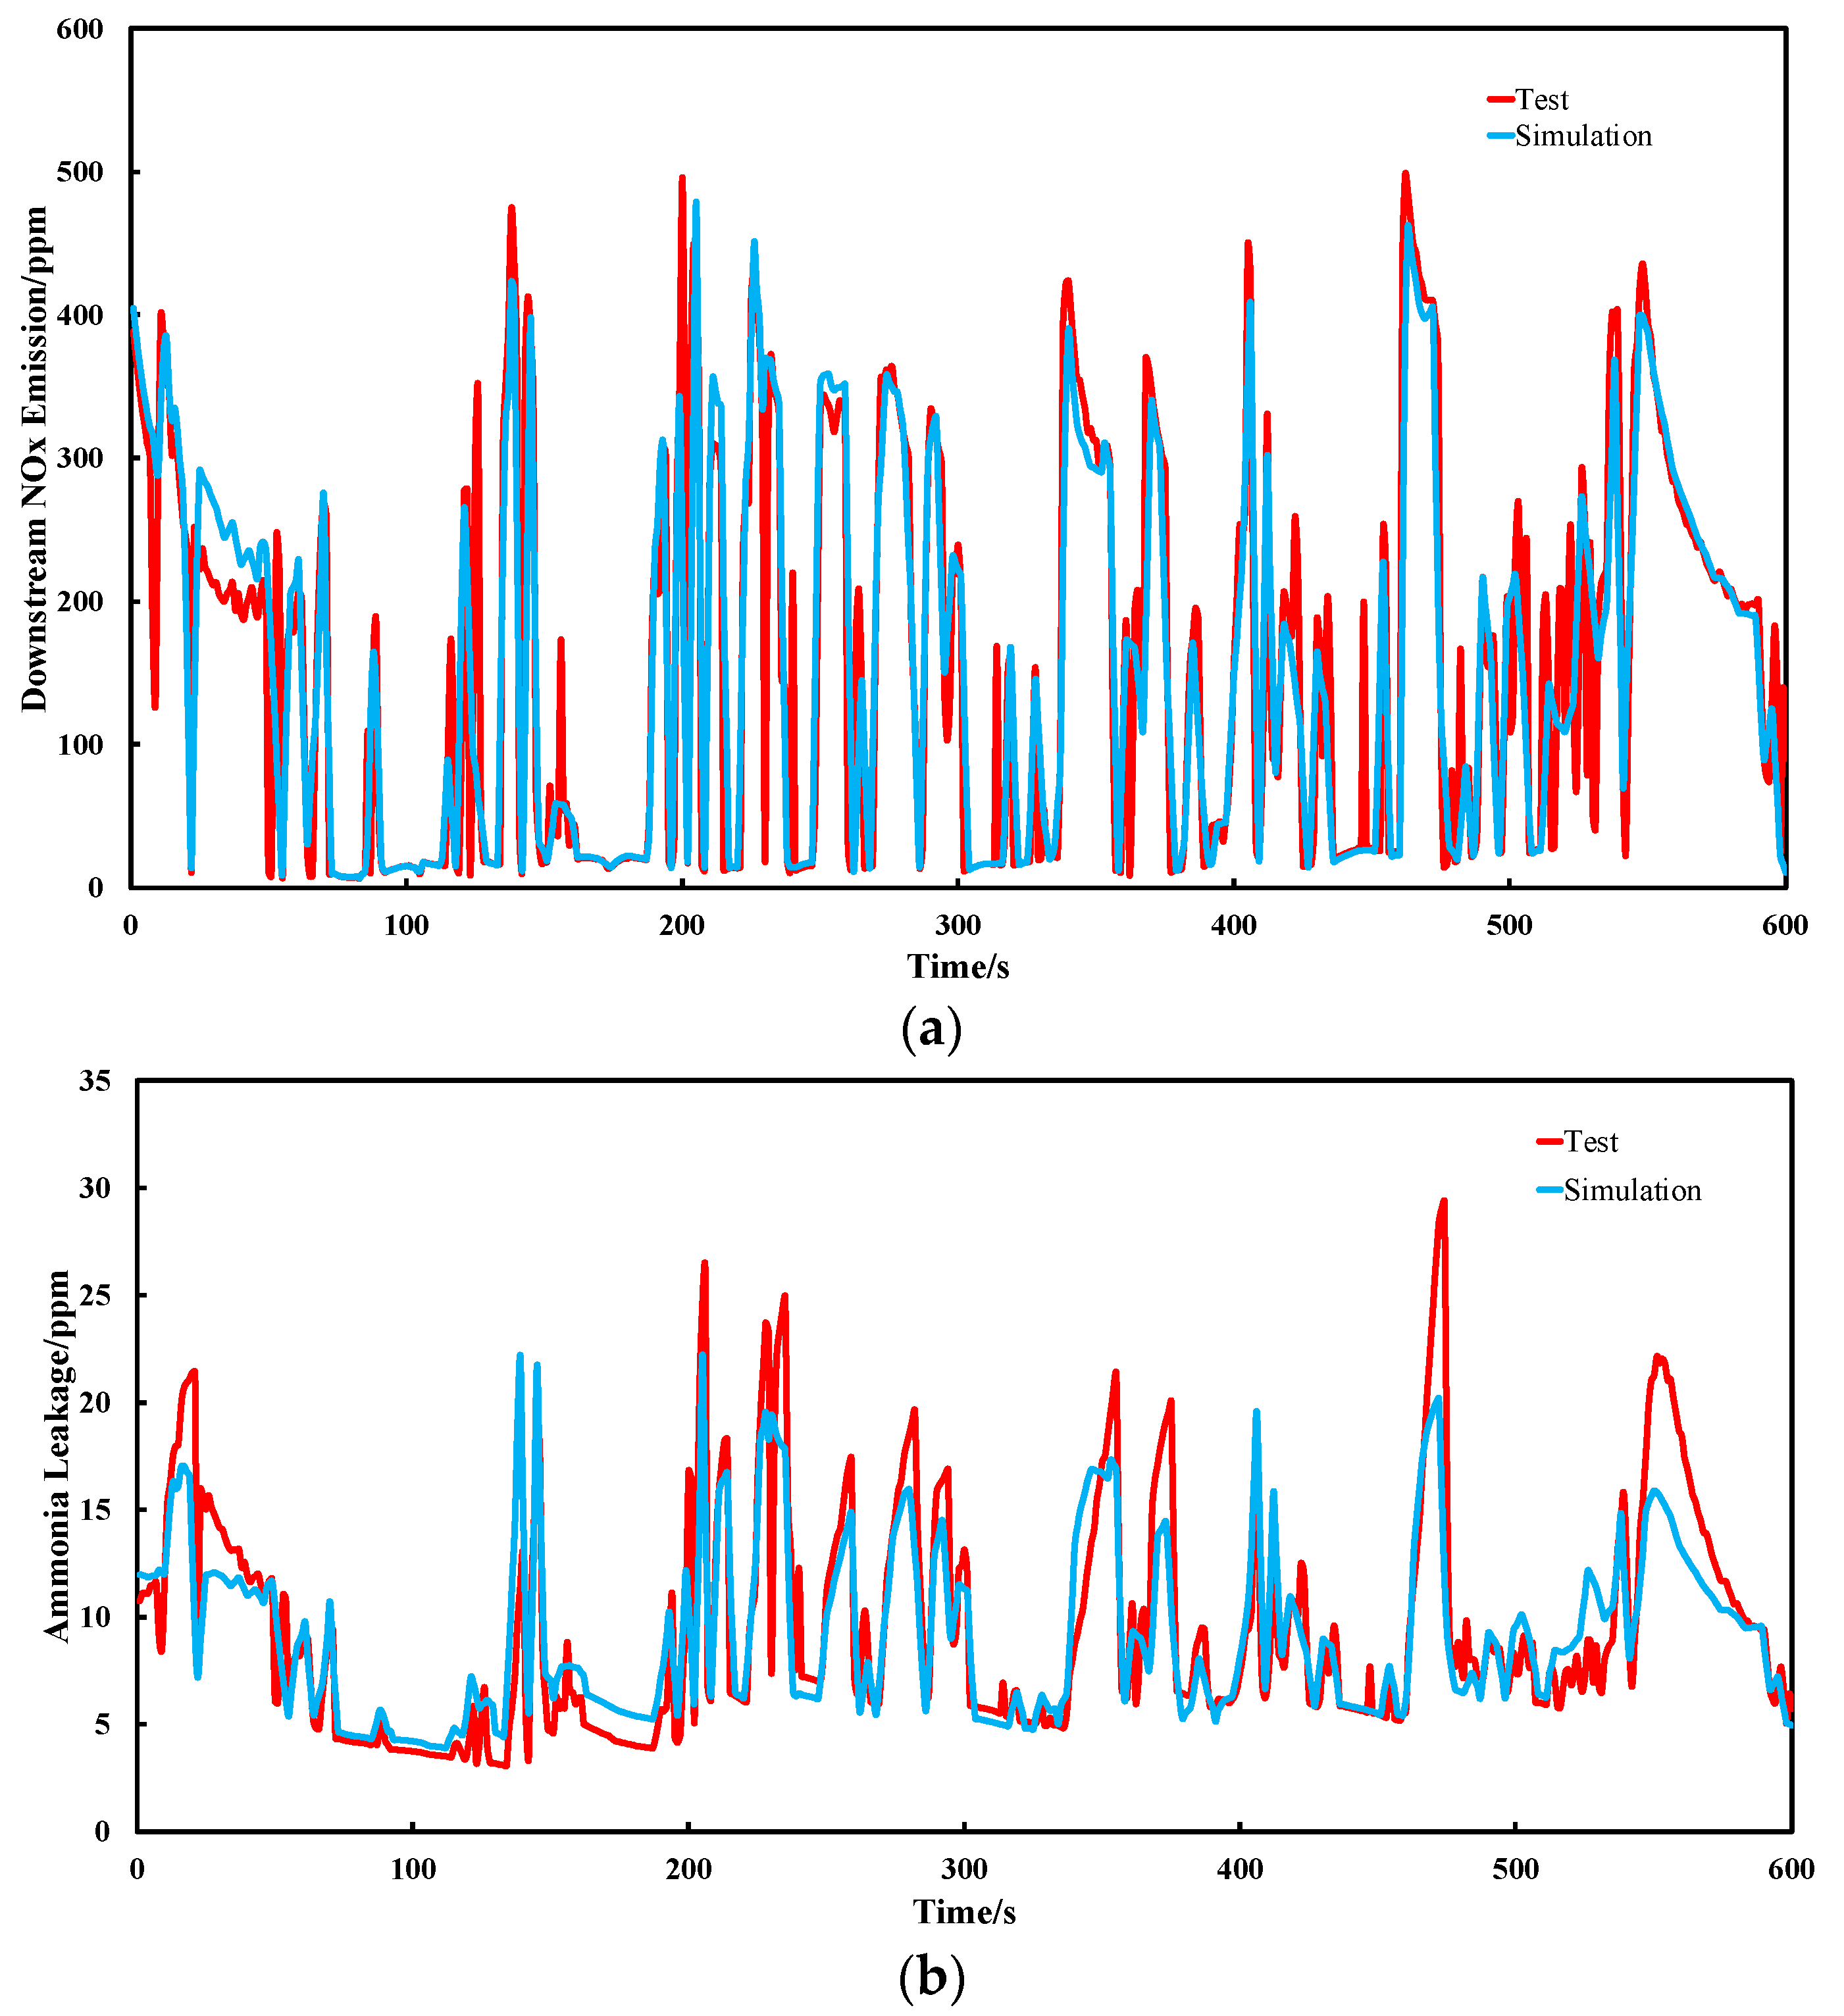
Figure 5.
SCR performance at different degrees of aging. (a) NOx conversion efficiency; (b) NH3 leakage; (c) θ1; (d) θ2.
Figure 5.
SCR performance at different degrees of aging. (a) NOx conversion efficiency; (b) NH3 leakage; (c) θ1; (d) θ2.

Figure 6.
The flow chart of processes for designing the proposed support vector machine–particle swarm optimization–grid search (GS–PSO–SVM) model.
Figure 6.
The flow chart of processes for designing the proposed support vector machine–particle swarm optimization–grid search (GS–PSO–SVM) model.

Figure 7.
The search results of C and g in SVM through GS method.

Figure 8.
Performance of SVM, GS–SVM, PSO–SVM and GS–PSO–SVM on diagnosing the degree of hydrothermal aging of the SCR catalyst.
Figure 8.
Performance of SVM, GS–SVM, PSO–SVM and GS–PSO–SVM on diagnosing the degree of hydrothermal aging of the SCR catalyst.

Table 1.
Engine information.
| Features | Parameters |
|---|---|
| Engine model | Inline 6-cylinder, YC6J-42 |
| Displacement | 6.6 L |
| Rated power | 132 kW |
| Maximum torque | 660 Nm (1200–1700 rpm) |
| Idle speed | 650 ± 50 rpm |
Table 2.
Measuring and monitoring equipment.
| Equipment | Application | |
|---|---|---|
| AVL PUMA OPEN test bench | AC electrical dynamometer | Measuring engine speed and torque |
| dynamometer control system | Controlling speed or torque of dynamometer to change the engine load | |
| throttle actuator | Regulating the operating condition of engine | |
| thermal measurement system | Monitoring thermodynamic parameters such as cooling water temperature, intake and exhaust pressure and etc. | |
| SEMTECH-EFM2 | Measuring exhaust mass flow | |
| AVL DiGas 4000 light (Port 1) | Measuring NOx concentration at upstream pipe | |
| AVL DiGas 4000 light (Port 2) | Measuring NOx concentration at downstream pipe | |
| LDS6 | Measuring NH3 Leakage | |
| Temperature sensor (Upstream) | Measuring upstream temperature | |
| Temperature sensor (Downstream) | Measuring downstream temperature | |
Table 3.
SCR performance at different aging factors.
| Aging Factor | Mean NOx Conversion Efficiency | Mean NH3 Leakage/ppm | Peak NH3 Leakage/ppm | Variance of NH3 Leakage |
|---|---|---|---|---|
| 1 | 79.7% | 9.28 | 22.24 | 15.31 |
| 0.9 | 77.0% | 9.86 | 23.81 | 18.46 |
| 0.8 | 73.7% | 10.56 | 25.64 | 22.62 |
| 0.7 | 69.6% | 11.39 | 27.97 | 28.22 |
| 0.6 | 64.7% | 12.41 | 31.57 | 35.83 |
| 0.5 | 58.4% | 13.67 | 35.65 | 46.31 |
© 2017 by the authors. Licensee MDPI, Basel, Switzerland. This article is an open access article distributed under the terms and conditions of the Creative Commons Attribution (CC BY) license (http://creativecommons.org/licenses/by/4.0/).
Share and Cite
MDPI and ACS Style
Hu, J.; Zeng, J.; Wei, L.; Yan, F. Improving the Diagnosis Accuracy of Hydrothermal Aging Degree of V2O5/WO3–TiO2 Catalyst in SCR Control System Using an GS–PSO–SVM Algorithm. Sustainability 2017, 9, 611. https://doi.org/10.3390/su9040611
AMA Style
Hu J, Zeng J, Wei L, Yan F. Improving the Diagnosis Accuracy of Hydrothermal Aging Degree of V2O5/WO3–TiO2 Catalyst in SCR Control System Using an GS–PSO–SVM Algorithm. Sustainability. 2017; 9(4):611. https://doi.org/10.3390/su9040611
Chicago/Turabian StyleHu, Jie, Jiawei Zeng, Li Wei, and Fuwu Yan. 2017. "Improving the Diagnosis Accuracy of Hydrothermal Aging Degree of V2O5/WO3–TiO2 Catalyst in SCR Control System Using an GS–PSO–SVM Algorithm" Sustainability 9, no. 4: 611. https://doi.org/10.3390/su9040611
Note that from the first issue of 2016, this journal uses article numbers instead of page numbers. See further details here.