
A Performance Evaluation Study of Human Resources in Low-Carbon Logistics Enterprises
by
 ,
,
Qunzhen Qu
1, 
Wenjing Wang
1,
Mengxue Tang
2,
Youhu Lu
1,
Sang-Bing Tsai
3,4,5,1,*,
Jiangtao Wang
3,
Guodong Li
5 and
Chih-Lang Yu
6,* 1
School of Economics & Management, Shanghai Maritime University, Shanghai 201306, China
2
Zhongtai Securities Company Limited, Shanghai Company Research Institute, Shanghai 200120, China
3
Zhongshan Institute, University of Electronic Science and Technology of China, Zhongshan 528402, China
4
Business and Law School, Foshan University, Foshan 528000, China
5
Economics and Management College, Civil Aviation University of China, Tianjin 300300, China
6
Business School, Nankai University, Tianjin 300071, China
*
Authors to whom correspondence should be addressed.
Sustainability 2017, 9(4), 632; https://doi.org/10.3390/su9040632
Submission received: 18 November 2016
/
Revised: 12 April 2017
/
Accepted: 12 April 2017
/
Published: 17 April 2017
Abstract
:With China’s rapid economic development, restructuring the economy will require a development model based on high-to-low carbon transition. The development of logistics enterprises has its own characteristics associated with the trend of low carbon. This article discusses the significance of structuring a human resource performance evaluation system for low-carbon logistics enterprises. We used an analytic hierarchy process (AHP) and triangle-definite weighted functions as the technology platform to determine the performance evaluation and measure corporate status quo. The results can serve as a reference for companies to make the best talent decisions and achieve long-term development strategies. In addition, this study helps to make up for a lack of relevant research in this area.
1. Introduction
High-speed global economic development is based on the rapid consumption of energy, which has resulted in varying degrees of energy issues among different countries. Traditional models of economic development cannot cope with the severe international situation. In 2003, British prime minister Tony Blair proposed the concept of a low-carbon economy, which, through the use of new technology and new energy, aims to achieve low power consumption and low pollution, thus promoting green, sustainable economic development throughout the world [1]. As a new model of economic development, the low-carbon economy has become a focus of attention in various countries [2] and is considered an inevitable trend in future development.
2. Human Resource Features of Low-Carbon Logistics Companies and the Significance of Establishing a Performance Evaluation System
2.1. Particular Human Resources in Carbon Logistics Companies
The EREC (2008) defines low carbon as using low-carbon energy sources to replace fossil fuels with the aim of ensuring economic growth and improving people’s well-being [1]. With the continuous development of society, the content of the low-carbon concept has been continuously enriched. In short, the low-carbon economy falls under the concept of sustainable development. Through the use of industrial restructuring, technological innovation, new energy development, and other means, it aims to change the structure of energy and minimize oil and other high-carbon energy consumption, thus reducing carbon dioxide and other greenhouse gas emissions. In this way, a win–win outcome can be achieved in terms of economic and social development, as well as ecological protection [2,3].
Talent is not only the main labor organization of an enterprise but also a scarce resource. Logistics enterprises are among the primary energy consumption organizations. Under the development trend of low-carbon economies, the scarcity of human resources in such organizations is particularly prominent. Compared to general enterprises, human resources in low-carbon logistics enterprises have their own characteristics:
- (1)
- Low-carbon technologies. The logistics operation system includes transportation, warehousing, distribution, handling, and packaging [3,4]. Transportation uses networks to determine the best routes, warehousing uses research optimization theory to determine optimal inventory levels, and so forth. The various subsystems of logistics systems require low-carbon technologies for support; therefore, their human resources should have certain low-carbon technologies.
- (2)
- Low-carbon concept. Low-carbon logistics is a new trend in the development of the logistics industry. It requires integrating the low-carbon concept in the process of logistics system improvement, with consideration of environmental and energy issues, to help enterprises attain economic benefits while also protecting the environment [5]. Therefore, the concept of low carbon is necessary for the work-skills component of human resources in low-carbon logistics enterprises.
- (3)
- Strategic vision. The future development trend of low-carbon logistics will involve the whole supply chain, not just a single logistics enterprise. Supply chains themselves save costs. Low carbon is involved in the procurement of raw materials, product manufacturing, transport, and packaging. A series of links will be integrated into low carbon, and the whole supply chain will have a two-pronged effect. The sustainable development of supply chain trends and the human resource requirements of enterprises must have a strategic vision for global efforts. Such a vision will be put toward greater output while forming the competitive core of enterprises.
- (4)
- Innovation consciousness. Since the logistics industry is knowledge-and-talent intensive, competition between enterprises is growing. Knowledge renewal and technology innovation are necessary for achieving sustainable development. Thus, human resources in low-carbon logistics enterprises have a strong sense of innovation.
2.2. The Significance of Human Resources Performance Evaluation in Low-Carbon Logistics Enterprises
Performance evaluation plays an important role in development. Reasonable performance evaluation is an effective means to ensure the core competitiveness of enterprises and promote employee innovation [6]. By building a performance evaluation index system, we can determine the index that will contribute to enterprises and strengthen them, and thus reject the lower-effect index. Performance evaluation is highly significant for employees, managers, and the whole enterprise in the following ways:
- (1)
- For the general staff. Through performance evaluation, employees can see the results of their hard work and know their strengths and weaknesses, as well as their development potential, while better understanding the enterprise’s objectives.
- (2)
- For the supervisor. Based on the results of performance evaluations, managers can allocate and transfer human resources and determine remuneration. Employee evaluation is conducted to provide targeted training or promotion for outstanding officers.
- (3)
- For the organization. Performance evaluation is an important means for achieving an organization’s strategic objectives. It guides employee behavior and organizational goals. Performance evaluation is a central part of performance management. Evaluations not only show the results of the first phase of a performance plan but also provide a reference for improving the next program. By establishing a human resource performance appraisal system for low-carbon logistics enterprises, an enterprise’s previous work standard can be measured. This can help enterprises understand their development status and improve their plans for determining the best human resource management and development decisions. It plays a guiding role in the future development of an enterprise.
3. Building a Performance Evaluation System for Human Resources in Low-Carbon Logistics Enterprises
3.1. Establishing an Evaluation Matrix Based on AHP
The analytic hierarchy process (AHP), developed by Thomas Saaty in the mid-1970s, is a systematic, hierarchical combination of qualitative and quantitative analysis that has great practical value for dealing with complex decision problems [7,8]. For a performance evaluation index for human resources in low-carbon logistics enterprises, the index is, importantly, not the same. Therefore, we used an AHP index hierarchy and gave weights.
3.1.1. Index Options and Index Hierarchical Model Construction
Before using the triangle transform function to conduct gray evaluation, it is important to build an index system and analyze the operational processes of low-carbon logistics enterprises and human resource characteristics. Selecting a scientific and reasonable performance evaluation index is the basis for accurate evaluation.
Constructing an index system is based on the following principle levels. First, human resource performance evaluation in a low-carbon logistics enterprise can be divided into three levels. This is referred to as the first index, which includes working ability, working performance, and working attitude, where each level can be divided into various subindices, referred to as the second index. The secondary assessment index of working ability is subdivided into low-carbon professional knowledge (including the low-carbon concept), low-carbon professional skill (including low-carbon skills), and low-carbon innovation potential (including innovation in low-carbon skills and innovative use of low-carbon technologies). The secondary assessment index of working performance is subdivided into the quantity of tasks completed, quality of tasks completed, and efficiency of task completion. The secondary assessment index of working attitude is subdivided into discipline, cooperation, and enthusiasm. These are shown in Table 1.
3.1.2. Construction of the Judgment Matrix
After constructing the hierarchical model, the factor affiliation between the upper and lower levels was also determined. The factors on the same level of the structural model can be compared (pairwise) with the factors of the upper layer. According to the relative importance of comparison, we established a series of judgment matrices. Based on the data, questionnaires, and expert analysis, we judged the matrix assignment pairwise factors. A comparison of the standards adopted for the nine-point scale is shown in Table 2.
Based on the comparison results of the level factors, it can be configured into a comparison matrix as follows:
When aij > 1, index i is more important for the target than index j; its numerical size represents an important extent.
3.1.3. Single-Level Sorting and Determination of Index Weight
Single-level sorting is used to calculate the relative important scheduling problem of each factor on this level with respect to the upper single criterion. We need to calculate the maximum eigenvalue and the corresponding eigenvector of each judgment matrix to obtain single-level sorting and the important data sequence from the index layer to the target layer, thereby obtaining the optimal decision. Then, a consistency check is performed. Specifically, we first calculate the maximum eigenvalue ηmax of judgment matrix A, and then use the formula to obtain eigenvector ω corresponding to ηmax. After standardization, the sorted weight of the relative importance of certain factors is on the same level of the element corresponding to the previous level [7,8,9]. For the solution of the maximum eigenvalues and eigenvectors of the judgment matrix, the obtained eigenvector ω is the sorted weight of the relative importance of certain factors, which is the same level as the element that corresponds to the previous level. We can use geometric mean normalization to normalize ω: and can obtain the approximate eigenvector ; is the sorted weight of relative importance after normalization, and n represents the number of eigenvalues in the judgment matrix.
3.1.4. Consistency Check
We calculated the consistency index and consistency ratio as follows:
where n is the order of the judgment matrix, and R.I is the average random consistency index; for the matrix n = 1–9, the reference values are shown in Table 3 [8].
When C.R is small, the consistency of the judgment matrix is better. Generally, when C.R < 0.1 , the judgment matrix meets satisfactory consistency standards, and the result of single-level sorting is acceptable. Otherwise, the judgment matrix needs to be corrected to achieve satisfactory consistency.
3.1.5. Determine the Evaluation Grade
To convert the qualitative index into a quantitative index, we assigned values to each index. The assignment of each grade was determined by a five-point principle; the evaluation rating criteria are shown in Table 4.
The index level between two adjacent levels corresponds to score point values of 8, 6, 4, and 2.
3.1.6. Evaluation Matrix Established by Assessment Factors
Selecting the number p as the reviewer, we can then use the Delphi method to obtain the grade, evaluated by the number l expert, according to evaluation index Aij Then, we can construct the dij evaluation matrix Di of the performance evaluation for the first-level evaluation index Ai, such that , where n is the index number of second-level evaluation index Aij.
3.1.7. Notes
In the application of AHP factor selection and hierarchy construction, if the selected elements are not reasonable, the meaning is confused, or elements of the relationship are not correct, it will reduce the quality of the results and even lead to decision failure. To ensure the rationality of the hierarchical structure, we need to grasp the following principles:
- (1)
- simplify the problem to grasp the main factors, not leakage; and
- (2)
- pay attention to the strength of the relationship between elements; the difference between the elements cannot be too much at the same level.
3.2. A Gray Comprehensive Evaluation Method Based on Central Point Triangle Whitening Weight Function
The triangle whiten function refers to the Cartesian coordinates of three lines. It can quantitatively assess the degree of an object belonging to a gray class (the relationship changes along with the evaluation index of samples or size) called the weight function [9,10,11,12]. The gray estimation method of triangular whitening weight function (following Liu Sifeng’s 1993 proposal) is applicable to the evaluation of small samples with poor information uncertainty [13,14,15,16,17].
This study uses an improved triangle whitening weight function. This is more reasonable than endpoint assessment [17,18,19,20,21]. First, the cluster of the center assessment of the triangle whiten function is more reasonable than endpoint assessment. The cluster of the endpoint assessment of the triangle whiten function has more than two gray cross-phenomena, whereas the cluster of the center assessment of the triangle whiten function does not have this phenomenon. Second, the endpoint assessment of the triangle whiten function may indicate that the sum of the value of a certain index belonging to each gray cluster coefficient is larger or smaller than 1, whereas the sum of the center assessment of the triangle whiten function is 1. This indicates greater standardization [22,23,24].
3.2.1. Construction of the Triangle Whiten Function
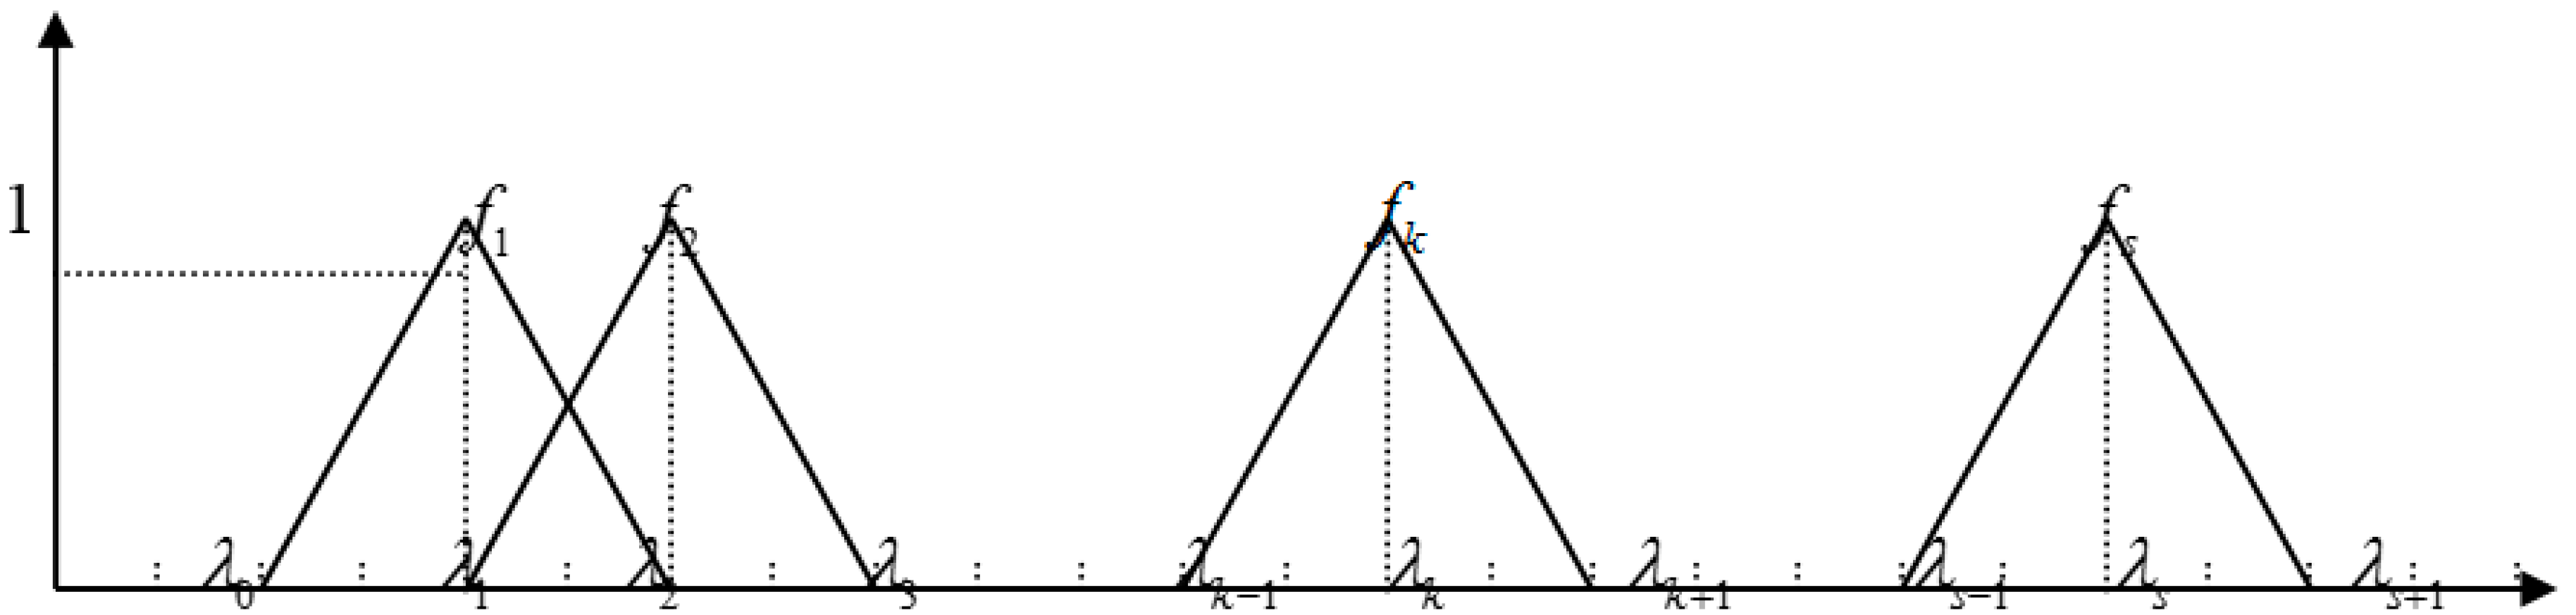
The number s of gray classes is divided according to assessment requirements. Then, λ1, λ2, ⋯, λs are chosen as belonging to the gray class 1, 2, …, point s (the center point means that the selection is based on the maximum likelihood of belonging to the gray class). The value range of each index is accordingly divided into s gray classes, such as dividing the value range of index Aij into s small sections ; the value of is determined in accordance with the requirements of practical problems or qualitative research results [10]. At the same time, point (λk, 1) is connected to the center point (λk−1, 0) of the k − 1 section and (λk, 1) is connected to the center point (λk+1, 0) of the k + 1 section to obtain the index Aij, the triangle whiten function , with respect to gray cluster k . The extent of the Aij index number field to the left of λ0 and the right of λs+1, to obtain the triangle whiten function and of Aij related to gray cluster 1 and s, is shown in Figure 1 [25,26].
3.2.2. Calculating the Gray Factor Evaluation Vector and Evaluation Matrix
In gray evaluation theory, each evaluator’s score is a gray number. The scores given by p evaluators of evaluation index Aij are . Therefore, the whitening weight of index Aij belonging to the number k evaluation of the gray cluster considered by evaluators is . The total whiten function of Aij belonging to the number k evaluation of the gray cluster considered by the total evaluators is , and the total whitening weight of Aij belonging to each evaluation of the gray cluster is . The ratio between the two is . Its size reflects the strong degree to which all evaluators consider the index Aij belonging to the number k gray cluster. This value is the gray evaluation coefficient of index Aij belonging to the number k gray cluster marked as rijk. Vector rij contains the gray evaluation coefficient of each gray cluster where index Aij belongs to its gray evaluation vector , i = 1, 2, …, m; j = 1, 2, …, n; s is divided by the number of the gray cluster. The gray evaluation weight vector of the gray evaluation cluster of Ai belonging to index Aij is summed to obtain the gray evaluation matrix of index Ai :
3.2.3. Calculating the Comprehensive Evaluation Value and Sorting
We set Ci as the result of the comprehensive evaluation of index Ai, and . From Ci, we can obtain the gray evaluation weight R of each gray evaluation cluster related to the performance evaluation A that belongs to index Ai [27,28]. Then, the comprehensive evaluation of the results can be obtained; C:
The maximum weight principle in evaluation target A can determine the rate associated with the grade of every evaluation gray cluster, ; so the rate is the l class. However, this method for determining the rate’s class of the gray cluster sometimes fails due to the large amount of information lost. In addition, C cannot be directly used to assess subjects’ sorting and optimal selection. Thus, the gray comprehensive assessment vector is constructed for further processing and made into a single value, and the value of comprehensive evaluation W of the appraisal target is calculated. Each gray cluster grade is assigned according to the gray level. Then, the value of the gray-type hierarchical vector is , which is used to calculate the value of the comprehensive evaluation according to the value of W, and any number of objects participating in the evaluation can be sorted. The main characteristic of the multilevel gray comprehensive evaluation method is describing dispersing information from multiple evaluators as a vector that belongs to a different evaluation gray cluster. Then, the vector is converted into a single value, except for the evaluation of the grade of the rate. The result can also be used to sort and optimally select the value of the gray comprehensive evaluation when there are multiple rates involved in the evaluation.
4. Examples of Application and Discussion
In recent years, logistics enterprises have been committed to low-carbon development and have achieved certain results. Enterprises want to understand their own human resource utilization status and whether there is room for more development. Combined with the actual situations of enterprises, we evaluate the use of AHP and the gray comprehensive evaluation method, based on triangular whitening weight function, to construct a performance appraisal system for human resources in low-carbon logistics enterprises according to an index system of human resource management efficiency.
(1) Determining the index weight and evaluation matrix
We use AHP to determine the first-level index weight vector and the second-level index weight vector ; ; . The Delphi method is used to select human resource management experts and logistics enterprise experts using the ninth grade to score the two performance evaluation index systems. The evaluation matrix is then obtained:
(2) Establishing the triangle whitening weight function
(3) Comprehensive evaluation and sorting
Using the triangle whiten function formula, the total whitening weights of the index weights A11 belonging to the first gray cluster are obtained: . The whitening weights of the second gray cluster are similarly obtained: . The whitening weights of the third gray cluster are . As the total whitening weights of A11 are , the evaluation coefficient of A11 belonging to the first gray cluster is . The same method is used to obtain ; , and the gray evaluation vector obtained is . The same approach is used to obtain ; . Then, the gray evaluation matrix is obtained: . The same approach is used to obtain
(4) Comprehensive evaluation results
The comprehensive evaluation of A1 is C1, where
The same method is used to obtain ; . When C is the overall comprehensive rating, the equation is equivalent to a single value for the C vector.
V is the gray-level vector, and V = (3, 5, 7). Then, we get a single comprehensive evaluation value . It can be seen from the results of the comprehensive evaluation that the human resources performance of the logistics enterprise is low and needs improvement.
5. Conclusions
Human resources affect the operations of enterprises and are important for participation in market competition. It is very important, therefore, to evaluate the performance of human resources in low-carbon logistics enterprises. We used an index system and AHP to determine the weights of performance evaluation; this helps to avoid deviations caused by human factors. Then, we used the triangular whitening weight function gray evaluation method to evaluate human resources based on the evaluation index. This can help promote innovative reforms in the human resources management of low-carbon logistics enterprises, while further implementing green and sustainable development.
To some extent, this study helps to make up for a lack of relevant research in this area. In addition, constructing a human resource performance evaluation system is important for education in the field of human resource management. Providing a new method for constructing a performance evaluation system can help to make the teaching of human resources management more robust. In addition, the results can serve as a reference for companies to make the best talent decisions and achieve long-term development strategies.
Acknowledgments
This work was supported by the General Research Project for Education and Science of Shanghai (C16064); the Key Project for Undergraduate Education Reform of Colleges and Universities in Shanghai “Research and Practice of Interdisciplinary Cooperation in Shipping Talent Cultivation from the Perspective of Innovation and Entrepreneurship Education”; the Provincial Nature Science Foundation of Guangdong (Nos. 2015A030310271 and 2015A030313679); the Academic Scientific Research Foundation for High-Level Researchers, University of Electronic Science Technology of China, Zhongshan Institute (No. 415YKQ08); the Tianjin Philosophy and Social Science Planning Project (No. TJGL13-028); and the Fundamental Research Funds for the Central Universities (No. ZXH2012N002).
Author Contributions
Writing: Qunzhen Qu, Wenjing Wang, Mengxue Tang, Youhu Lu; Providing case and idea: Sang-Bing Tsai, Jiangtao Wang, Guodong Li, Chih-Lang Yu; Providing revised advice: Qunzhen Qu, Sang-Bing Tsai, Chih-Lang Yu.
Conflicts of Interest
The authors declare no conflict of interest.
References
- Qu, Q.; Zhang, R. The era of low carbon economy shipping enterprise human. Logist. Eng. Manag. Innov. Resour. Manag. 2011, 33, 91–100. [Google Scholar]
- Yuan, H.; Zhou, P.; Zhou, D. What is Low-Carbon Development? A Conceptual Analysis. Energy Procedia 2011, 5, 1706–1707. [Google Scholar] [CrossRef]
- Wang, Y. Discussion on Chinese enterprise logistics low-carbon, low-carbon economy development ideas. Coal Technol. 2011, 259–265. [Google Scholar]
- Wei, W. Based on a low-carbon economy enterprise logistics system redesign. Bus. Time 2011, 10, 25–26. [Google Scholar]
- Ubeda, S.; Arcelus, F.J.; Faulin, J. Green logistics at Eroski: A case study. Prod. Econ. 2011, 131, 44–58. [Google Scholar] [CrossRef]
- Ren, R. Research on human resource management innovation of Chinese enterprises in low carbon economy. J. Yangtze Univ. 2016, 5, 55–65. [Google Scholar]
- Ding, J. Financial Performance Evaluation Based on AHP index weight gravimetric analysis. Bus. Econ. 2009, 2, 21–30. [Google Scholar]
- Song, L. Performance Evaluation Model of College Station based on BSC and AHP Novelty Construction. Intelligence 2011, 8, 1224–1334. [Google Scholar]
- Jin, C.; Zhu, B; Zhang, Q. Evaluation of enterprise innovation capability based on triangular whitenization weight function and its empirical research. J. Southwest Univ. Natly. 2011, 1, 102–110. [Google Scholar]
- Chen, X.; Liu, N. Quantitative research ERP project performance evaluation methods. J. Zhongnan Univ. Grad. 2009, 1, 48–60. [Google Scholar]
- Liu, S.; Xie, N. Gray assess improvements Triangle Whiten Function-based approach. In Proceedings of the 16th National Conference Proceedings Gray System, Wuhan, China, 27–30 October 2008; pp. 124–130. [Google Scholar]
- Tsai, S.B.; Wei, Y.M.; Chen, K.Y.; Xu, L.; Du, P.; Lee, H.C. Evaluating Green Suppliers from Green Environmental Perspective. Environ. Plan. B Plan. Des. 2016, 43, 941–959. [Google Scholar] [CrossRef]
- Tsai, S.B. Using Grey Models for Forecasting China’s Growth Trends in Renewable Energy Consumption. Clean Technol. Environ. Policy 2016, 18, 563–571. [Google Scholar] [CrossRef]
- Deng, X.; Deng, Y.; Chan, F.T.S. An improved operator of combination with adapted conflict. Ann. Oper. Res. 2014, 223, 451–459. [Google Scholar] [CrossRef]
- Guo, J.J.; Tsai, S.B. Discussing and Evaluating Green Supply Chain Suppliers: A Case Study of the Printed Circuit Board Industry in China. S. Afr. J. Ind. Eng. 2015, 26, 56–67. [Google Scholar] [CrossRef]
- Tsai, S.B.; Huang, C.Y.; Wang, C.K.; Chen, Q.; Pan, J.; Wang, G.; Wang, J.; Chin, T.C.; Chang, L.C. Using a Mixed Model to Evaluate Job Satisfaction in High-Tech Industries. PLoS ONE 2016, 11, e0154071. [Google Scholar] [CrossRef] [PubMed]
- Lee, Y.C.; Chu, W.H.; Chen, Q.; Tsai, S.B.; Wang, J.; Dong, W. Integrating DEMATEL Model and Failure Mode and Effects Analysis to Determine the Priority in Solving Production Problems. Adv. Mech. Eng. 2016, 8, 1–12. [Google Scholar] [CrossRef]
- Tsai, S.B.; Xue, Y.; Zhang, J.; Chen, Q.; Liu, Y.; Zhou, J.; Dong, W. Models for Forecasting Growth Trends in Renewable Energy. Renew. Sustain. Energy Rev. 2016. [Google Scholar] [CrossRef]
- Qu, Q.; Chen, K.Y.; Wei, Y.M.; Liu, Y.; Tsai, S.B.; Dong, W. Using Hybrid Model to Evaluate Performance of Innovation and Technology Professionals in Marine Logistics Industry. Math. Probl. Eng. 2015, 2015, 361275. [Google Scholar] [CrossRef]
- Zhou, J.; Wang, Q.; Tsai, S.B.; Xue, Y.; Dong, W. How to Evaluate the Job Satisfaction of Development Personnel. IEEE Trans. Syst. Man Cybern. Syst. 2016. [Google Scholar] [CrossRef]
- Tsai, S.B.; Li, G.; Wu, C.H.; Zheng, Y.; Wang, J. An empirical research on evaluating banks’ credit assessment of corporate customers. SpringerPlus 2016, 5, 2088. [Google Scholar] [CrossRef] [PubMed]
- Su, J.M.; Lee, S.C.; Tsai, S.B.; Lu, T.L. A comprehensive survey of the relationship between self-efficacy and performance for the governmental auditors. SpringerPlus 2016, 5, 508. [Google Scholar] [CrossRef] [PubMed]
- Tsai, S.B.; Lee, Y.C.; Guo, J.J. Using modified grey forecasting models to forecast the growth trends of green materials. Proc. Inst. Mech. Eng. Part B J. Eng. Manuf. 2014, 228, 931–940. [Google Scholar] [CrossRef]
- Lee, Y.C.; Chen, C.Y.; Tsai, S.B.; Wang, C.T. Discussing Green Environmental Performance and Competitive Strategies. Pensee 2014, 76, 190–198. [Google Scholar]
- Tsai, S.B.; Chen, K.Y.; Zhao, H.; Wei, Y.M.; Wang, C.K.; Zheng, Y.; Chang, L.C.; Wang, J. Using a Mixed Model to Explore Evaluation Criteria for Bank Supervision: A Banking Supervision Law Perspective. PLoS ONE 2016, 11, e0167710. [Google Scholar] [CrossRef] [PubMed]
- Chen, H.M.; Wu, C.H.; Tsai, S.B.; Yu, J.; Wang, J.; Zheng, Y. Exploring key factors in online shopping with a hybrid model. SpringerPlus 2016, 5, 2046. [Google Scholar] [CrossRef] [PubMed]
- Deng, X.Y.; Hu, Y.; Deng, Y.; Mahadevan, S. Environmental impact assessment impact assessment based on numbers. Expert Syst. Appl. 2014, 41, 635–643. [Google Scholar] [CrossRef]
- Zhang, X.; Deng, Y.; Chan, F.T.; Xu, P.; Mahadevan, S.; Hu, Y. IFSJSP: A novel methodology for the Job-Shop Scheduling Problem based on intuitionistic fuzzy sets. Int. J. Prod. Res. 2013, 51, 5100–5119. [Google Scholar] [CrossRef]
Figure 1.
Center assessment of the triangle whiten function schematic diagram.

Table 1.
Performance evaluation index hierarchical model.
| Working Ability A1 | Weighting factor U1 | Low-carbon professional knowledge A11 | Weighting factor U11 |
| Low-carbon professional skill A12 | Weighting factor U12 | ||
| Low-carbon innovation potential A13 | Weighting factor U13 | ||
| Working Performance A2 | Weighting factor U2 | Quantity of task completion A21 | Weighting factor U21 |
| Quality of task completion (whether the low-carbon index is achieved) A22 | Weighting factor U22 | ||
| Efficiency of task completion (whether the use of low-carbon skills improved efficiency) A23 | Weighting factor U23 | ||
| Working Attitude A3 | Weighting factor U3 | Discipline A31 | Weighting factor U31 |
| Cooperation (whether seen as part of low-carbon thinking) A32 | Weighting factor U32 | ||
| Enthusiasm A33 | Weighting factor U33 |
Ai represents the first index, Ui represents the weights of the corresponding first index, Aij represents the second index under the corresponding first index, and Uij represents the weights of the corresponding second index (i = 1, 2, 3; j = 1, 2, 3; , ).
Table 2.
Evaluation of classification table.
| Factor A: Factor B Ratio | Compare Quantized Value |
|---|---|
| Factors A and B are equally important | 1 |
| A slightly more important factor than B | 3 |
| A more important factor than B | 5 |
| A very important factor compared to B | 7 |
| A factor is definitely more important than B | 9 |
| AB adjacent judgment intermediate value | 2, 4, 6, 8 |
| Backward count of the upper figure is the reciprocal comparison of the two factors |
Table 3.
Average random consistency index.
| n | 1 | 2 | 3 | 4 | 5 | 6 | 7 | 8 | 9 |
|---|---|---|---|---|---|---|---|---|---|
| R.I | 0 | 0 | 0.58 | 0.90 | 1.12 | 1.24 | 1.32 | 1.41 | 1.45 |
Table 4.
Classification index.
| Grade | Excellent | Good | Moderate | Poor | Very Poor |
|---|---|---|---|---|---|
| Points | 9 | 7 | 5 | 3 | 1 |
© 2017 by the authors. Licensee MDPI, Basel, Switzerland. This article is an open access article distributed under the terms and conditions of the Creative Commons Attribution (CC BY) license (http://creativecommons.org/licenses/by/4.0/).
Share and Cite
MDPI and ACS Style
Qu, Q.; Wang, W.; Tang, M.; Lu, Y.; Tsai, S.-B.; Wang, J.; Li, G.; Yu, C.-L. A Performance Evaluation Study of Human Resources in Low-Carbon Logistics Enterprises. Sustainability 2017, 9, 632. https://doi.org/10.3390/su9040632
AMA Style
Qu Q, Wang W, Tang M, Lu Y, Tsai S-B, Wang J, Li G, Yu C-L. A Performance Evaluation Study of Human Resources in Low-Carbon Logistics Enterprises. Sustainability. 2017; 9(4):632. https://doi.org/10.3390/su9040632
Chicago/Turabian StyleQu, Qunzhen, Wenjing Wang, Mengxue Tang, Youhu Lu, Sang-Bing Tsai, Jiangtao Wang, Guodong Li, and Chih-Lang Yu. 2017. "A Performance Evaluation Study of Human Resources in Low-Carbon Logistics Enterprises" Sustainability 9, no. 4: 632. https://doi.org/10.3390/su9040632
Note that from the first issue of 2016, this journal uses article numbers instead of page numbers. See further details here.