
A Duration Prediction Using a Material-Based Progress Management Methodology for Construction Operation Plans


Department of Architectural Engineering, Inha University, 100 Inharo, Nam-gu, Incheon 22212, Korea
*
Author to whom correspondence should be addressed.
Sustainability 2017, 9(4), 635; https://doi.org/10.3390/su9040635
Submission received: 14 March 2017
/
Revised: 7 April 2017
/
Accepted: 14 April 2017
/
Published: 18 April 2017
Abstract
:Precise and accurate prediction models for duration and cost enable contractors to improve their decision making for effective resource management in terms of sustainability in construction. Previous studies have been limited to cost-based estimations, but this study focuses on a material-based progress management method. Cost-based estimations typically used in construction, such as the earned value method, rely on comparing the planned budget with the actual cost. However, accurately planning budgets requires analysis of many factors, such as the financial status of the sectors involved. Furthermore, there is a higher possibility of changes in the budget than in the total amount of material used during construction, which is deduced from the quantity take-off from drawings and specifications. Accordingly, this study proposes a material-based progress management methodology, which was developed using different predictive analysis models (regression, neural network, and auto-regressive moving average) as well as datasets on material and labor, which can be extracted from daily work reports from contractors. A case study on actual datasets was conducted, and the results show that the proposed methodology can be efficiently used for progress management in construction.
1. Introduction
Construction projects have become increasingly large and complex, and they require precise and accurate analysis of data to establish reliable construction plans [1,2,3]. Reliable construction plans ensure that resources such as materials, labor, and equipment can be allocated appropriately prior to actual operations. This saves time and money and can secure the sustainability of the construction project [4]. Construction plans established before starting construction are important indicators of how to utilize such resources effectively during the construction period. This makes it possible to implement efficient progress management [5,6]. Accurate progress management must be performed to deliver a project on time, especially in the construction phase. Comparing the actual performance to the plans can be done to improve workflows and mitigate rework and delays [7]. Deviations in progress from the plan can be detected by monitoring activities, which can be used for more accurate determination of feasible time information for future start and finish dates of later activities [8,9].
Progress monitoring is conventionally performed based on the final total cost. In South Korea, most construction companies use the Cost Breakdown Structure (CBS) to monitor construction progress [10]. The Earned Value Management System (EVMS) is another method of progress monitoring based on costs and is widely used worldwide in current construction projects. However, this method is time-consuming, and the analysis is conducted at only the project or activity levels but not the operation level among the hierarchy levels in construction management [11]. Analysis at the project or activity level is generally conducted by comparing the total cost actually spent at the completion date to the planned cost. Such information is not reliable or useful for establishing effective strategies due to the lack of information in the early stages of the construction [11,12].
To overcome this limitation, this study proposes a material-based progress monitoring methodology using data extracted from daily work reports, which have generally been used to report actual construction progress by contractors at the operation level in regard to the actual material delivered and installed at construction sites. The total amount of material required to finish the operation is determined by quantity take-off from the drawings and specifications. This measure is considered to be a more accurate estimate than cost, which might vary substantially depending on when it is estimated [13]. Accordingly, material-based progress monitoring is expected to provide a more reliable reference since the estimated material quantities show little variance compared to the estimated cost. Quantified comparative results were obtained using three predictive methods: Multiple Regression Analysis (MRA), an Artificial Neural Network (ANN), and the Auto-Regressive Moving Average (ARIMA).
Using MRA and ANN, the relationship between materials and labor was analyzed to develop prediction models by setting the materials as a dependent variable and labor as an independent variable. The results show how much labor must be involved to complete the remaining work. ARIMA is applied to make predictions based on the relationship between materials and time flow. The results of these three methods could assist in determining a proper predictive method for material-based progress monitoring based on the characteristics of each job site.
2. Previous Works
2.1. Construction Performance Prediction for Operation Plan
One of the goals of construction management for successful implementation in construction operations is to establish feasible construction plans. To establish such plans, many studies indicate that the following steps must be taken. First, data generated in construction sites are collected and then converted into meaningful information. Finally, construction performance metrics such as productivity and costs are predicted based on the construction information prior to actual operations [5,11,14]. Reliable duration estimation based on the predicted construction performance is crucial for estimating feasible construction plans. Studies on cost-based progress management methodologies such as EVMS have been conducted to achieve reliable duration estimation [3,6].
Cost-based monitoring compares the spent cost collected at the project or activity level with the budget at the beginning of the project. However, this method shows limitations in practical applications in that the reliability of the cost cannot be ensured due to its large variance. To overcome this limitation, this study proposes a monitoring methodology using the quantities of materials, which shows less variance than costs.
2.2. Progress Monitoring with New Technologies
For effective progress management, several studies introduced methods with various technologies capable of detecting resources directly at construction sites. Technologies have been developed based on Radio Frequency Identification (RFID) to monitor the location and time information of materials [15,16]. Laser scanning has also been used to monitor changes in terrain information [17,18]. In addition, vision systems based on detecting technologies using photogrammetry have been introduced [19,20]. These technologies enable easy and automatic detection of resources. However, most of them are limited to prototypes for application to Building Information Modeling (BIM), in which effective progress management can be implemented. The suggested monitoring methodology can assist site personnel in estimating the duration by comparing the results of predictive methods with a preliminary operation plan and immediately taking the necessary actions.
2.3. Construction Duration Prediction
Several studies focus on prediction of construction duration with various decision-making methods. These studies present methods for productivity or duration prediction using a case-reasoning model, a statistical analysis based on historical data, and a regression analytic model, among other methods [21,22,23,24]. They also introduce several methods capable of predicting construction durations using specific independent variables, which were collected by methods such as surveys, interviews, and literature reviews. However, for practical application, there is a need for a more efficient way of using general data, which site personnel typically collect and report on a daily basis at a construction site. This study proposes a predictive methodology that focuses on extracted data from daily work reports consisting of daily information on the amount of labor, equipment, and materials.
3. Materials and Methods
The daily work report is a document written by the general contractors and sub-contractors. In South Korea, this document is generally used to estimate the amount of work done to measure the amount of payment required based on the unit cost of each item. The daily work reports are stored in written documents or commercial software. Major construction companies in South Korea have also developed web-based systems for more efficient management of the documents.
Work reports contain massive amounts of quantitative data that can be analyzed and provide significant information for construction projects. The daily work reports used in this study were collected from web based systems, and an example of a report template is shown in Figure 1. Predictive methods are used in this study to analyze specific trends of the cumulative amount of material, which must be managed to compare the current amount used with the total amount required to finish the operation. This analysis is similar to that of EVMS, where the cumulative cost is the main comparison criterion for planned cost versus actual cost. The duration of the operation can be predicted by estimating the time required for the actual cumulative amount of material to reach the total amount estimated based on the quantity take-off. The analysis procedure is shown in Figure 2.
MRA is a statistical method that has been widely applied in various fields. The method considers the relationship between dependent and independent variables and suggests a prediction model and has been analyzed and developed in various studies [25,26,27]. MRA has advantages of suggesting prediction models in the form of simple equations and providing statistical results that show the relationship between each independent and dependent variable. Analysis of variance (ANOVA) was used to verify the MRA models, and a t-test was used to verify the coefficients. The multicollinearity was tested using the Variance Inflation Factor (VIF), and the Durbin–Watson statistic was used to test the autocorrelation of the dependent variable. Equation (1) is a typical formula of MRA models:
where is a constant value, is a coefficient of , is an independent variable, and is the dependent variable.
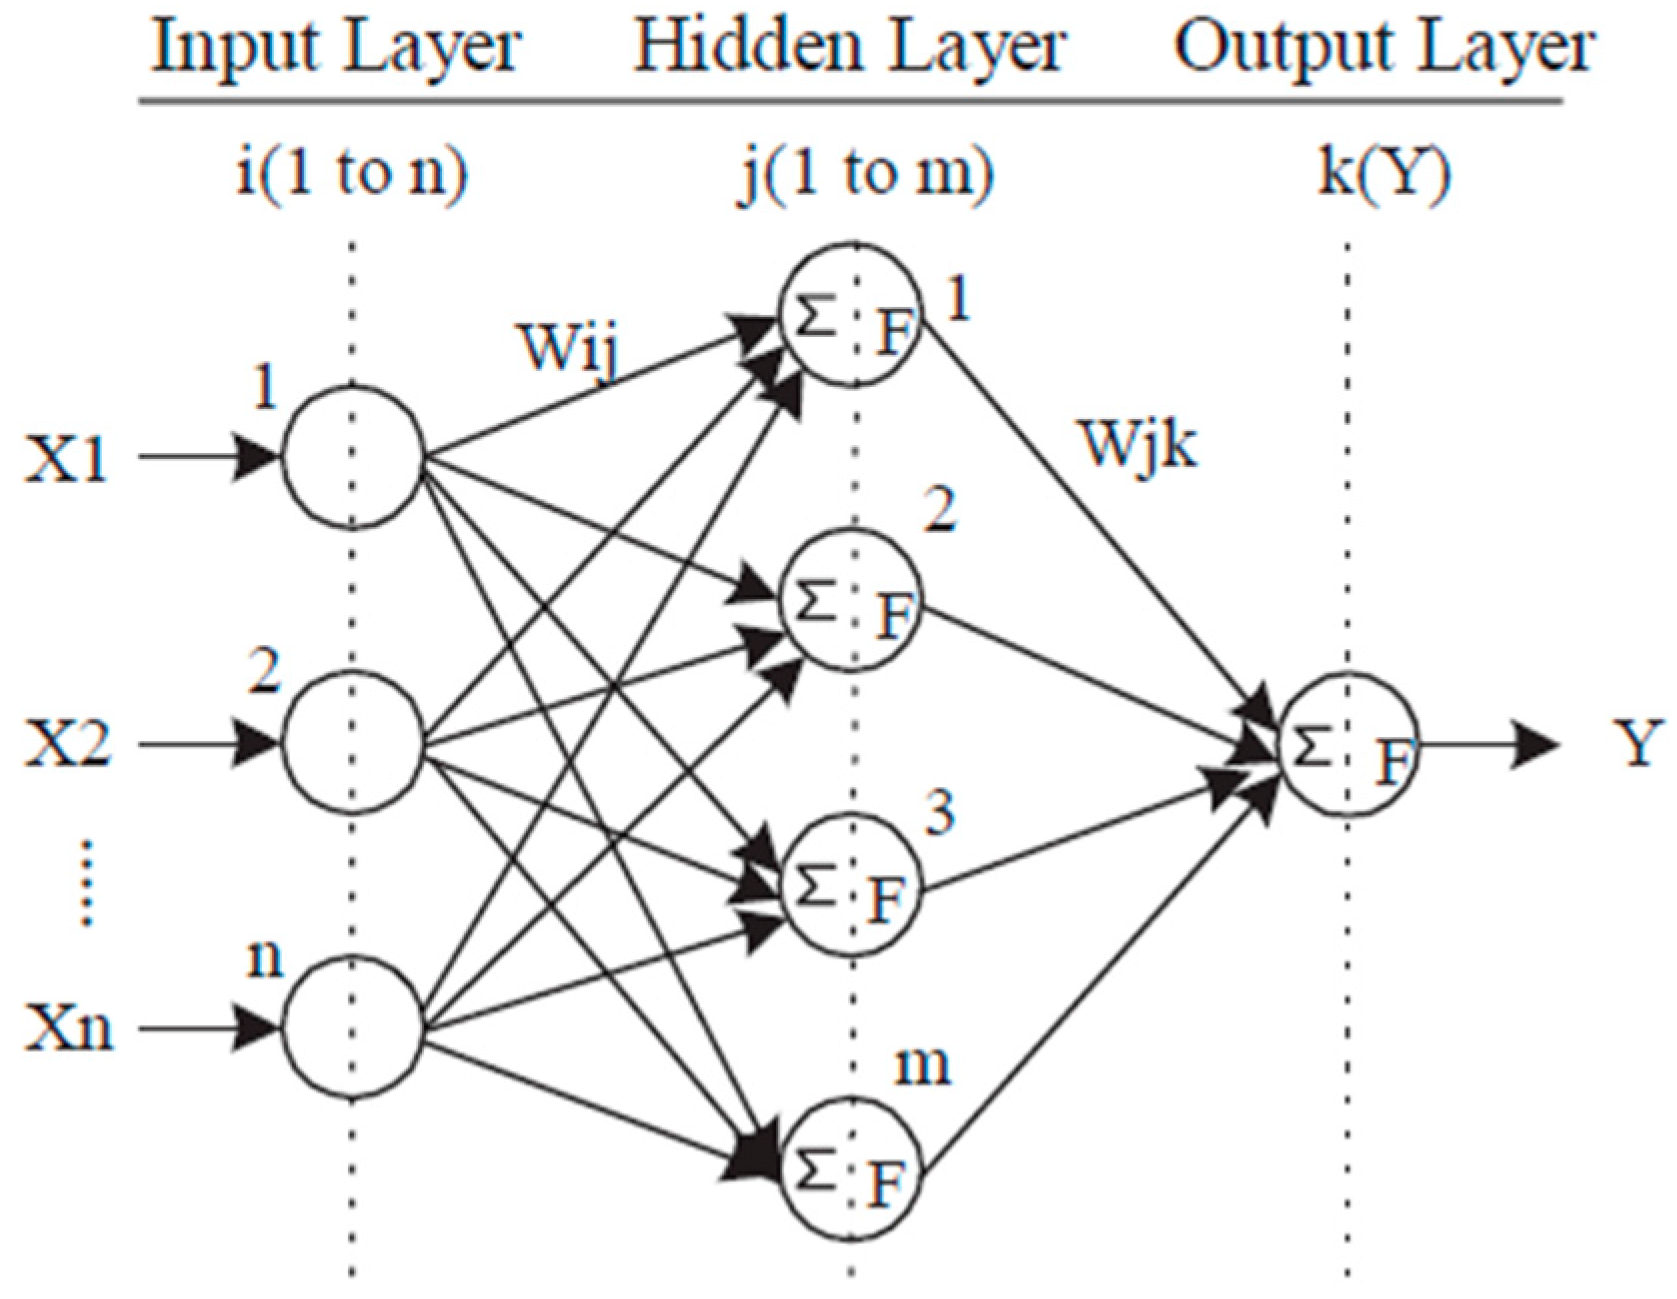
An ANN is a computer system that simulates the learning process of human neurons. Among the various training methods, the Back Propagation Network (BPN) method is the most widely used because of its effectiveness and short learning time [28]. The BPN method was used to develop a prediction model with the basic network structure shown in Figure 3 [29]. The neurons in the input layer do not perform calculations, while the neurons in the hidden layer perform summations and functions. There are various functions for such ANN structures, but this study uses the hyperbolic tangent function. The mathematical expression for the basic structure of the BPN is shown in Equation (2):
where is the output of the neuron, is the threshold of the neuron, and is the transfer function.
The main task of the ANN is to update the connection weights until the total error reaches a desired value that is defined by the user. An appropriate target error must be defined so that the system will converge. Although the ANN provides precise predictive results, it does not provide the same results as MRA. The ANN results vary according to the training. However, the prediction results are generally more accurate than those of MRA. An ANN was developed using a sensitivity analysis of the number of neurons in the hidden layer, error back-propagation, and thresholds that give the lowest root mean square error (RMSE). Equation (3) is used to calculate the RMSE:
ARIMA is used to analyze the trends of datasets that change based on the same time units, such as weeks, months, or years. ARIMA is designed for stationary time series of data with constant statistical properties such as the mean and variance. Prior to developing ARIMA models, the periodic variations and systematic changes must be identified and removed [30], which was done using an autocorrelation function (ACF). In general, ACFs for non-stationary data differ significantly, depending on the number of time lags. This can be solved by using a differencing method to calculate the differences of the series and create a new series. The original data can be changed from non-stationary to stationary by identifying the appropriate amount of differences.
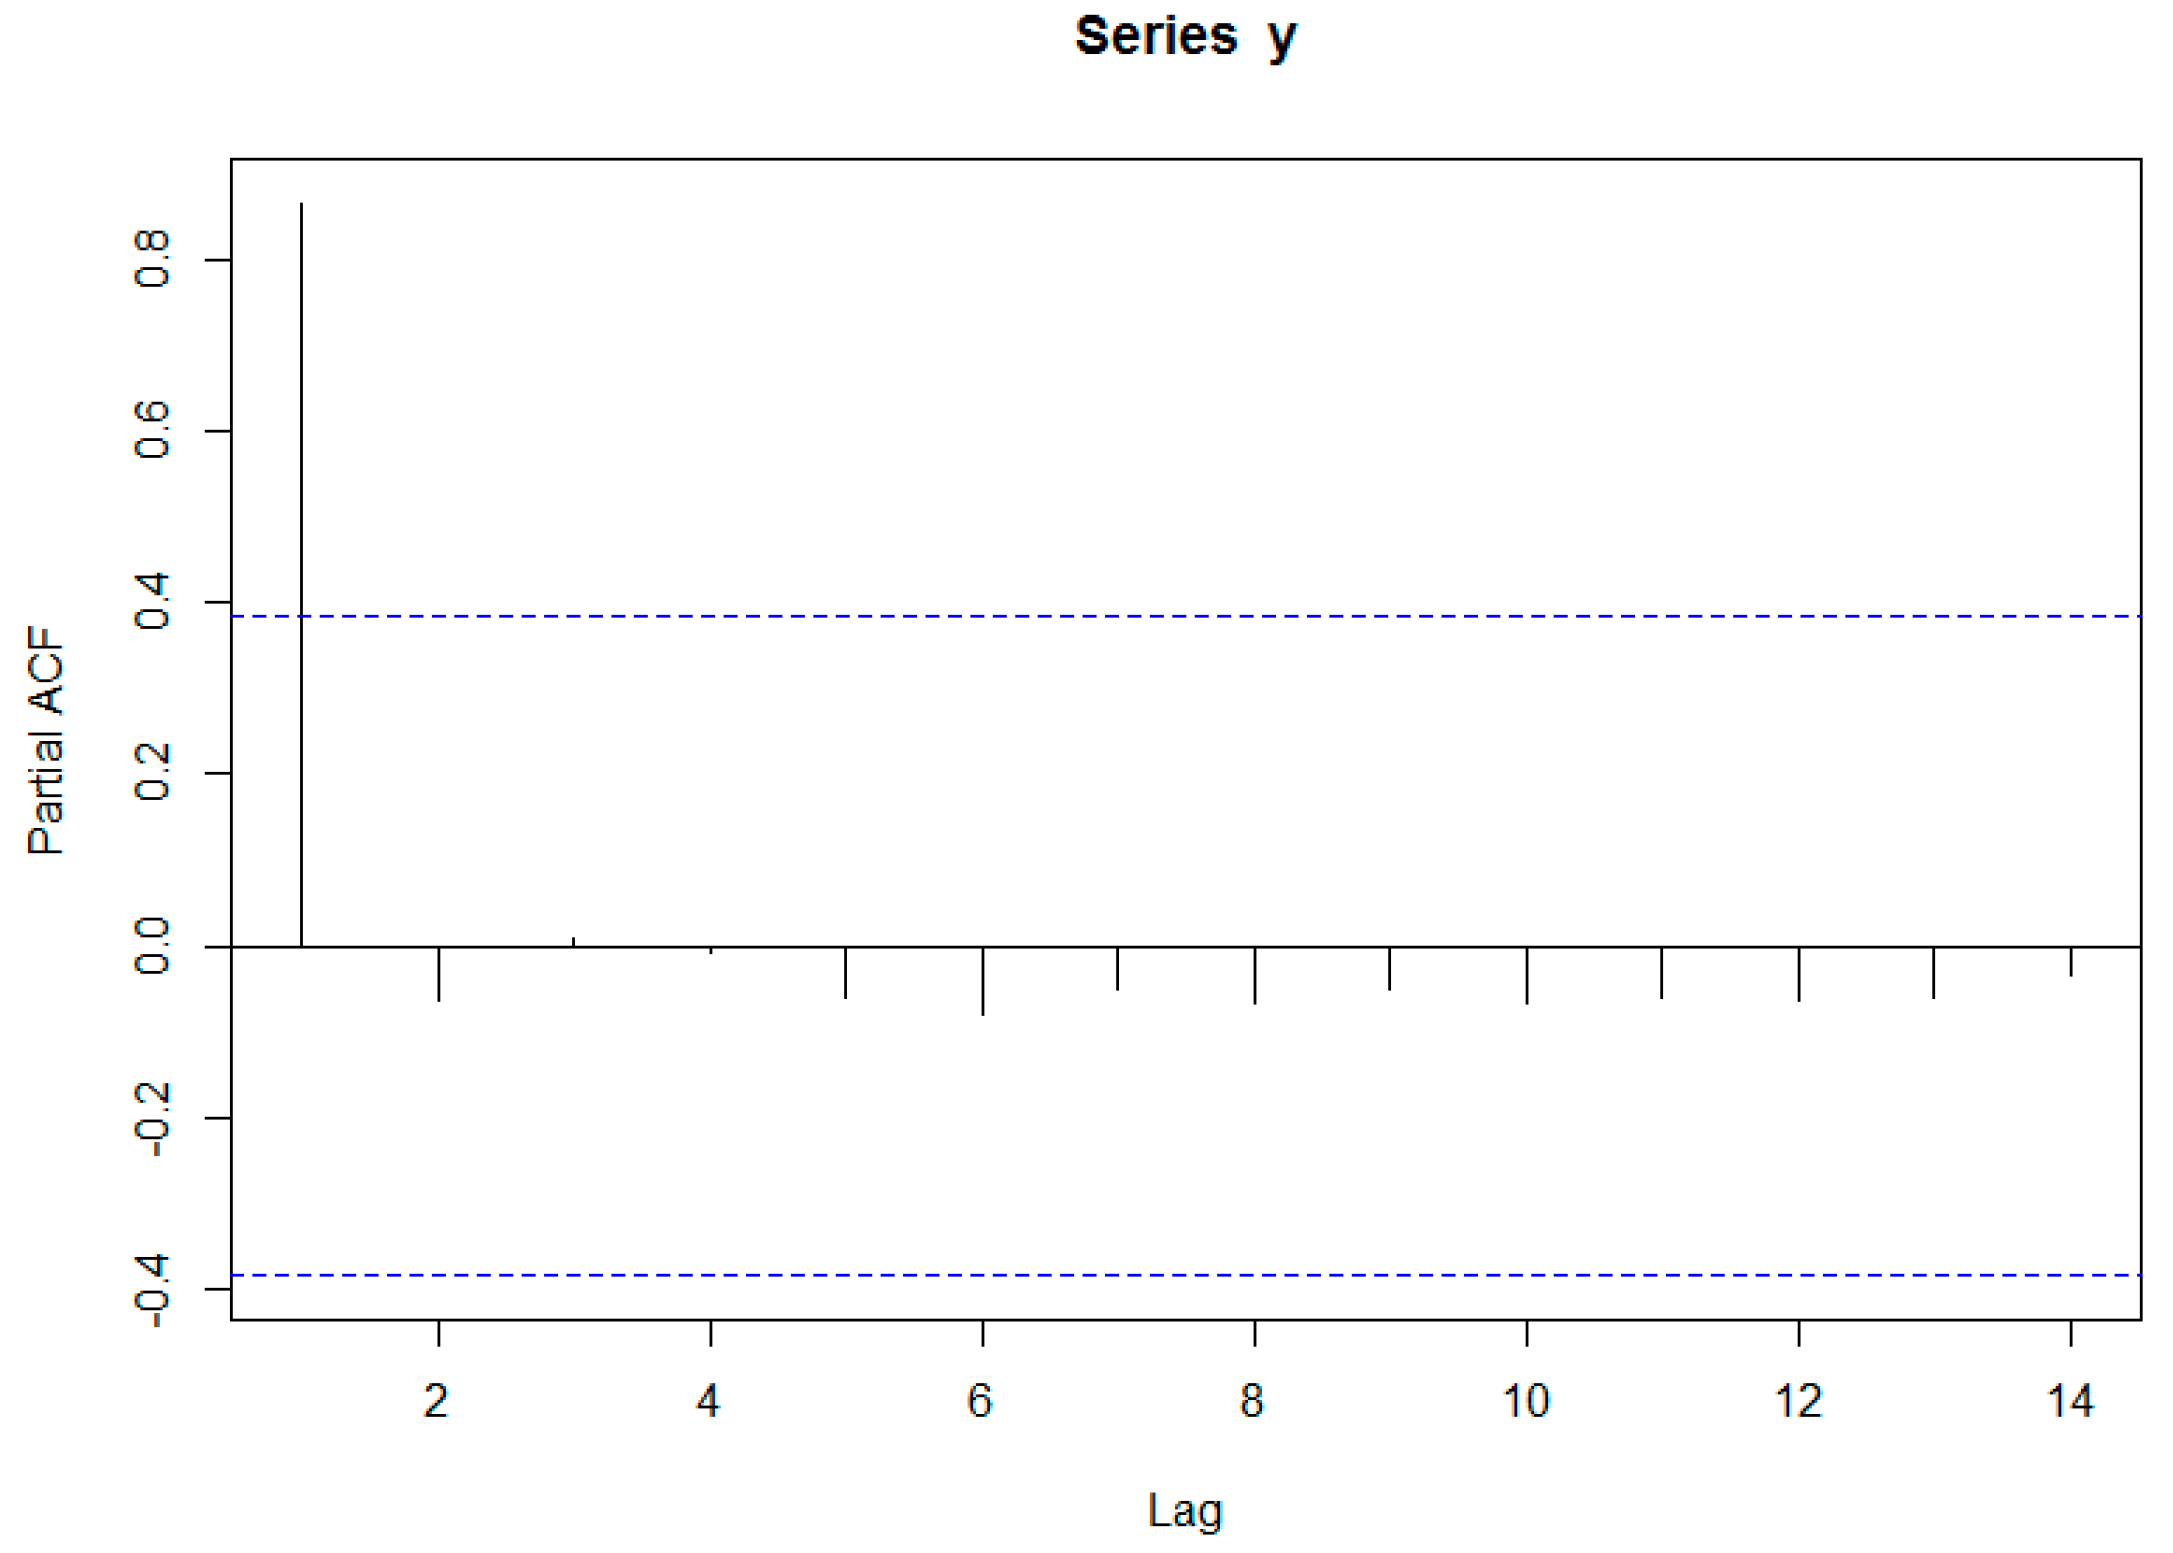
The order of the autoregressive and moving average are deduced based on the behavior of the ACF and the partial autocorrelation function (PACF). The ARIMA is then deduced based on the autoregressive moving average (ARMA) for a non-stationary dataset that has been changed to a stationary dataset. Equation (4) is a typical form of ARMA models:
where is a constant value, is the forecast target variable at time t; and are the coefficients of the AR and MA models; is the forecast value of at time (); and . The model identification procedure based on ACF and PACF is shown in Table 1.
Since the original material and labor data are not time series data, a time series dataset was obtained by calculating the cumulative amount of material as Equation (5):
ARIMA models were tested by changing the order of the autoregressive model (), degree of differencing (), and order of the moving average (). The model with the highest prediction accuracy was selected.
The data extracted from the daily work reports were divided into three groups. A dataset of the last four weeks was set aside for later comparison of the ARIMA models to the MRA and ANN. For the rest of the data, 90% were used to develop the MRA and ANN models, and 10% were used for verification. All of the models were implemented using the computer language R version 3.2.4 in R Studio. The function was used for MRA, was used for ANN, and was used for ARIMA. The prediction accuracy of each model was calculated using Equations (6) and (7) based on the mean absolute percentage error (MAPE) and prediction accuracy (PA):
A case study using actual data was conducted with focus on the structural operation, which represents over 50% of the total duration of a construction project [31]. Lee (2009) suggests that the structural operation represents 40–60% of the total project cost [32]. This study focuses on the rebar installation, which is the most labor-intensive part of the structural operation. This is important because if the operations are more labor-intensive, stronger relationships are expected between materials and labor. Accordingly, a part of the database related to rebar installation was used to apply the predictive methods. As a result, a dataset representing 37 weeks was obtained with one material item (rebar) and five labor items. The data were obtained from an office building project in a metropolitan area in Yongin, Kyeonggi-Do, South Korea. The main properties of the project are summarized in Table 2.
A set of 699 daily work reports was obtained for the case study. The reports include 35 types of materials, 26 types of equipment, and 90 types of labor used during 699 calendar days. A matrix-form database consisting of 151 rows and 699 columns was established based on the quantitative data extracted from the reports. The data are summarized in Table 3. is the amount of rebar in units of tons; is the amount of labor dealing with metal; is the amount of foremen; is the amount of rebar installers; is the amount of labor dealing with concrete; and is the amount of labor dealing with forms (installation and dismantling).
4. Results
The MRA models were first developed by setting the amount of rebar () as a dependent variable and the amounts of labor (–) as independent variables. A stepwise backward method was used to develop the models. This method is used to obtain the best dependent variables to use in the MRA model. The results provide a model with an of 0.654, an adjusted of 0.607, and a standard error of the estimate of 15.713. The Durbin–Watson statistics were calculated as 1.186, which means that there was no severe autocorrelation.
The ANOVA results show that the model is adequate (F-statistics: 13.846, p-value: 0.000). , , and were chosen as a result of the stepwise backward method. The t-test results of the coefficients are summarized in Table 4. All VIF values are lower than 10, which means that there is no multicollinearity between the dependent variables. The resulting MRA model is shown in Equation (8).
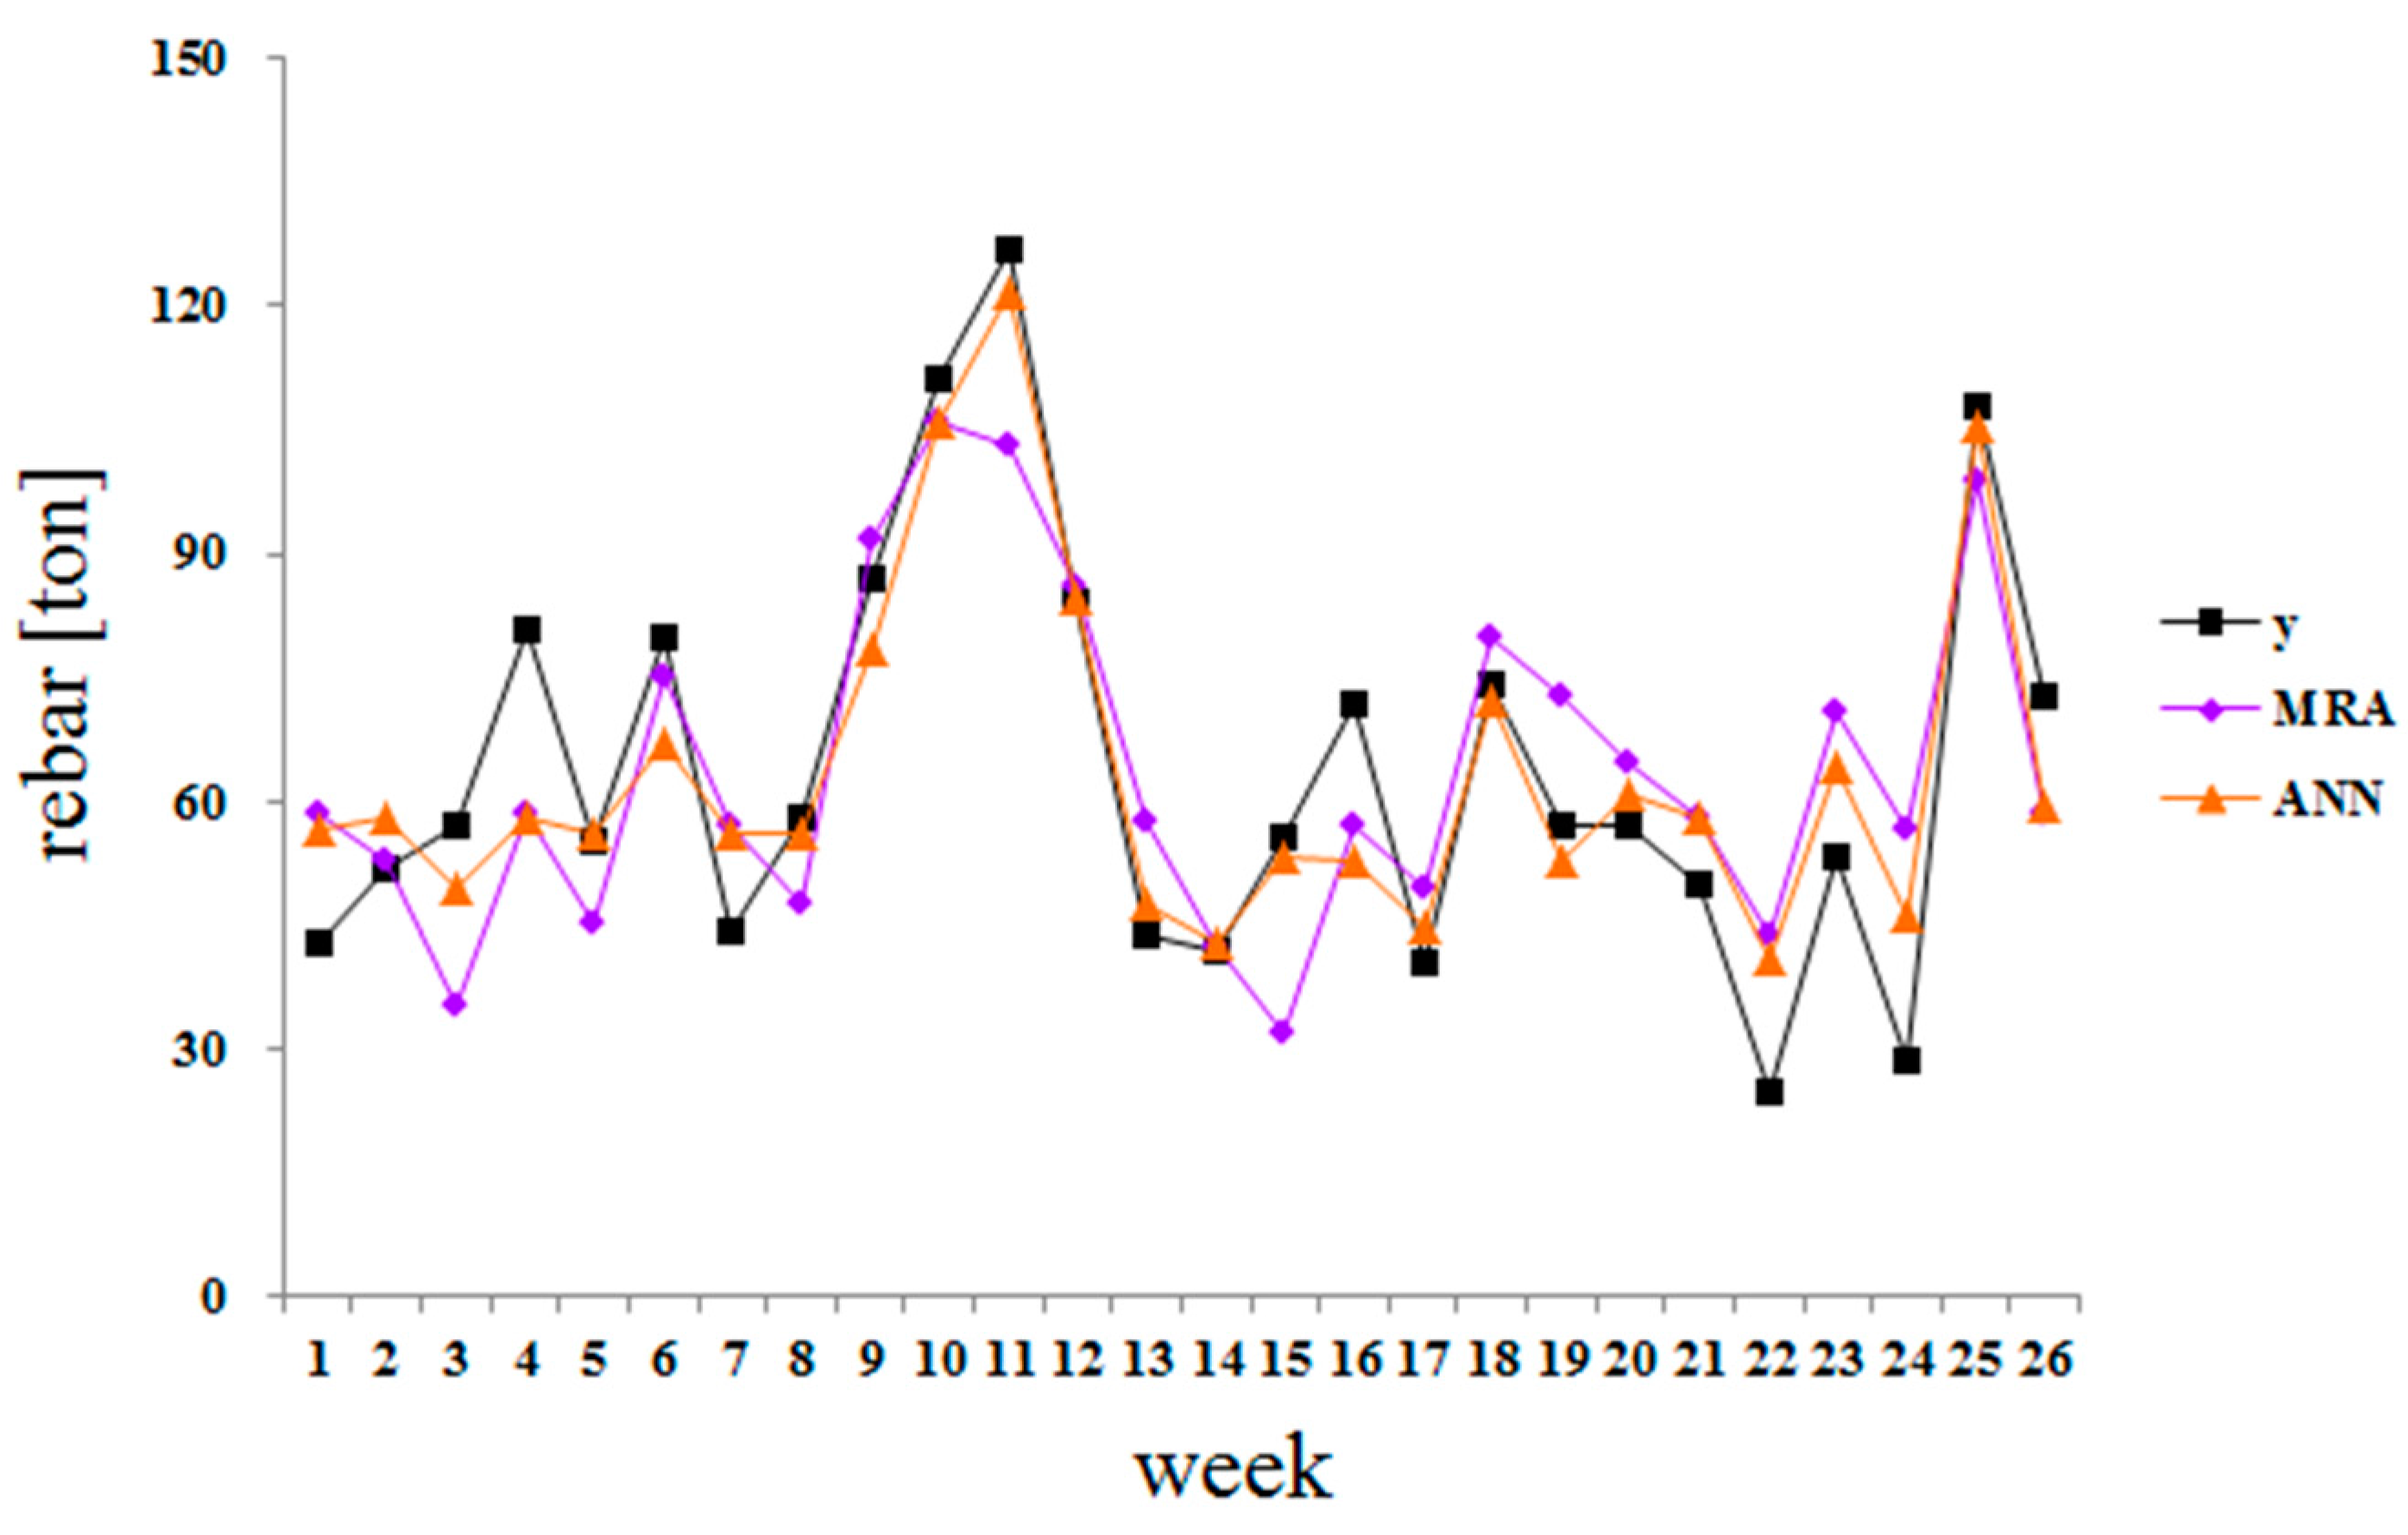
The ANN was then applied by setting as a dependent variable and , , and as independent variables. A sensitivity analysis was carried out for the number of neurons in the hidden layer, and the best model was produced using two neurons. The resulting RMSE was 9.992. Table 5 shows the MAPE and PA values of the MRA and ANN for both the training and test data, and Figure 4 shows a graph comparing the actual values to the estimated values.
For the ARIMA models, the ACF and PACF were plotted to investigate whether or not differencing is required, as shown in Figure 5 and Figure 6. is the cumulative amount of rebar calculated by Equation (5).
As shown in Figure 5, the ACF decreased very slowly, which indicates that the data are not stationary and require differencing. One differencing was sufficient to make the rebar data stationary. The results show that AR(1) is the most adequate model. Accordingly, after adding a differencing term, the ARI(1,1) model was selected as the most adequate. The final model can be expressed as Equation (9):
where is the AR(1) parameter estimate, which was computed as 0.31. The constant is 64.26, and is an error term. The MAPE of the model was calculated as 3.62, and PA was 96.38%.
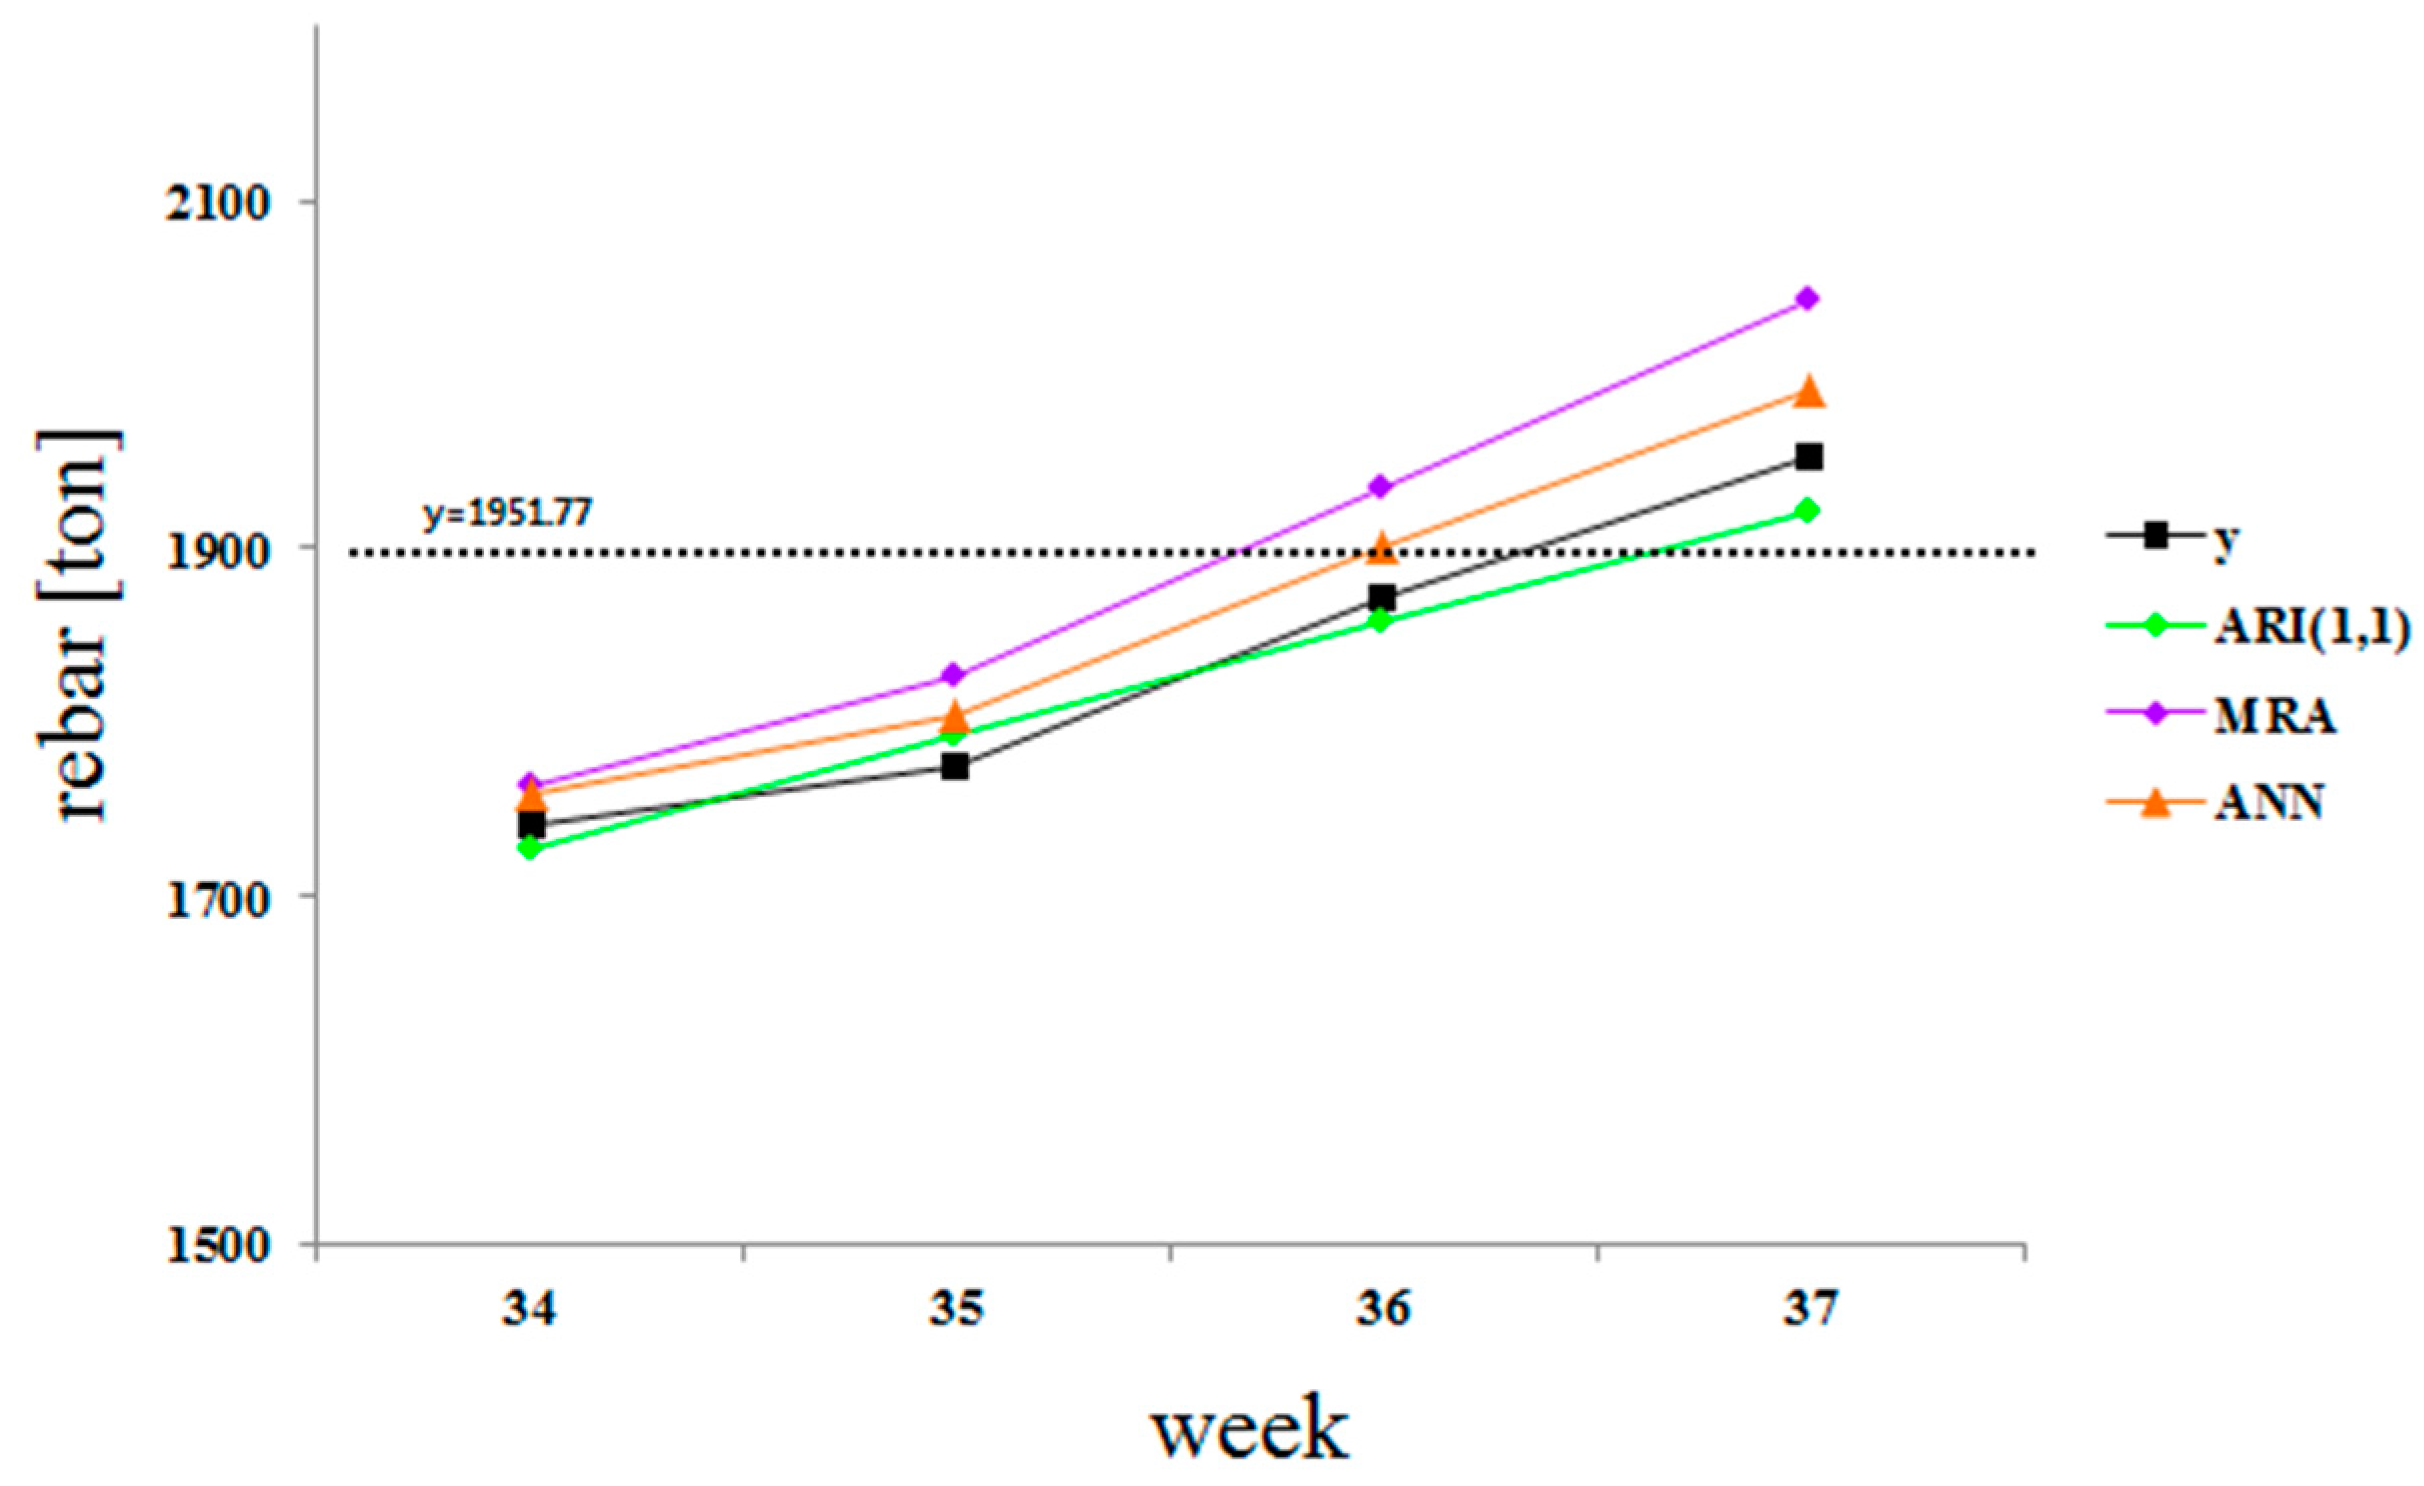
The MRA, ANN, and ARI(1,1) models were then tested to predict the duration for the remaining work. The actual operation was conducted in 37 weeks. Data from the first 33 weeks were used to develop and verify the models. The cumulative amount of rebar installed until week 33 was estimated as 1656.44 tons, and the total amount of rebar estimated for completion was 1951.77 tons. Therefore, the MRA and ANN were tested by applying the actual amount of labor to these models and determining if the prediction results match 1951.77 tons. The results were compared with the prediction results of the ARI(1,1) model, which predicts the cumulative amount of rebar based on the time series trend. Figure 7 shows a graph of the results, and Table 6 shows the MAPE and PA calculated for the four-week period.
5. Discussion
The analysis carried out in the previous chapter dealt with the application of Step 2. In Figure 2, MRA and ANN were used to develop predictive models based on the relationship of material and labor. The estimated values by MRA and ANN were recomputed as cumulative data using Equation (5) for the comparison with ARIMA. ARIMA was used to develop predictive models based on the time series trend of material. The results show that ARI(1,1) had the best prediction accuracy of 98.99%, followed by 84.27% for ANN. MRA had the lowest prediction accuracy of 61.27%. The ARI(1,1) model successfully estimated the duration for remaining work with 98.99% accuracy. Thus, the model could be used to predict that four more weeks are required to finish the remaining work for this operation if the current trend in the amount of material used is maintained. The MRA and ANN models could also be used after modification in future studies.
These results indicate that the rebar installation is more affected by the time series trend than the relationship with the amount of labor. For further development of the research methodology, other prediction methods must be tested to obtain higher prediction accuracy than that of the typical ANN and MRA. Despite the low prediction accuracy of MRA, this step was essential for deducing the most significant independent variables, which were used to develop ANN models. Unlike MRA, ANN produced an acceptable prediction accuracy that can be used for adjusting the labor management plans for remaining work. Personnel at a construction site can use these models as reliable references for the estimation of the amount of labor required to finish the remaining work.
The amount of time required to finish the remaining work can be also determined by the ARI(1,1) model. The results of the case study show that a similar time series trend continued until the end of the operation. Thus, ARI(1,1) produced high prediction accuracy. However, more projects must be analyzed to suggest more generalized results. Considering that the case study was a typical office building project in a metropolitan area, different projects with more repetitive operations are expected to result in higher prediction accuracy for MRA and ANN. This is expected due to the higher size of data samples, which has a significant influence on the prediction accuracy of the models. Accordingly, future studies are needed to optimize the prediction results for both the amount of labor and time series trends for practical applications in construction projects.
The proposed methodology shown in this study could also be used in the planning phase prior to construction. The developed prediction models could be used as a reliable reference for similar construction projects in the future for more reliable labor and progress management. This procedure requires systemization of the suggested methodology to generate a database automatically based on the quantitative data stored in daily work reports. Such systems can be used for developing prediction models for various types of projects.
6. Conclusions
This study has proposed a material-based progress management method using predictive methods based on MRA, ANN, and ARIMA, which were quantitatively compared. The results have shown that the time series trend has more of an impact than the amount of labor. However, the methods used for the relationship analysis of materials and labor were typical types of MRA and ANN. It is expected that higher prediction accuracy can be achieved by applying enhanced MRA and ANN models such as nonlinear regression, as well as other training methods for ANN rather than the traditional BPN.
This study also presented how to use these methods as a reliable reference for construction site managers for effective scheduling. In general, decision making for such purposes is done based on the experience of the practitioners, which cannot be neglected. However, reference models such as those suggested in this study should also be used to avoid critical misjudgments that could result in serious cost overruns and delays. The proposed methods are expected to contribute to the further development of Project Management Information Systems (PMIS) for general contractors and construction managers, which can be used effectively for scheduling based on actual data analysis.
The contributions of this study can be summarized from two main perspectives. The data deduced from daily work reports can provide significant information on the progress management in construction sites. Also, the typical types of MRA, ANN, and ARIMA can be used efficiently for construction data, which generally produce lower prediction accuracy than in other industries. The new approach to progress management based on materials is expected to be more accurate than using cost since variance is smaller.
More cases and more methods must be tested in future work, since the present study analyzed only one project as a case study. Moreover, systemization of the proposed methodology is expected to be very beneficial for the enhancement of current PMIS systems for general contractors, who have massive amounts of daily work report data. The development of a system that automatically extracts material and labor data from daily work reports will provide a better chance for the analysis of various types of construction projects and will help to secure sustainable management of construction data for future projects.
Acknowledgments
This work was supported by the Basic Science Research Program through the National Research Foundation of Korea (NRF), with funding from the Ministry of Education (NRF-2015R1D1A1A01058221). The authors gratefully acknowledge this support.
Author Contributions
Yongho Ko and Seungwoo Han were involved in data collection and information extraction from raw data, with assistance from site personnel at the construction site where the data were obtained. All of the empirical material was analyzed by Yongho Ko. The manuscript was written by Yongho Ko and Seungwoo Han.
Conflicts of Interest
The authors declare no conflicts of interest.
References
- Park, M.; Ha, S.; Lee, H.; Choi, Y.; Kim, H.; Han, S. Lifting demand-based zoning for minimizing worker vertical transportation time in high-rise building construction. Automat. Constr. 2013, 32, 88–95. [Google Scholar] [CrossRef]
- Han, S.; Lee, T.; Ko, Y. Implementation of construction performance database prototype for curtain wall operation in high-rise building construction. J. Asian Archit. Build. 2014, 13, 149–156. [Google Scholar] [CrossRef]
- Han, S.; Ko, Y.; Hong, T.; Koo, C.; Lee, S. Framework for the validation of simulation-based productivity analysis: Focused on curtain wall construction process. J. Civ. Eng. Manag. 2017, 23, 163–172. [Google Scholar] [CrossRef]
- Markelj, J.; Kitek Kuzman, M.; Grošelj, P.; Zbašnik-Senegačnik, M. A simplified method for evaluating building sustainability in the early design phase for architects. Sustainability 2014, 6, 8775–8795. [Google Scholar] [CrossRef]
- Hong, T.; Cho, K.; Hyun, C.; Han, S. Simulation-based schedule estimation model for ACS-based core wall construction of high-rise building. J. Constr. Eng. Manag. ASCE 2011, 137, 393–402. [Google Scholar] [CrossRef]
- Yang, K.; Lee, H.; Park, M.; Jung, M.; Hwang, S. A study of the tower crane hoisting time estimation simulation model with climate element for the high-rise building construction. Korean J. Constr. Eng. Manag. 2013, 14, 96–107. [Google Scholar] [CrossRef]
- Matthews, J.; Love, P.E.; Heinemann, S.; Chandler, R.; Rumsey, C.; Olatunj, O. Real time progress management: Re-engineering processes for cloud-based BIM in construction. Automat. Constr. 2015, 58, 38–47. [Google Scholar] [CrossRef]
- Turkan, Y.; Bosche, F.; Haas, C.T.; Haas, R. Automated progress tracking using 4D schedule and 3D sensing technologies. Automat. Constr. 2012, 22, 414–421. [Google Scholar] [CrossRef]
- Kim, C.; Son, H.; Kim, C. Automated construction progress measurement using a 4D building information model and 3D data. Automat. Constr. 2013, 31, 75–82. [Google Scholar] [CrossRef]
- Jeon, S.H. Development of Progress Forecasting Models Based on Cost-Weighted Labor in Apartment Construction Projects. Ph.D. Dissertation, University of Seoul, Seoul, Korea, 2011. [Google Scholar]
- Halpin, D.W.; Senior, B.A. Construction Management, 4th ed.; John Wiley & Sons, Inc.: Hoboken, NJ, USA, 2012; pp. 11–18. [Google Scholar]
- Hinze, J.W. Construction Planning and Scheduling, 3rd ed.; Pearson Education International: Upper Saddle River, NJ, USA, 2008; pp. 232–241. [Google Scholar]
- Dimitrov, A.; Golparvar-Fard, M. Vision-based material recognition for automated monitoring of construction progress and generating building information modeling from unordered site image collections. Adv. Eng. Inform. 2014, 28, 37–49. [Google Scholar] [CrossRef]
- Shin, Y.; Cho, H.; Kang, K. Simulation model incorporating genetic algorithms for optimal temporary hoist planning in high-rise building construction. Automat. Constr. 2011, 20, 550–558. [Google Scholar] [CrossRef]
- Navon, R.; Sacks, R. Assessing research in automated project performance control (APPC). Automat. Constr. 2007, 16, 474–484. [Google Scholar] [CrossRef]
- Jaselskis, E.; El-Misalami, T. Implementing radio frequency identification in the construction process. J. Constr. Eng. Manag ASCE. 2003, 129, 680–688. [Google Scholar] [CrossRef]
- Akinci, B.; Boukamp, F.; Gordon, C.; Huber, D.; Lyons, C.; Park, K. A formalism for utilization of sensor systems and integrated project models for active construction quality control. Automat. Constr. 2006, 15, 124–138. [Google Scholar] [CrossRef]
- Bosché, F.; Haas, C.T.; Akinci, B. Automated recognition of 3D CAD objects in site laser scans for project 3D status visualization and performance control. J. Comput. Civ. Eng. 2009, 23, 311–318. [Google Scholar] [CrossRef]
- Ibrahim, Y.M.; Kaka, A.P. Review of photographic/imaging applications in construction. Built Hum. Environ. Rev. 2008, 1, 99–117. [Google Scholar]
- Soibelman, L.; Wu, J.; Caldas, C.; Brilakis, I.; Lin, K.Y. Management and analysis of unstructured construction data types. J. Adv. Eng. Inf. 2008, 22, 15–27. [Google Scholar] [CrossRef]
- Ko, Y.; Han, S. Development of construction performance monitoring methodology using the bayesian probabilistic approach. J. Asian Archit. Build. 2015, 14, 73–80. [Google Scholar] [CrossRef]
- Lin, M.C.; Tserng, H.P.; Ho, S.P.; Young, D.L. Developing a construction-duration model based on a historical dataset for building project. J. Civ. Eng. Manag. 2011, 17, 529–539. [Google Scholar] [CrossRef]
- Koo, C.; Hong, T.; Hyun, C.; Koo, K. A CBR-based hybrid model for predicting a construction duration and cost based on project characteristics in multi-family housing projects. Can. J. Civ. Eng. 2010, 37, 739–752. [Google Scholar] [CrossRef]
- Martin, J.; Burrows, T.K.; Pegg, I. Predicting construction duration of building projects. In Proceedings of the XXIII FIG Congress, Munich, Germany, 8–13 October 2006; pp. 1–13. [Google Scholar]
- Motulsky, H.; Ransnas, L. Fitting curves to data using nonlinear regression: A practical and nonmathematical review. FASEB J. 1987, 1, 365–374. [Google Scholar] [PubMed]
- Chang, Y. Hybrid fuzzy least-squares regression analysis and its reliability measures. Fuzzy Sets Syst. 2001, 119, 225–246. [Google Scholar] [CrossRef]
- Steel, M. Bayesian regression analysis with scale mixtures of normalsi. Econ. Theory 2000, 16, 80–101. [Google Scholar]
- Tian, J.; Li, C.; Liu, J.; Yu, F.; Cheng, S.; Zhao, N.; Wan Jaafar, W.Z. Groundwater depth prediction using data-driven models with the assistance of gamma test. Sustainability 2016, 8, 1076. [Google Scholar] [CrossRef]
- Kim, G.; An, S.; Kang, K. Comparison of construction cost estimating models based on regression analysis, neural networks, and case-based reasoning. Build. Environ. 2004, 39, 1235–1242. [Google Scholar] [CrossRef]
- Goh, B.H. Forecasting residential construction demand in Singapore: A comparative study of the accuracy of time series, regression and artificial neural network techniques. Eng. Constr. Archit. Manag. 1998, 5, 261–275. [Google Scholar] [CrossRef]
- Woo, G. The development of a productivity prediction system in the structural framework of apartment housing projects using data mining technique. Archit. Inst. Korea 2008, 24, 113–122. [Google Scholar]
- Lee, I. A Study on the Construction Period Shortening Methods of RC Building. Master’s Dissertation, Hanyang University, Seoul, Korea, 2009. [Google Scholar]
Figure 1.
An example of a daily work report.
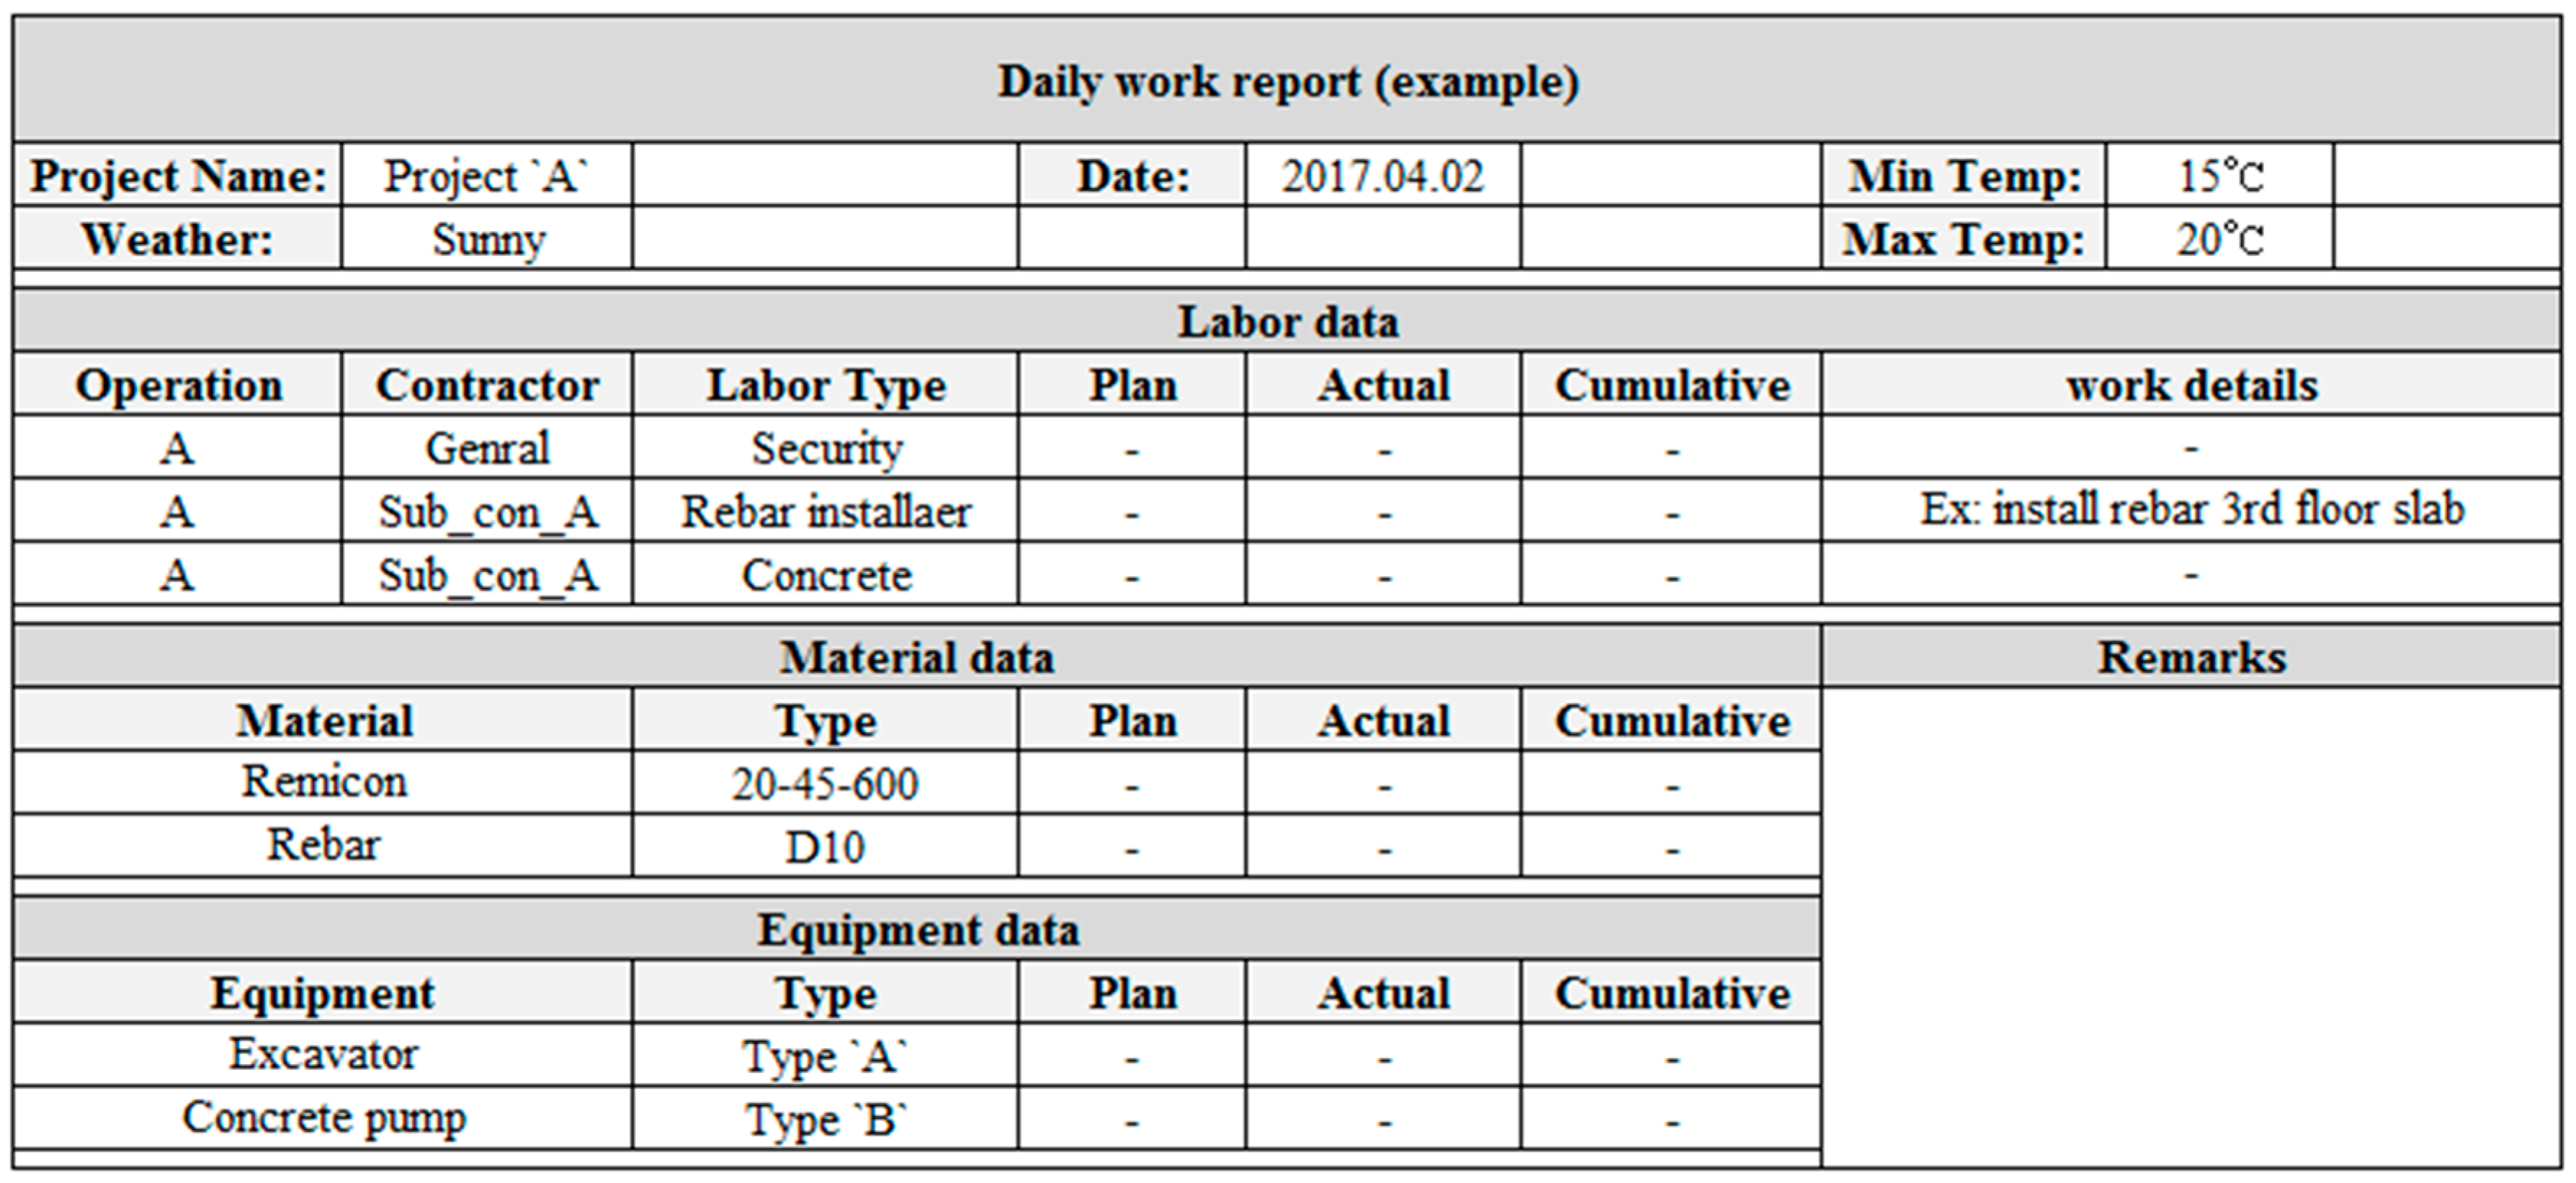
Figure 2.
Analysis procedure of the material-based progress management method.
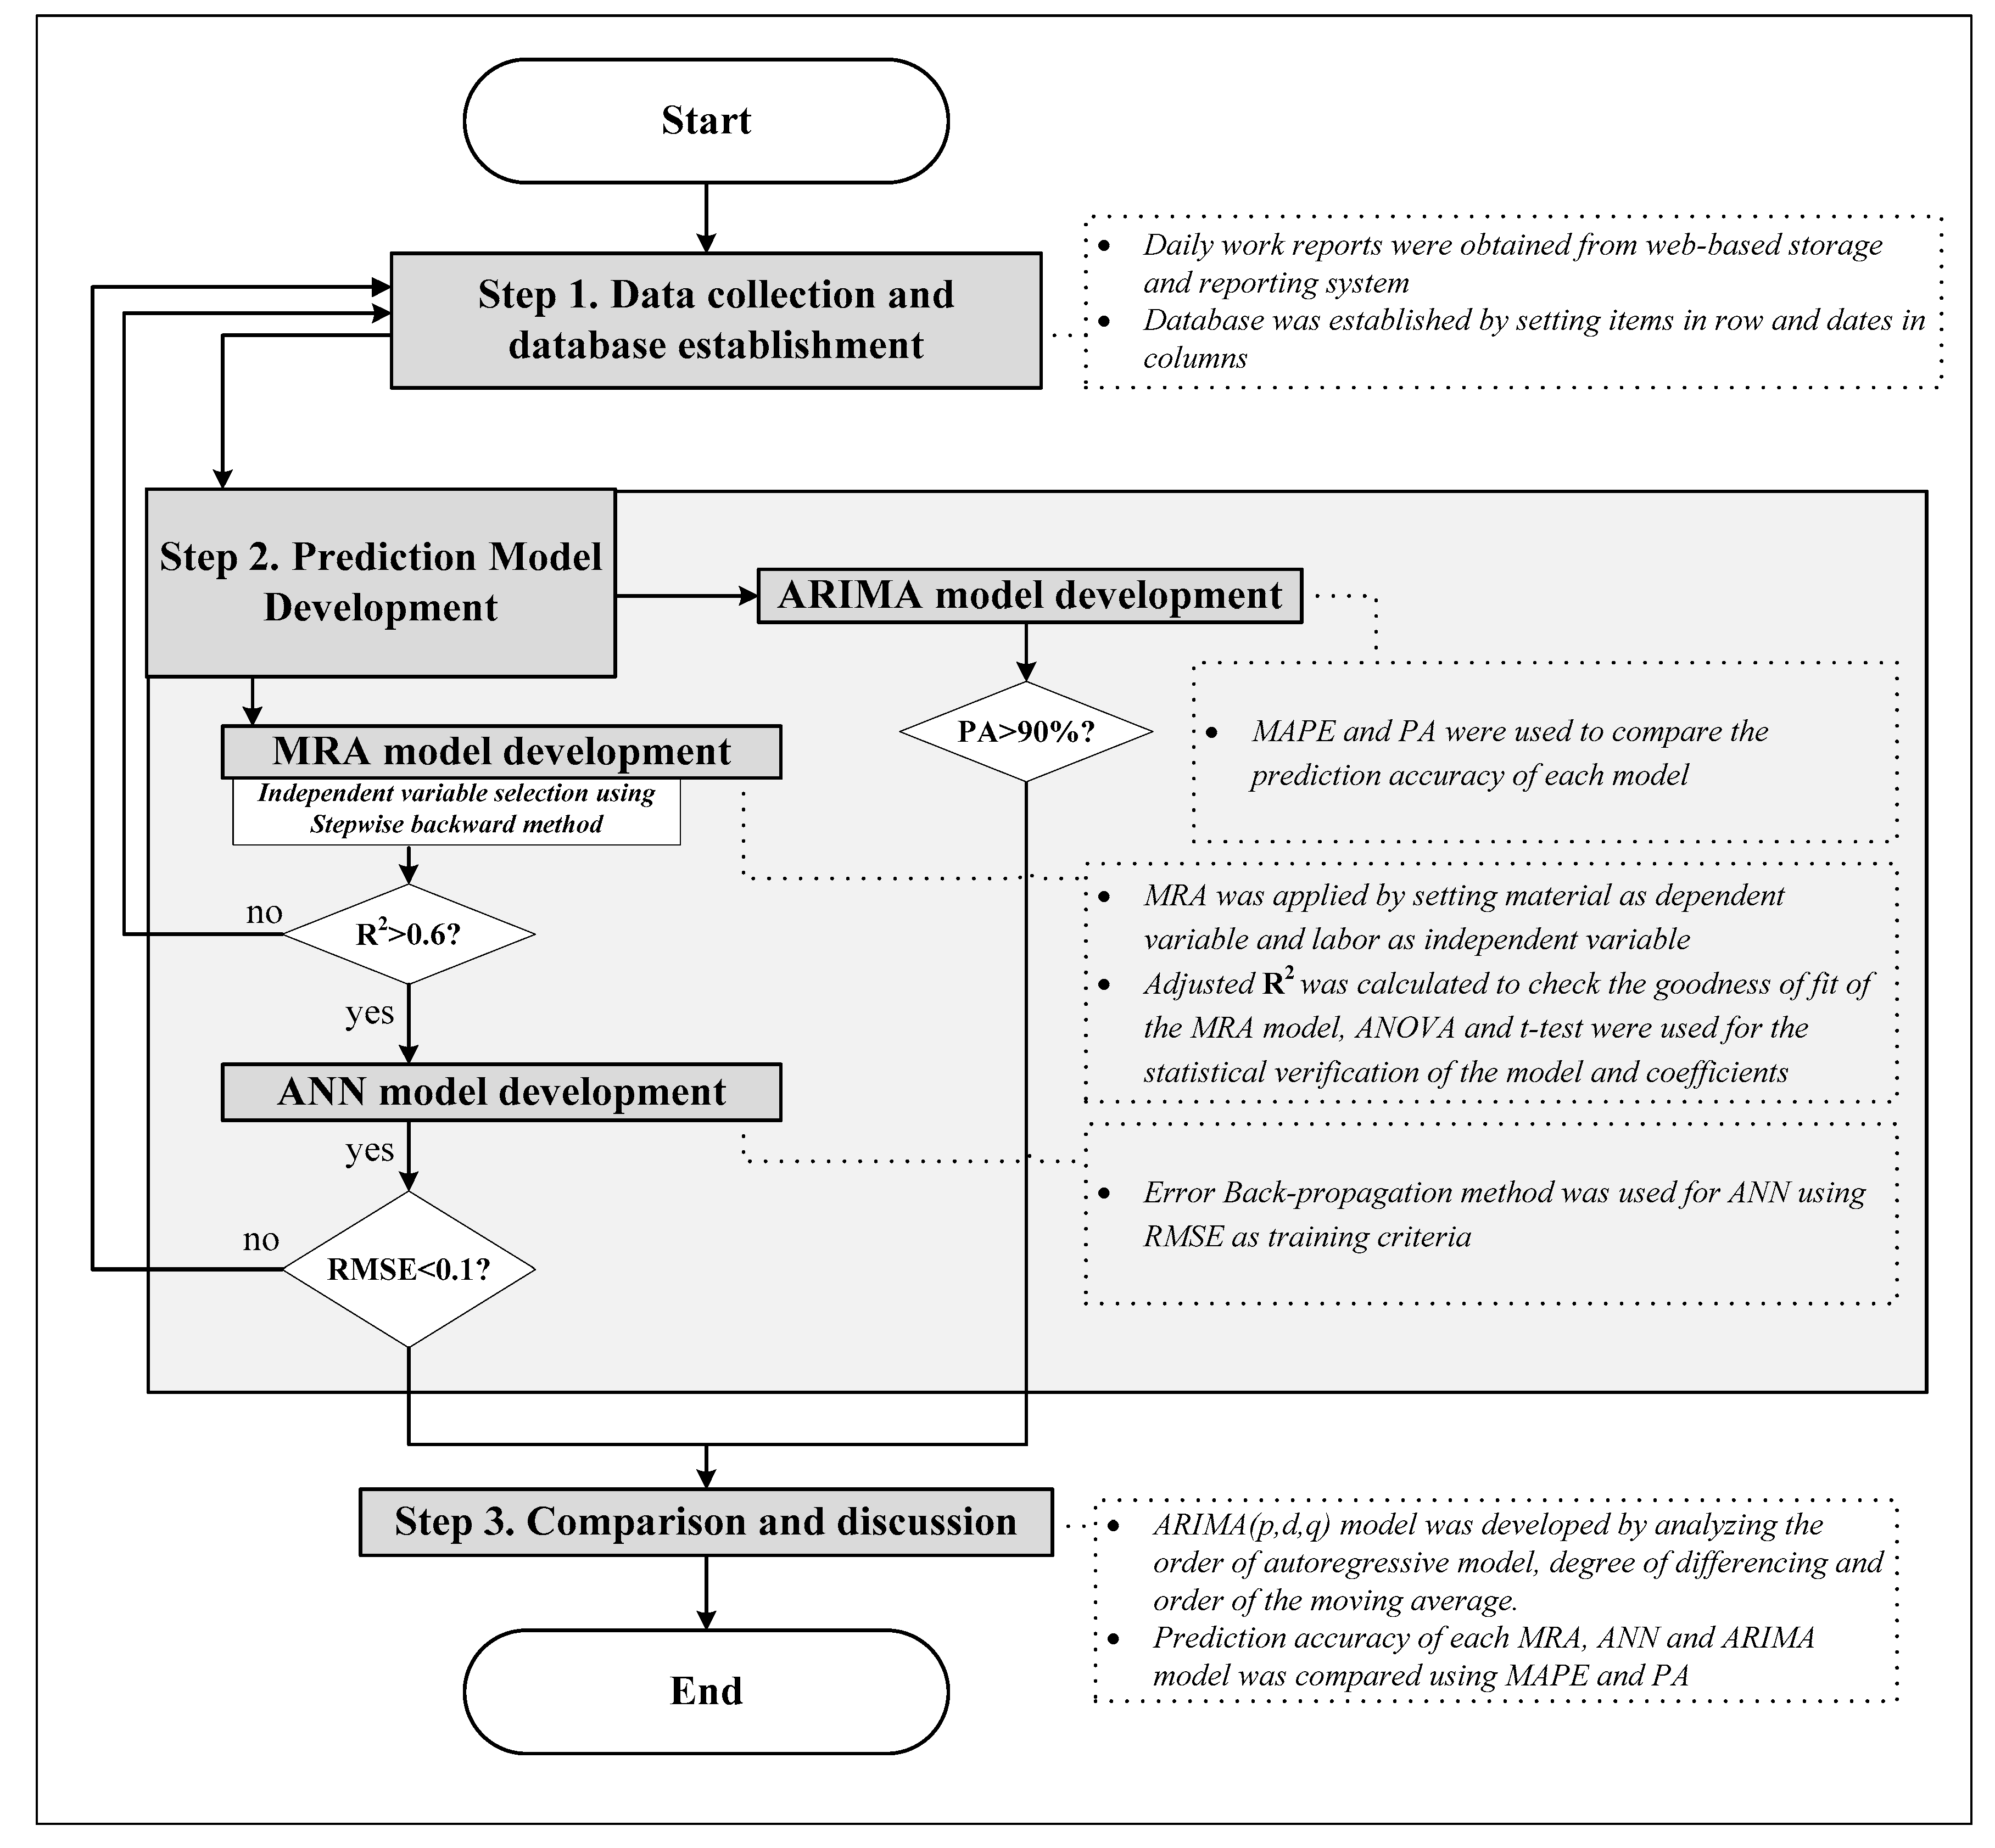
Figure 3.
Basic structure of the Back Propagation Network (BPN).

Figure 4.
Comparison of Multiple Regression Analysis (MRA) and Artificial Neural Network (ANN) with actual rebar installation data.
Figure 4.
Comparison of Multiple Regression Analysis (MRA) and Artificial Neural Network (ANN) with actual rebar installation data.

Figure 5.
ACF graph of the cumulative amount of rebar.

Figure 6.
PACF graph of the cumulative amount of rebar.

Figure 7.
Comparison of Multiple Regression Analysis (MRA), Artificial Neural Network (ANN) and non-stationary autoregressive ARI(1,1) models with actual rebar installation data.
Figure 7.
Comparison of Multiple Regression Analysis (MRA), Artificial Neural Network (ANN) and non-stationary autoregressive ARI(1,1) models with actual rebar installation data.


Table 1.
Model identification procedure based on an autocorrelation function (ACF) and a partial autocorrelation function (PACF).
Table 1.
Model identification procedure based on an autocorrelation function (ACF) and a partial autocorrelation function (PACF).
| ACF | PACF | |
|---|---|---|
| White noise | All zero | All zero |
| MA (q) | Drop off after lag q | Die down |
| AR (p) | Die down | Drops off after lag p |
| ARMA (p,q) | Die down | Die down |
Note. MA: Moving Average, AR: Autoregressive, ARMA: Autoregressive Moving Average.
Table 2.
Outline of the case study.
| Content | Description |
|---|---|
| Project name | Kwangyo Office A |
| Location | Yongin, Kyeonggi-Do, South Korea |
| Lot area | 8673 |
| Gross area | 75,445 |
| Floors | B5F-10F |
| Type | Office building |
Table 3.
Statistical properties of the obtained data.
| Variable | Mean Value | Standard Deviation | Minimum Value | Maximum Value |
|---|---|---|---|---|
| 65.83 | 24.32 | 24.55 | 126.87 | |
| 7.35 | 14.92 | 0.00 | 51.00 | |
| 14.56 | 19.98 | 0.00 | 62.00 | |
| 87.18 | 33.28 | 8.00 | 170.00 | |
| 15.35 | 8.23 | 2.00 | 42.00 | |
| 200.41 | 118.86 | 0.00 | 500.00 |
Table 4.
Significance verification of Multiple Regression Analysis (MRA) coefficient by t-test.
| B | Standard Error | t | p-Value | VIF | |
|---|---|---|---|---|---|
| 28.03 | 9.70 | 2.89 | 0.01 | ||
| 1.03 | 0.34 | 3.02 | 0.01 | 1.04 | |
| 0.47 | 0.09 | 5.38 | 0.00 | 1.03 | |
| −0.05 | 0.03 | −1.87 | 0.07 | 1.07 |
Note: VIF: Variance Inflation Factor.
Table 5.
Mean Absolute Percentage Error (MAPE) and Prediction Accuracy (PA) of Multiple Regression Analysis (MRA) and Artificial Neural Network (ANN) models.
Table 5.
Mean Absolute Percentage Error (MAPE) and Prediction Accuracy (PA) of Multiple Regression Analysis (MRA) and Artificial Neural Network (ANN) models.
| MRA | ANN | |||
|---|---|---|---|---|
| Training | Test | Training | Test | |
| MAPE | 24.05% | 17.09% | 15.60% | 24.87% |
| PA | 75.95% | 82.91% | 84.40% | 75.13% |
Table 6.
Mean Absolute Percentage Error (MAPE) and Prediction Accuracy (PA) of Multiple Regression Analysis (MRA), Artificial Neural Network (ANN) and non-stationary autoregressive ARI(1,1) models for a four-week period.
Table 6.
Mean Absolute Percentage Error (MAPE) and Prediction Accuracy (PA) of Multiple Regression Analysis (MRA), Artificial Neural Network (ANN) and non-stationary autoregressive ARI(1,1) models for a four-week period.
| MRA | ANN | ARI(1,1) | |
|---|---|---|---|
| MAPE | 38.73% | 15.73% | 1.01% |
| PA | 61.27% | 84.27% | 98.99% |
© 2017 by the authors. Licensee MDPI, Basel, Switzerland. This article is an open access article distributed under the terms and conditions of the Creative Commons Attribution (CC BY) license (http://creativecommons.org/licenses/by/4.0/).
Share and Cite
MDPI and ACS Style
Ko, Y.; Han, S. A Duration Prediction Using a Material-Based Progress Management Methodology for Construction Operation Plans. Sustainability 2017, 9, 635. https://doi.org/10.3390/su9040635
AMA Style
Ko Y, Han S. A Duration Prediction Using a Material-Based Progress Management Methodology for Construction Operation Plans. Sustainability. 2017; 9(4):635. https://doi.org/10.3390/su9040635
Chicago/Turabian StyleKo, Yongho, and Seungwoo Han. 2017. "A Duration Prediction Using a Material-Based Progress Management Methodology for Construction Operation Plans" Sustainability 9, no. 4: 635. https://doi.org/10.3390/su9040635
Note that from the first issue of 2016, this journal uses article numbers instead of page numbers. See further details here.