
Measuring Green Growth Efficiency for Chinese Manufacturing Industries


1
Faculty of Management and Economics, Dalian University of Technology, Dalian 116024, China
2
Sino-Us Global Logistics Institute (SUGLI), Shanghai Jiao Tong University, Shanghai 200030, China
3
Department of Management and Law Faculty of Economics, University of Rome Tor Vergata, Via Columbia 2, 00133 Rome, Italy
*
Author to whom correspondence should be addressed.
Sustainability 2017, 9(4), 637; https://doi.org/10.3390/su9040637
Submission received: 13 March 2017
/
Revised: 12 April 2017
/
Accepted: 13 April 2017
/
Published: 18 April 2017
(This article belongs to the Section Energy Sustainability)
Abstract
:As a pillar industry in supporting Chinese economy, Chinese manufacturing industry consumes a large amount of energy and causes serious environmental pollutants. Better understanding the greening level of manufacturing industry is important to promote its green growth. Hence first this study, measures the green growth efficiency for Chinese manufacturing industries by applying the EBM measuring model; second, to better understand the differences and similarity in green growth among those industries, this study categorizes those industries into different types by using cluster analysis. The result shows that within the past nine years, green growth efficiency value for Chinese manufacturing industries rises steadily year by year, and Chinese manufacturing industries have huge promotion potentials in resource saving and environment pollutant reduction. And the characteristics of each different type are analyzed. Finally, policies and suggestions are put forward to promote the green growth of manufacturing industries in China. This study objectively evaluates the green growth level of Chinese manufacturing industry, which is helpful to understand the status quo and also explore green growth path for Chinese manufacturing industries.
1. Introduction
Since Global Economic Crisis in 2008, many developed countries and regions have adopted a series of measures to revitalize the manufacturing industry. For example, the United States has initiated a project named "Advanced Manufacturing Partnership” to solidify its leading position in world markets. Besides, the European Union has been working on re-industrialization aiming at enabling manufacturing to be clean, modern and advanced. In the global value chain, the China’s manufacturing industry is still positioned at the low-end, undertaking those manufacturing activities with low added-value, high resource consumption and high pollution level [1]. The core competitiveness for China’s manufacturing industry mainly depends on cheap labor force and environmental costs. As a pillar industry of China’s national economy, manufacturing industry has contributed to one third of GDP, 90% of total exports, and one third of China’s state revenue. Moreover, it has furnished employment to more than 80 million Chinese people [2]. Despite being the main driving force of China’s economic growth, manufacturing industry consumes much energy and discharges massive pollution. Since 2000, China’s manufacturing industry accounts for 51% of the national energy consumption and 52% of the total industrial exhaust emission [3]. The high-speed economic development of China has often been achieved at the expense of the environment. Thus it is significant for China’s manufacturing industry to transform its resource-consuming and extensive growth into green growth.
The origin of green growth can be traced back to the Green Movement in 1960s, but until 2005, the concept of “green growth” was formally brought forward at the 5th Ministerial Conference on Environment and Development in Asia and the Pacific organized by UNESCAP. The meeting identified “green growth” as a critical path to balance the three pillars of sustainable development [4]. As a way to solve the energy crisis as well as to achieve social and economic development, green growth is in the ascendant throughout the world [5]. In 2007, Ireland invested over EUR 1.3 billion in projects with a direct impact on promoting environmental sustainability. In 2009, the South Korea issued “National Green Growth Strategy”, aiming at “Mitigation of climate change & energy independence” [6]. Facing the increasingly worsening environment problems, Chinese government has recognized the importance of transformation of economic growth model. A series of national initiatives for green development was carried out, including ecological industrial park, circular economy pilot projects and low-carbon pilot city. And at the 18th National Congress of the Chinese Communist Party in 2012, promoting green, cyclic and low-carbon development was again emphasized. Furthermore, “green”, as one of five development philosophies, was called for in China’s 13th Five Year Plan. All above mentioned show the determination of the Chinese central government to move on through green growth.
In this context, it makes sense to promote green growth for the manufacturing industry and even for the national economy. The evaluation of green growth efficiency will strengthen this process. Hence, it is crucial to establish a comprehensive index system to evaluate the green growth efficiency of manufacturing industry. This calls for studies that aid green growth efficiency calculation. Although a lot of related researches have been done, a single index (carbon dioxide or sulfur dioxide emissions) was usually used to evaluate environmental pollution in the previous studies [2,7,8,9,10], which is in contradiction with the complexity of pollutant components. As a useful complement to existing researches, this study tries to combine multiple indicators to establish an environmental pollutant composite index and employs the EBM model to measure the green growth efficiency for manufacturing industries in China. The inputs include labor, capitals and energy while the gross industrial output and the environmental pollutant composite index are taken as the desirable output and the undesirable output, respectively. This study offers a comprehensive available tool for measuring green growth efficiency of the manufacturing industry, and the results will offer helpful information for both government and enterprises in their process of the environmental policy-making and its implementation.
This paper is organized as follows. Section 2 provides a review of the existing literature on Chinese manufacturing industry and green growth of manufacturing industry. Section 3 outlines the methodology and the selection of related indicators. Section 4 summarizes the data and presents research results. Section 5 presents discussions and conclusion.
2. Literature Review
2.1. Environmental Impacts of Chinese Manufacturing Industry
Traditional manufacturing industry consumes a good deal of natural resources and discharges excessive greenhouse gas, which incurs concomitant problems such as global warming, acid rain, soil, air and water pollution and species extinction, etc. [11]. To tackle the crisis, it is vital for manufacturing industry to develop practical methodologies to promote green growth [12]. China, as a manufacturing giant, is expected a long-standing process of industrialization [13]. As the manufacturing industry has made a great contribution to China’s economic growth, it also brings environmental challenges. On a global scale, China’s manufacturing industry has been considered as the sector consuming the most resources and energy and having the highest eco-footprint, which could be a contributing factor in the external community in the world. The energy-intensive industries are the leading contributors to CO2 emissions of Chinese manufacturing industry, such as iron and steel, chemical products, automotive and metal manufacturing industries [14]. Among factors affecting environmental pollution, low energy efficiency is one of the biggest contributors to CO2 emissions of manufacturing industry [15]. Despite growing awareness of the dangers of environmental decline, sustainable development is not yet common practice in the manufacturing industry [16]. Therefore, exploring a way to realize the sustainable development is a feasible solution for China’s manufacturing industry.
2.2. Green Growth
When the concept of green growth was first proposed by UNESCAP, it was defined as a similar meaning of ‘‘sustainable development’’. With the increasing emphasis on green growth, international organizations and scholars of different countries put forward their own point of view. For example, green growth was identified as a subset of sustainable development, meaning “fostering economic growth and development, while ensuring that natural assets continue to provide the resources and environmental services on which our well-being relies”, in the OECD Meeting of the Council at Ministerial Level in 2011 [17]. In 2013, Global Green Growth Institute (GGGI) identified the green economy as “increased human well-being and social equity, as well as reduced environmental risks and ecological scarcities” [9]. Most of scholars approve that green growth originates from the concept of sustainable development [18,19]. In this respect, green growth can be viewed as the reduction of conflicts between economic growth and environmental quality, accompanied by social goals that address the distribution of resources, damages or benefits [18]. The objective of green growth is to deliver a new path for economic development by means of strong policy instruments, including tools to foster innovation, investment, and competition in exploring new sources of economic growth [20]. The concept of green growth leads a new model that not only suggests various solutions to cope with the current environmental challenges, but also represents an opportunity to simultaneously improve people’s quality of life, alleviate poverty, create decent jobs, promote sustainable investment and enhance the company’s competitiveness [21]. Although the definitions vary among researchers, there is a common belief that green growth is a growth model that promotes the sustainable development of economic, social and environment.
2.3. Green Policy on Manufacturing Industry
To guide and stimulate manufacturing stakeholders to change behaviors, countries and regions all over the world have defined a set of environmental policies and rules, including emission permits system, environmental tax, environmental quality management system and environment performance evaluation, etc. A series of environmental policies and measurement on energy conservation and emission reduction has been promulgated to improve energy efficiency of manufacturing industry, especially for energy-intensive industries [22]. For example, relying on a panel data regression analysis, Zheng et al. found the positive effects of energy saving regulations on regional air quality [23]. Trochu et al. studied the problem of procurement and manufacturing planning under environmental regulations applying an integer linear programming model. The result showed that eco-designed products and clean technologies may yield cost reduction and reduce the compensation significantly and accordingly the enterprise could improve competitiveness [24].
Environmental innovation, Cainelli and Mazzanti investigated the factors influencing environmental innovation in services and came to a conclusion that cooperation, training, environmental management systems and public funding played key roles in environmental innovation processes [25]. Through a joint theoretical-empirical investigation, Cainelli et al. found that firms located in regions featuring better separated waste collection and stricter waste policy were more likely to adopt environmental innovation [26].
Good consequences have been achieved since steelmaking, cement and chemical manufacturing was included in the European Union Emissions Trading Scheme and carbon trading were allowed in the EU in 2005 [27]. Bassi et al. examined the impacts of energy price changes resulting from different carbon-pricing policies on the competitiveness of selected US energy-intensive industries [28]. The results indicated that climate policies on carbon pricing could have substantial impact on the US energy-intensive manufacturing sectors over the next two decades, if no action was taken to invest in advanced low- and no-carbon technologies. Furthermore, subsidies can promote energy-intensive and pollution-intensive industries to consume clean energy in place of fossil fuel and thereby improve energy efficiency.
2.4. Green Growth Efficiency of Manufacturing Industries
The world energy council defined “energy efficiency” as reducing energy inputs to provide equal energy services [29]. Recently, the concept of energy efficiency under considering the environmental factors, often called green efficiency or eco-efficiency, has been given more research concerns in recent years. Since the green growth efficiency of manufacturing industry relates directly with the sustainable social development, it has been widely concerned by scholars of all countries recently. Despite various opinions about the definition, scholars provided their own insight by introducing the index system of green growth efficiency. Egilmez applied Economic Input-Output Life Cycle Assessment (EIO-LCA) and Data Envelopment Analysis (DEA) to analyze the eco-efficiency of manufacturing sectors in the United States, taking greenhouse gas emissions, energy use, water withdrawals, hazardous waste generation, and toxic releases of each manufacturing sector into account [10]. The results showed that energy consumption had the highest sensitivity to the eco-efficiency of U.S. manufacturing sectors. Yücel and Mehmet, taking capitals, labor and power consumption as inputs, the industrial gross output as the desirable output and carbon dioxide emissions as the undesirable output, measured the efficiency and total-factor energy efficiency of the manufacturing industry in 26 regions of Turkey between the years 2003 and 2012 using a four-stage DEA model [8]. They found that the Turkish manufacturing industry had an average electricity savings potential of 39.7%. Ramli employed the Range Adjusted Measure (RAM) model to evaluate the eco-efficiency of the manufacturing industry in Malaysia [7]. The operating costs and capitals were taken as the inputs and the sales and carbon dioxide emissions were regarded as the desirable output and the undesirable output, respectively.
In the context of the Chinese manufacturing industry, Wang Shanshan and Qu Xiao’e calculated the total factor energy efficiency indexes for Chinese manufacturing industry between 2003 and 2008, using non- parametric data envelopment analysis DEA- Malmquist exponential method [2]. They set an index system, including capitals and labor as inputs, manufacturing industry output as the desirable output and sulfur dioxide emissions as the undesirable output. Chen Guanju discussed the energy efficiencies of 30 Chinese manufacturing industries using Stochastic Frontier Approach based on the Cobb-Doulas production function. They found that the differences between industries were remarkable [30].
Overall, among the above-mentioned studies, there is a remarkable similarity in the input indexes. The gross industrial output is commonly used as the desirable output. On the part of the undesirable output, which represents the degree of environmental pollution, sulfur dioxide emission or carbon dioxide emission is often employed singly. To show the integrity of the environmental pollution, a comprehensive approach is still needed. In terms of measuring method, data envelopment analysis (DEA) is an efficient approach to measure green growth efficiency of manufacturing industry, which is also the research method in this study.
3. Methodology
3.1. EBM Model
The DEA is a non-parametric technical efficiency analysis approach used to measure the relative efficiency of a set of decision making units (DMU). Due to its flexibility and applicability, DEA has been applied to multiple domains, including environmental management, business administration, agriculture, finance, public transportation, macro economy, and so forth. The conventional DEA model was the CCR model [31] and it assumes constant returns to scale [32]. In 1984, Banker, Charnes and Cooper proposed the BBC model with variable returns to scale [33]. Although the BBC model rules out the influence of the scale and obtains pure technical efficiency, the model has no regard for the presence of slack variables. The Directional Distance Function (DDF) model proposed by Chung et al is widely recognized because it is able to make a distinction between desirable outputs and undesirable ones [34]. However, the DDF model as a radial model may overrate the technical efficiency if the input slack and the output slack exist [35]. Tone puts forward the SBM model, a non-radial model based on slack variables, and the model can measure the inefficient state of both inputs and outputs simultaneously [36]. The SBM model has obvious drawbacks, too. The SBM model captures the non-radial slacks, which may lose the original proportionality of the SBM-projection to the efficient frontier [32]. Besides, in the solution of linear programming, the optimal slacks tend to exhibit a sharp contrast to taking positive and zero values [37]. Tone and Tsutsui provided a new approach named the EBM model to solve the problem [37]. The EBM model combines radial and non-radial measures of technical efficiency. This model is able to exhibit the proportionality between the target value and the actual value and adequately reflect the contrast between the non-radial part of inputs or outputs [38]. For its accuracy when measuring the efficiency of the assessed DMU, The EBM model is chosen to measure the green growth efficiency of manufacturing industries in China in this study.
There are input-oriented, output-oriented and non-oriented models in DEA. All of the three are applicable to the relative efficiency analysis [32]. Since both the input and the output efficiency are needed in this study, the non-oriented EBM model is adopted. The linear program of the EBM model is as follows:
We deal with DMUs denoted by , and the DUM currently being measured is denoted by . Each DMU has m inputs and q outputs, denoted by and , respectively. and represent the input and output matrices. denotes the linear combination coefficient and and represent the input and output slacks. The relative important degree of inputs and outputs are presented separately by and , and and are variables. denotes important degree of non-radial part and its range of values is from 0 to 1. The EBM model equals the radial model when and equals the SBM model when .
3.2. Indicator Selection
The selection of indicators is of importance in establishing the EBM model. Indicator selection entails deciding on a framework to guide the measurement of green growth efficiency [20]. In this study, the input and output indicators are selected based on both the complexity of green growth and the existing literature [2,7,8,9,10,30].
3.2.1. Input Indicators
The input indicators include labor, capital and energy. Both labor and capital inputs are the impulsion of economic growth. Among the input indicators, the energy indicator reflects the idea of green growth in manufacturing. Energy input represents the resource consumption created in the process of manufacturing development. It plays a key role in the development of manufacturing as long as resource constraints exist.
The acquisition of input indicators is as follows.
- Labor input: There is a lack of statistical data of effective working time in China. Taking the availability of data and existing literature, the labor input is presented with the average annual numbers of employees of above-scale industrial enterprises.
- Capital input: The perpetual inventory method is a common approach to estimate the capital stock. In the perpetual inventory method, the result varies greatly with different initial capital stock and the depreciation rate. In order to reduce the deviation of the estimation, we select the net annual value of fixed assets balance of above-scale industrial enterprises by industries to produce the estimate, based on the existing literature [35,39,40]. It should be noted that in the China Industrial Economic Statistical Yearbook, there is no net value of fixed assets balance by industries from 2009 to 2011, only the net value of fixed assets. According to mean imputation, this value is replaced by the average between the net values of fixed assets in the current year and the last year.
- Energy input: The energy input is expressed as total energy consumption of above-scale industrial enterprises by industries. The unit is 10,000 tons of standard coal.
3.2.2. Output Indicators
The output indicators include desirable outputs and undesirable outputs. In this research, the desirable output is represented by the gross industrial output. The undesirable outputs represent the degree of environmental pollution in the process of manufacturing development. There’s no uniform approach for processing the undesirable output in the existing literature. Most of the literature adopt the emissions of one or two of the pollutants as the undesirable output [2,7,8,9,10]. In this research, in order to measure the status of environmental pollution in a more accurate and objective way, we synthetically take into account waste water, waste gas and solid waste together. The Entropy evaluation method is adopted to synthesize an environmental pollutant composite index as the undesirable output [41].
3.3. Data Sources
China amended its National Economical Industry Classification twice -one in 2003 (GB/T4754-2002) and the other in 2012 (GB/T4754-2011). To maintain the uniformity statistical data, this research analyzes the statistical data of manufacturing industries in China during the period 2003–2011. According to Industrial Classification for National Economic Activities in 2002, China’s manufacturing industry was divided into 30 catalogues. The statistical data come from China Statistical Yearbook, China Industry Economic Statistical Yearbook, China Energy Statistical Yearbook and China Statistical Yearbook on Environment from 2003 to 2011. Yet the data about the annual average number of practitioners in 2004 come from China Economic Census Yearbook in 2004.
4. Data Analysis and Results
4.1. Calculation of Environmental Pollutant Composite Index
An Entropy evaluation method, an objective method, can be used to determine the weights of impact factors by means of calculating the entropy of information [42]. This research adopts the entropy evaluation method to synthesize the environmental pollutant composite index. The steps of this method are as follows [43].
- (1)
- Since waste water, waste gas and solid waste have conflicting measurement units, it is necessary to convert the original data to comparable data on uniform unit. This research advocates an extreme method for non-dimension of indexes (see Equations (5)–(9)).represents the th environmental pollutants index in the th year. is dimensionless index data and its range of values is from 0 to 1.
- (2)
- Calculate the weight coefficients of , denoted by .
- (3)
- Calculate the entropy of the -term index .
- (4)
- Calculate the weight coefficients of , denoted by .
- (5)
- Calculate the environmental pollutant composite index .
In this study, MATLAB is utilized to carry on the numerical evaluation. The environmental pollutant composite indexes of China’s 30 manufacturing industries are shown in Table 1.
4.2. Descriptive Statistics
The SPSS software is used to deal with descriptive statistics, as shown in Table 2. Avg., S.D., Min. and Max. indicate average, standard deviation, minimum and maximum, respectively. It can be concluded from Table 2 that there is a significant difference among the annual average number of employees, the annual net value of fixed assets balance, total energy consumption, industrial gross output and pollutant emission. This indicates growth differentials among manufacturing industries in China.
4.3. EBM Model Results
In order to measure the relative green growth efficiency of China’s manufacturing industries, both the input and the output efficiency need to be considered. Therefore, the non-oriented EBM model is adopted. MaxDEA software is used to calculate the model. The result of the green growth efficiency of 30 Chinese manufacturing industries from 2003 to 2011 is shown in Table 3.
The results show a steady upward trend in the green growth efficiency of manufacturing industry. During these nine years, the green growth efficiency has risen by 27.4% from 2003 (0.625) to 2011 (0.796) and the average efficiency of 30 industries is 0.721. From the perspective of industry, green growth efficiency varies vastly. 16 industries’ efficiency values are above the average level and six of them are equal to one. They are Reclaiming and processing of abandoned resource and waste material, Leather, furs, down and related products, Petroleum processing, coking and nuclear fuel processing, Telecommunication equipment, computer and other electronic equipment, Cultural, educational and sports goods and Tobacco processing. These six industries possess such characteristic as relatively clean production, low-energy consumption and low-pollution emission. Therefore, these industries fit neatly with the national conception of promoting the development and transformation of green industry. On the other hand, 14 industries’ efficiency values are below the average level, and more badly, seven of them are below 0.5. They are Papermaking and paper products (0.381), Nonmetal mineral products (0.386), Beverage production (0.451), Rubber products (0.456), Chemical fiber (0.458), Medical and pharmaceutical products (0.476) and Textile industry (0.476). Obviously, these industries characterize high-energy consumption and high-pollution emission. Although some industries did well in green growth, still nearly half of the manufacturing industries have a long way to go. That is to say, the Chinese manufacturing industry still enjoys a huge potential for development in resource conservation and pollution reduction.
4.4. Clustering Analysis
To illustrate the commonality and difference between the industries clearly, it’s necessary to classify the similar industries of these 30 industries into one group based on the EBM model results. Cluster analysis can help reveal the characteristics of any structure or patterns by organizing multivariate data into such subgroups. Therefore, cluster analysis is applied in this research to classify the industries by the characteristic of their green growth efficiencies. We use SPSS software to employ hierarchical clustering analysis using between-groups linkage and the dendrogram are constructed. Average efficiency of each group per year is calculated and then the post hoc test is conducted to test differences between groups. Significant differences were found between the four groups, indicating the validity of the clustering result (see Table 4). According to the clustering results, 30 manufacturing industries can be divided into four types based on their green growth efficiency values. They can be renamed as “green”, “light brown”, “dark brown” and “black” industries (see Table 5).
- Green industry: The nine industries with high green growth efficiency (efficiency ≥ 0.85) are named as green industries. These industries have the characteristic of high-resource utilization and low-pollution emission.
- Light brown industry: The seven industries with medium green growth efficiency (0.7 ≤ efficiency < 0.85) is defined as light brown industries. Although the energy consumption and pollution emission of these industries are relatively low, there are still problems compared to green industries, such as the lower utilization ratio of resource and deficiency in clean production.
- Dark brown industry: The five industries with lower green growth efficiency (0.6 ≤ efficiency < 0.7) are named as dark brown industries. These industries tend to expend much on production but to create low output and cause large pollution emission. These industries are chase profits at the expense of natural resources and ecological environment, thus they become the keystone of energy-saving and emission-reduction.
- Black industry: The nine industries with very low green growth efficiency (efficiency < 0.6) are classified as black industries. High energy-consumption and high pollution emission are the characteristics of these industries.
5. Discussion and Conclusions
For the sustainable development of manufacturing industry, it is important to obtain a further understanding of green growth efficiency evaluation toward manufacturing industry. This study measures green growth efficiency of 30 Chinese manufacturing industries using the EBM model, with labor, capitals and energy as inputs and the gross industrial output and an environmental pollutant composite index as outputs, respectively.
First from an overall perspective, according to the result of the EBM model, there is a steady upward trend in the green growth efficiency of the whole manufacturing industry since 2003 (0.625) to 2011 (0.796), with an annual growth rate of 1.9%, as shown in Figure 1. It is worth noting that there is a relatively rapid growth between 2005 and 2006. In 2005, the Chinese Government for the first time formally puts forward the idea of manufacturing pollution control in “Work of the State Council in 2005”. Over the same period, the environmental pressures from abroad also caused shockwaves to the domestic manufacturing industry. As an example, the WEEE and RoHS directives issued by European Union limited the use of hazardous substances in the production of importing electronic and electrical products [44]. Thus, it is inferred that the rapid growth in 2005 and 2006 has much to do with the issues of new policies. But the policies didn’t lead to a sustained stimulus on green growth efficiency. Since 2006, the average growth efficiency returned to its original state of slow-growing.
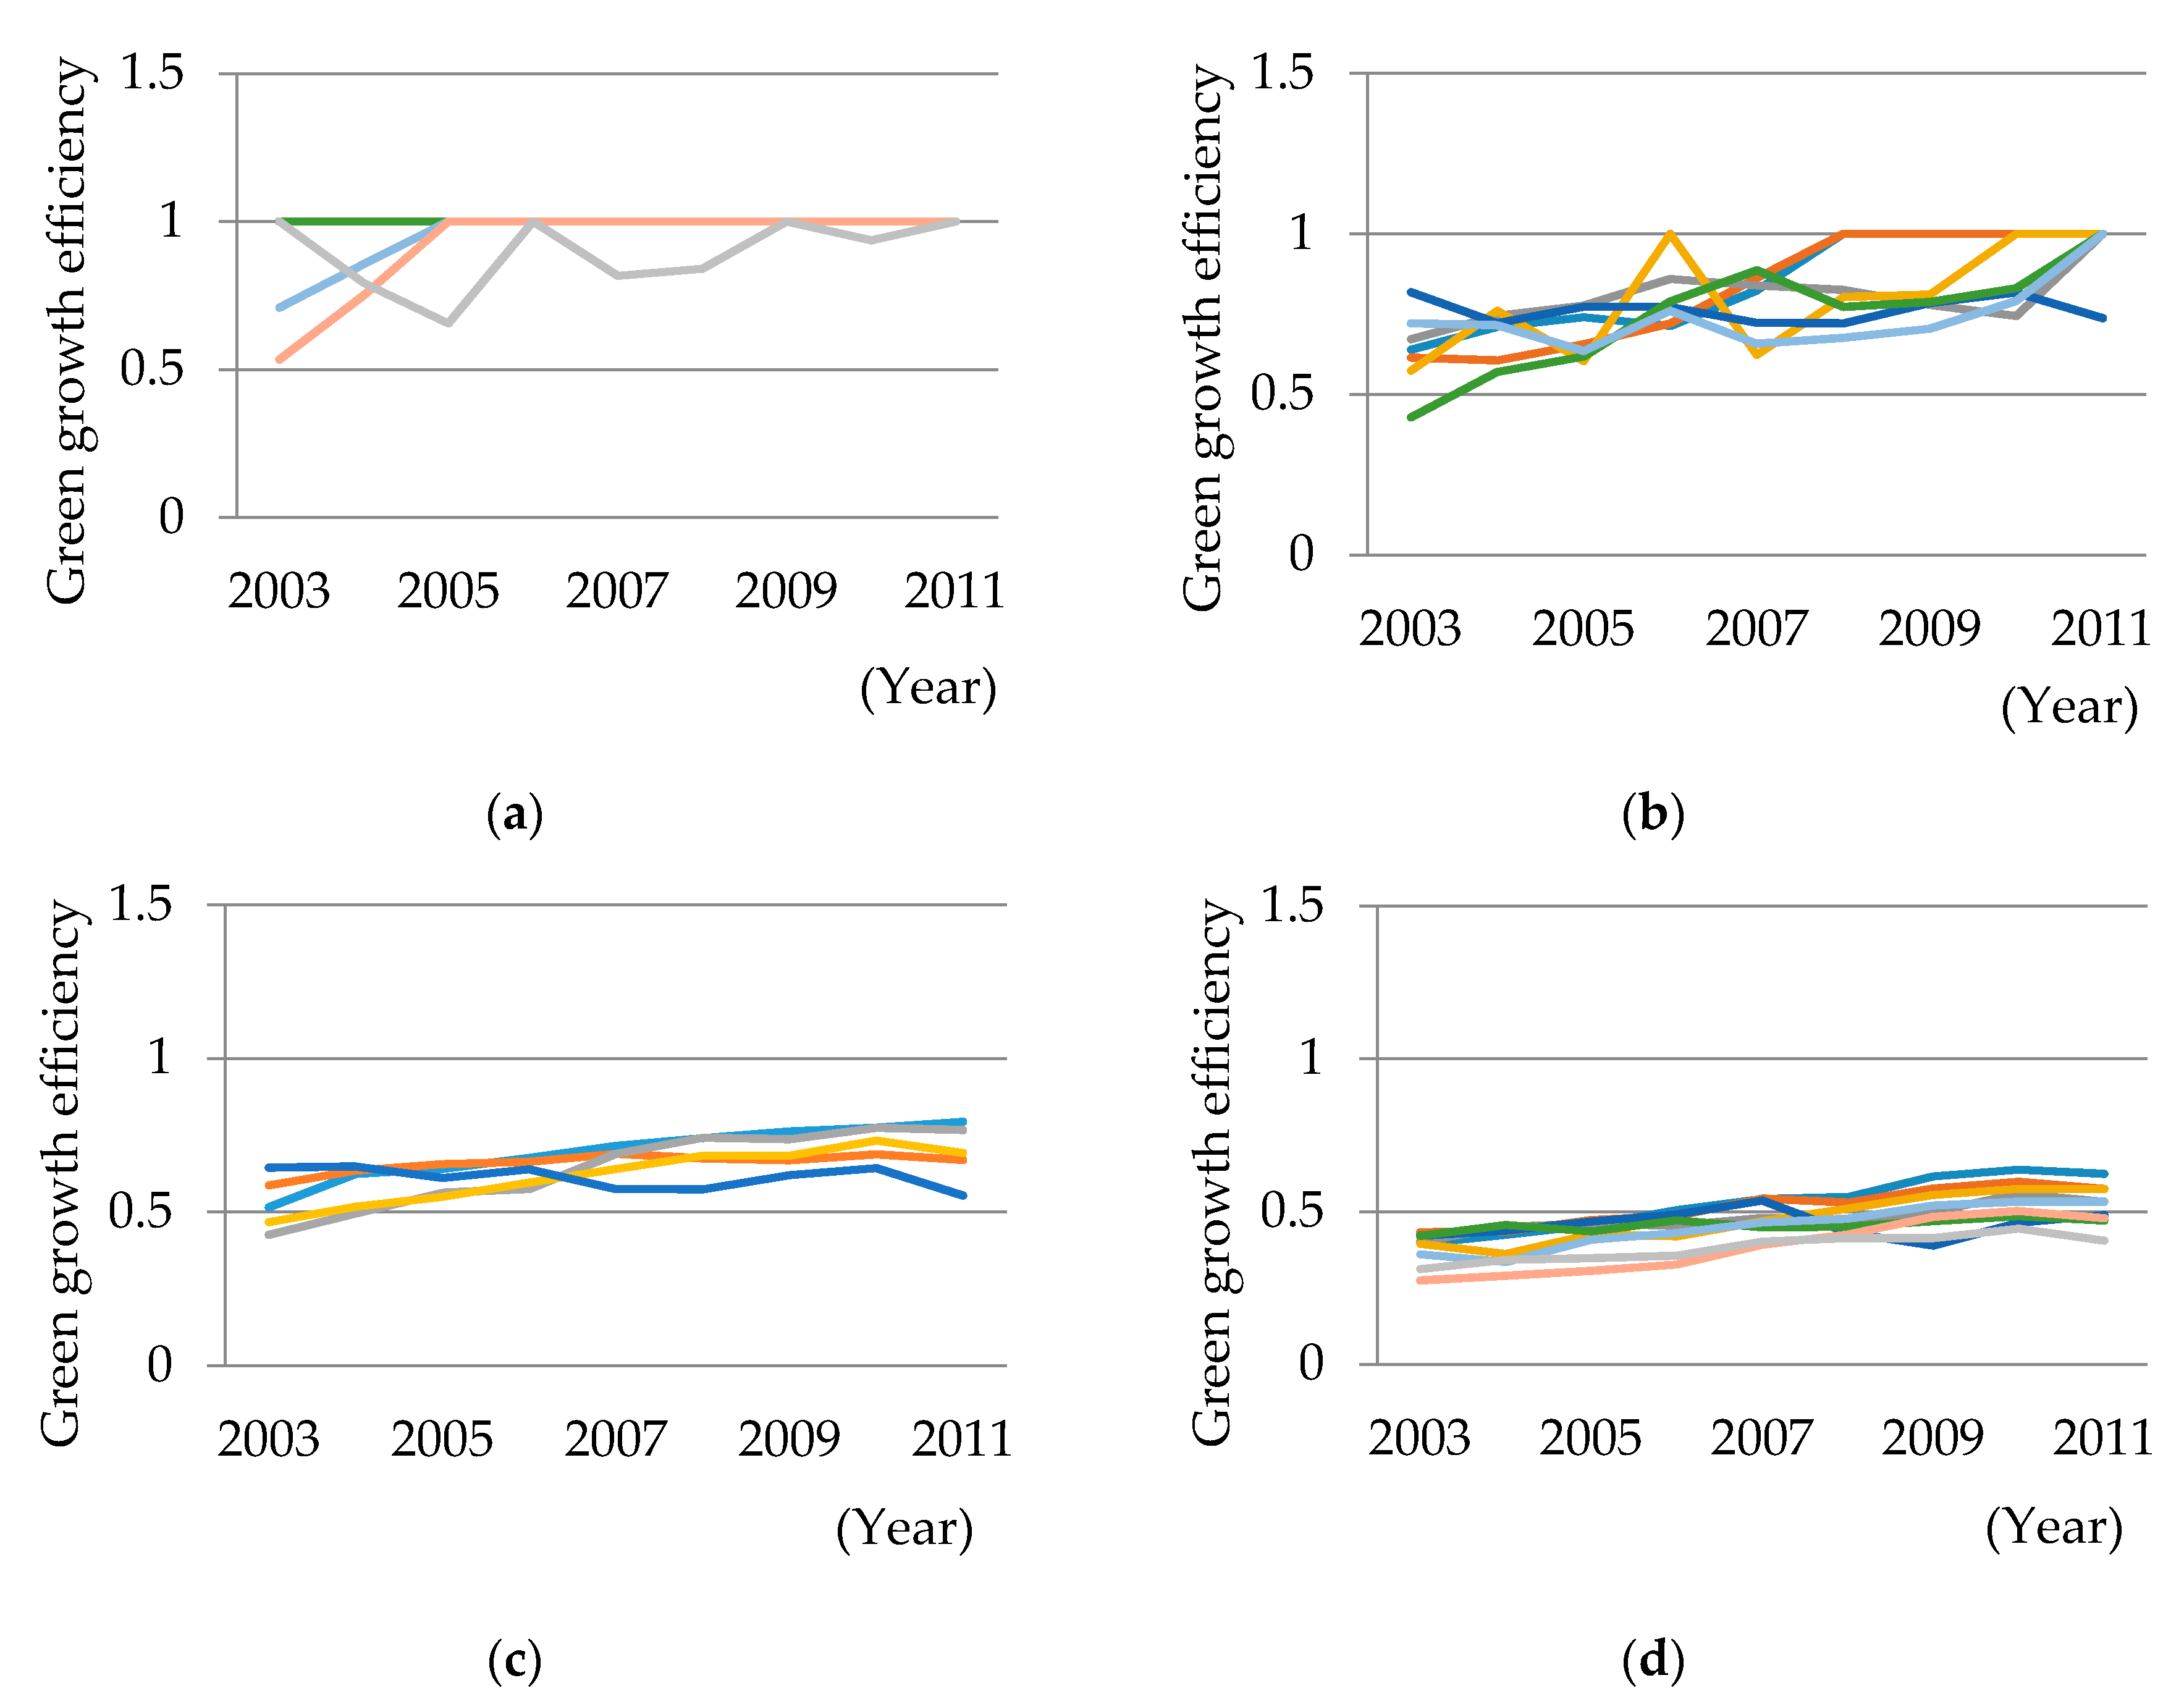
In order to effectively conduct the industry-based analysis, we classify Chinese 30 manufacturing industries into four types—“green”, “light brown”, “dark brown” and “black” industries according to the clustering results. And the annual trends of 30 manufacturing industries’ green growth efficiencies grouped together by their types are shown in Figure 2.
The nine “green” industries possess high green growth efficiency in the nine years. We can see that five of them are capital-intensive industries, namely Cultural, educational and sports goods, Petroleum processing, coking and nuclear fuel processing, Telecommunication equipment, computer and other electronic equipment, Electrical equipment and machinery and Smelting and pressing of ferrous metals. These industries have a huge demand for funds and possess high entry barriers and high monopoly degree. Enjoying strong economics, these industries have the power to invest in new technology, optimize the manufacturing process and update productive equipment.
Among the nine industries, Furniture Manufacturing, Tobacco Processing, Reclaiming and Processing of Abandoned Resource and Waste Material, Cultural, Educational and Sports Goods are typically “green” industries with less pollutant emission, according to the environmental pollutant composite index in the previous section. However, it’s a question worthy of consideration that Petroleum processing, coking and nuclear fuel processing, Leather, Furs, Down and Related Products, Smelting and Pressing of Ferrous Metals are “green”, as they are all members of the top ten of pollution-intensive industries. The reason why the above three pollution-intensive industries turn “green” is the positive measures adopted by the government and enterprises. Take the case of petroleum processing and coking industry, in terms of national policy, a series of policies and measures have been issued for guiding such heavy polluting industries, such as State issue [2003] No. 11 and State issue [2007] No. 15, etc. These policies are mainly carried out from two aspects. On the one hand, the government restrains the extensive growth mode of these industries by the means of taxation, industry standard, differential power price. On the other hand, the government encouraged industries to upgrade industrial structure and adjust energy structure. From the perspective of enterprises, PetroChina Co Ltd. (Beijing, China), as the industry leader, has made great contributions to promote green growth of the industry. In the period of 12th five year plan, PetroChina has reduced its cumulative emissions of carbon dioxide by 744 million tons and sulfur dioxide by 11.62 million tons. PetroChina has been committed to building a sustainable energy supply system. The enterprise had upgraded the oil quality twice in the five years, with a total investment of more than 35.6 billion Yuan [45]. At the same time, through Ten Major Energy-Saving Projects and Ten Emission-Reducing Projects, Petro China tries to achieve energy-saving and emission-reducing in the production process. Technical innovation plays a vital role in its green growth process. A series of techniques were carried out in Huabei Oilfield, including 2D seismic fine structure interpretation of coal bed methane, enrichment region evaluation and well deployment, solving the problem of strong adsorption capacity and high gas content in high rank coal seam [46]. The petroleum equipment is one of the key factors of energy saving and emission reducing. PetroChina has carried out special facility development planning to promote the utilization of clean energy in petroleum processing. Besides, PetroChina has been put forward to accelerate the upgrade of traditional advantage facilities and eliminate high-pollution equipments. The Government provides an attractive development environment and enterprises increase green investment. The combination of the two successfully promotes the green transformation of the industry. The experience and measures from the “green” industries are worth references to other industries in their way of green transformation.
There are three technologies-intensive industries in the “light brown” group, namely Transport equipment manufacturing, Handicraft articles and other manufacture and Instruments, meters, cultural and office machinery. These technologies-intensive industry own advanced production technology and manufacturing facilities. Meanwhile, the proportion of R&D expense and the number of sci-tech workers are both above the national average.
Among five “brown” industries, raw chemical materials and chemical products are both high energy-consuming and pollution-intensive industry. Ordinary machinery manufacturing and for special purpose equipment manufacturing belongs to labor-intensive industries, which rely much on cheap labor and have relatively backward technology and outdated facilities. Technical problems also exist in Plastic products and Metal products, such as lack of advanced facilities, shortage of talents and low technology content of products, etc.
Five of the “black” industries are pollution-intensive industries, namely Papermaking and paper products, Textile industry, Food production, Medical and pharmaceutical products and Beverage production. These five industries generate large quantities of waste water, waste gas and solid waste, contaminating the air, water, soil and sea. Another three industries—Rubber products, Chemical fiber and Timber processing, Bamboo, cane, palm fiber and straw products—are labor-intensive industries based on traditional manufacturing. Depending on cheap labor in China, these industries’ growth presents extensive feature, resulting in low added-value and serious environment pollution. The last one, Nonmetal mineral products, as one of the six energy-intensive industries in China, consumes masses of nonmetallic mineral resources as the basic material as well as energy like coal, gas, and oil in the whole manufacturing process.
Based on the four types of industries, government should take various measures to speed up the course of green growth of China’s manufacturing industry. It is critical to promote the transformation from “black” industries to “green” industries by means of policies and regulations. On the one hand, government should restrict the environmental performance of manufacturing enterprises by environmental regulations. The approach taken in developed countries is worth learning. Take the industry of papermaking and paper products as an example, Finland has been doing well in the pollution control by good and close co-operation between the industry and government. Strict regulations and emission limits forced enterprises to improve pollution treatment such as biological treatment facility, reduction of phosphorous emission and closed water loop. The related environmental laws and regulations play a very important role in intervening directly in environmental behaviors during the manufacturing production, which is an effective solution to environmental problems [47]. On the other hand, an environmental policy can guide green technology innovation. Previous studies have shown the positive effect of the demand-pull and technology-push policy mix and public R&D subsidy on green innovation [48,49,50]. For instance, the government should strengthen policy support for “green” industry by the means of fiscal subsidies and introduction of new technology. These policies encourage “green” industry enterprises cultivate green technical personnel, increase investment in R&D, implement sustainable production practices and take initiatives to undertake social responsibilities.
To achieve green growth, besides the formulation and implementation of policies, manufacturing enterprise themselves ought to take action to minimize energy consumption and environmental pollution. Compliance with regulations, driving force of sci-tech and commitment from the top management is essential drivers in enterprises’ green practice [51,52]. Hence, above all, senior managers should improve their awareness in environmental social responsibility. It’s essential to construct a green enterprise culture by conducting awareness-raising activities within the enterprise. Next, enterprises should improve administration and rearrange the organization structure to meet clean production need. Moreover, correlative regulations and standards should be strictly implemented when arranging production, so as to set up a good enterprise image. Finally, enterprises should emphasize green technical innovation by introducing clean production techniques, increasing R&D investment and upgrading manufacturing equipment.
This paper measures the green growth efficiency of the manufacturing industry in China employing the EBM model which accounts for both desirable and undesirable outputs. The study takes into account waste water, waste gas and solid waste together with synthetically reflect the environmental indicator. The empirical evidence in this study may offer some insights in relation to policies and regulations with regards to green growth of manufacturing industries. This study is only a first step towards measuring green growth efficiency of Chinese manufacturing industry. Several important extensions of this work are recommended for future research. A more comprehensive assessment framework, including the social indicators such as employment, work-related injuries and health expenditures, is needed to construct in future work so as to emphasize the role of society in sustainable development. In addition, similar studies can be conducted in other countries, especially for developed countries, in order to find out the gap and then put forward targeted improvements for China’s manufacturing industry.
Acknowledgments
This work is supported by grants from the National Natural Science Foundation of China Project (71473029) and National Natural Science Foundation of China International (regional) Joint Research Project (71320107006).
Author Contributions
This paper was written by Ying Qu, Ying Yu, Andrea Appolloni, Mengru Li, and Yue Liu. Ying Qu guided the research direction and proposed the framework of analysis. Ying Yu and Yue Liu collected and analyzed the data. Ying Yu, Mengru Li, Yue Liu and Andrea Appolloni wrote the paper. Mengru Li was responsible for data processing and soft operation.
Conflicts of Interest
The authors declare no conflict of interest.
References
- Yu, J. Research on the Interactive Efficiency of Manufacturing and Productive Services. Ph.D. Thesis, Fudan University, Shanghai, China, 20 March 2013. [Google Scholar]
- Wang, S.; Qu, X. Research on total factor energy efficiency change of china manufacturing industry considering environmental effects: Based on DEA-malmquist index empirical study. China Popul. Resour. Environ. 2011, 8, 130–137. [Google Scholar]
- Wang, L.; Chen, Z.; Ma, D. Energy conservation and emission reduction, total factor energy productivity and industrial heterogeneity: An empirical analysis based on China’s 28 manufacturing industries. Contemp. Financ. Econ. 2013, 10, 5–15. [Google Scholar]
- The United Nations Economic and Social Commission for Asia and the Pacific. Shifting towards “Green Growth” in Asia and the Pacific. In State of the Environment in Asia and the Pacific 2005 Synthesis: Economic Growth and Sustainability; United Nations: New York, NY, USA, 2005; Volume 2. [Google Scholar]
- Organization for Economic Co-operation and Development. Towards Green Growth a Summary for Policy Makers: The OECD Meeting of the Council at Ministerial Level Paris; OCED: Paris, France, 2011. [Google Scholar]
- Lee, J.; Kim, J. South Korea’s urban green energy strategies: Policy framework and local responses under the green growth. Cities 2016, 54, 20–27. [Google Scholar] [CrossRef]
- Ramli, N.A.; Munisamy, S. Eco-efficiency in greenhouse emissions among manufacturing industries: A range adjusted measure. Econ. Model. 2015, 47, 219–227. [Google Scholar] [CrossRef]
- Zkara, Y.; Atak, M. Regional total-factor energy efficiency and electricity saving potential of manufacturing industry in Turkey. Energy 2015, 93, 495–510. [Google Scholar]
- Green Growth Knowledge Platform. Moving towards a Common Approach on Green Growth Indicators; GGKP: Paris, France, 2013. [Google Scholar]
- Egilmez, G.; Kucukvar, M.; Tatari, O. Sustainability assessment of U.S. Manufacturing sectors: An economic input output-based frontier approach. J. Clean. Prod. 2013, 53, 91–102. [Google Scholar] [CrossRef]
- Hirschnitz-Garbers, M.; Tan, A.R.; Gradmann, A.; Srebotnjak, T. Key drivers for unsustainable resource use—categories, effects and policy pointers. J. Clean. Prod. 2016, 132, 13–31. [Google Scholar] [CrossRef]
- Pahle, M.; Pachauri, S.; Steinbacher, K. Can the Green Economy deliver it all? Experiences of renewable energy policies with socio-economic objectives. Appl. Energy 2016, 179, 1331–1341. [Google Scholar] [CrossRef]
- Hong, J.; Shen, G.Q.; Mao, C.; Li, Z.; Li, K. Life-cycle energy analysis of prefabricated building components: An input–output-based hybrid model. J. Clean. Prod. 2016, 112, 2198–2207. [Google Scholar] [CrossRef]
- Wang, K.; Tian, H.; Hua, S.; Zhu, C.; Gao, J.; Xue, Y.; Hao, J.; Wang, Y.; Zhou, J. A comprehensive emission inventory of multiple air pollutants from iron and steel industry in China: Temporal trends and spatial variation characteristics. Sci. Total Environ. 2016, 559, 7–14. [Google Scholar] [CrossRef] [PubMed]
- Xu, B.; Lin, B. Reducing carbon dioxide emissions in China’s manufacturing industry: A dynamic vector autoregression approach. J. Clean. Prod. 2016, 131, 594–606. [Google Scholar] [CrossRef]
- Skellern, K.; Markey, R.; Thornthwaite, L. Identifying attributes of sustainable transitions for traditional regional manufacturing industry sectors—A conceptual framework. J. Clean. Prod. 2017, 140, 1782–1793. [Google Scholar] [CrossRef]
- Organization for Economic Co-operation and Development (OECD). OECD Green Growth Studies towards Green Growth; Organization for Economic Co-operation and Development (OECD): Paris, France, 2011. [Google Scholar]
- Gallagher, L.; Laflaive, X.; Zaeske, A.; Brown, C.; Lange, G.; Ahlroth, S.; Castaneda, J.; Fanaian, S.; Joyce, J.; Kamar, E.; et al. Embracing risk, uncertainty and water allocation reform when planning for green growth. Aquat. Procedia 2016, 6, 23–29. [Google Scholar] [CrossRef]
- Sonnenschein, J.; Mundaca, L. Decarbonization under green growth strategies? The case of South Korea. J. Clean. Prod. 2016, 123, 180–193. [Google Scholar] [CrossRef]
- Kim, S.E.; Kim, H.; Chae, Y. A new approach to measuring green growth: Application to the OECD and Korea. Futures 2014, 63, 37–48. [Google Scholar] [CrossRef]
- Saufi, N.A.A.; Daud, S.; Hassan, H. Green growth and corporate sustainability performance. Procedia Econ. Financ. 2016, 35, 374–378. [Google Scholar] [CrossRef]
- Napp, T.A.; Gambhir, A.; Hills, T.P.; Florin, N.; Fennell, P.S. A review of the technologies, economics and policy instruments for decarbonising energy-intensive manufacturing industries. Renew. Sustain. Energy Rev. 2014, 30, 616–640. [Google Scholar] [CrossRef]
- Zheng, S.; Yi, H.; Li, H. The impacts of provincial energy and environmental policies on air pollution control in China. Renew. Sustain. Energy Rev. 2015, 49, 386–394. [Google Scholar] [CrossRef]
- Trochu, J.; Chaabane, A.; Ouhimmou, M. Tactical planning model for procurement and manufacturing decisions under environmental regulations. IFAC-PapersOnLine 2015, 48, 362–367. [Google Scholar] [CrossRef]
- Cainelli, G.; Mazzanti, M. Environmental innovations in services: Manufacturing-services integration and policy transmissions. Res. Policy 2013, 42, 1595–1604. [Google Scholar] [CrossRef]
- Cainelli, G.; Amato, A.D.; Mazzanti, M. Adoption of waste-reducing technology in manufacturing: Regional factors and policy issues. Resour. Energy Econ. 2015, 39, 53–67. [Google Scholar] [CrossRef]
- Ellerman, A.D.; Buchner, B.; Carraro, C. Origins and development of the EU ETS. In Pricing Carbon: The European Union Emissions Trading Scheme; Cambridge University Press: London, UK, 2010; Volume 43, pp. 69–79. [Google Scholar]
- Bassi, A.M.; Yudken, J.S.; Ruth, M. Climate policy impacts on the competitiveness of energy-intensive manufacturing sectors. Energy Policy 2009, 37, 3052–3060. [Google Scholar] [CrossRef]
- Levine, M.D.; Martin, N.; Price, L.; Worrell, E. Energy Efficiency Improvement Utilising High Technology: An Assessment of Energy Use in Industry and Buildings; World Energy Council: London, UK, 1995. [Google Scholar]
- Chen, G. Research on Total Factor Energy Efficiency of Chinese Manufacture Industry and its Influence Factors Based on SFA. China Soft Sci. 2014, 1, 180–192. [Google Scholar]
- Charnes, A.; Cooper, W.W.; Rhodes, E. Measuring the efficiency of decision making units. Eur. J. Oper. Res. 1978, 2, 429–444. [Google Scholar] [CrossRef]
- Cheng, G. Basic DEA model. In Data Envelopment Analysis and MaxDEA Software; Intellectual Property Press: Beijing, China, 2014. [Google Scholar]
- Banker, R.D.; Charnes, A.; Cooper, W.W. Some models for estimating technical and scale inefficiencies in data envelopment analysis. Manag. Sci. 1984, 30, 1078–1092. [Google Scholar] [CrossRef]
- Chung, Y.H.; Färe, R.; Grosskopf, S. Productivity and undesirable outputs: A directional distance function approach. J. Environ. Manag. 1995, 51, 229–240. [Google Scholar] [CrossRef]
- Pang, R.; Li, P. Regional disparity and dynamic evolution about China’s new industrialization growth performance. Econ. Res. J. 2011, 11, 36–47. [Google Scholar]
- Tone, K. A slacks-based measure of efficiency in data envelopment analysis. Eur. J. Oper. Res. 2001, 130, 498–509. [Google Scholar] [CrossRef]
- Tone, K.; Tsutsui, M. An epsilon-based measure of efficiency in DEA—A third pole of technical efficiency. Eur. J. Oper. Res. 2010, 207, 1554–1563. [Google Scholar] [CrossRef]
- Li, L.; Liu, B. China’s high technology industry production efficiency evaluation and recognition. Econ. Perspect. 2014, 3, 56–65. [Google Scholar]
- Tu, Z. The coordination of industrial growth with environment and resource. Econ. Res. J. 2008, 2, 93–105. [Google Scholar]
- Li, B.; Peng, X.; Ouyang, M. Environmental Regulation, Green Total Factor Productivity and the Transformation of China’s Industrial Development Mode—Analysis Based on Data of China’s 36 Industries. China Ind. Econ. 2013, 4, 56–68. [Google Scholar]
- Han, J.; Lan, Q. Research on the measurement and influencing factors of the green degrees of Chinese industry. China Popul. Resour. Environ. 2012, 2, 101–107. [Google Scholar]
- Li, H.; Guo, H.; Ren, J.; Li, S.; Wang, J. Evaluation on Eco-friendly Land Use in Huanren Mountainous Area with Entropy-based Method. China Popul. Resour. Environ. 2010, S2, 111–114. [Google Scholar]
- Guo, L.; Wu, C.; Yu, J. A study on simulating energy security system of China. Sci. Res. Manag. 2015, 1, 112–120. [Google Scholar]
- Hua, L.; Chan, Y.C.; Wu, Y.P.; Wu, B.Y. The determination of hexavalent chromium (Cr6+) in electronic and electrical components and products to comply with RoHS regulations. J. Hazard. Mater. 2009, 163, 1360–1368. [Google Scholar] [CrossRef] [PubMed]
- Kate, B. Another successful startup in China for DuPont IsoTherming Hydroprocessing Technology at PetroChina. Focus Catal. 2013, 2013, 6. [Google Scholar]
- Yang, H.; Liu, X.; Huang, D.; Lan, Y.; Wang, S. Natural gas exploration and development in Changqing Oilfield and its prospect in the 13th Five-Year Plan. Nat. Gas Ind. B 2016, 3, 291–304. [Google Scholar] [CrossRef]
- Luukkanen, J. Green paper with green electricity? Greening strategies of Nordic pulp and paper industry. Energy Policy 2003, 31, 641–655. [Google Scholar] [CrossRef]
- Wang, C.; Nie, P.; Peng, D.; Li, Z. Green insurance subsidy for promoting clean production innovation. J. Clean. Prod. 2017, 148, 111–117. [Google Scholar] [CrossRef]
- Lindman, S.; Derholm, S.P. Wind energy and green economy in Europe: Measuring policy-induced innovation using patent data. Appl. Energy 2016, 179, 1351–1359. [Google Scholar] [CrossRef]
- Costantini, V.; Crespi, F.; Palma, A. Characterizing the policy mix and its impact on eco-innovation: A patent analysis of energy-efficient technologies. Res. Policy 2017, 46, 799–819. [Google Scholar] [CrossRef]
- Wang, J.; Gao, J.; Cheng, Y.; Kang, Y.; Li, X. Ecologicalization motivations of resources enterprises in the Pan-Qaidam pilot economic zone of Qinghai Province, West China. J. Clean. Prod. 2017, 152, 330–338. [Google Scholar] [CrossRef]
- Govindan, K.; Diabat, A.; Madan Shankar, K. Analyzing the drivers of green manufacturing with fuzzy approach. J. Clean. Prod. 2015, 96, 182–193. [Google Scholar] [CrossRef]
Figure 1.
The annual trend of Chinese manufacturing industry green growth efficiency (relative values).
Figure 1.
The annual trend of Chinese manufacturing industry green growth efficiency (relative values).
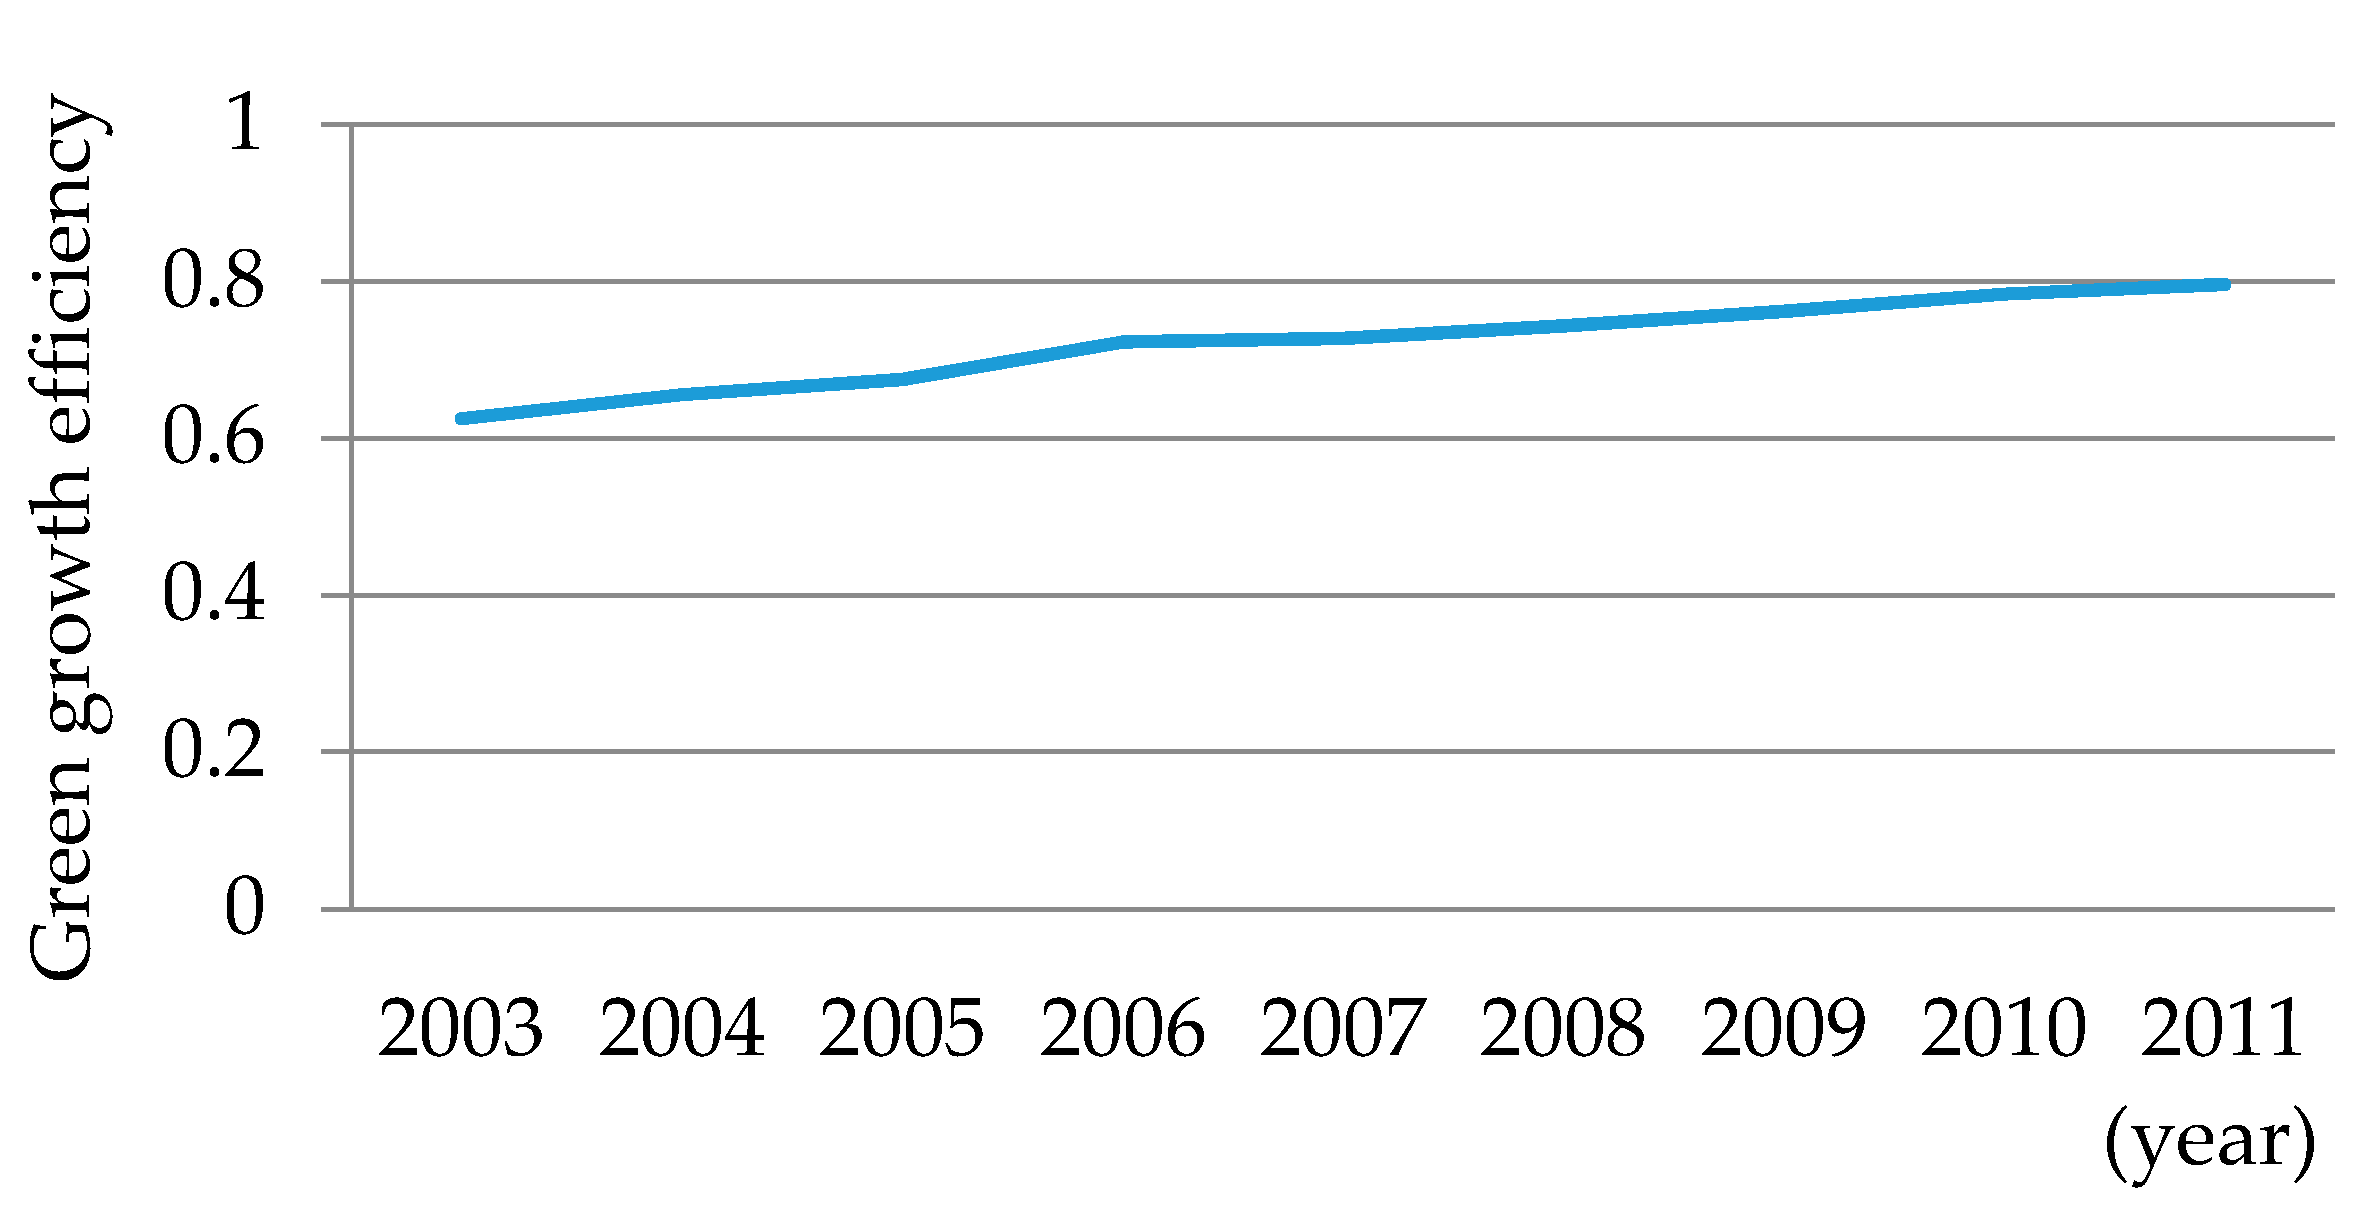
Figure 2.
The annual trends of 30 manufacturing industries’ green growth efficiencies grouped together by their types: (a) “green” industries; (b) “light brown” industries; (c) “dark brown” industries; (d) “black” industries (relative values).
Figure 2.
The annual trends of 30 manufacturing industries’ green growth efficiencies grouped together by their types: (a) “green” industries; (b) “light brown” industries; (c) “dark brown” industries; (d) “black” industries (relative values).


Table 1.
The environmental pollutant composite index of China’s 30 manufacturing industries (2003–2011).
Table 1.
The environmental pollutant composite index of China’s 30 manufacturing industries (2003–2011).
| Name of Manufacturing Industry | Environmental Pollutant Composite Index | |||||||||
|---|---|---|---|---|---|---|---|---|---|---|
| 2003 | 2004 | 2005 | 2006 | 2007 | 2008 | 2009 | 2010 | 2011 | Avg. | |
| Farm Byproducts Processing | 0.1214 | 0.1169 | 0.1151 | 0.0896 | 0.1187 | 0.1245 | 0.1212 | 0.1179 | 0.11 | 0.1150 |
| Food Production | 0.0446 | 0.0404 | 0.0407 | 0.0361 | 0.0355 | 0.039 | 0.0476 | 0.048 | 0.0402 | 0.0413 |
| Beverage Production | 0.0468 | 0.0428 | 0.0448 | 0.0564 | 0.0548 | 0.0552 | 0.0584 | 0.0625 | 0.0552 | 0.0530 |
| Tobacco Processing | 0.0066 | 0.0052 | 0.005 | 0.0038 | 0.0036 | 0.0035 | 0.0034 | 0.0027 | 0.0022 | 0.0040 |
| Textile Industry | 0.1424 | 0.1502 | 0.1422 | 0.1495 | 0.1491 | 0.1494 | 0.1597 | 0.1607 | 0.1539 | 0.1508 |
| Garments, Shoes and Hats Production | 0.0057 | 0.0098 | 0.0083 | 0.0099 | 0.0088 | 0.0097 | 0.0091 | 0.0073 | 0.0126 | 0.0090 |
| Leather, Furs, Down and Related Products | 0.0114 | 0.015 | 0.0148 | 0.0141 | 0.0145 | 0.0163 | 0.0159 | 0.017 | 0.0157 | 0.0150 |
| Timber Processing, Bamboo, Cane, Palm Fiber and Straw Products | 0.0124 | 0.013 | 0.0123 | 0.0089 | 0.0127 | 0.0083 | 0.01 | 0.009 | 0.0116 | 0.0109 |
| Furniture Manufacturing | 0.0011 | 0.001 | 0.0029 | 0.002 | 0.0021 | 0.0015 | 0.0009 | 0.001 | 0.0005 | 0.0014 |
| Papermaking and Paper Products | 0.2983 | 0.2859 | 0.2876 | 0.2786 | 0.288 | 0.2676 | 0.2731 | 0.2774 | 0.28 | 0.2818 |
| Printing and Record Medium Reproduction | 0.0023 | 0.001 | 0.0013 | 0.0006 | 0.0009 | 0.0009 | 0.0009 | 0.0006 | 0.0008 | 0.0010 |
| Cultural, Educational and Sports Goods | 0.0002 | 0.0006 | 0.0006 | 0.0003 | 0.0001 | 0.0003 | 0.0002 | 0.0001 | 0.001 | 0.0004 |
| Petroleum Processing, Coking and Nuclear Fuel Processing | 0.1458 | 0.1588 | 0.1332 | 0.1175 | 0.1229 | 0.1432 | 0.1295 | 0.1332 | 0.1298 | 0.1349 |
| Raw Chemical Materials and Chemical Products | 0.542 | 0.5266 | 0.4799 | 0.4434 | 0.4672 | 0.3944 | 0.4055 | 0.4096 | 0.492 | 0.4623 |
| Medical and Pharmaceutical Products | 0.0477 | 0.0447 | 0.0369 | 0.0339 | 0.0324 | 0.0356 | 0.0386 | 0.0391 | 0.0379 | 0.0385 |
| Chemical Fiber | 0.0682 | 0.0607 | 0.0552 | 0.0514 | 0.0442 | 0.0397 | 0.0406 | 0.0371 | 0.0311 | 0.0476 |
| Rubber Products | 0.0108 | 0.0101 | 0.0088 | 0.0079 | 0.0077 | 0.0072 | 0.008 | 0.0078 | 0.0171 | 0.0095 |
| Plastic Products | 0.0035 | 0.0048 | 0.0055 | 0.005 | 0.0068 | 0.0068 | 0.0048 | 0.0052 | 0.3459 | 0.0431 |
| Nonmetal Mineral Products | 0.4505 | 0.4677 | 0.4003 | 0.4011 | 0.3543 | 0.3007 | 0.3479 | 0.3324 | 0.8494 | 0.4338 |
| Smelting and Pressing of Ferrous Metals | 0.7139 | 0.8939 | 0.8721 | 0.866 | 0.8499 | 0.853 | 0.8444 | 0.8379 | 0.187 | 0.7687 |
| Smelting and Pressing of Nonferrous Metals | 0.525 | 0.2075 | 0.1875 | 0.1794 | 0.1796 | 0.1771 | 0.1697 | 0.1833 | 0.0399 | 0.2054 |
| Metal Products | 0.1135 | 0.0169 | 0.0207 | 0.0236 | 0.0329 | 0.0266 | 0.0304 | 0.0269 | 0.0117 | 0.0337 |
| Ordinary Machinery Manufacturing | 0.0199 | 0.0234 | 0.0259 | 0.0158 | 0.0143 | 0.02 | 0.0197 | 0.0201 | 0.011 | 0.0189 |
| For Special Purposes Equipment Manufacturing | 0.0208 | 0.0169 | 0.0145 | 0.0116 | 0.0089 | 0.0091 | 0.0225 | 0.0129 | 0.0192 | 0.0152 |
| Transport Equipment Manufacturing | 0.0243 | 0.0528 | 0.0337 | 0.0374 | 0.0333 | 0.0357 | 0.0342 | 0.0329 | 0.014 | 0.0331 |
| Electric Equipment and Machinery | 0.0474 | 0.0113 | 0.0095 | 0.0079 | 0.0082 | 0.0094 | 0.0093 | 0.01 | 0.0087 | 0.0135 |
| Telecommunication Equipment, Computer and Other Electronic Equipment | 0.0139 | 0.0188 | 0.0232 | 0.0259 | 0.0272 | 0.0302 | 0.0327 | 0.0409 | 0.0391 | 0.0280 |
| Instruments, Meters, Cultural and Office Machinery | 0.0167 | 0.0145 | 0.0086 | 0.0074 | 0.0069 | 0.0054 | 0.0048 | 0.0041 | 0.0009 | 0.0077 |
| Handicraft Articles and Other Manufacture | 0.0123 | 0.0024 | 0.003 | 0.0022 | 0.0022 | 0.0018 | 0.0019 | 0.0015 | 0.0041 | 0.0035 |
| Reclaiming and Processing of Abandoned Resource and Waste Material | 0.0016 | 0.0001 | 0.0001 | 0.0037 | 0.0003 | 0.0006 | 0.0007 | 0.0008 | 0.0045 | 0.0014 |
Table 2.
Descriptive statistics.
| Indicator | Avg. | S.D. | Min. | Max. | ||
|---|---|---|---|---|---|---|
| Input indicator | Annual average number of employees | 226.44 | 173.29 | 1.36 | 819.48 | |
| Annual net value of fixed assets balance | 2816.77 | 3005.19 | 4.11 | 17,594.80 | ||
| Total energy consumption | 5099.94 | 10,018.52 | 30.35 | 58,896.58 | ||
| Output indicator | Industrial gross output | 12,639.79 | 13,548.46 | 49.94 | 64,066.98 | |
| Environmental pollutant composite index | Waste gas emission | 22,019.22 | 22,019.22 | 8.00 | 173,215.00 | |
| Wastewater emission | 91,499.34 | 91,499.34 | 235.00 | 424,597.38 | ||
| Solid waste emission | 5924.87 | 5924.87 | 2.00 | 42,344.20 | ||
Table 3.
The green growth efficiency of China’s 30 manufacturing industries (2003–2011).
| Name of Manufacturing Industry | Green Growth Efficiency | |||||||||
|---|---|---|---|---|---|---|---|---|---|---|
| 2003 | 2004 | 2005 | 2006 | 2007 | 2008 | 2009 | 2010 | 2011 | Avg. | |
| Electric Equipment and Machinery | 0.709 | 0.856 | 1.000 | 1.000 | 1.000 | 1.000 | 1.000 | 1.000 | 1.000 | 0.952 |
| Garments, Shoes and Hats Production | 0.818 | 0.722 | 0.773 | 0.772 | 0.723 | 0.721 | 0.784 | 0.817 | 0.737 | 0.763 |
| Textile Industry | 0.402 | 0.450 | 0.461 | 0.453 | 0.480 | 0.474 | 0.499 | 0.559 | 0.532 | 0.479 |
| Nonmetal Mineral Products | 0.274 | 0.290 | 0.306 | 0.327 | 0.392 | 0.425 | 0.483 | 0.502 | 0.479 | 0.386 |
| Reclaiming and Processing of Abandoned Resource and Waste Material | 1.000 | 1.000 | 1.000 | 1.000 | 1.000 | 1.000 | 1.000 | 1.000 | 1.000 | 1.000 |
| Handicraft Articles and Other Manufacture | 0.721 | 0.715 | 0.635 | 0.760 | 0.657 | 0.675 | 0.704 | 0.791 | 1.000 | 0.740 |
| Smelting and Pressing of Ferrous Metals | 0.533 | 0.750 | 1.000 | 1.000 | 1.000 | 1.000 | 1.000 | 1.000 | 1.000 | 0.920 |
| Chemical Fiber | 0.421 | 0.437 | 0.468 | 0.491 | 0.536 | 0.431 | 0.389 | 0.464 | 0.489 | 0.458 |
| Raw Chemical Materials and Chemical Products | 0.426 | 0.495 | 0.563 | 0.575 | 0.689 | 0.742 | 0.737 | 0.774 | 0.767 | 0.641 |
| Furniture Manufacturing | 1.000 | 0.792 | 0.655 | 1.000 | 0.816 | 0.840 | 1.000 | 0.936 | 1.000 | 0.893 |
| Transport Equipment Manufacturing | 0.614 | 0.605 | 0.656 | 0.721 | 0.862 | 1.000 | 1.000 | 1.000 | 1.000 | 0.829 |
| Metal Products | 0.587 | 0.635 | 0.656 | 0.663 | 0.689 | 0.674 | 0.668 | 0.687 | 0.669 | 0.659 |
| Timber Processing, Bamboo, Cane, Palm Fiber and Straw Products | 0.395 | 0.424 | 0.455 | 0.505 | 0.541 | 0.547 | 0.615 | 0.637 | 0.623 | 0.527 |
| Farm Byproducts Processing | 0.639 | 0.710 | 0.740 | 0.713 | 0.824 | 1.000 | 1.000 | 1.000 | 1.000 | 0.847 |
| Leather, Furs, Down and Related Products | 1.000 | 1.000 | 1.000 | 1.000 | 1.000 | 1.000 | 1.000 | 1.000 | 1.000 | 1.000 |
| Petroleum Processing, Coking and Nuclear Fuel Processing | 1.000 | 1.000 | 1.000 | 1.000 | 1.000 | 1.000 | 1.000 | 1.000 | 1.000 | 1.000 |
| Food Production | 0.432 | 0.434 | 0.473 | 0.486 | 0.542 | 0.529 | 0.576 | 0.598 | 0.575 | 0.516 |
| Plastic Products | 0.644 | 0.648 | 0.611 | 0.639 | 0.575 | 0.574 | 0.620 | 0.643 | 0.554 | 0.612 |
| Telecommunication Equipment, Computer and Other Electronic Equipment | 1.000 | 1.000 | 1.000 | 1.000 | 1.000 | 1.000 | 1.000 | 1.000 | 1.000 | 1.000 |
| Ordinary Machinery Manufacturing | 0.515 | 0.624 | 0.640 | 0.676 | 0.715 | 0.741 | 0.763 | 0.774 | 0.794 | 0.694 |
| Cultural, Educational and Sports Goods | 1.000 | 1.000 | 1.000 | 1.000 | 1.000 | 1.000 | 1.000 | 1.000 | 1.000 | 1.000 |
| Rubber Products | 0.421 | 0.456 | 0.435 | 0.472 | 0.448 | 0.450 | 0.469 | 0.485 | 0.471 | 0.456 |
| Tobacco Processing | 1.000 | 1.000 | 1.000 | 1.000 | 1.000 | 1.000 | 1.000 | 1.000 | 1.000 | 1.000 |
| Medical and Pharmaceutical Products | 0.395 | 0.361 | 0.425 | 0.419 | 0.469 | 0.510 | 0.555 | 0.575 | 0.574 | 0.476 |
| Instruments, Meters, Cultural and Office Machinery | 0.672 | 0.745 | 0.776 | 0.859 | 0.839 | 0.825 | 0.778 | 0.744 | 1.000 | 0.804 |
| Beverage Production | 0.360 | 0.335 | 0.408 | 0.430 | 0.465 | 0.477 | 0.520 | 0.532 | 0.532 | 0.451 |
| Printing and Record Medium Reproduction | 0.573 | 0.760 | 0.603 | 1.000 | 0.622 | 0.802 | 0.810 | 1.000 | 1.000 | 0.797 |
| Smelting and Pressing of Nonferrous Metals | 0.428 | 0.570 | 0.618 | 0.789 | 0.886 | 0.772 | 0.787 | 0.830 | 1.000 | 0.742 |
| Papermaking and Paper Products | 0.312 | 0.342 | 0.347 | 0.355 | 0.402 | 0.413 | 0.413 | 0.444 | 0.405 | 0.381 |
| For Special Purposes Equipment Manufacturing | 0.467 | 0.517 | 0.550 | 0.596 | 0.640 | 0.683 | 0.683 | 0.733 | 0.692 | 0.618 |
| Avg. | 0.625 | 0.656 | 0.675 | 0.723 | 0.727 | 0.743 | 0.762 | 0.784 | 0.796 | 0.721 |
Table 4.
Multiple Comparisons.
| (I) Group | (J) Group | Mean Difference (I–J) | Std. Error | Siq | 99% Confidence | |
|---|---|---|---|---|---|---|
| Lower Bound | Upper Bound | |||||
| 1 | 2 | 0.18507 * | 0.03234 | 0.000 | 0.0740 | 0.2961 |
| 3 | 0.32931 * | 0.03234 | 0.000 | 0.2183 | 0.4404 | |
| 4 | 0.51486 * | 0.03234 | 0.000 | 0.4038 | 0.6259 | |
| 2 | 1 | −0.18507 * | 0.03234 | 0.000 | −0.2961 | −0.0740 |
| 3 | 0.14424 * | 0.03234 | 0.001 | 0.0332 | 0.2553 | |
| 4 | 0.32979 * | 0.03234 | 0.000 | 0.2187 | 0.4408 | |
| 3 | 1 | −0.32931 * | 0.03234 | 0.000 | −0.4404 | −0.2183 |
| 2 | −0.14424 * | 0.03234 | 0.001 | −0.2553 | −0.0332 | |
| 4 | 0.18555 * | 0.03234 | 0.000 | 0.0745 | 0.2966 | |
| 4 | 1 | −0.51486 * | 0.03234 | 0.000 | −0.6259 | −0.4038 |
| 2 | −0.32979 * | 0.03234 | 0.000 | −0.4408 | −0.2187 | |
| 3 | −0.18555 * | 0.03234 | 0.000 | −0.2966 | −0.0745 | |
* The mean difference is significant at the 0.01 level.
Table 5.
Clustering analysis.
| Type | Industry | Interval |
|---|---|---|
| Green | Cultural, Educational and Sports Goods | [0.893, 1] |
| Tobacco Processing | ||
| Reclaiming and Processing of Abandoned Resource and Waste Material | ||
| Petroleum Processing, Coking and Nuclear Fuel Processing | ||
| Telecommunication Equipment, Computer and Other Electronic Equipment | ||
| Leather, Furs, Down and Related Products | ||
| Electric Equipment and Machinery | ||
| Smelting and Pressing of Ferrous Metals | ||
| Furniture Manufacturing | ||
| Light brown | Transport Equipment Manufacturing | [0.74, 0.847] |
| Farm Byproducts Processing | ||
| Smelting and Pressing of Nonferrous Metals | ||
| Handicraft Articles and Other Manufacture | ||
| Instruments, Meters, Cultural and Office Machinery | ||
| Garments, Shoes and Hats Production | ||
| Printing and Record Medium Reproduction | ||
| Dark brown | Raw Chemical Materials and Chemical Products | [0.612, 0.694] |
| For Special Purposes Equipment Manufacturing | ||
| Metal Products | ||
| Ordinary Machinery Manufacturing | ||
| Plastic Products | ||
| Black | Nonmetal Mineral Products | [0.381, 0.527] |
| Papermaking and Paper Products | ||
| Textile Industry | ||
| Rubber Products | ||
| Chemical Fiber | ||
| Timber Processing, Bamboo, Cane, Palm Fiber and Straw Products | ||
| Food Production | ||
| Medical and Pharmaceutical Products | ||
| Beverage Production |
© 2017 by the authors. Licensee MDPI, Basel, Switzerland. This article is an open access article distributed under the terms and conditions of the Creative Commons Attribution (CC BY) license (http://creativecommons.org/licenses/by/4.0/).
Share and Cite
MDPI and ACS Style
Qu, Y.; Yu, Y.; Appolloni, A.; Li, M.; Liu, Y. Measuring Green Growth Efficiency for Chinese Manufacturing Industries. Sustainability 2017, 9, 637. https://doi.org/10.3390/su9040637
AMA Style
Qu Y, Yu Y, Appolloni A, Li M, Liu Y. Measuring Green Growth Efficiency for Chinese Manufacturing Industries. Sustainability. 2017; 9(4):637. https://doi.org/10.3390/su9040637
Chicago/Turabian StyleQu, Ying, Ying Yu, Andrea Appolloni, Mengru Li, and Yue Liu. 2017. "Measuring Green Growth Efficiency for Chinese Manufacturing Industries" Sustainability 9, no. 4: 637. https://doi.org/10.3390/su9040637
Note that from the first issue of 2016, this journal uses article numbers instead of page numbers. See further details here.