Article

A Decision Model to Predict the Optimal Size of the Diversified Management Industry from the View of Profit Maximization and Coordination of Industrial Scale

1
School of Management, China University of Mining and Technology, Xuzhou 221116, China
2
Faculty of Engineering, University of Nottingham, Nottingham NG7 2RD, UK
3
Tyndall Centre for Climate Change Research, School of International Development, University of East Anglia, Norwich NR4 7TJ, UK
*
Authors to whom correspondence should be addressed.
Sustainability 2017, 9(4), 642; https://doi.org/10.3390/su9040642
Submission received: 16 February 2017 / Revised: 31 March 2017 / Accepted: 7 April 2017 / Published: 19 April 2017
(This article belongs to the Section Economic and Business Aspects of Sustainability)

Abstract

:
To avoid the risk of single and homogeneous development, China’s coal enterprises have explored a diversified development model and are actively developing coal-based industries such as electric power, coal chemical, coal equipment manufacturing, logistics, and building materials. In previous studies of the diversification strategy, the focus has been placed on the motivation for diversification, the measurement of diversification, and the relationship between diversification and enterprise performance. From an enterprise strategic decision, we predicted the optimal size of each industry by considering the limited enterprise capital, human resources, the synergetic relationship among industrial clusters (mainly the scale coordination), and policy factors. The optimal decision model for diversified industrial management was constructed using linear programming methods. The decision target was to maximize the enterprise’s profit, but to also consider the social and environmental benefits. One of the largest listed coal enterprises in China, China Coal Energy (also a typical diversified enterprise), was selected as a case for analysis. Data were collected from surveys and annual reports from 2010 to 2014. The optimal scales of coal, electric power, chemical, and equipment manufacturing were predicted, and could be used as a reference for future enterprise production decisions. Furthermore, this decision model can be used as a reference for other diversified enterprises.

1. Introduction

As China’s most important energy source, coal supports the development of the national economy and is of critical significance for national energy security. The Project Group of China’s Medium-to-Long-Term Energy Development Strategy Research [1] pointed out that a major energy structure adjustment would occur from 2030 to 2050, yet coal was expected to remain as the foundation of the energy system and believe that coal consumption will account for 50% of the whole primary energy consumption in 2030. According to the Action Plans for Energy Development Strategy (2014–2020) [2], this proportion is planned to be 62% at the government and policy level. Therefore, coal will still be the primary energy in China for an extended period. The healthy development of coal enterprise is significant in maintaining the sustainable development of the national industry and national economy.
Since 2012, the operating performance of China’s coal enterprises has fluctuated significantly [3]. Impacted by excess capacity, imported coal, the stress of environmental protection, and weak downstream demand [4], China’s coal enterprises have suffered significant loss. According to the latest data from the National Bureau of Statistics of China, revenue from coal mining and washing industries from January–June 2016 decreased by 13% and total profit fell by 38.5% [5]. Overreliance on the coal industry may cause business risk to coal enterprises, as its performance is constrained by the finite nature of coal resources and fluctuations of downstream industries such as steel and building materials [6].
However, according to the regulations in the Action Plans for Energy Development Strategy (2014–2020) [2], the overall national coal consumption by 2020 was planned to be limited to around 4.2 billion tons. The “policy ceiling” of coal consumption forces coal enterprises to change their development model, as they can no longer focus solely on the coal industry.
With the struggling coal industry and policy constraint, China’s coal enterprises have actively developed many non-coal industries and have explored a diversified development model by fully playing the advantage of the coal industry itself to avoid the risk of forming a single homogeneous type of development. Currently, coal enterprises have managed to form a coal-based diversified development pattern [7], and the industry’s economic benefits and comprehensive development have seen a certain degree of improvement. The common feature is that while maintaining the development of the coal industry to ensure its capacity’s continued growth, the industry chain has continuously expanded upstream and downstream to processing and manufacturing, including coal chemicals, coal coking, electrolytic aluminum, coal-based building materials, coal and electricity integration, and other industrial chains, such as real estate, tourism, and new energy industries [6]. According to data from the China Coal Industry Yearbook 2013 [8], the coal industry accounted for 56.87% of its total revenue, and non-coal industries accounted for 43.13% of their total revenue in 2013. The output value of non-coal industries already occupies a large proportion of the total output value of coal enterprises, and coal enterprises have entered a stage of diversified development [9].
By analyzing the characteristics of the listed coal enterprises’ diversified development model, we found that most enterprises are devoted to coal-based industries, such as electric power, coal chemicals, coal equipment manufacturing, logistics, and building materials [6,9]. Experiencing a certain period of diversified development, business decision makers want to know the optimal scale of each industry, so that the enterprise can strive to maximize profits.
To provide a reference to business decision makers at the enterprise level and to the government industrial policy makers, we built a decision model concerning the diversified coal enterprises’ operating conditions. In this model, the optimal size of each industry was predicted by considering the limited enterprise capital and human resources, the synergetic relationship between industrial clusters (mainly the scale coordination) and policy factors. The decision target was to maximize the enterprise’s profit, but to also consider the social and environmental benefits. A typical diversified coal enterprise—China Coal Energy—was selected as a case study, and the optimal scales of coal, electric power, chemical, and equipment manufacturing industries were predicted using the decision model. The calculated results are a reference to the decision makers, from which the recommended development tendency of each industry can be found.

2. Literature Review

The motivation for diversification includes lowering risk dispersion, expanding the economy of scope, exploiting synergistic effects, and saving transaction cost benefits [10,11,12,13,14]. Ansoff [10] first suggested the concept of diversified management from the perspective of an enterprise growth strategy. He defined “diversification” from the angle of the quantity of the products. He believed that there are four stages of business growth in different directions: growth within the existing market growth, sales of new products within the existing market, sales of existing products to new markets, and the sales of new products to new markets; the fourth stage is the so-called diversified management. For the convenience of study, Penrose [15] defined “diversification”—from the perspective of diversified behavior and the growth of enterprise—as the growth of the final product categories, the enhancement of vertical integration, and the increase of industry covered by the products made by the enterprise. This final part is the most important measure of diversity. Generally, diversified business refers to the diversification of products manufactured by a specific enterprise [16,17,18,19]. To summarize, according to these definitions, the diversification of enterprise is generally considered to be the operation of a variety of products or businesses. From an industrial angle, it is considered to be a business covering several industries, or from a marketing perspective, as management facing multiple markets. The difference in the definition lies in the perspectives and differences in the definition of product, business, industry, and market.
Few studies have been conducted in the area of the diversification development of coal enterprises. Some research has focused on the restructuring or reorganization of coal enterprises [20,21,22]. Nawrocki and Jonek-Kowalska [21] investigated coal mining enterprises in Central and Eastern Europe, and believe that a high number of operation segments could lower operational risk. In the restructuring process, some coal-related industries or businesses have been raised. Hu [22] examined the path-creation mechanism of the coal-chemical industry and its relatedness to the old path of the coal mining industry, and revealed that the rise of the new path benefits from the old, to a limited extent.
Since 2012, China’s coal industry has experienced four years of recession, causing most coal enterprises to suffer remarkable losses [4,23]. Currently affected by long-term low coal prices and forecasts that the current recession may continue for longer than anticipated, a number of coal enterprises have developed new profit increasing points through industry transition by developing coal-associated industries and avoiding the risk of homogenization within their operation model. In general, new industries usually evolve out of the existing business [24]. Through research and investigation during the process of developing coal enterprise diversification, downstream industries such as electric power, building materials, and the coal chemical industry have been developed with the coal industry at the center, and are promoted by industrially-related superiority (primarily cost competitiveness). These coal enterprises must determine how—under fixed capital and human resource input—they can define the boundaries of respective industries, or the optimal size of each industry, by considering enterprise capital and human resources and the industrial synergy effect to maximize enterprise profit. At present, no studies have been made regarding the definition of the optimal size of various industries in the development of coal enterprises.
The ultimate goal is the pursuit of profit. Profit maximization is usually regarded as the target of enterprise economic behavior. In previous studies, focus was placed on the motivation for diversification, the measurement of diversification, and the relationship between diversification and enterprise performance [18,19,25,26,27]. This study proposes a solution for an optimal decision regarding the enterprise production plan with available capital and human resources by fully considering the industrial synergy effect and the profit ratios of industries.

3. Method: Optimal Decision Model

3.1. Model Hypothesis

During the process of production and management, enterprises are affected by uncontrollable factors such as market environment and production stability. To ensure the study’s validity, the following hypotheses were made:
  • That production technology level remained unchanged during the planned period.
  • That raw materials arrived at the beginning of each period without delays or shortages.
  • That a total of n industries was covered by the enterprise, with the unit product price, sales volume, as well as the capital investment and labor input for each industry expressed as P i , Q i , K i , L i , i = 1 , 2 n . The planned period lasted one year, and decisions were to be made at each quarter. t is the time serial number during the planned period, t = 1 , 2 Τ . K i t represents the capital input for each unit of production during the time period t . L i t represents the labor input for each unit of production during time period t .
  • In the statistics of product sales, the sales volume was divided into internal trading volume and market trading volume (as regards the synergy among various coal-related industries, the internal trading volume refers to the condition when certain a product is used as a raw material for other products made by the enterprise; otherwise, the trading volume is classified as market trading volume). The trading volume is expressed as Q i = j = 1 2 Q i j , j = 1 and j = 2 refer to internal and market trading volume, respectively. Accordingly, the prices for internal and market transactions are expressed as P i 1 and P i 2 . P i 1 t represents the internal transaction price of a unit product during time period t , and P i 2 t represents the market transaction price of a unit product during time period t . Q i 1 t represents the internal trading volume of a unit product during time period t , and Q i 2 t represents the market trading volume of the unit product during time period t . Q i t represents the total industrial production generated during t .
  • That production costs included capital investments, labor input, and other fixed investments. Capital investments, labor input, and fixed investments are represented by K , L , and F C , respectively. Accordingly, the unit price of capital and labor are represented by P K and P L . P K t represents the unit price of capital input during time period t , and P L t represents the unit price of labor input during the t time period. The capital and labor input during the t time period are expressed with K t and L t . Therefore, the total variable cost during the t time period is expressed with T V C t = K t P K t + L t P L t . The fixed input during the t time period is T F C t . Therefore, the total input for production can be expressed using T C t = T V C t + T F C t = K t P K t + L t P L t + T F C t .

3.2. Model Construction

3.2.1. Selection of Decision Variable

Determining correct decision variables was important in constructing the correct model. The current study aims to solve the optimal decision for production plans; i.e., the optimal combination of inputs and outputs. The output was selected as the decision variable when there was cross-use of fixed inputs (e.g., equipment) during the diversification process, making it difficult to correspond to an individual industry.

3.2.2. Determination of Objective Function

On the basis of choosing the output as the decision variable, the enterprise’s profit depended on the price and the cost of the product. In this paper, the product profit was set as the optimization objective, Z as the total profit; the objective function can then be described as M a x Z .
M a x Z = i = 1 n ( P i 1 t Q i 1 t + P i 2 t Q i 2 t ) ( K t P K t + L t P L t + T F C t )
In the objective function, P i 1 t , P i 2 t , K t , P k t , L t , P L t , T F C t are the parameters and the prediction was made in accordance with the principle of year-on-year growth compared with the last studied period.

3.2.3. Statement of Constraint

The constraints reflect the relationship that must be followed by the decision variables and parameters. In this study, the production plan was limited by capital investment, labor input, and industrial scale.
Constraint of labor:
i = 1 n L i t ( Q i 1 + Q i 2 ) L t
Constraint of capital:
i = 1 n K i t ( Q i 1 + Q i 2 ) K t
Here we should consider one fact relating to the practice of Chinese coal enterprises: the development of coal-related industries (usually the downstream industries of coal) and the synergistic effect among such industries are common, which means that there exist transformation and utilization between products and raw materials between industries X and Y. When industry X expands, the raw material (Y) for the production of X increases. However, for industry Y, the volume meeting the production requirements is the internal transaction volume, and the volume supplied to the external market is the market transaction volume. The sum of the two parts should be less than the expected output of the existing production technology (here we considered the synergistic effect faced by the coal enterprise, with the coal industry as its center, without considering the synergistic effects of the electric power industry, the chemical industry, or equipment manufacturing).
To express this as a mathematical relationship: Q i 1 + Q i 2 Q i t ( i = 1 , 2 n ) .
Nonnegative constraint: Q i j t 0 .
In the constraint conditions above, Q i t , K i t , L i t are parameters, and the prediction was made in accordance with the principle of year-on-year growth compared with the last studied period.

3.2.4. Theoretical Model of Profit Decision

M a x Z = i = 1 n ( P i 1 t Q i 1 t + P i 2 t Q i 2 t ) ( K t P K t + L t P L t + T F C t ) s . t . { i = 1 n L i t ( Q i 1 + Q i 2 ) L t i = 1 n K i t ( Q i 1 + Q i 2 ) K t Q i 1 + Q 12 Q i t ( i = 1 , 2 n ) Q i j t 0
In the model for profit decision, K t , L t , P K t , P L t , T F C t , P i 1 t , P i 2 t , L i t , K i t , Q i t are the parameters, and determining the parameter values was required to research the basic data of relevant enterprises. The principle of year-on-year growth was followed to predict the values of studied time period.

3.3. Solution for the Model: Case of China Coal Energy

3.3.1. Data Collection and Determination of Parameter Values

China Coal Energy is one of the China’s largest coal enterprises and a typical Chinese coal enterprise with diversified business. The Group has 21 wholly-owned or hold coal mines, located in eight mining areas in Shanxi, Jiangsu, Heilongjiang, and Shaanxi Provinces. In 2015, China Coal Energy produced approximately 166 million tons, and its business income was 82.5 billion yuan. Its development covers four industries, including coal, electric power, and the chemical and equipment manufacturing industries. China Coal Energy was selected as our case study, and its data were acquired from an annual report which defined and predicted the optimal scale of each industry.
The average rate per annum for each parameter was calculated using the data from annual reports and investigation spanning 2010–2014. Parameter values for the studied time period (2016) were predicted using the principle of year-on-year increases. The results are shown in Table 1.

3.3.2. Solution of Optimal Value

Substituting the parameter values into the model, the linear programming equation of profit decision model can be expressed as:
M a x Z = 88.49 Q 11 t + 315.99 Q 12 t + 0.34 i = 1 2 Q 2 i t + 2076.12 i = 1 2 Q 3 i t + 20401.54 i = 1 2 Q 4 i t 37 , 961 , 808 , 349 s . t . { 0.000258 ( Q 11 + Q 12 ) + 2.558 × 10 7 ( Q 21 + Q 22 ) + 0.001878 ( Q 31 + Q 32 ) + 0.04678 ( Q 41 + Q 42 ) 73748.993 50.8632 ( Q 11 + Q 12 ) + 0.07215 ( Q 21 + Q 22 ) + 2017.471 ( Q 31 + Q 32 ) + 1211.775 ( Q 41 + Q 42 ) 25272465088 Q 11 + Q 12 168 , 383 , 373.3 Q 21 + Q 22 5 , 130 , 480 , 998 Q 31 + Q 32 16 , 156 , 261.36 Q 41 + Q 42 181 , 375.5781 Q 11 , Q 12 , Q 21 , Q 22 , Q 31 , Q 32 , Q 41 , Q 42 0
The formula was solved using Excel’s data analysis function. The optimal solution value for the model was: 168,383,400, 513,048.1, 7,989,478, and 181,375.6. The maximum value of the corresponding objective function was 3.729 × 10¹⁰. Therefore, the optimal scale for coal, electric power, the chemical industry, and equipment manufacturing during the diversified development of China Coal Energy are, 0.168 billion tons, 5.13 billion kilowatt-hours, 7.989 million tons, and 181,375 tons. This is expected to reach a total profit of 37.29 billion yuan.

3.4. Sensitivity and Reliability Analysis

The objective coefficient and right-hand side values in the model were estimated based on the last five years of industry data and the enterprise’s operating data, which were all collected from the enterprise’s annual reports and enterprise survey. Limited by the available data and information, the objective coefficient and right-hand side values may change in certain ranges. Additionally, the objective coefficient and right-hand side values that represented the product price, enterprise capital, human resources, and the synergetic relationship can also be affected by integrated factors. That means that if the objective coefficient and right-hand side values change, could the optimal solution still be reliable? Thus, a sensitivity and reliability analysis was conducted using Microsoft Excel’s data analysis function. The internal transaction price was set as the same as the market transaction price of electric power, chemical, and equipment manufacturing industries to ensure that the sensitivity analysis was clear and straightforward, and we simplified the variable price. A, B, C, D, E represent Q 11 , Q 12 , Q 2 , Q 3 , Q 4 , respectively.
The analysis results are shown in Table 2 and Table 3.
As shown in Table 2, the price of each industry’s product has a relatively great range that cannot change the optimal solution or optimal basis. In other words, the predicted scale of each industry would not change when the price of each industry’s product changed in the allowable range. Generally, a product’s price is influenced by many factors, especially given the fluctuating price of coal in recent years. As the basis of the constraint conditions (i.e., capital investment, labor input, other fixed investments, the unit price of labor input, and the total industrial production) remain constant, the optimal solution (i.e., the predicted scale of each industry) is of significance. However, the more specific the constraint conditions, the more reliable the predicted results. Furthermore, when the right-hand side changed, the optimal solution could change, but the optimal basis remained unchanged.

4. Results

As shown in Table 4, a statistical analysis of the scale of various industries from 2010 to 2014 for China Coal Energy showed that in order to realize profit maximization, the scale of the chemical industry increased from 6.4437 million tons in 2014 to 7.9895 million tons; the scale of the equipment industry down-regulated significantly from 273.153 thousand tons in 2014 to 181.376 thousand tons; and the scale of the coal and electric power industry decreased or increased slightly compared with the current scale.
In order to reasonably analyze the changes in the industrial scale and to verify the rationality of the results from the models, we analyzed the profit ratio of industry operating costs related to coal energy over the past five years. These results are shown in Table 5 and Figure 1.
The rationality of the optimal scale of industry was discussed by considering the profit change rate of related industries covered by China Coal Energy, the effects of political factors, and the synergetic relationship between coal and non-coal industries:
  • Based on the program results, one recommendation is to develop the chemical industry and expand the scale of production after comprehensively considering the profit ratio, industrial cooperation, and the political environment.
    (1)
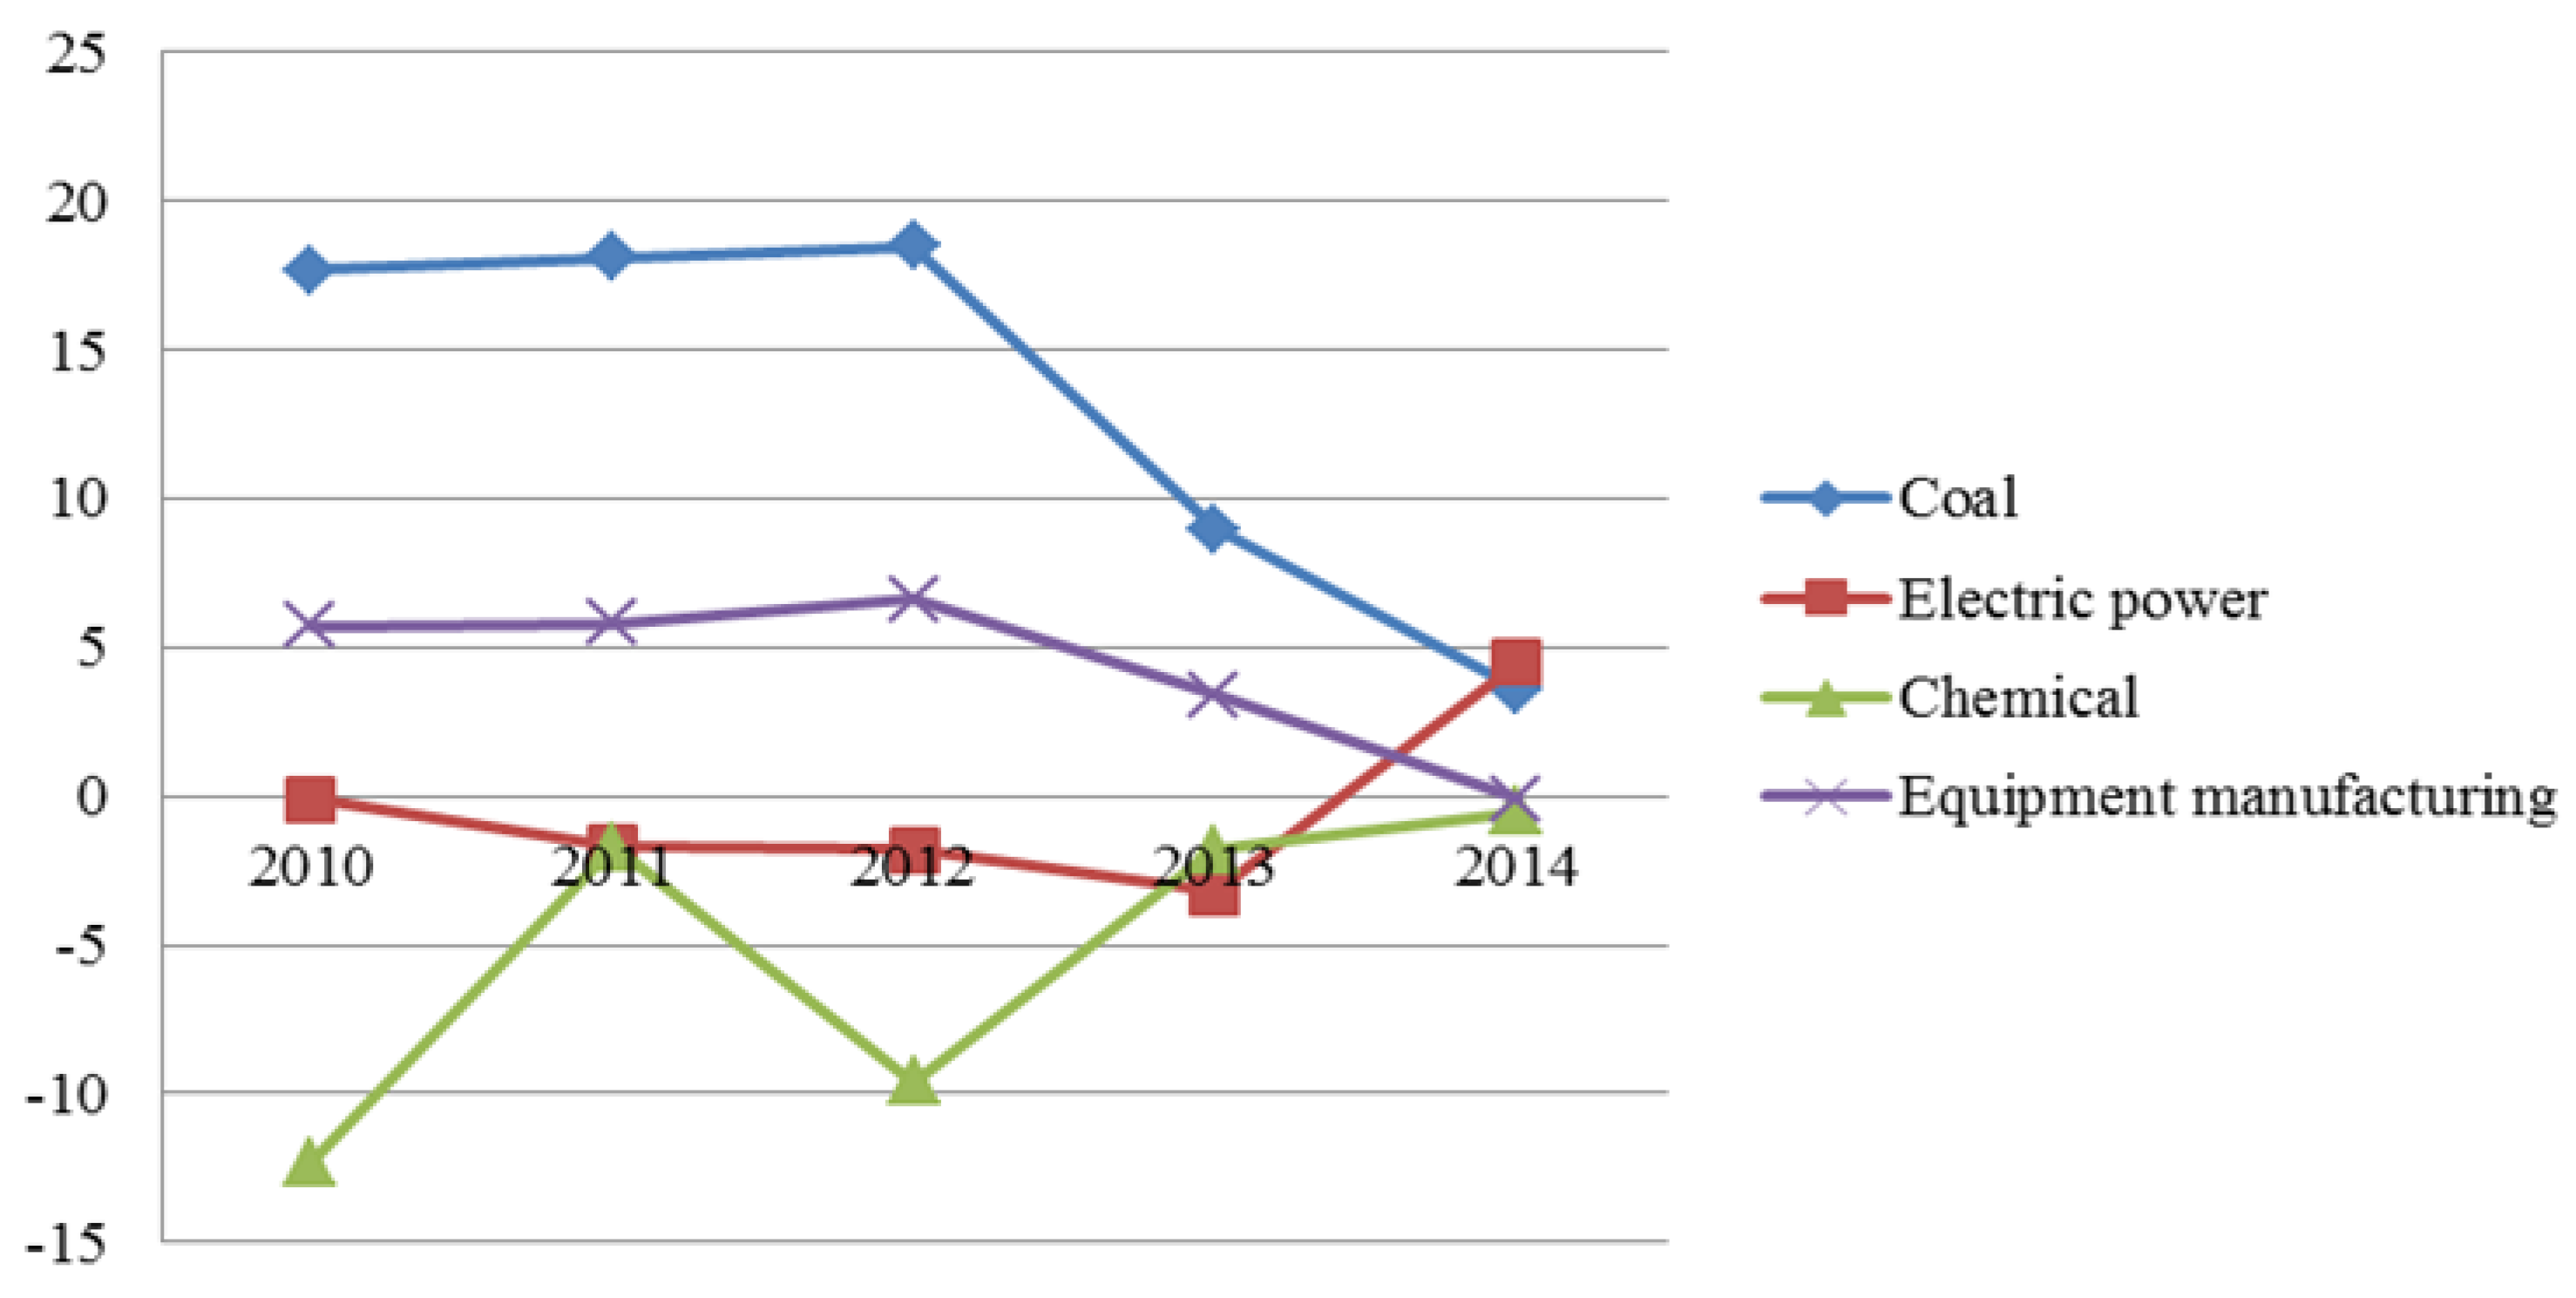
    The profit rate of the chemical industry is on the rise, especially since 2012 when the profit rate increased with a scale expansion of a larger rising degree.
    (2)
    The coal industry and coal chemical industry are closely linked. The raw materials of chemical products such as synthetic gas, liquefied petroleum, coke, and other such products are dependent on the supply of the coal industry, which greatly affects the chemical industry. As coal prices continue to decline, the cost of the coal chemical industry will decrease, raising the profit ratios.
    (3)
    Implementation of the clean coal utilization strategy in China supports the development of the coal chemical industry, which is then supported by a favorable policy environment.
  • As the profit ratio of the coal industry keeps decreasing due to the macro economy and overcapacity problems, we propose compressing the production scale of coal block.
    (1)
    Since 2012, the coal industry has been affected by the macro economy, overcapacity, and oversupply, causing a significant decrease in the coal industry’s profit ratio.
    (2)
    In the profit decision model, the scale of each industry is limited by the enterprise’s total capital investment, which explains the relationship in which the scale of chemical industry production has greatly improved while other industries are downregulated.
    (3)
    Considering the political factors, China promotes the development of new energy and limits coal consumption, which leads coal enterprises to actively adjust their industrial layout, reducing coal production.
  • The production scale of the equipment manufacturing industry is influenced by the coal industry. With the decline in production scale and the decreasing profit ratio of the coal industry, we recommend compressing the production scale of the equipment manufacturing industry.
    (1)
    The equipment manufacturing industry’s profit ratio continued to decline, and the decline range was fairly large, whereas the equipment manufacturing industry fell below the break-even point in 2014 with negative annual growth.
    (2)
    The equipment manufacturing industry is closely linked to the development of the coal industry. The primary product of the coal equipment manufacturing industry developed by China Coal Energy is coal machine equipment, where the customers are the coal production enterprises, or for the manufacturing industry’s own use. The coal industry influences the equipment manufacturing industry’s production scale, and the changing profit trends of these two are consistent. As the coal industry shrinks, the equipment-manufacturing industry should correspondingly reduce its expected output.
    (3)
    As the products of the equipment manufacturing industry—conducted by coal enterprises—are supplied to coal production enterprises or to the coal sector of the enterprise, political factors also affect the equipment manufacturing industry.
  • Since the total investment of these enterprises is fixed and we have already proposed to greatly expand the production scale of the chemical industry, with the addition of considerations regarding profit rate and political factors, we suggest maintaining or appropriately expanding the scale of the power industry.
    (1)
    The electric power industry’s profit ratio continued to decline from 2010 to 2013, but increased substantially from 2013–2014, changing from a negative to a positive number. By analyzing China Coal Energy’s annual data, we see that the operating revenue of the power industry was relatively stable during 2013 and 2014, while business costs decreased significantly. Therefore, we see a remarkable increase in the operating margin. Based on changes to the profit rate, should the profit ratio keep increasing for an extended period, the enterprise’s decision makers could consider expanding the scale of the power industry.
    (2)
    With consideration to the financing ability of coal enterprises due to the limited total capital invested by the enterprise, and because the industrial scale is limited by the total capital of the enterprise, blind expansion of the electric power industry should be avoided while greatly improving the scale of the chemical industry.
    (3)
    Under the background of a national call for the development of clean electricity, coal enterprises should make appropriate decisions to increase or cut back production during the diversification process by integrating multiple factors, including policy, industry profit ratios, and business risks.

5. Conclusions and Prospects

In this study, we built a decision model to predict the optimal size of each industry for diversified coal enterprises. The basic idea was to consider enterprise capital, human input constraints, and industrial cooperation (primarily the scale cooperation), as well as the political impact based on the principle of profit maximization to build an optimal industrial size model using the linear programming method. We selected a typical diversified coal enterprise—China Coal Energy—as a case study to provide a reference for the decision makers of coal enterprises or industrial policy makers. Based on the available data and information, we put forward corresponding suggestions regarding the optimal scale of each industry. However, this could not act as the final decision for enterprise decision makers. It is our recommendation that various factors need to be taken into consideration, such as economic, social environmental, and policy factors. Furthermore, the higher the accuracy of the operating data used in the model, the more significant and reliable the prediction results. Nevertheless, the following points need to be further studied or improved:
(1)
We have calculated and predicted the development tendency of each industry in the case study. However, the results are based only on the decision model and the limited data. Decision makers in both coal enterprises and government should consider other factors, such as the human cost change, inflation or deflation, and technical progress. Additionally, given that the industries that the coal enterprises develop are more or less connected with core mining business, there still exists some future risk;
(2)
The optimal scale model of industries should concern different policy scenarios, such as the policies of the different industries made by the government—especially energy and coal industry plans issued by the government—which could affect the product output;
(3)
Although we have mentioned several policy factors, including the social and environmental benefits, when we offer proposals in the case study, the decision target is still the profit maximization in the decision model. The next step will be quantifying the social and environmental impacts with objective functions.
(4)
It is recommended that more data are collected and calculated in the model to improve the reliability of the results.

Acknowledgments

The authors are grateful for the financial support received from “the Fundamental Research Funds for the Central Universities (2017BSCXB23)”.

Author Contributions

Chong-Mao Li, Tao Cui and Rui Nie conceived this research; Chong-Mao Li, Juan Wang and Xiangyan Qian built the optimal decision model for diversified industrial management; Chong-Mao Li and Tao Cui contributed to the overall quality of the paper; Tao Cui performed the enterprise survey; Yuli Shan, Xiangyan Qian and Juan Wang analyzed the data and wrote the paper. Chong-Mao Li and Yuli Shan contributed to the paper revising process. All authors have read and approved the final manuscript.

Conflicts of Interest

The authors declare no conflict of interest.

References

  1. Project Group of China’s Medium-to-Long-Term Energy Development Strategy Research. Research on China’s Medium-to-Long-Term Energy Development Strategy (2030, 2050), Energy Saving and Coal Volume; Science Press: Beijing, China, 2011. (In Chinese) [Google Scholar]
  2. General Office of the State Council of China Action Plans for Energy Development Strategy (2014–2020). Available online: http://www.gov.cn/zhengce/content/2014-11/19/content_9222.htm (accessed on 20 December 2016). (In Chinese)
  3. Tang, X.; Jin, Y.; McLellan, B.C.; Wang, J.; Li, S. China’s coal consumption declining—Impermanent or permanent? Resour. Conserv. Recycl. 2016. [Google Scholar] [CrossRef]
  4. Li, C.; Nie, R.; Wang, D. Scientific mining in China—Problems, progress, and prospects. Electron. J. Geotech. Eng. 2015, 20, 6491–6506. [Google Scholar]
  5. National Bureau of Statistic of China from January through June of 2016, Enterprises at National Scale Increased by 27.9% over the Same Period of Last Year. Available online: http://www.stats.gov.cn/tjsj/zxfb/201607/t20160727_1381841.html (accessed on 20 December 2016). (In Chinese)
  6. Li, C.; Cui, T.; Nie, R.; Yan, X. Measurement of the Industrial Collaboration of the Diversified Coal Industry: China Coal Energy Company as an Example. Math. Probl. Eng. 2017, 2017, 9416279. [Google Scholar] [CrossRef]
  7. Li, Q.; Wang, W.; Lou, Y.; Cheng, K.; Yang, X. Diversification and Corporate Performance: Evidence from China’s Listed Energy Companies. Sustainability 2016, 8, 983. [Google Scholar] [CrossRef]
  8. China Coal Information Institute. China Cola Industry Yearbook 2013; China Coal Industry Publishing Home: Beijing, China, 2015. (In Chinese) [Google Scholar]
  9. Cui, T.; Li, C.-M.; Nie, R.; Yan, X.-Y.; Qian, X.-Y. Measurement of diversification degree in large listed coal enterprises in china—A case study of shenhua group. Electron. J. Geotech. Eng. 2016, 21, 4013–4024. [Google Scholar]
  10. Ansoff, H.I. Strategies for diversification. Harv. Bus. Rev. 1957, 35, 113–124. [Google Scholar]
  11. Hoskisson, R.E.; Hitt, M.A. Antecedents and performance outcomes of diversification: A review and critique of theoretical perspectives. J. Manag. 1990, 16, 461–509. [Google Scholar] [CrossRef]
  12. Markides, C.C.; Williamson, P.J. Corporate diversification and organizational structure: A resource-based view. Acad. Manag. J. 1996, 39, 340–367. [Google Scholar] [CrossRef]
  13. Hyland, D.C.; Diltz, J.D. Why firms diversify: An empirical examination. Financ. Manag. 2002, 31, 51–81. [Google Scholar] [CrossRef]
  14. Ueng, C.J.; Wells, D.W. Corporate diversification, manager’s incentive, and shareholder wealth. J. Appl. Bus. Res. 2011, 17. [Google Scholar] [CrossRef]
  15. Penrose, E.T. The Theory of the Growth of the Firm; Oxford University Press: New York, NY, USA, 1995. [Google Scholar]
  16. Wernerfelt, B. Umbrella branding as a signal of new product quality: An example of signalling by posting a bond. RAND J. Econ. 1988, 19, 458–466. [Google Scholar] [CrossRef]
  17. Ramanujam, V.; Varadarajan, P. Research on corporate diversification: A synthesis. Strateg. Manag. J. 1989, 10, 523–551. [Google Scholar] [CrossRef]
  18. George, R.; Kabir, R. Heterogeneity in business groups and the corporate diversification–firm performance relationship. J. Bus. Res. 2012, 65, 412–420. [Google Scholar] [CrossRef]
  19. Nath, P.; Nachiappan, S.; Ramanathan, R. The impact of marketing capability, operations capability and diversification strategy on performance: A resource-based view. Ind. Mark. Manag. 2010, 39, 317–329. [Google Scholar] [CrossRef]
  20. Dervaric, E.; Medved, M.; Malenkovic, V. Strategic factors and a model of enterprise restructuring in the coal industry in Europe with emphasis on experiences in a Slovenia-Valenje coal mine case. J. South. Afr. Inst. Min. Metall. 2008, 108, 627–640. [Google Scholar]
  21. Nawrocki, T.L.; Jonek-Kowalska, I. Assessing operational risk in coal mining enterprises—Internal, industrial and international perspectives. Resour. Policy 2016, 48, 50–67. [Google Scholar] [CrossRef]
  22. Hu, X. From Coal Mining to Coal Chemicals? Unpacking New Path Creation in an Old Industrial Region of Transitional China. Growth Chang. 2017. [Google Scholar] [CrossRef]
  23. Song, M.; Wang, J. Coal price fluctuations in China: Economic effects and policy implications. J. Renew. Sustain. Energy 2016, 8, 065901. [Google Scholar] [CrossRef]
  24. Zhou, Y.M. Synergy, coordination costs, and diversification choices. Strateg. Manag. J. 2011, 32, 624–639. [Google Scholar] [CrossRef]
  25. Christensen, H.K.; Montgomery, C.A. Corporate economic performance: Diversification strategy versus market structure. Strateg. Manag. J. 1981, 2, 327–343. [Google Scholar] [CrossRef]
  26. Nayyar, P.R. On the measurement of corporate diversification strategy: Evidence from large US service firms. Strateg. Manag. J. 1992, 13, 219–235. [Google Scholar] [CrossRef]
  27. Boehe, D.M.; Jimenez, A. How does the geographic export diversification-performance relationship vary at different levels of export intensity? Int. Bus. Rev. 2016, 25, 1262–1272. [Google Scholar] [CrossRef]
Figure 1. Profit ratio of each of China Coal Energy’s industries over the last five years.
Sustainability 09 00642 g001
Table 1. Four major industry related parameters for China Coal Enterprise.
Industry Name P i l t (yuan/ton or kWh) P i 2 t (yuan/ton or kWh) L i t (Labor/ton or kWh) K i t (yuan/ton or kWh) Q i t (ton or kWh)
Coal industry88.487315.9910.00025850.8632168,383,373.3
Electric power industry0.3430.3432.558 × 10−70.072155,130,480,998
Chemical industry2076.1172076.1170.0018782017.47116,156,261.36
Equipment manufacturing industry20,401.5420,401.540.046781211.775181,375.5781
Lt73,748.993
Kt25,272,465,088
TFCt78,22,610,567
Table 2. Objective coefficient ranges.
VariableCurrent CoefficientAllowable IncreaseAllowable Decrease
A88.48699951227.5039978infinity
B315.9909973infinity227.5039978
C3430infinity2687.526298
D2076.1170047514.9046172076.117004
E20,401.54infinity19,154.51348
Table 3. Right-hand side ranges.
RowCurrent RHSAllowable IncreaseAllowable Decrease
273,748.993infinity5504.716969
32,527,246.509591,352.57421,611,853.159
4168,383,373.326,131,307.51168,383,373.3
5513,048.09982,918,140.811513,048.0998
616,156,261.36infinity8,166,783.652
7181,375.5781120,580.0449181,375.5781
Table 4. Industrial scale changes for China Coal Enterprise during 2010–2014.
Industry NameParameters201320142016
CoalTotal output (10 thousand tons)19,08418,30416,838.34
Electric powerTotal output (10 thousand kWh)471,708485,104513,048.1
ChemicalTotal output (10 thousand tons)172.163644.371798.9478
Equipment manufacturingTotal output (10 thousand tons)33.521227.315318.1376
Table 5. Operating profit ratio for China Coal Energy over the last five years.
Operating Profit Ratio20102011201220132014
Coal17.718.118.59.03.6
Electric power−0.09−1.7−1.8−3.24.5
Chemical−12.3−1.7−9.6−1.8−0.5
Equipment manufacturing5.75.86.63.4−0.1

