
Sustainable Evaluation of Social Science Research in Higher Education Institutions Based on Data Envelopment Analysis


Department of Economics and Management, Southeast University, Nanjing 210096, China
*
Author to whom correspondence should be addressed.
Sustainability 2017, 9(4), 644; https://doi.org/10.3390/su9040644
Submission received: 6 March 2017
/
Revised: 7 April 2017
/
Accepted: 12 April 2017
/
Published: 19 April 2017
(This article belongs to the Section Sustainable Education and Approaches)
Abstract
:This paper divides the typical social scientific research process into two stages: the research development stage and the research innovation stage, with personnel as a shared input between them. We construct an input-shared multi-period two-stage DEA (data envelopment analysis) model as measurement of sustainability capacities of social scientific research, and then measure both the overall efficiencies and the stage efficiencies of scientific research of 18 HEIs (higher education institutions) in Jiangsu province of China from 2010 to 2014. There are some revelatory traits among the overall efficiencies and stage efficiencies of HEIs. As for the HEIs, the efficiencies of the first stage of certain HEIs that are better in social science are higher than those which have advantage in natural science. The results are the opposite in the second stage. Additionally, in virtue of common-weight global MPI (Malmquist Productivity Index), we figure out the dynamic efficiencies within and between HEIs. Finally, we appeal to administration departments to establish academic sharing systems and construct interdisciplinary ecosystems among HEIs, which aims to pool the knowledge, experience, and capacities of the region’s academic actors and improve the sustainable development and innovation abilities of social scientific research. In addition, collaborating with industrial organizations is also a strategic avenue to improve their research abilities, which can push the boundaries of sustainable development and also bring vigor in social scientific research.
1. Introduction
Social science is a branch of science that deals with various phenomena of human society with scientific methods (https://en.wikipedia.org/wiki/Social_science). Furthermore, social scientific research plays a crucial role in the long-term development of a country, and it is a strategic component of the national competitiveness [1]. Currently, the scientific research of HEIs, as an important engine of social changes, has played a leading role in economic development. Different from natural science which has enterprise markets as its research hotbeds, social scientific research is mostly launched by HEIs where a large number of researchers are gathered producing abundant innovative research achievements. Therefore, some developing countries, including China, have offered considerable support to the social scientific research in HEIs, trying to improve the creativity and sustainability of social science development [2].
In China, the investment in social science by the governments at all levels is incredibly abundant, taking social science R&D funds of HEIs in Jiangsu Province as an example. In 2014, the funds from governments was 441.25 million yuan, accounting for approximately 60.1% of all sources of funds, which can show that the development of the social science has captured enough attention from the government departments. After investing such a huge amount of money, it is natural and reasonable for the stakeholders, such as policy-makers, administrators of HEIs and scholars to shift their attention to the operation and evaluation of the scientific research supported by those funds. They try to evaluate the performance of the scientific research among HEIs, in order to make resource allocation more efficient, and then to achieve an overall development of scientific research, exerting positive influence on regional innovation, and economic and social development.
In recent years, research evaluation has gradually become a crucial tool for the government to promote the development of the scientific research of HEIs. At the end of 2013, the Ministry of Education issued the “Opinions on Deepening the Reform of Scientific and Technological Evaluation of Colleges and Universities”, saying, for HEIs, that scientific and technological evaluation is not only their main means of scientific and technological management, but also assists with more efficient allocation of resources and macro-management. Hence, deepening the reform of scientific and technological evaluation of HEIs is of great significance in improving HEIs’ innovation ability, promoting the comprehensive reform of higher education, and realizing innovation-driven development. Moreover, the Ministry of Education released more guidance on the evaluation of scientific research of teachers in HEIs at the end of 2016, trying to establish an all-in-one linkage mechanism, encompassing evaluation of teachers, HEIs and disciplines. This guidance is of great significance for evaluation of both basic and applied research, especially the emerging interdisciplinary comprehensive research.
However, scientific research is an intensive process of transforming tacit knowledge into explicit knowledge, and it is difficult to evaluate, let alone do an inter-temporal evaluation. Meanwhile, HEIs as a non-profit organization still retain their certain key characteristics—“the lack of profit motive, goal diversity and uncertainty, diffuse decision-making, and poorly understood production technology,” all of which distinguish them from other types of social organizations [3]. Although those characteristics have been weakened over time with gradual diversifying roles, for the HEIs’ scientific research, it is hard to give an undisputed production function to judge its performance. With the characteristics of no need to set a production function in advance, a non-parameter method called data envelopment analysis (DEA) [4] has become a standard tool for evaluating efficiency [5,6,7,8]. Mostly, DEA is used to evaluate the performance of multiple decision making units (DMUs), which, as an institution, transition a set of input resources into a set of output resources, and then identify the best production frontier among DMUs as the performance benchmarking.
The following DEA model is an input-oriented CCR model [4], which can be used to measure the relative efficiency of a set of n DMUs , with the same production process. The model tries to search the maximum possible reduction of inputs () while keeping the outputs () at a constant level. The model is:
where and are virtual variables and is a small non-Archimedean number that is used to avoid ignoring any unpredictable factor in the calculating process [9].
The existing papers focus primarily on natural science rather than social science, and, even in some articles, scientific research is only specific to the research of natural science. This unbalance, which is mainly caused by the difficulty in measuring the output of social science, would prove to be an insurmountable obstacle to the overall development of social scientific research and the industrialization of natural science achievements. Therefore, improving the evaluation of the social scientific research can not only enhance the staying power of social scientific research but also promote the sustainable development of the natural science, even the development of the integrated science field.
Jiangsu province, with a higher education and economic development, enjoys a higher level of economic and social development and hosts the largest number of HEIs and college students in China (http://www.chinadegrees.cn/xwyyjsjyxx/xwsytjxx/; http://www.moe.edu.cn/srcsite/A03/moe_634/201606/t20160603_248263.html; http://www.ec.js.edu.cn/col/col4065/index.html). Obviously, its fast economic and social growth relies heavily on the support from HEIs. The latter’s scientific research achievements have played a crucial role in promoting the economic and social development [10]. In recent years, governments at all levels have continuously raised their financial support to HEIs, and the project investment continues upward year to year at a relatively stable rate (see Table 1). In turn, to support the economic and social development, HEIs have produced a huge amount of intellectual achievements, like publishing works, papers, research and consulting reports and other various types of achievements. Although the intellectual achievements also demonstrate a growth trend, their rate fluctuates over this period (see Table 2).
It is the percentage differences between the investments obtained by HEIs in their research projects at all levels and the intellectual outputs produced by them that drive us to track the performance of scientific research of different HEIs, but how can we accurately evaluate the performance of social scientific research in order to make the resource allocation more efficient? We should be equipped with a reasonable approach and a set of appropriate indicators of performance evaluation. In this paper, we choose HEIs related to the scientific research of projects at all levels as DMUs. Focusing on 18 comprehensive HEIs, this paper, based on the data from Humanities and Social Science Research Management System of the National Ordinary Institutions of Higher Learning (Jiangsu Province), measures and analyzes the efficiency differences of multiple HEIs at different stages and periods, with the help of the multi-period two-stage shared-input DEA model and MPI. Furthermore, we make a ranking of these HEIs in terms of their performance in order to set a benchmarking for the others, which outlines an avenue to a more balanced and sustainable development of the social scientific research of HEIs in Jiangsu province.
The remainder of this paper is structured as follows. Section 2 defines the general conceptual framework of social scientific research and lists the key elements of the HEIs’ research system. We propose a multi-period two-stage shared-input DEA model and analyze the input and output data in Section 3. In Section 4, data are brought into the model for calculation, and the empirical results are demonstrated and analyzed by virtue of online surveys. Besides depending on MPI, we also evaluate the efficiency variance of each DMU at different periods and stages. Finally, a conclusion is drawn in the last section.
2. Key Indicators and Conceptual Framework for Social Science Research
Teaching and scientific research are often regarded as two major tasks of HEIs [8], but it is difficult to split them apart and measure their performance separately [11]. Thus, many scholars consider them as a whole, and get the overall performance of the two. However, such a method cannot shed light on how they perform respectively. Hence, this paper attempts to evaluate the performance of the social scientific research by studying the implementation of the HEIs’ research projects, which have little relevance to the teaching activities. Furthermore, the social scientific research of HEIs is a complex process involving multiple factors. To a certain extent, the accuracy of performance evaluation depends upon the choice of key indicators. In selecting the input and output indicators, it is necessary to take into account the linear independence within the input and output indicator groups, and linear correlation between inputs and outputs.
As DEA models enjoy a growing share of the world-class journals, such as OR (Operational Research), EJOR (European Journal of Operational Research), OMEGA, etc., their applications in research and development of HEIs becomes extensive. In the early 1990s, scholars began to measure the efficiency of universities [12]. Some articles pointed out that R&DE (R&D Expenditure) and R&DP (R&D Personnel) were the key input indicators of scientific activities, while patents and papers were the key output ones [13]. With the help of DEA, Avkiran [14] measured the technology and scale efficiencies of Australian universities. Chapple and Lockett [15] calculated the relative performance of technology transfer units. Beasley [8] also applied DEA into the measurement of British universities’ teaching and scientific research efficiencies. Additionally, a multi-stage model was proposed by some scholars. Liang and Li [16] classified the number of SCI papers and patents as the first-stage output, and the research funds obtained as the second-stage output. As for doctoral students, Cook and Green [17] treated them as the intermediate variable because they were the output of the education stage as well as the input of the scientific research stage. Therefore, based on Cooper’s general provisions of indicators and existing research of other scholars [18], including Beasley [8] and Zhu [19], we argue that the personnel, funds, and equipment related to research are all classified as the key input indicators in the process of HEIs’ scientific research [20]. Due to the large number of people involved in scientific research, we only choose researchers with a graduate degree and above as inputs, since they are more engaged in scientific research. Meanwhile, the equipment expenditure is mostly regarded as shared resources within HEIs, and it is difficult to specify the annual use weight of each HEI or discipline. In view of the fact that the equipment plays a relatively minor role in social scientific research, we eliminate this variable. With the development of HEIs, researchers are encouraged to complete the existing research projects and apply for new ones, during which a lot of innovative achievements are produced. Hence, the application and completion of research projects are defined as the variables connecting the development stage and innovation stage, i.e., intermediate variables. Though the existing papers jointly regard publications and patents as the final output [21,22], this study aims at the social science that hardly produces patents. Instead, the research and consulting reports prove to be very common output, which can be verified by the data structure of the existing management system (Most values of the patents of those 18 HEIs or 22 disciplines are zero.).
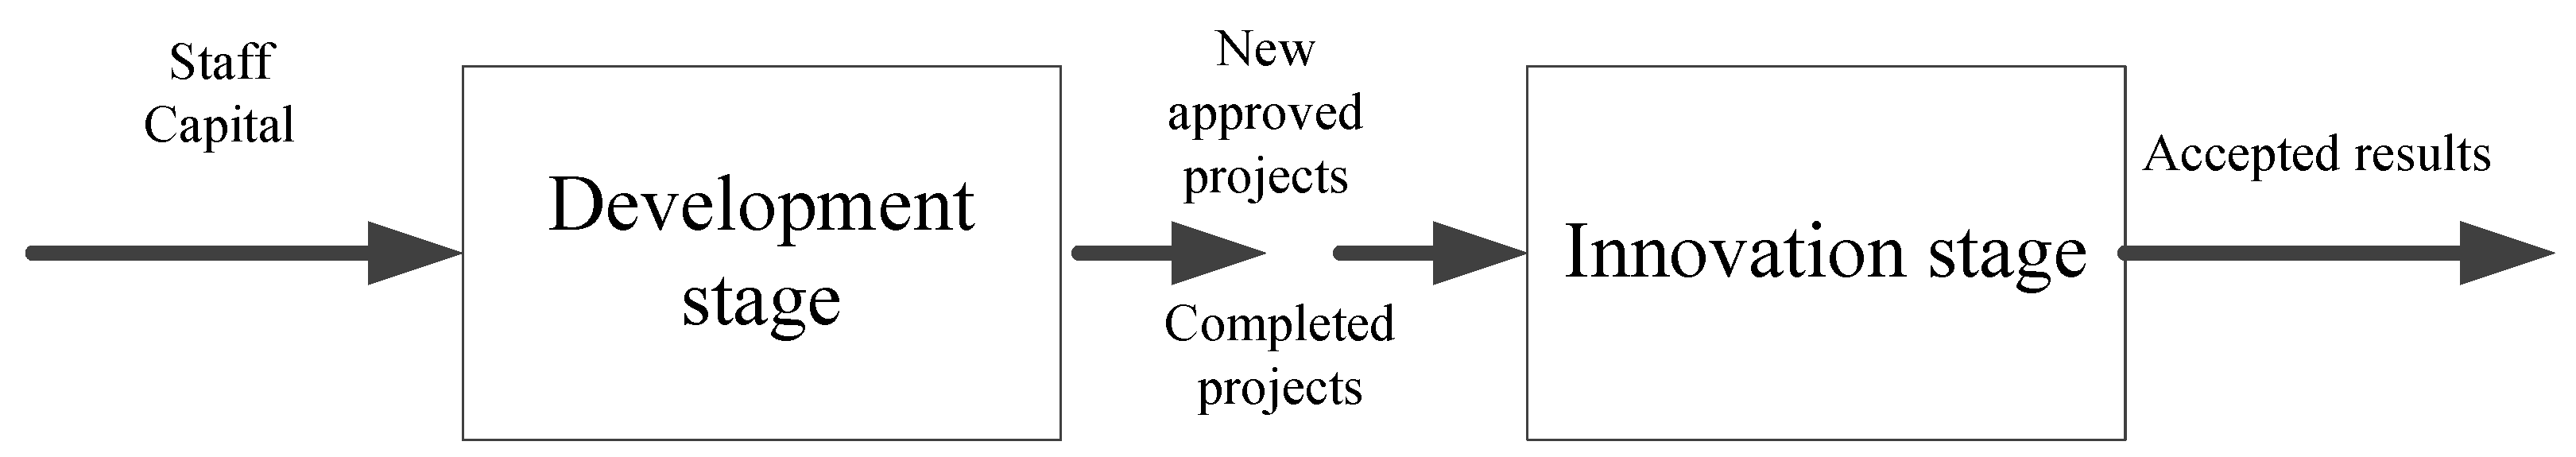
The traditional conceptual framework of scientific research focuses primarily on the whole process of research, and this paper tries to open the “black box” of social scientific research to shed light on the respective performance at all stages [23], for only in this way can the stage of low efficiency be accurately located. Based on the understanding of HEIs’ scientific research and the availability of data, we propose a two-stage conceptual framework (See Figure 1), dividing the whole research process into two related stages with the dual perspective of development and innovation—the research development stage and the research innovation stage—in order to draw more attention to the internal structure of the stage. Figure 1 vividly describes the typical process of scientific research and shows its two stages.
Based on previous analysis, the data structure of Humanities and Social Science Research Management System of the National Ordinary Institutions of Higher Learning (Jiangsu Province) and the characteristics of social scientific research, this paper specifies indicators as follows. The researchers involved with a graduate degree and above and research expenditures are defined as inputs and the approved funds of the new applied projects and completed projects are output indicators at the research development stage. At the stage of research innovation, since they still play an important subjective dynamic role, the researchers are considered to be a shared input. All the output of the previous stage turns into the input at this stage, including approved funds of new applied projects and completed projects. The research concerning social science primarily consists of two parts: basic research and applied research, and there are few studies on experiment and development, R&D application, and scientific and technological service (Most values of the fields are zero.). This status quo has a strong guiding and restraining effect on the choice of the final output indicators. Therefore, in terms of innovativeness and support for the development of economy and society, this paper, from various kinds of scientific research achievements, including published works, collation of ancient books, translation works, published translations, electronic publications, published papers, research and consulting reports, etc., chooses published papers, published works and research and consulting reports as output at the innovation stage. Additionally, there is a certain elimination rate of research and consulting reports in reality, and the output in this paper only refers to those finally accepted. All variables and their definitions are shown in Table 3.
These indicators—input, intermediate output and final output—perform different functions. The input plays a crucial role at the stage of research development; the intermediate output serves as a bridge connecting the two stages; and the final output is produced on the basis of input and intermediate variables and needs to be recognized by the society. Meanwhile, in consideration of the subjective dynamic features of the two stages, this paper regards the researchers as a shared input, for they are indispensable at both stages.
Since the general two-stage DEA model cannot expose the efficiency difference of an HEI at different times, it is necessary to apply the time series analysis to the efficiency evaluation. We need to judge the efficiency variation of the same DMU at different periods and then comprehend a yearly change trend. By adding a dimension of time (from period 1 to period q) to the framework, and assuming that the scientific research activity that occurs at each period is the same, we come up with a multi-period two-stage shared-input conceptual framework (Figure 2).
3. The Multi-Period Two-Stage Shared-Input DEA Model
3.1. Data and Time Series
We argue that input variables, intermediate variables and output variables of various projects should well outline the important elements of scientific research activities. Hence, when choosing variables, we try to cover all the key traits related to the production process, based on the basic understanding of social scientific research, current knowledge and the availability of data. Besides the market projects contributing more to promoting the practical development of economy and society with little impact on the scientific research itself, we eliminate the data of these projects.
Based on the scientific research development level and the availability of data, this paper selects 18 representative HEIs (the full names of 18 HEIs are shown in the Appendix A), with a research cycle of five years from 2010 to 2014. All the data in this paper are obtained from the Humanities and Social Science Research Management System of the National Ordinary Institutions of Higher Learning (Jiangsu Province). Table 4 lists the total data of input, intermediate output and final output of the 18 HEIs for the five years, respectively.
Additionally, in consideration of the lag characteristic of scientific research results, some papers measure the lag order by using a distributed lag model or manual calculation [24]. The solution process of the distributed lag model requires data from many years, and this is impossible to obtain because the information system just contains the data from 2010 to 2014. Meanwhile, manual calculation lacks a scientific foundation and reliability. Thus, this paper ignores the lag of the output and argues that social scientific research is a process of continuous overlapping, thus the conversion of its results has no substantive significance. To verify our opinion, we compared the output of lagged one-year with that of lagged two-year, and no great change was found.
3.2. Multi-Period Two-Stage Shared-Input DEA Model
After the preceding analysis of the process of social scientific research as a chain process with two connected stages, this paper then constructs a multi-period two-stage shared-input DEA model based on the multi-period two-stage DEA model proposed by Kao and Hwang [25] with the consideration of the subjective dynamic characteristics at the two stages—treating the researchers as the shared input. The two-stage DEA model can evaluate both the performance of the whole system and that of respective stages within the system.
Figure 3 is an abstract research system of Section 3, and it exhibits a multi-period two-stage shared-input research process.
Suppose that there are and each has inputs denoted by , intermediate products denoted by , and outputs denoted by , respectively.
(1) Performance measurement
The relational two-stage model for measuring the system (overall) and stage efficiencies of the kth DMU is to take the operations of the q-period two-stage into consideration in addition to that of the system defined in the conventional DEA model [25], and it can measure the system and stage efficiencies at the same time. The time span covers q periods, the target is to measure the efficiency of a set of n DMUs, and each DMU endures a two-stage production system. Let , , and denote the inputs, intermediate products, and outputs of DMU j in period p, respectively. These two kinds of inputs are denoted as and shared inputs , respectively, where . We set the portions of shared inputs used by the first development stage and second innovation stage as and . , , and indicate the total of the inputs, intermediate products, and outputs of DMU j of all periods, respectively. Let , and denote the overall system efficiency, the development efficiency (the stage Ι) and the innovation efficiency (the stage ΙΙ) of . Let , and denote the system efficiency, the development efficiency and the innovation efficiency of in the period p. Additionally, since DEA has a unit-invariant property [26], the efficiencies measured from any types of data are the same.
The model sets the constraint of the aggregate output to be less than or equal to the aggregate input of each period and all periods:
- System constraints:
- Stage 1 constraints:
- Stage 2 constraints:
- At optimality, the overall efficiencies of q periods for the system () and two stages ( and ) are:
Similarly, we set the same variables with the same multiplier no matter how it is used, which is the essence of the relational model [25].
Therefore, the efficiencies of period p () and its two stages ( and ) are:
(2) Performance changes
Pastor and Lovell [27] proposed a global MPI, which uses the global technology of all q periods to measure efficiency. All q periods are used to construct the efficiency frontier for measuring efficiency, and this type of MPI possesses an attractive property of circularity [28]. Many scholars believe that efficiencies calculated from different frontier facets are not comparable, so we adopt the common-weight global MPI [25,29,30,31] to do some further analysis.
We then calculate a common-weight global Malmquist productivity index (MPI) between two periods by dividing their efficiencies. The efficiency of period t, , is calculated via the model (3), we can calculate the efficiency of period h, , similarly, and the global MPI is . By the same token, changes in performance for stage one (and two) between period t and h can also be measured by a common weight global MPI calculated from the ratio of (or ) to (or ):
4. Empirical Results and Analysis
In this section, with the help of MATLAB (MathWorks, Natick, MA, USA), the efficiencies of 18 HEIs are measured. Based on this, we calculate the efficiency differences among DMUs at different periods.
By using the five-year average data and the annual data of each HEI contained in Table 4, we measure the 18 HEIs’ overall efficiencies and stage efficiencies (see Table 5) through Model 1 and Model 2. Table 5 presents the five-year average efficiencies of the 18 HEIs, and also displays a general understanding of the social science development of HEIs in Jiangsu Province, spotlighting the efficiency differences among HEIs. From 2010 to 2014, the average efficiency of 18 HEIs is 0.3044, with the stage 1 of 0.4467 and the stage 2 of 0.3938. Apparently, the efficiency of stage 1, the research development stage, is higher than that of the research innovation stage. Thus, we can infer that the 18 HEIs have done better in the application for new projects and completion of existing projects than producing research achievements.
In addition, it can be seen from Table 5 that NTU has the highest overall efficiency (0.7465), with the efficiencies of stage 1 and stage 2 being 0.9314 and 0.7733, respectively. As to its good performance, after online surveys to relative HEIs about their social scientific research development (The author of this paper undertakes the writing of the Research and Development Report on the development of the Social Science of HEIs in Jiangsu Province commissioned by the Department of Social science of Jiangsu Province. During the writing process, we have made a thorough investigation and research on some HEIs’ development of social scientific research through email and telephone call, and sorted out the investigation results as the element of the report.), we find the answer. In recent years, based on its existing scientific research foundation, NTU has established a positive partnership with domestic first-class HEIs whose outstanding scientific research strength plays a supportive role in promoting NTU’s scientific research development and application for projects at all levels. Meanwhile, a collective group of disciplines was constructed, including Law, Management, Sociology, etc., in order to give full play to the advantages of its disciplines and realize a collaborated, stable and interdisciplinary development. Furthermore, NTU is active in the conversion transiting of the scientific research achievements in order to contribute to the power of socio-economic development. Furthermore, NTU also serves as the think tank in the regional development, with a number of research and consulting reports well accepted by the society.
Apart from NTU, NJUE, HHU and SCU also enjoy higher rankings and have good performance at each stage. Thus, it can be inferred that these HEIs’ efforts in promoting social scientific research development for the past five years were rewarded. NJUE, with all its majors related to social science, is an HEI characterized by social science. Its social scientific research has been supported by a lot of provincial and ministerial special funds. With some special disciplines, NJUE also enjoys exclusiveness when applying for some research projects according to those disciplines. All these advantages enable it to get a relatively high efficiency. Taking the leading role in natural scientific research, HHU has also progressively developed its social science from 2010 to 2014. Depending on its advantages of natural science, it has greatly promoted social science construction with that positive externality, making a bridge between natural science and social science. On the one hand, social science can ensure the industrialization of natural science achievements. On the other hand, the market responsiveness nurtures the social science development. In the social scientific research, HHU also advocates the interdisciplinary development, making the social scientific research undertaken by various disciplines collaboratively. As to SCU, it focuses primarily on national major projects. By elaborately tailoring research direction and integrating the research team, it has continuously made historic breakthroughs in the field of social scientific research, with research achievements widely accepted by the society. Furthermore, based on its own development characteristics, it has founded a number of scientific research and innovation organizations as think tanks to solve the key and difficult issues of regional economic development.
Compared with these better-performing HEIs, some other HEIs have efficiencies that rank high at a certain stage but have lower overall rankings, due to their inefficiency at the other stage. For example, both NJFU and YZU perform well at the research development stage while NUAA has a higher efficiency at the stage of research innovation. As to NJFU, based on its distinctive research areas, it has made great efforts to develop cutting-edge research projects, equipped with existing professional talents and social resources. Though it has made great progress in the field of social scientific research, there is still room for improving at the research innovation stage. As an engineering college, NUAA performs well at the stage of research innovation. Possibly, under the guidance of more mature methodology, its research achievements are easy to be recognized and accepted by the society. In short, the efficiencies of the first stage of certain HEIs that are better in social science are higher than that of those that have an advantage in natural science, and the results are opposite in the second stage.
In addition, from Table 4, it can be seen that though it has the largest input and output, NJU gets a lower efficiency. The reason is that, because of its overwhelming advantages and prominent position in the field of social science, it was offered great financial support from the government departments for scientific research, with a large number of research personnel engaged, but, different from the input of funds and personnel, the scientific research achievements cannot present a magnitude growth in a short time. As a result, its efficiency turns out to be relatively lower.
Based on the data of efficiencies in Table 6 via Model 4, we can draw an efficiency variance (MPI) of each HEI for these five years (also see Table 6), specifying which year it reaches the peak and which year it becomes lower. Take NTU as an example. Its overall efficiency is as high as 0.7465 (see Table 6). From Table 6, we can find that this high value depends on its relatively good performance in 2010 and 2013 when its efficiency reaches the peak of 1, with its efficiency in 2011 as 0.5556, in 2012 as 0.6596, and in 2014 as 0.6525. As to SEU, its overall efficiency is only 0.2358 (see Table 5), which, as shown in Table 6, primarily results from the lower efficiencies of 2011 (0.0935) and 2014 (0.1960) with rather low efficiencies at the research development stage.
According to its overall efficiency and stage efficiencies of each year, every HEI can spotlight its pros and cons to build its own development strategy. It can also establish cooperation with those of higher efficiency in continuously improving its management system of social scientific research. The administration departments of HEIs need to create opportunities to make “economies of scope” of core resources realize optimum spread. Meanwhile, when giving full play of its superiority disciplines, HEI ought to boost the coordinated development of multiple disciplines. Additionally, various performance evaluation systems should be established to carry out a real-time tracking of the social science development, and then some amendments should be applied immediately.
5. Conclusions
HEI is an important base for cultivating high-level innovative talents, and a main force to solve major scientific and technological issues. The social scientific research launched by HEIs is essential to enhance the scope, discover new possibilities, and catalyze change in social and economic development. With a limited number of research personnel and funds, HEIs need to improve their management system and integrate superior resources in order to support the rapid development of social scientific research, giving full play to their role as brain trusts.
After evaluating the performance of these 18 HEIs and online surveys, we determine their inefficiency causes and make a prescription. We argue that, in order to promote its scientific research development, HEIs should strive to establish a scientific and reasonable comprehensive evaluation system, regularly evaluating the development and innovation abilities of the scientific research, like a management and operation mechanism referring to the quality of scientific achievements, etc. The performance evaluation of social scientific research can figure out the stage of low efficiency, which can improve the scientific research and development ability of the entire HEI through resource allocation and a shared interdisciplinary management system. Meanwhile, an open and cooperative mechanism should be established among HEIs, aiming to achieve regional interaction between HEIs and promote knowledge flow and resource sharing. Peers’ advanced management experience can also be learned. Additionally, HEI should establish partnerships with applied research institutions to promote the industrialization of its research achievements, making practical demand nurture scientific research sustainably. In other words, measurement and assessment of sustainability efficiencies are evolving and present an opportunity for future collaboration between institutions and industrial organizations.
Furthermore, the HEI itself needs to strengthen the continuous research of its superiority disciplines and promote the provincial cross-university and interdisciplinary scientific research, constantly seeking and cultivating new growth points of social scientific research. As to natural science and social science, HEIs need to make a bridge between them and form a benign academic ecosystem to improve the overall efficiency of scientific research. Furthermore, various interdisciplinary sharing modes are also encouraged, which will boost the coordinated development among disciplines. Networks and communication tools among disciplines are strategic avenues to rapidly sharing knowledge and resources, in that the disciplines would finally get improved performance. Multi-HEIs and multi-discipline collaborations push the boundaries of sustainable development and inspire change in social research operations.
The relevant administration departments also need to take some measures. They should strive to establish a comprehensive disciplinary environment between natural science and social science. Furthermore, in order to improve the social scientific research abilities in a province or even in the country, the government departments ought to continuously create opportunities to encourage the overflow or sharing of advanced concepts, institutional arrangements, and innovative management practices. The implementation of such solutions will require the best understanding and consensus of HEIs’ development backgrounds in Jiangsu province, the capacity to trigger big improvements in HEIs, and the involvement of administration departments who understand these challenges and can manage efficiency promotion in a holistic manner.
In conclusion, with the joined forces of practical needs, researchers’ innovative abilities and the support of governments at all levels, HEIs’ social scientific research can build a batch of remarkable achievements that not only have important academic influence but also can make a great contribution to social and economic development. We hope that HEIs can actively strive for basic research projects on academic research and unknown areas, and generate a number of innovative academic results and research and consulting reports that can seek the best avenues to a sustainable future.
Acknowledgments
The research is supported by National Natural Science Funds of China (Nos. 71173036, 71473037), Research Fund for the Doctoral Program of Research Innovation of Jiangsu province (No. KYLX16_0173).
Author Contributions
Xianmei Wang and Hanhui Hu built the conceptual framework and the multi-period two-stage DEA Model, and performed the research together. Xianmei Wang surveyed the targets institutes, analyzed the data, and wrote the manuscript. Xianmei Wang and Hanhui Hu revised the manuscript. All authors have read and approved the final manuscript.
Conflicts of Interest
The authors declare no conflict of interest.
Appendix A

Table A1.
The full names of 18 HEIs in Jiangsu.
| Abbr. Name | Full name |
|---|---|
| NJU | Nanjing University |
| SCU | Soochow University |
| SEU | Southeast University |
| NUAA | Nanjing University of Aeronautics and Astronautics |
| NJUST | Nanjing University of Science and Technology |
| JUST | Jiangsu University of Science and Technology |
| CUMT | China University of Mining and Technology |
| NJUPT | Nanjing University of Posts and Telecommunications |
| HHU | Hohai University |
| JNU | Jiangnan University |
| NJFU | Nanjing Forestry University |
| UJS | Jiangsu University |
| NTU | Nantong University |
| NJNU | Nanjing Normal University |
| JSNU | Jiangsu Normal University |
| NJUE | Nanjing University of Finance & Economics |
| USTS | Suzhou University of Science and Technology |
| YZU | Yangzhou University |
References
- Mjwara, P.; Patel, I.; Mashamba, G.; Mamagobo, T.; Labadarios, D.; Blankley, W. National Survey of Research & Experimental Development (2009/10 Fiscal Year): High-level Key Results; Human Sciences Research Council: Pretoria, South Africa, 2013. [Google Scholar]
- Kates, R.W.; Clark, W.C.; Corell, R.; Hall, J.M.; Jaeger, C.C.; Lowe, I.; McCarthy, J.J.; Schellnhuber, H.J.; Bolin, B.; Dickson, N.M. Sustainability science. Science 2001, 292, 641–642. [Google Scholar] [CrossRef] [PubMed]
- Lindsay, A.W. Institutional performance in higher education: The efficiency dimension. Rev. Educ. Res. 1982, 52, 175–199. [Google Scholar] [CrossRef]
- Charnes, A.; Cooper, W.W.; Rhodes, E. Measuring the efficiency of decision making units. Euro. J. Oper. Res. 1978, 2, 429–444. [Google Scholar] [CrossRef]
- Cook, W.D.; Cooper, W.W.; Seiford, L.M.; Tone, K. Data Envelopment Analysis: A Comprehensive Text with Models, Applications, References and DEA-Solver Software. JSTOR 2001, 31, 116–118. [Google Scholar]
- Cook, W.D.; Seiford, L.M. Data envelopment analysis (DEA)—Thirty years on. Euro. J. Oper. Res. 2009, 192, 1–17. [Google Scholar] [CrossRef]
- Kao, C.; Hung, H.T. Efficiency analysis of university departments: An empirical study. Omega 2008, 36, 653–664. [Google Scholar] [CrossRef]
- Beasley, J.E. Determining teaching and research efficiencies. J. Oper. Res. Soc. 1995, 46, 441–452. [Google Scholar] [CrossRef]
- Charnes, A.; Cooper, W.W. Preface to topics in data envelopment analysis. Ann. Oper. Res. 1984, 2, 59–94. [Google Scholar]
- Etzkowitz, H.; Leydesdorff, L. The dynamics of innovation: from National Systems and “Mode 2” to a Triple Helix of university–industry–government relations. Res. policy 2000, 29, 109–123. [Google Scholar] [CrossRef]
- Brew, A. Teaching and research: New relationships and their implications for inquiry-based teaching and learning in higher education. High. Educ. Res. Dev. 2003, 22, 3–18. [Google Scholar] [CrossRef]
- Wong, Y.H.B.; Beasley, J.E. Restricting weight flexibility in data envelopment analysis. J. Oper. Res. Soc. 1990, 41, 829–835. [Google Scholar] [CrossRef]
- Zhong, W.; Yuan, W.; Li, S.X.; Huang, Z. The performance evaluation of regional R&D investments in China: An application of DEA based on the first official China economic census data. Omega 2011, 39, 447–455. [Google Scholar]
- Avkiran, N.K. Investigating technical and scale efficiencies of Australian universities through data envelopment analysis. Soc-Eco. Plan. Sci. 2001, 35, 57–80. [Google Scholar] [CrossRef]
- Chapple, W.; Lockett, A.; Siegel, D.; Wright, M. Assessing the relative performance of UK university technology transfer offices: parametric and non-parametric evidence. Res. Policy 2005, 34, 369–384. [Google Scholar] [CrossRef]
- Liang, L.; Li, Z.Q.; Cook, W.D.; Zhu, J. Data envelopment analysis efficiency in two-stage networks with feedback. IIE Trans. 2011, 43, 309–322. [Google Scholar] [CrossRef]
- Cook, W.D.; Green, R.H.; Zhu, J. Dual-role factors in data envelopment analysis. IIE Trans. 2006, 38, 105–115. [Google Scholar] [CrossRef]
- Cooper, W.W.; Seiford, L.M.; Tone, K.; Zhu, J. Some models and measures for evaluating performances with DEA: Past accomplishments and future prospects. J. Produc. Anal. 2007, 28, 151–163. [Google Scholar] [CrossRef]
- Zhu, J. Quantitative Models for Performance Evaluation and Benchmarking: Data Envelopment Analysis with Spreadsheets; Springer: Berlin, Germany, 2014. [Google Scholar]
- Saaty, T.L.; Vargas, L.G. Models, Methods, Concepts & Applications of the Analytic Hierarchy Process, International Series in Operations Research and Management Science; Kluwer: Boston, MA, USA, 2000; p. 34. [Google Scholar]
- Van, L.B.; Callaert, J.; Debackere, K. Publication and patent behavior of academic researchers: Conflicting, reinforcing or merely co-existing? Res. Policy 2006, 35, 596–608. [Google Scholar]
- Huang, C.; Notten, A.; Rasters, N. Nanoscience and technology publications and patents: a review of social science studies and search strategies. J.Techno. Trans. 2011, 36, 145–172. [Google Scholar] [CrossRef]
- Cook, W.D.; Liang, L.; Zhu, J. Measuring performance of two-stage network structures by DEA: A review and future perspective. Omega 2010, 38, 423–430. [Google Scholar] [CrossRef]
- Hall, B.H.; Griliches, Z.; Hausman, J.A. Patents and R and D: Is there a lag? Int. Econo. Rev. 1986, 27, 265–283. [Google Scholar] [CrossRef]
- Kao, C.; Hwang, S.N. Multi-period efficiency and Malmquist productivity index in two-stage production systems. Euro. J. Oper. Res. 2014, 232, 512–521. [Google Scholar] [CrossRef]
- Lovell, C.K.; Pastor, J.T. Units invariant and translation invariant DEA models. Oper. Res. Lett. 1995, 18, 147–151. [Google Scholar] [CrossRef]
- Pastor, J.T.; Lovell, C.K. A global Malmquist productivity index. Econo. Lett. 2005, 88, 266–271. [Google Scholar] [CrossRef]
- Pastor, J.T.; Lovell, C.K. Circularity of the Malmquist productivity index. Econo. Theory. 2007, 33, 591–599. [Google Scholar] [CrossRef]
- Kao, C. Malmquist productivity index based on common-weights DEA: The case of Taiwan forests after reorganization. Omega 2010, 38, 484–491. [Google Scholar] [CrossRef]
- Kao, C.; Hung, H.T. Data envelopment analysis with common weights: The compromise solution approach. J. Oper. Res. Soc. 2005, 56, 1196–1203. [Google Scholar] [CrossRef]
- Sueyoshi, T. Mixed integer programming approach of extended DEA—discriminant analysis. Euro. J. Oper. Res. 2004, 152, 45–55. [Google Scholar] [CrossRef]
Figure 1.
A two-stage research model.

Figure 2.
A multi-period two-stage shared-input research process in HEIs.
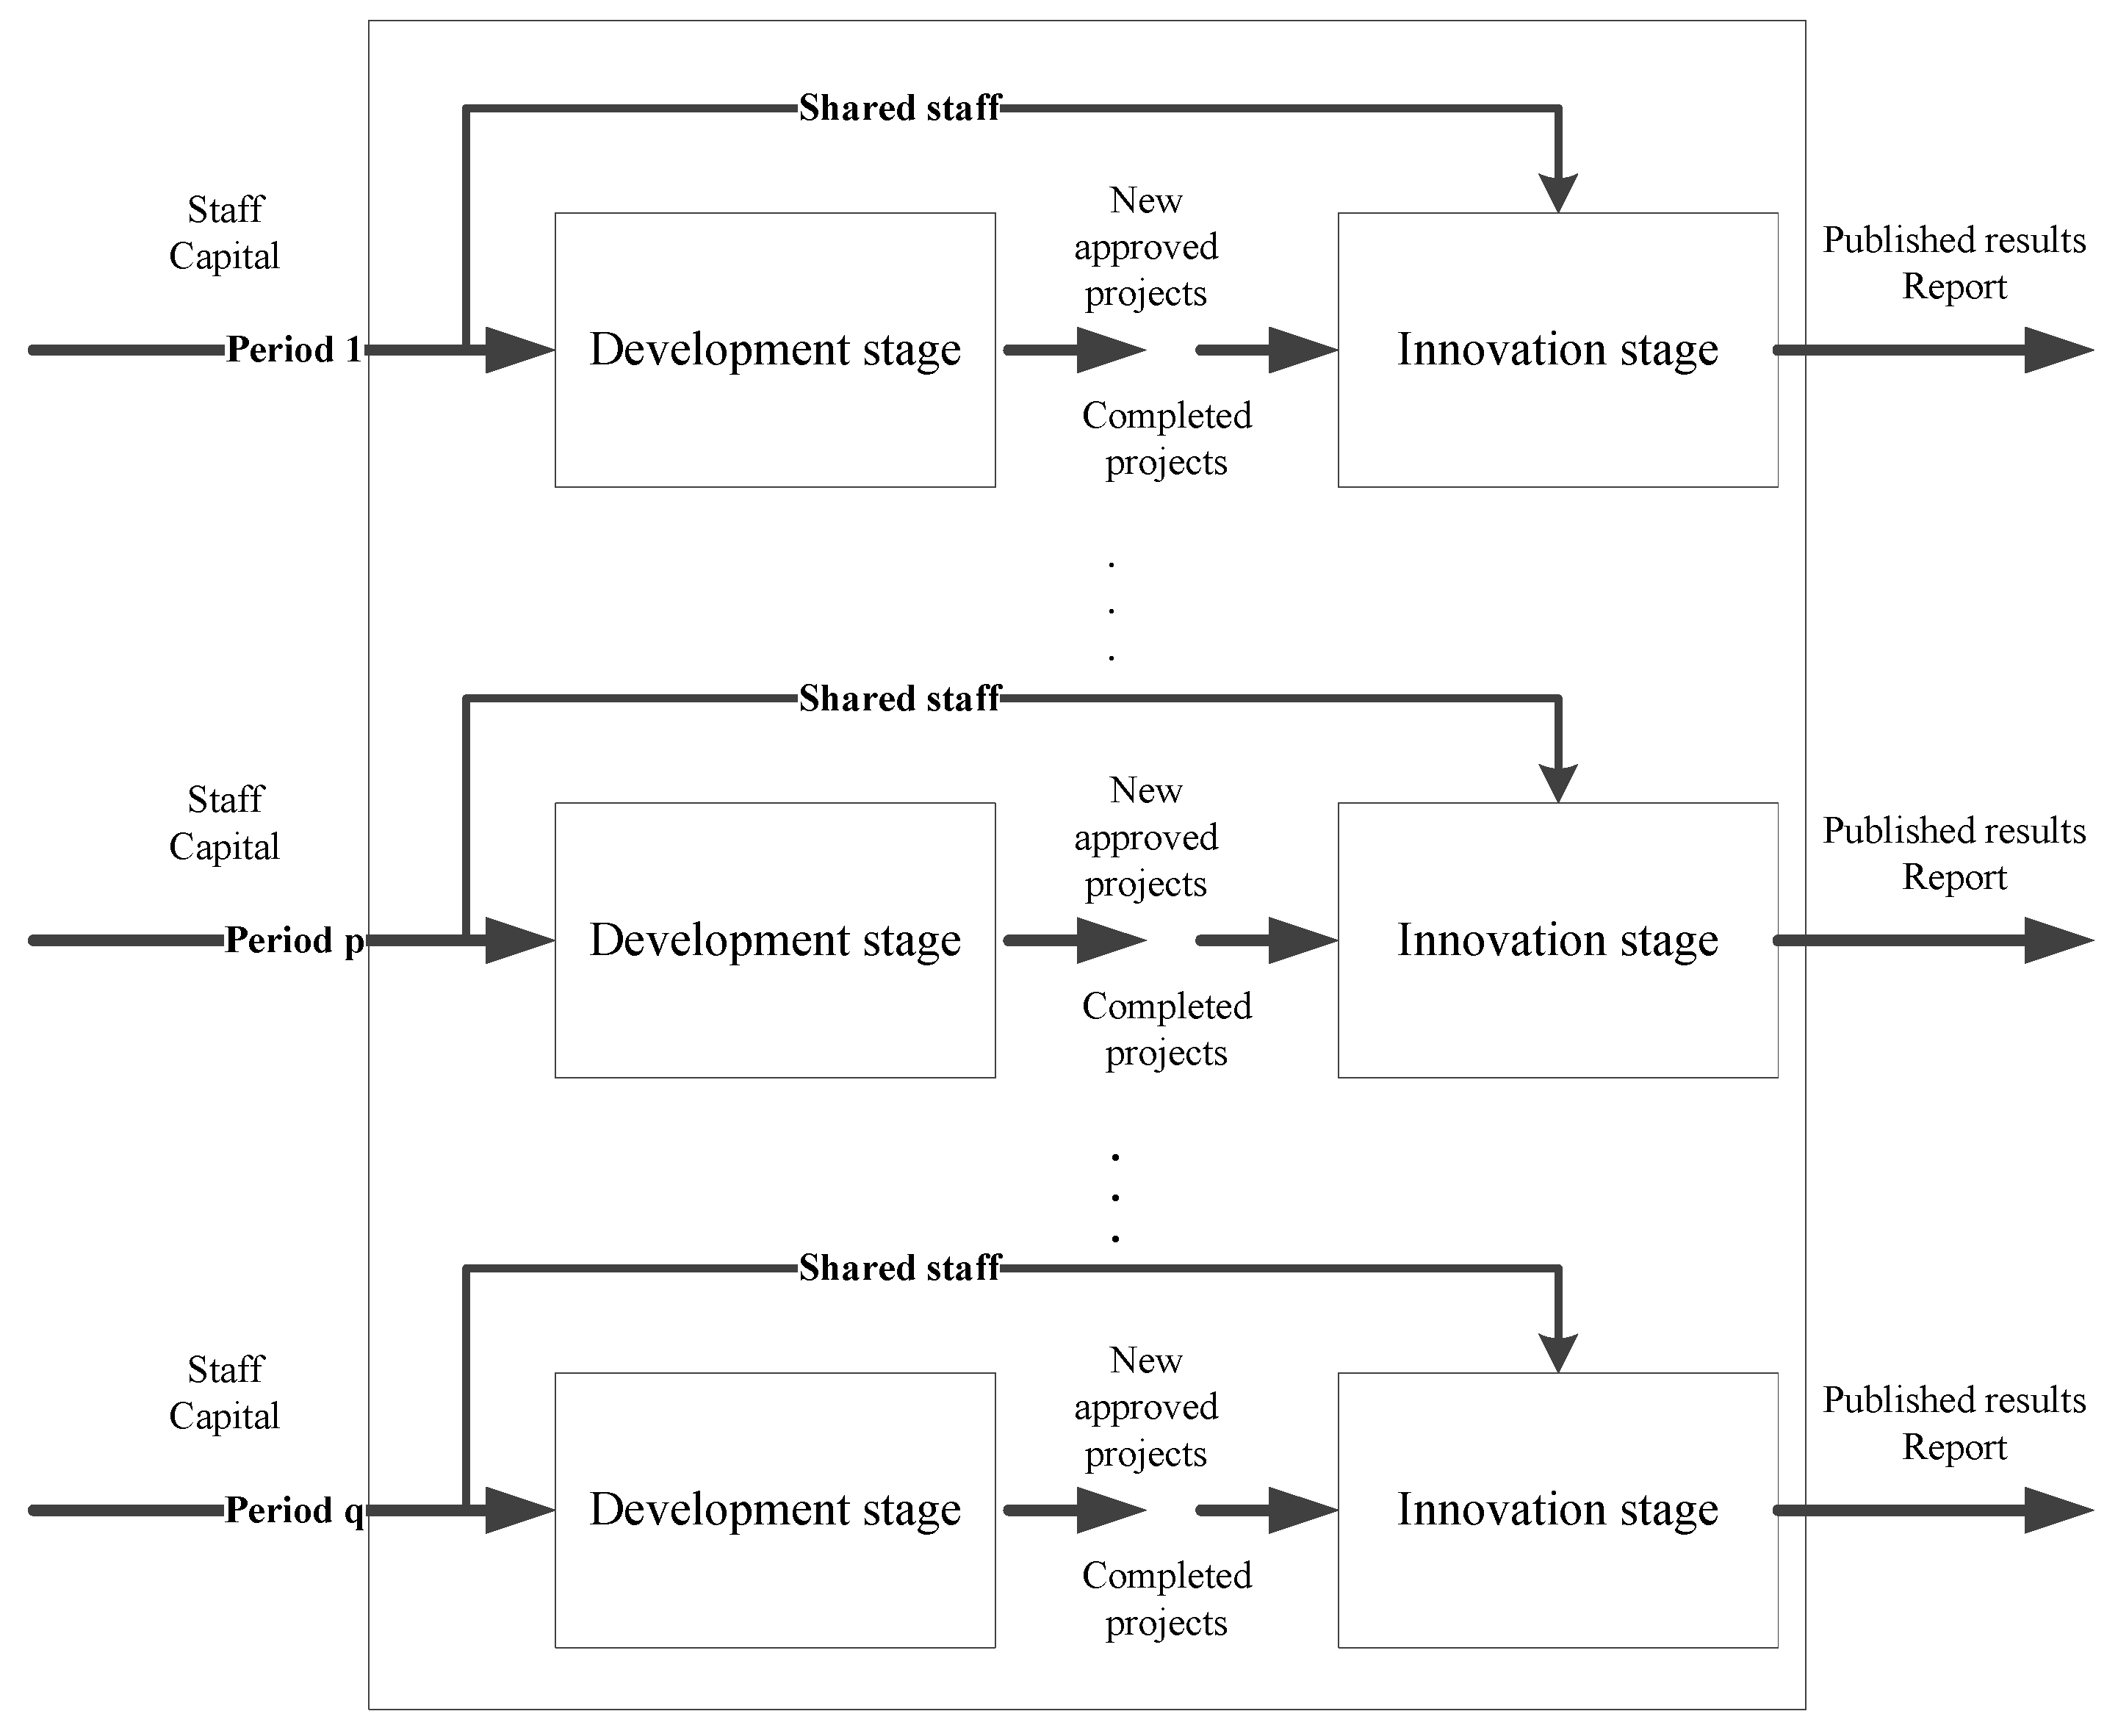
Figure 3.
Multi-period two-stage shared-input production system.

Table 1.
Comparison of different sources of Project funds of HEIs in Jiangsu (2010–2014).
| Type | Year | Total | National Projects | Provincial and Local Projects | Market Projects | International Cooperation Projects | Others |
|---|---|---|---|---|---|---|---|
| Project funds | 2010 | 2,406,805.3 | 744,693 | 576,146.14 | 71,814.16 | 822,003.74 | 192,148.3 |
| % | 100% | 30.94% | 23.94% | 3% | 34.15% | 7.98% | |
| Project funds | 2011 | 3,041,486.3 | 942,132.2 | 442,252.75 | 7143 | 1,303,517.34 | 346,441 |
| % | 100% | 30.98% | 14.54% | 0.23% | 42.86% | 11.39% | |
| Project funds | 2012 | 3,563,611.5 | 1,073,472 | 548,751.56 | 16,101.43 | 1,652,813.67 | 272,472.8 |
| % | 100% | 30.12% | 15.40% | 0.45% | 46.38% | 7.65% | |
| Project funds | 2013 | 4,116,724.3 | 1,325,320.4 | 637,562.35 | 76,700.86 | 1,673,165.73 | 403,975 |
| % | 100% | 32.19% | 15.49% | 1.86% | 40.64% | 9.81% | |
| Project funds | 2014 | 4,325,654.78 | 1,359,643.54 | 769,491.25 | 69,169.39 | 1,702,016.6 | 425,334 |
| % | 100% | 31.43% | 17.79% | 1.60% | 39.35% | 9.83% | |
Data source: Humanities and Social Science Research Management System of the National Ordinary Institutions of Higher Learning (Jiangsu Province).
Table 2.
Comparison of different sources of achievements of HEIs in Jiangsu, 2010–2014.
| Year | Type | Total | National Projects | Provincial and Local Projects | Market Projects | International Cooperation Projects | Others |
|---|---|---|---|---|---|---|---|
| 2010 | Published works | 605 | 190 | 240 | 56 | 1 | 118 |
| % | 100% | 31.40% | 39.67% | 9.26% | 0.17% | 19.50% | |
| Published papers | 10,052 | 2872 | 3581 | 649 | 34 | 2916 | |
| % | 100% | 28.57% | 35.62% | 6.46% | 0.34% | 29.01% | |
| Research report | 192 | 37 | 79 | 72 | 1 | 3 | |
| % | 100% | 19.27% | 41.15% | 37.50% | 0.52% | 1.56% | |
| 2011 | Published works | 646 | 211 | 245 | 36 | 6 | 148 |
| % | 100% | 32.66% | 37.93% | 5.57% | 0.93% | 22.91% | |
| Published papers | 10,184 | 3288 | 3676 | 578 | 51 | 2591 | |
| % | 100% | 32.29% | 36.10% | 5.68% | 0.50% | 25.44% | |
| Research report | 258 | 23 | 65 | 155 | 0 | 15 | |
| % | 100% | 8.91% | 25.19% | 60.08% | 0.00% | 5.81% | |
| 2012 | Published works | 808 | 251 | 292 | 58 | 0 | 207 |
| % | 100% | 31.06% | 36.14% | 7.18% | 0.00% | 25.62% | |
| Published papers | 12,662 | 3822 | 4652 | 835 | 32 | 3321 | |
| % | 100% | 30.18% | 36.74% | 6.59% | 0.25% | 26.23% | |
| Research report | 523 | 40 | 132 | 317 | 1 | 33 | |
| % | 100% | 7.65% | 25.24% | 60.61% | 0.19% | 6.31% | |
| 2013 | Published works | 842 | 340 | 261 | 53 | 8 | 180 |
| % | 100% | 40.38% | 31.00% | 6.29% | 0.95% | 21.38% | |
| Published papers | 14,341 | 4482 | 5201 | 704 | 49 | 3905 | |
| % | 100% | 31.25% | 36.27% | 4.91% | 0.34% | 27.23% | |
| Research report | 638 | 48 | 222 | 341 | 1 | 26 | |
| % | 100% | 7.52% | 34.80% | 53.45% | 0.16% | 4.08% | |
| 2014 | Published works | 948 | 382 | 337 | 40 | 3 | 186 |
| % | 100% | 40.30% | 35.55% | 4.22% | 0.32% | 19.62% | |
| Published papers | 16,107 | 5212 | 6491 | 601 | 60 | 3743 | |
| % | 100% | 32.36% | 40.30% | 3.73% | 0.37% | 23.24% | |
| Research report | 1014 | 82 | 321 | 570 | 7 | 34 | |
| % | 100% | 8.09% | 31.66% | 56.21% | 0.69% | 3.35% |
Data source: Humanities and Social Science Research Management System of the National Ordinary Institutions of Higher Learning (Jiangsu Province).
Table 3.
Definition of input and output variables for the DEA.
| Variables | Definitions |
|---|---|
| Inputs | Total number of researchers with graduate degree or above(shared input) |
| Total expenditure | |
| Intermediate | The funds of newly approved projects |
| The amount of accomplished projects | |
| Outputs | Published papers |
| Published works | |
| Research and consulting reports except the unaccepted ones |
Table 4.
Five-year totals of inputs, intermediate products, and outputs of 18 HEIs in Jiangsu (2010–2014).
Table 4.
Five-year totals of inputs, intermediate products, and outputs of 18 HEIs in Jiangsu (2010–2014).
| Name | Number of Researchers | Total Expenditure | The Funds of New Approved Projects | The Amount of Accomplished Projects | Published Works | Published Papers | Research and Consulting Reports |
|---|---|---|---|---|---|---|---|
| NJU | 1290.2 | 3,991,815 | 4,794,710 | 839 | 666 | 16,035 | 290 |
| SCU | 218.6 | 782,674.9 | 977,491.5 | 1147 | 230 | 2606 | 60 |
| SEU | 437.4 | 632,573.8 | 713,705.9 | 648 | 178 | 1835 | 81 |
| NUAA | 104.3 | 190,165.5 | 254,107 | 248 | 74 | 939 | 12 |
| NJUST | 192.8 | 299,810.6 | 407,715.5 | 327 | 40 | 1003 | 6 |
| JUST | 161.6 | 108,498 | 184,225 | 267 | 28 | 662 | 5 |
| CUMT | 167.3 | 360,141.5 | 368,844 | 329 | 103 | 1347 | 32 |
| NJUPT | 163.9 | 114,538 | 160,028 | 151 | 10 | 609 | 7 |
| HHU | 193.9 | 1,097,950 | 1,331,632 | 502 | 108 | 1929 | 160 |
| JNU | 321.8 | 235,068.5 | 459,101.2 | 346 | 99 | 2680 | 47 |
| NJFU | 33 | 52,487 | 97,702.19 | 147 | 11 | 495 | 10 |
| UJS | 154.5 | 285,448.5 | 372,250 | 305 | 43 | 1032 | 7 |
| NTU | 21.3 | 140,744.1 | 185,446.3 | 721 | 23 | 1785 | 7 |
| NJNU | 379.4 | 514,016.3 | 662,040.1 | 942 | 217 | 2965 | 25 |
| JSNU | 582.8 | 744,627.5 | 920,262 | 613 | 43 | 2273 | 30 |
| NJUE | 54.1 | 319,942.3 | 419,310 | 416 | 75 | 1283 | 22 |
| USTS | 39.9 | 101,829 | 98,986 | 342 | 37 | 1050 | 19 |
| YZU | 156.6 | 114,753.9 | 215,910 | 346 | 56 | 1224 | 16 |
| Total | 4673.4 | 10,087,084.16 | 12,623,466.95 | 8636 | 2041 | 41752 | 830 |
Table 5.
Five-year average efficiencies for 18 HEIs in Jiangsu (2010–2014).
| Name | Overall [rank] | Process 1 [rank] | Process 2 [rank] |
|---|---|---|---|
| NJU | 0.2676[10] | 0.4046[9] | 0.3473[13] |
| SCU | 0.4477[5] | 0.5053[6] | 0.5188[5] |
| SEU | 0.2358[13] | 0.2746[17] | 0.4091[8] |
| NUAA | 0.3135[6] | 0.3786[11] | 0.4499[7] |
| NJUST | 0.1059[16] | 0.3267[14] | 0.1261[17] |
| JUST | 0.1228[15] | 0.4606[8] | 0.1674[16] |
| CUMT | 0.2943[8] | 0.3150[15] | 0.3841[9] |
| NJUPT | 0.0873[17] | 0.3044[16] | 0.2628[4] |
| HHU | 0.4545[4] | 0.5805[3] | 0.5364[4] |
| JNU | 0.2423[12] | 0.3862[10] | 0.3824[10] |
| NJFU | 0.3127[7] | 0.5313[5] | 0.3588[11] |
| UJS | 0.1365[14] | 0.3658[12] | 0.1759[15] |
| NTU | 0.7465[1] | 0.9314[1] | 0.7733[1] |
| NJNU | 0.2729[9] | 0.3509[13] | 0.4672[6] |
| JSNU | 0.0689[18] | 0.2482[18] | 0.0841[18] |
| NJUE | 0.5671[2] | 0.6697[2] | 0.6367[3] |
| USTS | 0.5494[3] | 0.4655[7] | 0.6588[2] |
| YZU | 0.2531[11] | 0.5411[4] | 0.3487[12] |
| Average | 0.3044 | 0.4467 | 0.3938 |
Note: The values in this table are the five-year average efficiencies for 18 HEIs, which is why all of the values are less than 1.
Table 6.
Period efficiencies and MPIs for 18 HEIs in Jiangsu (2010–2014).
| Name | year | [period] | period | Period 1 | Period 2 | |||
|---|---|---|---|---|---|---|---|---|
| [t-h] | ||||||||
| NJU | 2010 | [10-11] | 0.1596 | 1.3461 | 0.5189 | 0.9431 | 0.1967 | 1.4795 |
| 2011 | [11-12] | 0.2149 | 1.2599 | 0.4894 | 0.7002 | 0.2911 | 1.2123 | |
| 2012 | [12-13] | 0.2707 | 1.3627 | 0.3427 | 2.3195 | 0.3528 | 1.1547 | |
| 2013 | [13-14] | 0.3690 | 0.8063 | 0.7948 | 0.4848 | 0.4074 | 1.0371 | |
| 2014 | [10-14] | 0.2975 | 1.8635 | 0.3853 | 0.7424 | 0.4226 | 2.1479 | |
| SCU | 2010 | [10-11] | 0.5043 | 0.8578 | 0.5147 | 0.7417 | 0.5761 | 0.8790 |
| 2011 | [11-12] | 0.4326 | 0.7096 | 0.3818 | 1.2023 | 0.5064 | 0.7026 | |
| 2012 | [12-13] | 0.3070 | 1.0862 | 0.4590 | 1.1791 | 0.3558 | 1.1252 | |
| 2013 | [13-14] | 0.3334 | 2.7645 | 0.5412 | 1.3397 | 0.4003 | 2.4979 | |
| 2014 | [10-14] | 0.9217 | 1.8278 | 0.7250 | 1.4085 | 1.0000 | 1.7357 | |
| SEU | 2010 | [10-11] | 0.3632 | 0.2574 | 0.3150 | 0.5384 | 0.6641 | 0.2414 |
| 2011 | [11-12] | 0.0935 | 3.4842 | 0.1696 | 1.8273 | 0.1603 | 3.2604 | |
| 2012 | [12-13] | 0.3258 | 1.0247 | 0.3099 | 0.8766 | 0.5227 | 1.1870 | |
| 2013 | [13-14] | 0.3338 | 0.5870 | 0.2717 | 1.2492 | 0.6205 | 0.5380 | |
| 2014 | [10-14] | 0.1960 | 0.5396 | 0.3394 | 1.0773 | 0.3338 | 0.5026 | |
| NUAA | 2010 | [10-11] | 0.2307 | 0.6200 | 0.4273 | 0.9316 | 0.3299 | 0.6124 |
| 2011 | [11-12] | 0.1430 | 2.0621 | 0.3981 | 0.8735 | 0.2020 | 2.0826 | |
| 2012 | [12-13] | 0.2949 | 0.9477 | 0.3477 | 1.2511 | 0.4208 | 0.9049 | |
| 2013 | [13-14] | 0.2795 | 1.9107 | 0.4350 | 0.7154 | 0.3808 | 2.1739 | |
| 2014 | [10-14] | 0.5341 | 2.3150 | 0.3112 | 0.7283 | 0.8277 | 2.5090 | |
| NJUST | 2010 | [10-11] | 0.2078 | 0.2083 | 1.0000 | 0.3085 | 0.2078 | 0.2502 |
| 2011 | [11-12] | 0.0433 | 2.0493 | 0.3085 | 0.8148 | 0.0520 | 2.1348 | |
| 2012 | [12-13] | 0.0887 | 1.7127 | 0.2513 | 1.1098 | 0.1110 | 1.6753 | |
| 2013 | [13-14] | 0.1519 | 0.7472 | 0.2789 | 1.0311 | 0.1860 | 0.7247 | |
| 2014 | [10-14] | 0.1135 | 0.5462 | 0.2876 | 0.2876 | 0.1348 | 0.6486 | |
| JUST | 2010 | [10-11] | 0.3329 | 0.5224 | 0.9461 | 0.5821 | 0.3432 | 0.6829 |
| 2011 | [11-12] | 0.1739 | 0.3367 | 0.5507 | 1.0025 | 0.2343 | 0.3146 | |
| 2012 | [12-13] | 0.0586 | 2.1531 | 0.5521 | 0.6669 | 0.0737 | 2.4113 | |
| 2013 | [13-14] | 0.1261 | 0.6863 | 0.3682 | 0.8638 | 0.1778 | 0.7332 | |
| 2014 | [10-14] | 0.0865 | 0.2599 | 0.3180 | 0.3362 | 0.1304 | 0.3799 | |
| CUMT | 2010 | [10-11] | 0.2613 | 2.0197 | 0.1880 | 2.1930 | 0.3355 | 1.9675 |
| 2011 | [11-12] | 0.5277 | 0.8364 | 0.4122 | 0.6619 | 0.6601 | 0.8835 | |
| 2012 | [12-13] | 0.4414 | 0.7842 | 0.2729 | 1.7293 | 0.5832 | 0.7440 | |
| 2013 | [13-14] | 0.3462 | 0.3247 | 0.4719 | 0.5504 | 0.4339 | 0.3542 | |
| 2014 | [10-14] | 0.1124 | 0.4301 | 0.2597 | 1.3816 | 0.1537 | 0.4580 | |
| NJUPT | 2010 | [10-11] | 0.0841 | 1.7680 | 0.3454 | 1.0040 | 0.2321 | 1.7686 |
| 2011 | [11-12] | 0.1486 | 0.8547 | 0.3467 | 0.8280 | 0.4104 | 1.0093 | |
| 2012 | [12-13] | 0.1270 | 0.8728 | 0.2871 | 1.1536 | 0.4142 | 0.7014 | |
| 2013 | [13-14] | 0.1109 | 0.3756 | 0.3312 | 0.8193 | 0.2905 | 0.4744 | |
| 2014 | [10-14] | 0.0416 | 0.4954 | 0.2714 | 0.7858 | 0.1378 | 0.5939 | |
| HHU | 2010 | [10-11] | 0.3303 | 0.7625 | 1.0000 | 0.6220 | 0.3303 | 0.9197 |
| 2011 | [11-12] | 0.2519 | 1.2794 | 0.6219 | 0.8642 | 0.3038 | 1.2454 | |
| 2012 | [12-13] | 0.3222 | 1.1042 | 0.5375 | 0.9497 | 0.3784 | 1.1471 | |
| 2013 | [13-14] | 0.3558 | 1.9455 | 0.5104 | 0.9188 | 0.4340 | 1.9004 | |
| 2014 | [10-14] | 0.6923 | 2.0957 | 0.4690 | 0.4690 | 0.8248 | 2.4969 | |
| JNU | 2010 | [10-11] | 0.2897 | 0.8147 | 0.2059 | 1.6110 | 1.0000 | 0.4659 |
| 2011 | [11-12] | 0.2360 | 1.6788 | 0.3318 | 1.1785 | 0.4659 | 1.3152 | |
| 2012 | [12-13] | 0.3962 | 0.4570 | 0.3910 | 1.0784 | 0.6127 | 0.4513 | |
| 2013 | [13-14] | 0.1811 | 1.0877 | 0.4216 | 1.2645 | 0.2765 | 0.8841 | |
| 2014 | [10-14] | 0.1969 | 0.6798 | 0.5332 | 2.5889 | 0.2445 | 0.2445 | |
| NJFU | 2010 | [10-11] | 0.2125 | 0.8293 | 0.5419 | 0.5114 | 0.2350 | 0.8784 |
| 2011 | [11-12] | 0.1762 | 2.0797 | 0.2771 | 1.2625 | 0.2064 | 2.1303 | |
| 2012 | [12-13] | 0.3664 | 0.5774 | 0.3499 | 1.9605 | 0.4398 | 0.5343 | |
| 2013 | [13-14] | 0.2116 | 3.1481 | 0.6859 | 1.0233 | 0.2350 | 3.2506 | |
| 2014 | [10-14] | 0.6661 | 3.1353 | 0.7019 | 1.2952 | 0.7639 | 3.2502 | |
| UJS | 2010 | [10-11] | 0.2051 | 0.2283 | 0.5278 | 0.6138 | 0.2656 | 0.2269 |
| 2011 | [11-12] | 0.0468 | 3.2267 | 0.3239 | 1.1382 | 0.0603 | 3.2264 | |
| 2012 | [12-13] | 0.1511 | 0.6281 | 0.3687 | 0.8110 | 0.1945 | 0.6328 | |
| 2013 | [13-14] | 0.0949 | 2.8131 | 0.2990 | 1.3701 | 0.1231 | 2.7767 | |
| 2014 | [10-14] | 0.2669 | 1.3015 | 0.4097 | 0.7762 | 0.3417 | 1.2866 | |
| NTU | 2010 | [10-11] | 1.0000 | 0.5556 | 1.0000 | 1.0000 | 1.0000 | 0.5556 |
| 2011 | [11-12] | 0.5556 | 1.1871 | 1.0000 | 0.9965 | 0.5556 | 1.1892 | |
| 2012 | [12-13] | 0.6596 | 1.5161 | 0.9965 | 1.0035 | 0.6607 | 1.5135 | |
| 2013 | [13-14] | 1.0000 | 0.6525 | 1.0000 | 0.7306 | 1.0000 | 0.7865 | |
| 2014 | [10-14] | 0.6525 | 0.6525 | 0.7306 | 0.7306 | 0.7865 | 0.7865 | |
| NJNU | 2010 | [10-11] | 0.4203 | 0.4921 | 0.4292 | 0.5292 | 0.6997 | 0.4893 |
| 2011 | [11-12] | 0.2068 | 1.0324 | 0.2271 | 1.4133 | 0.3424 | 1.0319 | |
| 2012 | [12-13] | 0.2135 | 1.3687 | 0.3210 | 1.5200 | 0.3533 | 1.3760 | |
| 2013 | [13-14] | 0.2923 | 1.3607 | 0.4879 | 0.7164 | 0.4862 | 1.7257 | |
| 2014 | [10-14] | 0.3977 | 0.9462 | 0.3496 | 0.8144 | 0.8390 | 1.1991 | |
| JSNU | 2010 | [10-11] | 0.0732 | 0.9143 | 0.3673 | 0.8181 | 0.0863 | 0.8889 |
| 2011 | [11-12] | 0.0669 | 0.5747 | 0.3005 | 0.6306 | 0.0767 | 0.5937 | |
| 2012 | [12-13] | 0.0385 | 1.5010 | 0.1895 | 1.1121 | 0.0456 | 1.6084 | |
| 2013 | [13-14] | 0.0578 | 2.0609 | 0.2107 | 1.0321 | 0.0733 | 2.2030 | |
| 2014 | [10-14] | 0.1190 | 1.6254 | 0.2175 | 0.5921 | 0.1615 | 1.8700 | |
| NJUE | 2010 | [10-11] | 0.4200 | 2.3544 | 0.5719 | 1.7090 | 0.4808 | 2.0797 |
| 2011 | [11-12] | 0.9889 | 0.7543 | 0.9774 | 0.7557 | 1.0000 | 0.8205 | |
| 2012 | [12-13] | 0.7459 | 1.1974 | 0.7387 | 0.9180 | 0.8205 | 1.2187 | |
| 2013 | [13-14] | 0.8932 | 0.2335 | 0.6781 | 0.7702 | 1.0000 | 0.2424 | |
| 2014 | [10-14] | 0.2086 | 0.4966 | 0.5223 | 0.9132 | 0.2424 | 0.5041 | |
| USTS | 2010 | [10-11] | 0.4832 | 0.6639 | 0.6645 | 0.5577 | 0.5394 | 0.7020 |
| 2011 | [11-12] | 0.3208 | 1.5349 | 0.3706 | 1.1918 | 0.3786 | 1.5708 | |
| 2012 | [12-13] | 0.4924 | 1.3224 | 0.4417 | 0.7758 | 0.5948 | 1.4653 | |
| 2013 | [13-14] | 0.6511 | 1.3217 | 0.3426 | 1.7439 | 0.8715 | 1.1474 | |
| 2014 | [10-14] | 0.8606 | 1.7812 | 0.5975 | 0.8993 | 1.0000 | 1.8539 | |
| YZU | 2010 | [10-11] | 0.1194 | 0.7279 | 0.7159 | 1.2190 | 0.1350 | 0.6889 |
| 2011 | [11-12] | 0.0869 | 3.8332 | 0.8727 | 0.4766 | 0.0930 | 5.7272 | |
| 2012 | [12-13] | 0.3333 | 1.9162 | 0.4159 | 1.1631 | 0.5327 | 1.6458 | |
| 2013 | [13-14] | 0.6386 | 0.4098 | 0.4838 | 0.7551 | 0.8767 | 0.6631 | |
| 2014 | [10-14] | 0.2617 | 2.1913 | 0.3653 | 0.5102 | 0.5813 | 4.3057 | |
© 2017 by the authors. Licensee MDPI, Basel, Switzerland. This article is an open access article distributed under the terms and conditions of the Creative Commons Attribution (CC BY) license (http://creativecommons.org/licenses/by/4.0/).
Share and Cite
MDPI and ACS Style
Wang, X.; Hu, H. Sustainable Evaluation of Social Science Research in Higher Education Institutions Based on Data Envelopment Analysis. Sustainability 2017, 9, 644. https://doi.org/10.3390/su9040644
AMA Style
Wang X, Hu H. Sustainable Evaluation of Social Science Research in Higher Education Institutions Based on Data Envelopment Analysis. Sustainability. 2017; 9(4):644. https://doi.org/10.3390/su9040644
Chicago/Turabian StyleWang, Xianmei, and Hanhui Hu. 2017. "Sustainable Evaluation of Social Science Research in Higher Education Institutions Based on Data Envelopment Analysis" Sustainability 9, no. 4: 644. https://doi.org/10.3390/su9040644
Note that from the first issue of 2016, this journal uses article numbers instead of page numbers. See further details here.