Article

Emergy Evaluation of Dwelling Operation in Five Housing Units of Montreal Island, Canada

by
Ricardo Enrique Vega-Azamar
1,*,
Rabindranarth Romero-López
2,
Norma Angélica Oropeza-García
3,
Mathias Glaus
4,
Robert Hausler
4 and
Herlinda Del Socorro Silva-Poot
1
1
Tecnológico Nacional de México, Instituto Tecnológico de Chetumal; Insurgentes 330, Col. David Gvo. Gutiérrez, Chetumal 77013, Quintana Roo, Mexico
2
Unidad de Investigación Especializada en Hidroinformática y Tecnología Ambiental, Facultad de Ingeniería Civil, Universidad Veracruzana, Lomas del Estadio s/n, Zona Universitaria, Xalapa 91000, Veracruz, Mexico
3
División de Ciencias e Ingeniería, Universidad de Quintana Roo, Boulevard Bahía s/n esquina Ignacio Comonfort, Col. Del Bosque, Chetumal 77019, Quintana Roo, Mexico
4
Station Expérimentale des Procédés Pilotes en Environnement, École de Technologie Supérieure, Université du Québec, 1100, rue Notre-Dame Ouest Local A-1500, Montreal, QC H3C 1K3, Canada
*
Author to whom correspondence should be addressed.
Sustainability 2017, 9(4), 663; https://doi.org/10.3390/su9040663
Submission received: 20 February 2017 / Revised: 18 April 2017 / Accepted: 18 April 2017 / Published: 21 April 2017
(This article belongs to the Section Sustainable Urban and Rural Development)

Abstract

:
Sustainability of cities and the environmental implications of high resource utilization by the domestic sector are growing concerns related to urban regions. Well-informed urban planning decision-making is an essential tool to help in the task and, for that, an important point to consider is the influence of parameters like residential density and housing typology on the intensity of resource utilization. Emergy synthesis, a life-cycle energy analysis methodological approach that considers the interaction of natural and human-made flows, was used to evaluate the environmental support for dwelling operational stage in five typical present-day housing units on the island of Montreal. As expected, resource utilization, measured as total emergy used, was positively correlated to housing unit size both with respect to number of occupants and dwelling size. Results suggest that variables affecting notably the intensity of resource utilization are per household income and per dweller habitable space and, while a higher income increased per capita emergy in all cases, increasing space availability per resident did not result in a decrease of empower density after 50 m2/person. Future work should consider lower and higher densities and analyses at the scale of blocks, neighborhoods and urban planning zones.

1. Introduction

Since the end of the last decade, most of the world’s population resides in a city and around 33% of city-dwellers lives in a slum [1]; current trends indicate that the number of urban residents will continue to increase to around 66% of total world population by 2050 [2]. Among the main local level to global scale environmental problems related to urban growth, often also associated with inadequate planning, are decline in agricultural and forest land, drying out of marshes, extraction of construction materials in large quantities, pollution of water courses by untreated wastewater, air pollution and large emissions of greenhouse gases from motor vehicles and industries [3,4]; hence, the evolution and development of cities has become a growing concern.
The domestic sector’s high resource consumption in urban regions is a frequent characteristic that must be undertaken. For instance, operation of buildings in urban areas requires a substantial fraction of the energy used in the world, reaching up to 50%, 41% and 36% in the UK, the EU and the USA, respectively [5], and fractions corresponding to the transport and industry sectors should also be added. Household domestic consumption is an important source of greenhouse gases (GHG) in urban areas, along with the industrial and urban agricultural sectors [6]. Food, people’s mobility, and energy use at home are arguably three of the most important features related to housing activities threatening sustainability; altogether, they may be responsible of up to four-fifths of the environmental impacts in developed countries [7].
An important point to consider is the influence of the occupation intensity of the urban territory on resource consumption. Since almost three decades ago, Newman and Kenworthy [8] in their seminal work, found that cities with low population density use more energy for the transportation of people than cities with higher occupation rates. In the case of residential land uses, occupation intensity is directly determined by development density (number of dwellings per unit area), but it also involves concepts like spatial distribution of dwellings, housing typology, dwelling occupation rate [9,10] and other features indirectly related to urban form, such as distance to downtown and access to urban amenities and infrastructure [11].
The operational stage of buildings is a very important phase of their life cycle. Some authors have found that energy consumption in the operation of residential buildings may account for up to 90% of total energy consumption in the life cycle of that kind of buildings [12]; while other authors have found housing type, floor area, occupancy rate and household income among other variables influencing electricity consumption during the operational stage of residential buildings [13].
For their part, material flow accounting [14,15], ecological footprint [16,17], and life cycle energy analysis [10,18,19] are among the most widely used methodologies to quantify the flows that coincide in the built environment. Emergy synthesis belongs to the energetic life cycle approach, but it also allows the integration of both natural and human-made flows (like the economic ones) into the same basis of comparison, which takes into consideration the ‘free’ services provided by the environment and their quality: “emergy is the total amount of available energy of one kind (usually solar) that is directly and indirectly required to make a given product or to support a given flow” [20].
Emergy analysis has showed to be an appropriated methodology to evaluate and compare sustainability in the built environment because it allows to consider, in a combined way, the flows of different nature intertwining in urban ecosystems [21]. From the standpoint of geographical disaggregation level, emergy synthesis has been used in several studies from the urban region scale to the building level scale. At the city scale, several works have been reported since one of the seminal works was published in 1998 for the Taipei region [22], among which are studies for Rome [23], Macao [24], Beijing [25] and Montreal [26], just to cite some of them.
At the building level, several emergy assessments have been carried out focusing on the environmental impact of construction materials and on energy efficiency of single buildings [27,28] or addressing the subject from a generic perspective, since building appraisal was not the central issue of the study [29]. At this scale of analysis, other methodological tools have been combined with emergy synthesis; arguably, the most widely used in this way is life-cycle assessment since Hau and Bakshi noticed the advantages this might entail [30]. With this methodological combination, Reza et al compared a single-family building with a multi-family building in Canada [31] and evaluated the sustainability of paved roads [32], and Li and Wang assessed a residential area of more than 150,000 inhabitants although with a building level approach [33], just to mention a few. The common denominator of these studies is that the focus is mainly on building materials and construction processes’ environmental performance and on the environmental impacts of single buildings (for the case of dwelling buildings), in which the operational stage does not include the dwellers daily activities; in general, for this stage of the building life cycle, the main variables considered are water and energy consumption, which are estimated either through average statistical values or well-known simulation tools.
On the other hand, from the urban planning perspective, a relevant intervention level is the neighborhood [34]. At this disaggregation level, or close to it, some authors have highlighted the need for information at the scale of land use or land cover to determine the relationship between socioeconomic performance of urban subsystems such as industry, business and commerce, real estate and housing developments and other services and their environmental implications [35]. Also, regarding environmental sustainability, some studies have pointed out the need of studying quantitatively, and in greater detail, the impacts that go beyond the neighborhood limits, including regional resource use, due to the fact that local consumption of goods and services is greatly dependent on areas surpassing the city level [36].
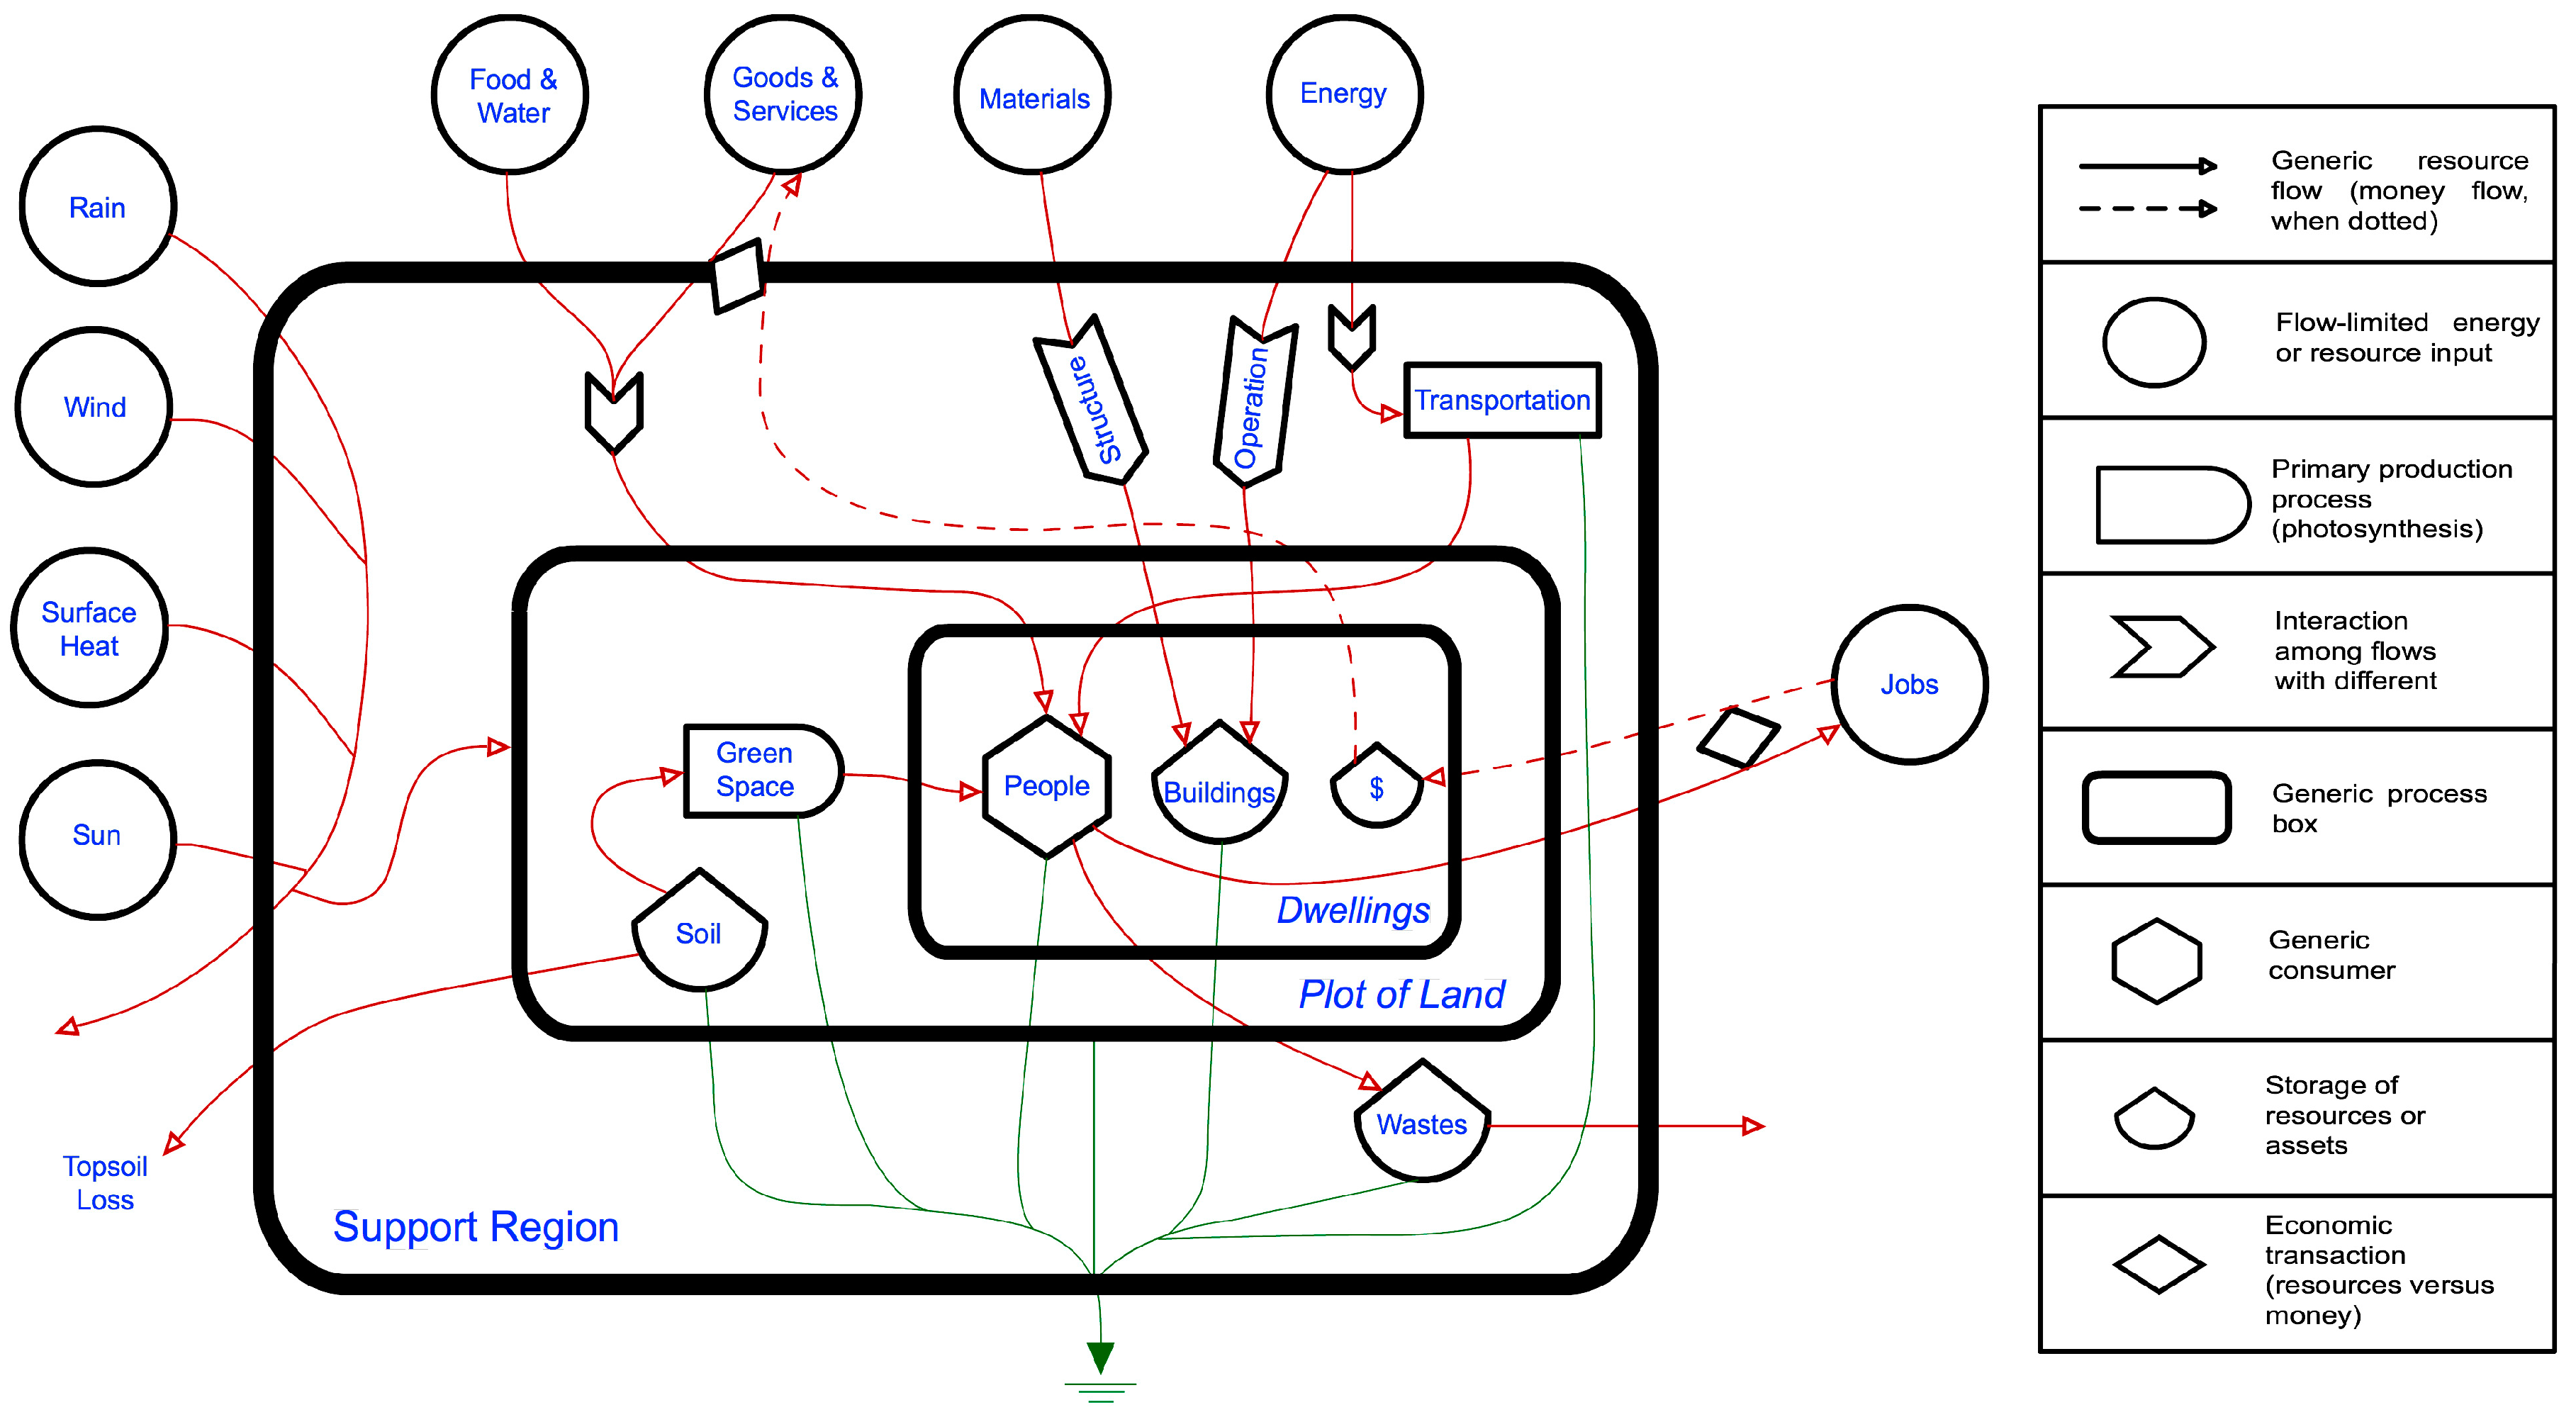
A relevant scale of analysis between the building level and the neighborhood or planning zone level (e.g., residential land use) is the housing unit, which is an essential part of the neighborhood structure. To a large extent, for the case of the residential land use, urban form is induced through the application of density, and other related parameters, to groups of blocks, which translates into different housing unit configurations. This study aimed at providing elements to close the gap in this opportunity area for sustainable urban development and planning; it was conducted with a strong sustainability approach [37], focusing on the environmental work provided by the resources supporting dwelling operational stage in the housing units, since this phase is one of the most important of the whole dwelling life cycle. At this stage, not only direct dwelling operation related activities (e.g., water and energy consumption) should be taken into account: dwellers activities (e.g., food, mobility, goods and services) are also relevant for the appraisal of the way in which housing units use resources, in this case, through the quantification of emergy-based sustainability indicators.
In this context, the present work sought to quantify the environmental support required for dwellers’ daily activities in five housing units on the island of Montreal, Canada (45°30′N, 73°30′W). In 2015, the Island had a total population of two million inhabitants distributed in an area of 500 km2 [38]. The economy of the Island is based on industrial, technology and knowledge related activities [39]. Net residential density (total number of dwellings divided by lot area without roads and public and institutional related infrastructure) averages 38.5 dwellings per hectare (dw/ha) on the island, ranging from around 120 dw/ha in downtown districts to 15 dw/ha in suburban residential areas [40]. The general objective of the study was to evaluate the ‘free’ environmental work supporting dwelling operational stage using five typical present-day housing units in Montreal Island as a case study by means of the appraisal of the main flows interacting in the residential units with the help of the emergy environmental accounting methodology to examine the usefulness of emergy-based indicators for assisting urban planning decisions, especially, in the setting-up of future residential units’ environmental design guidelines to support neighborhood planning processes.
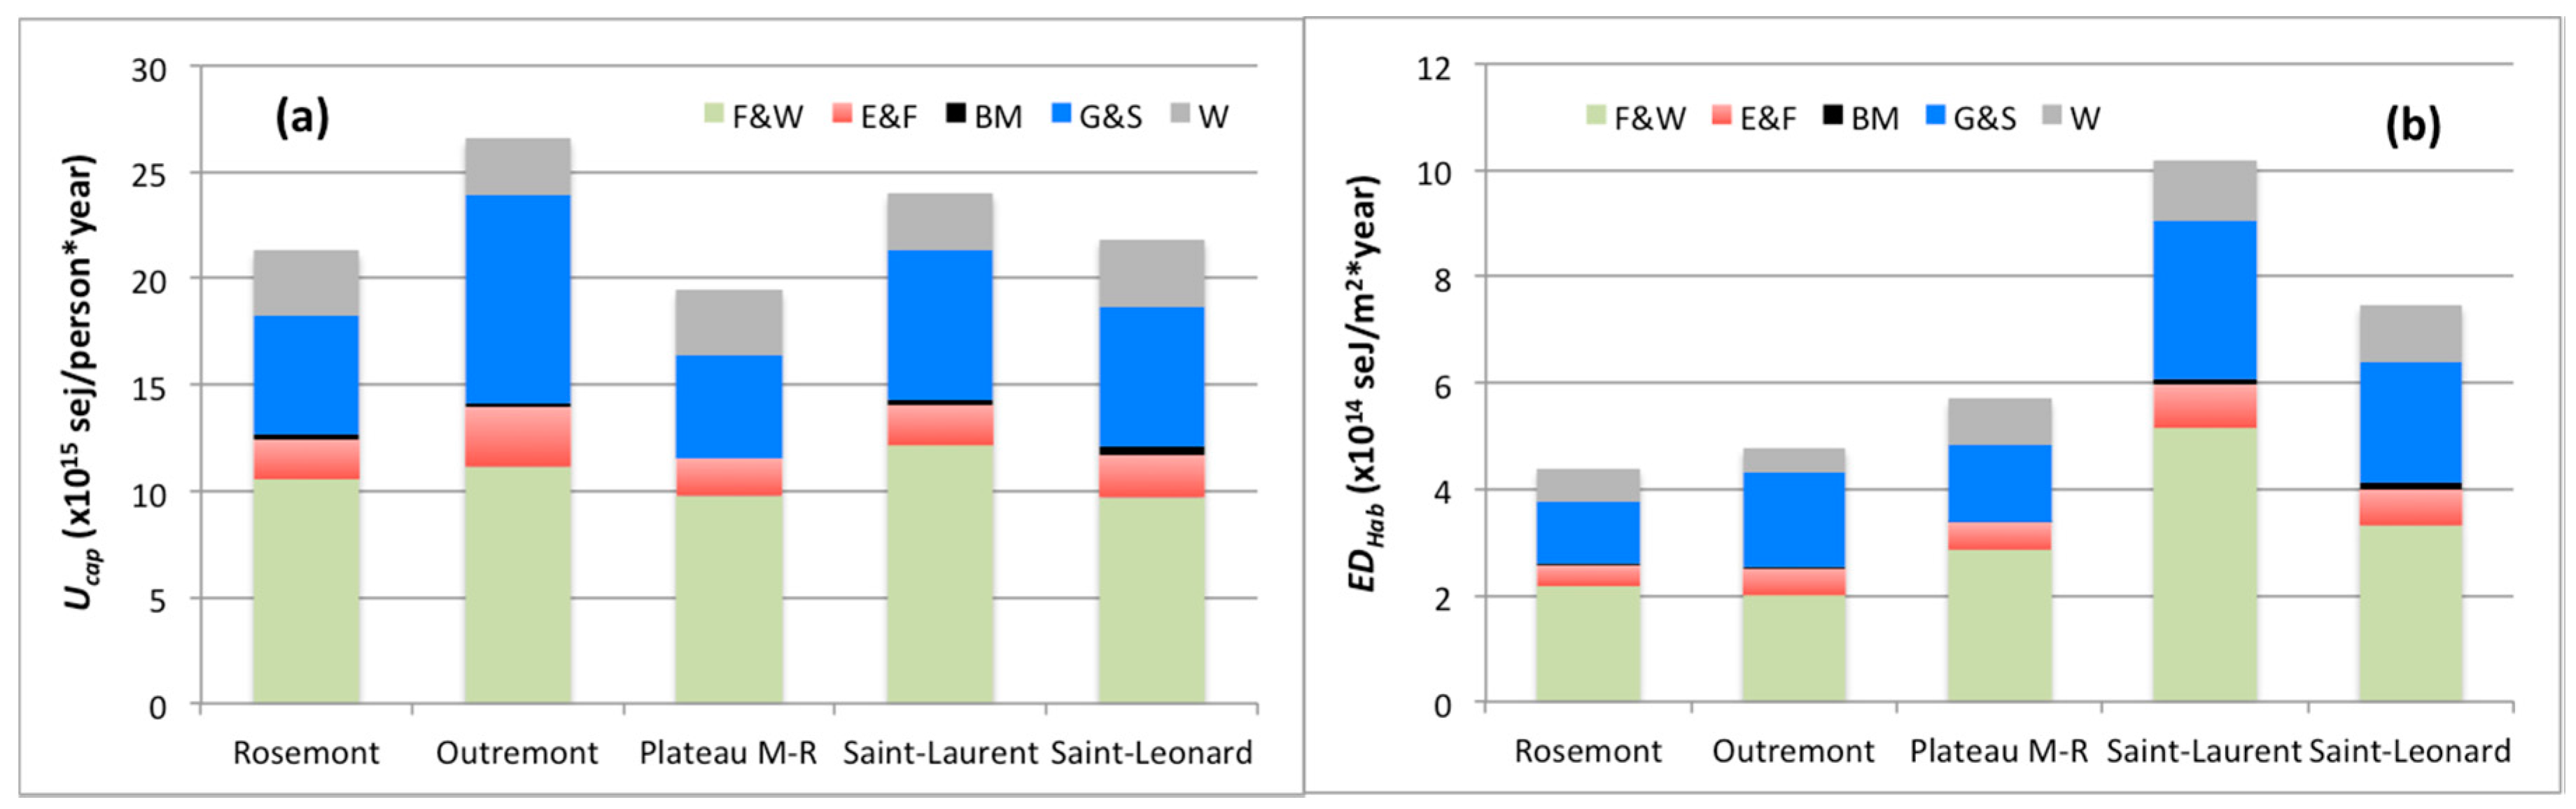
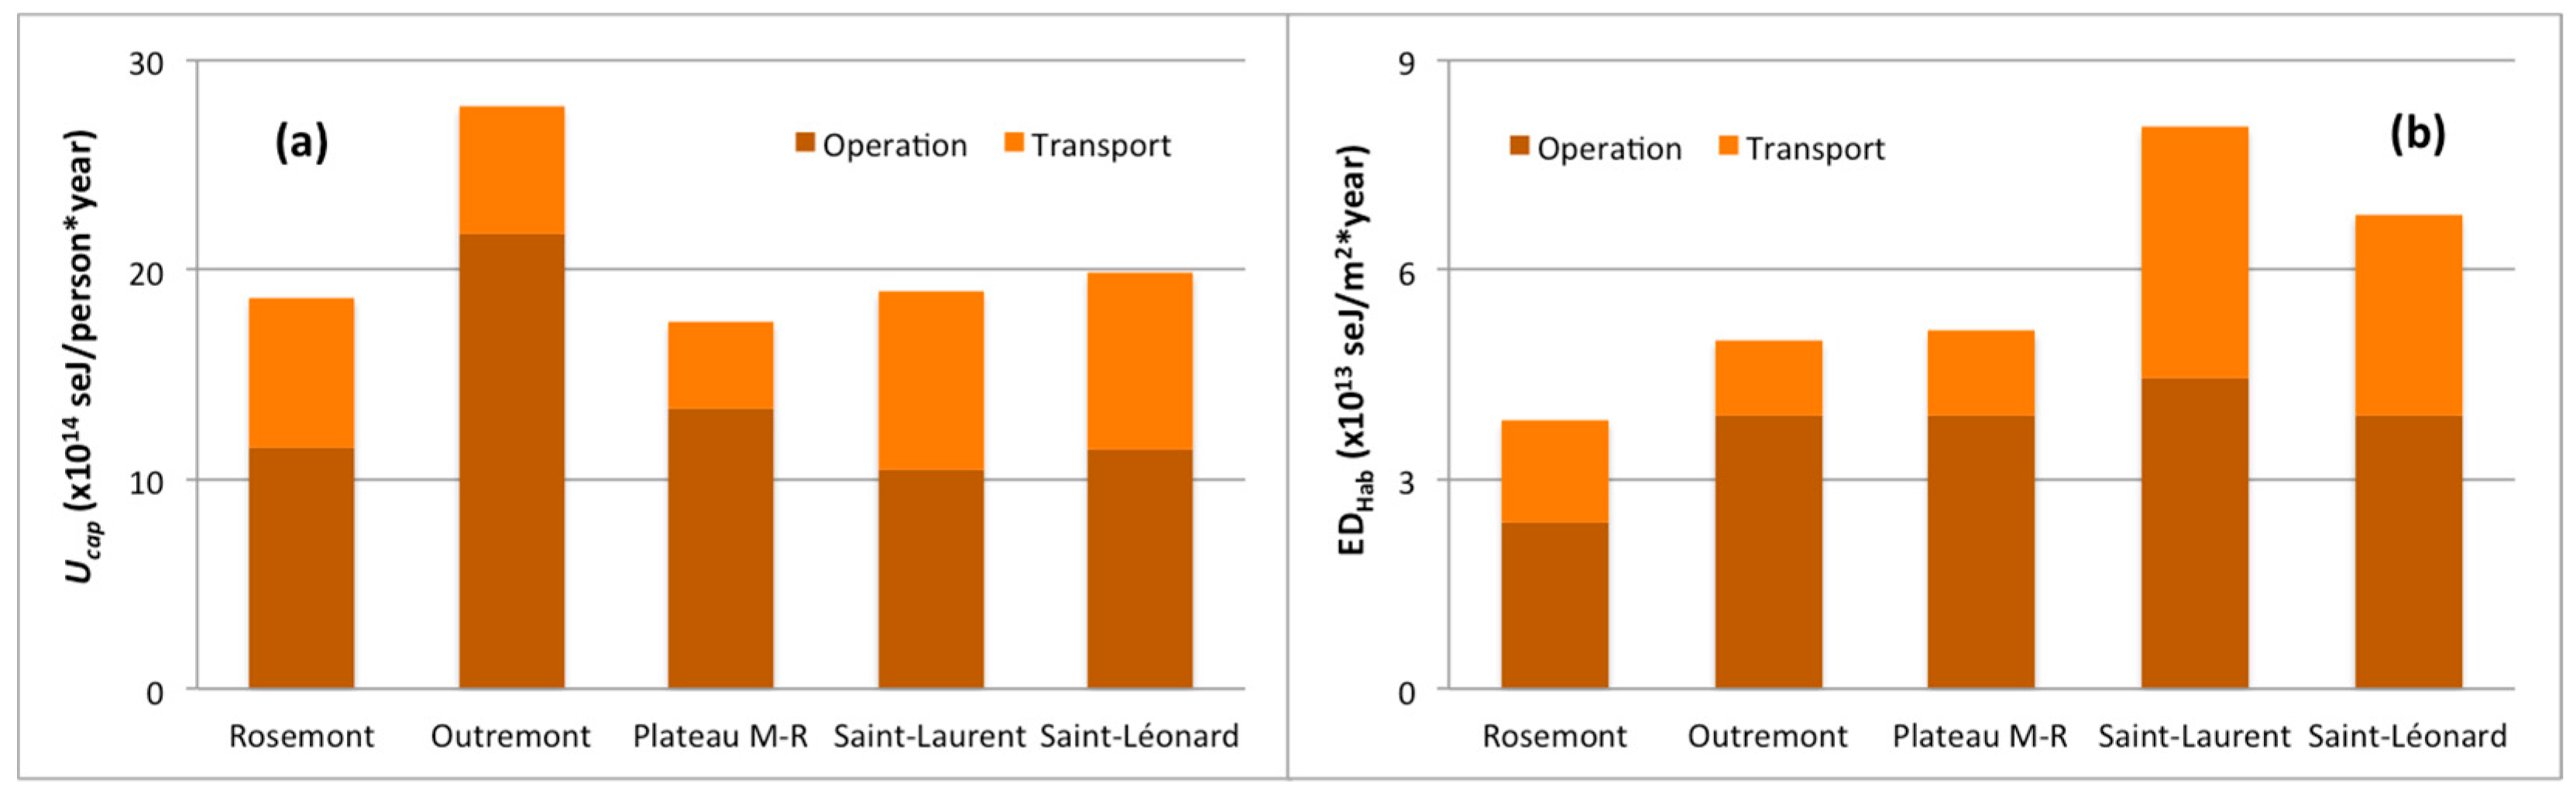
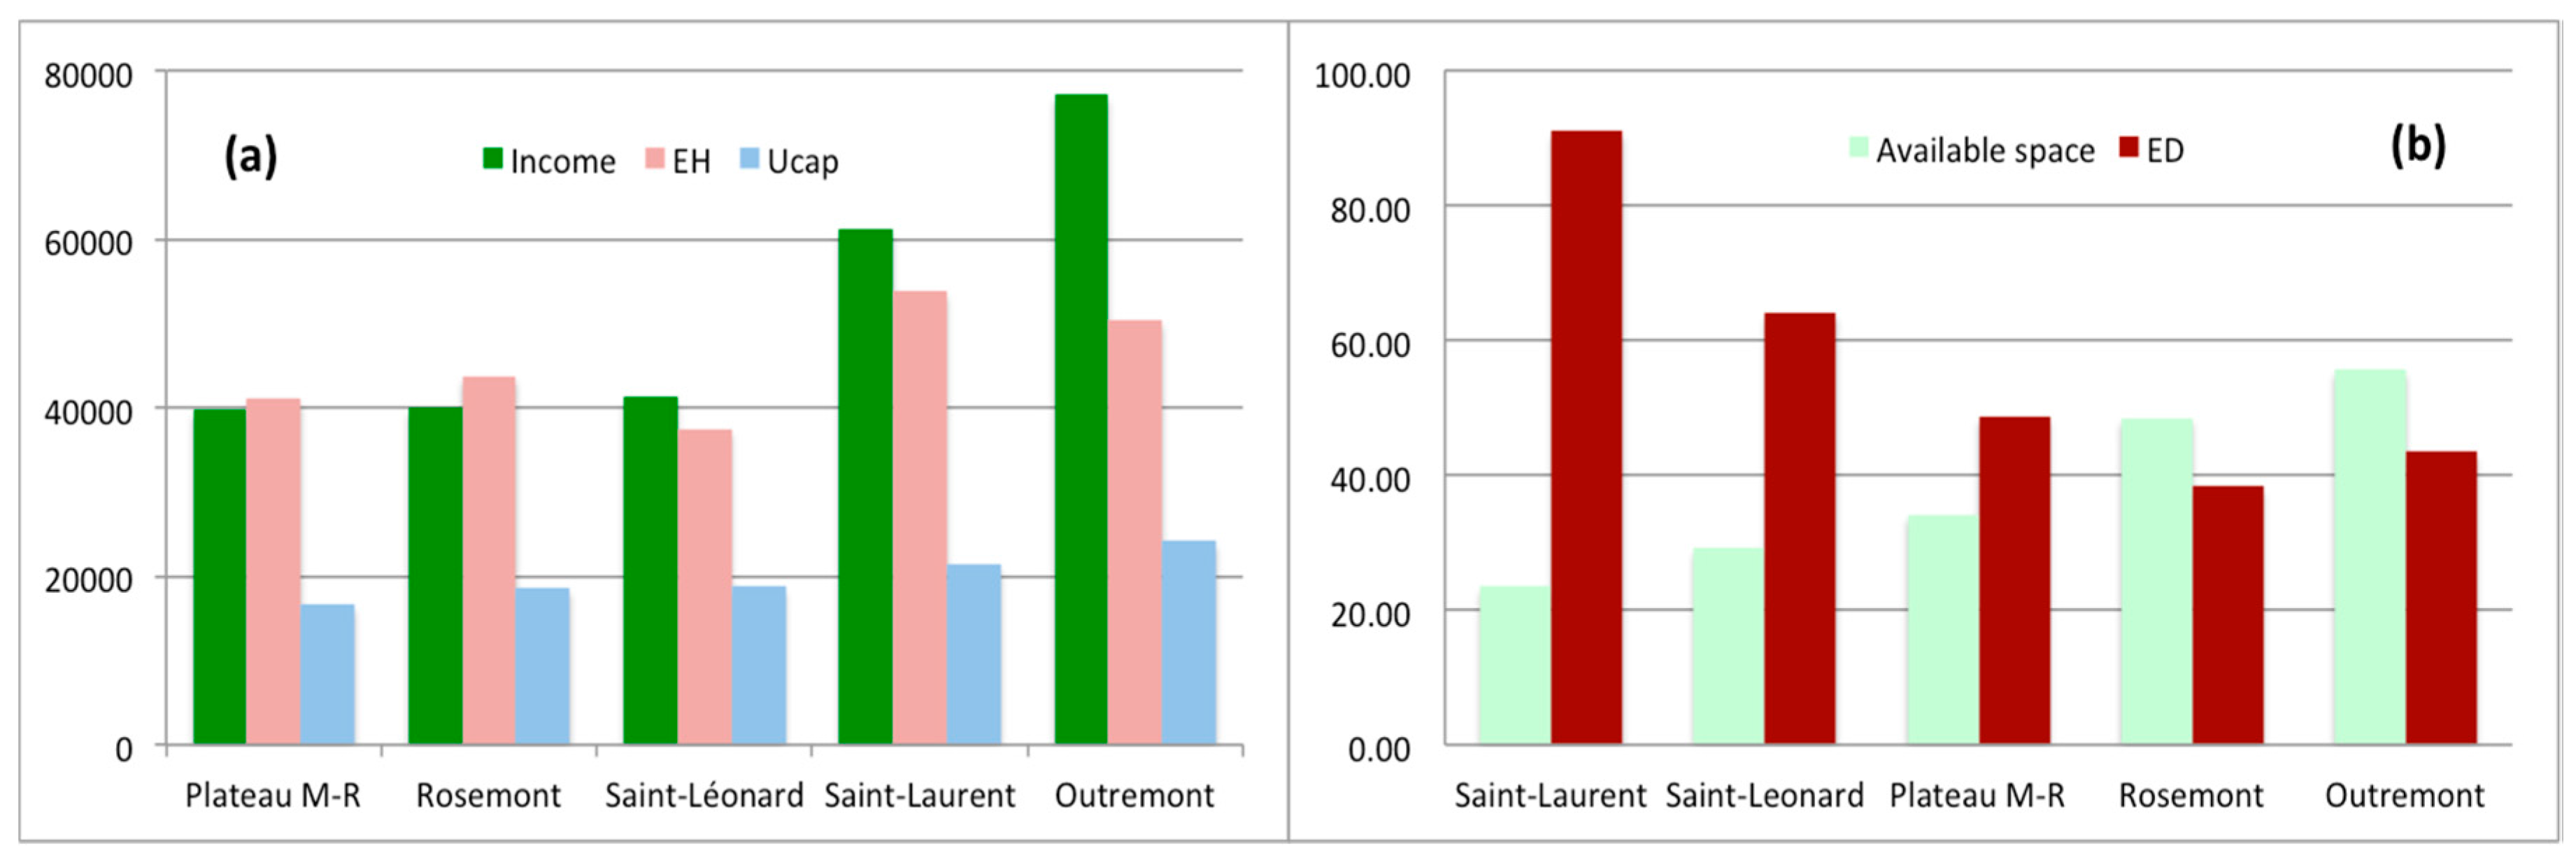
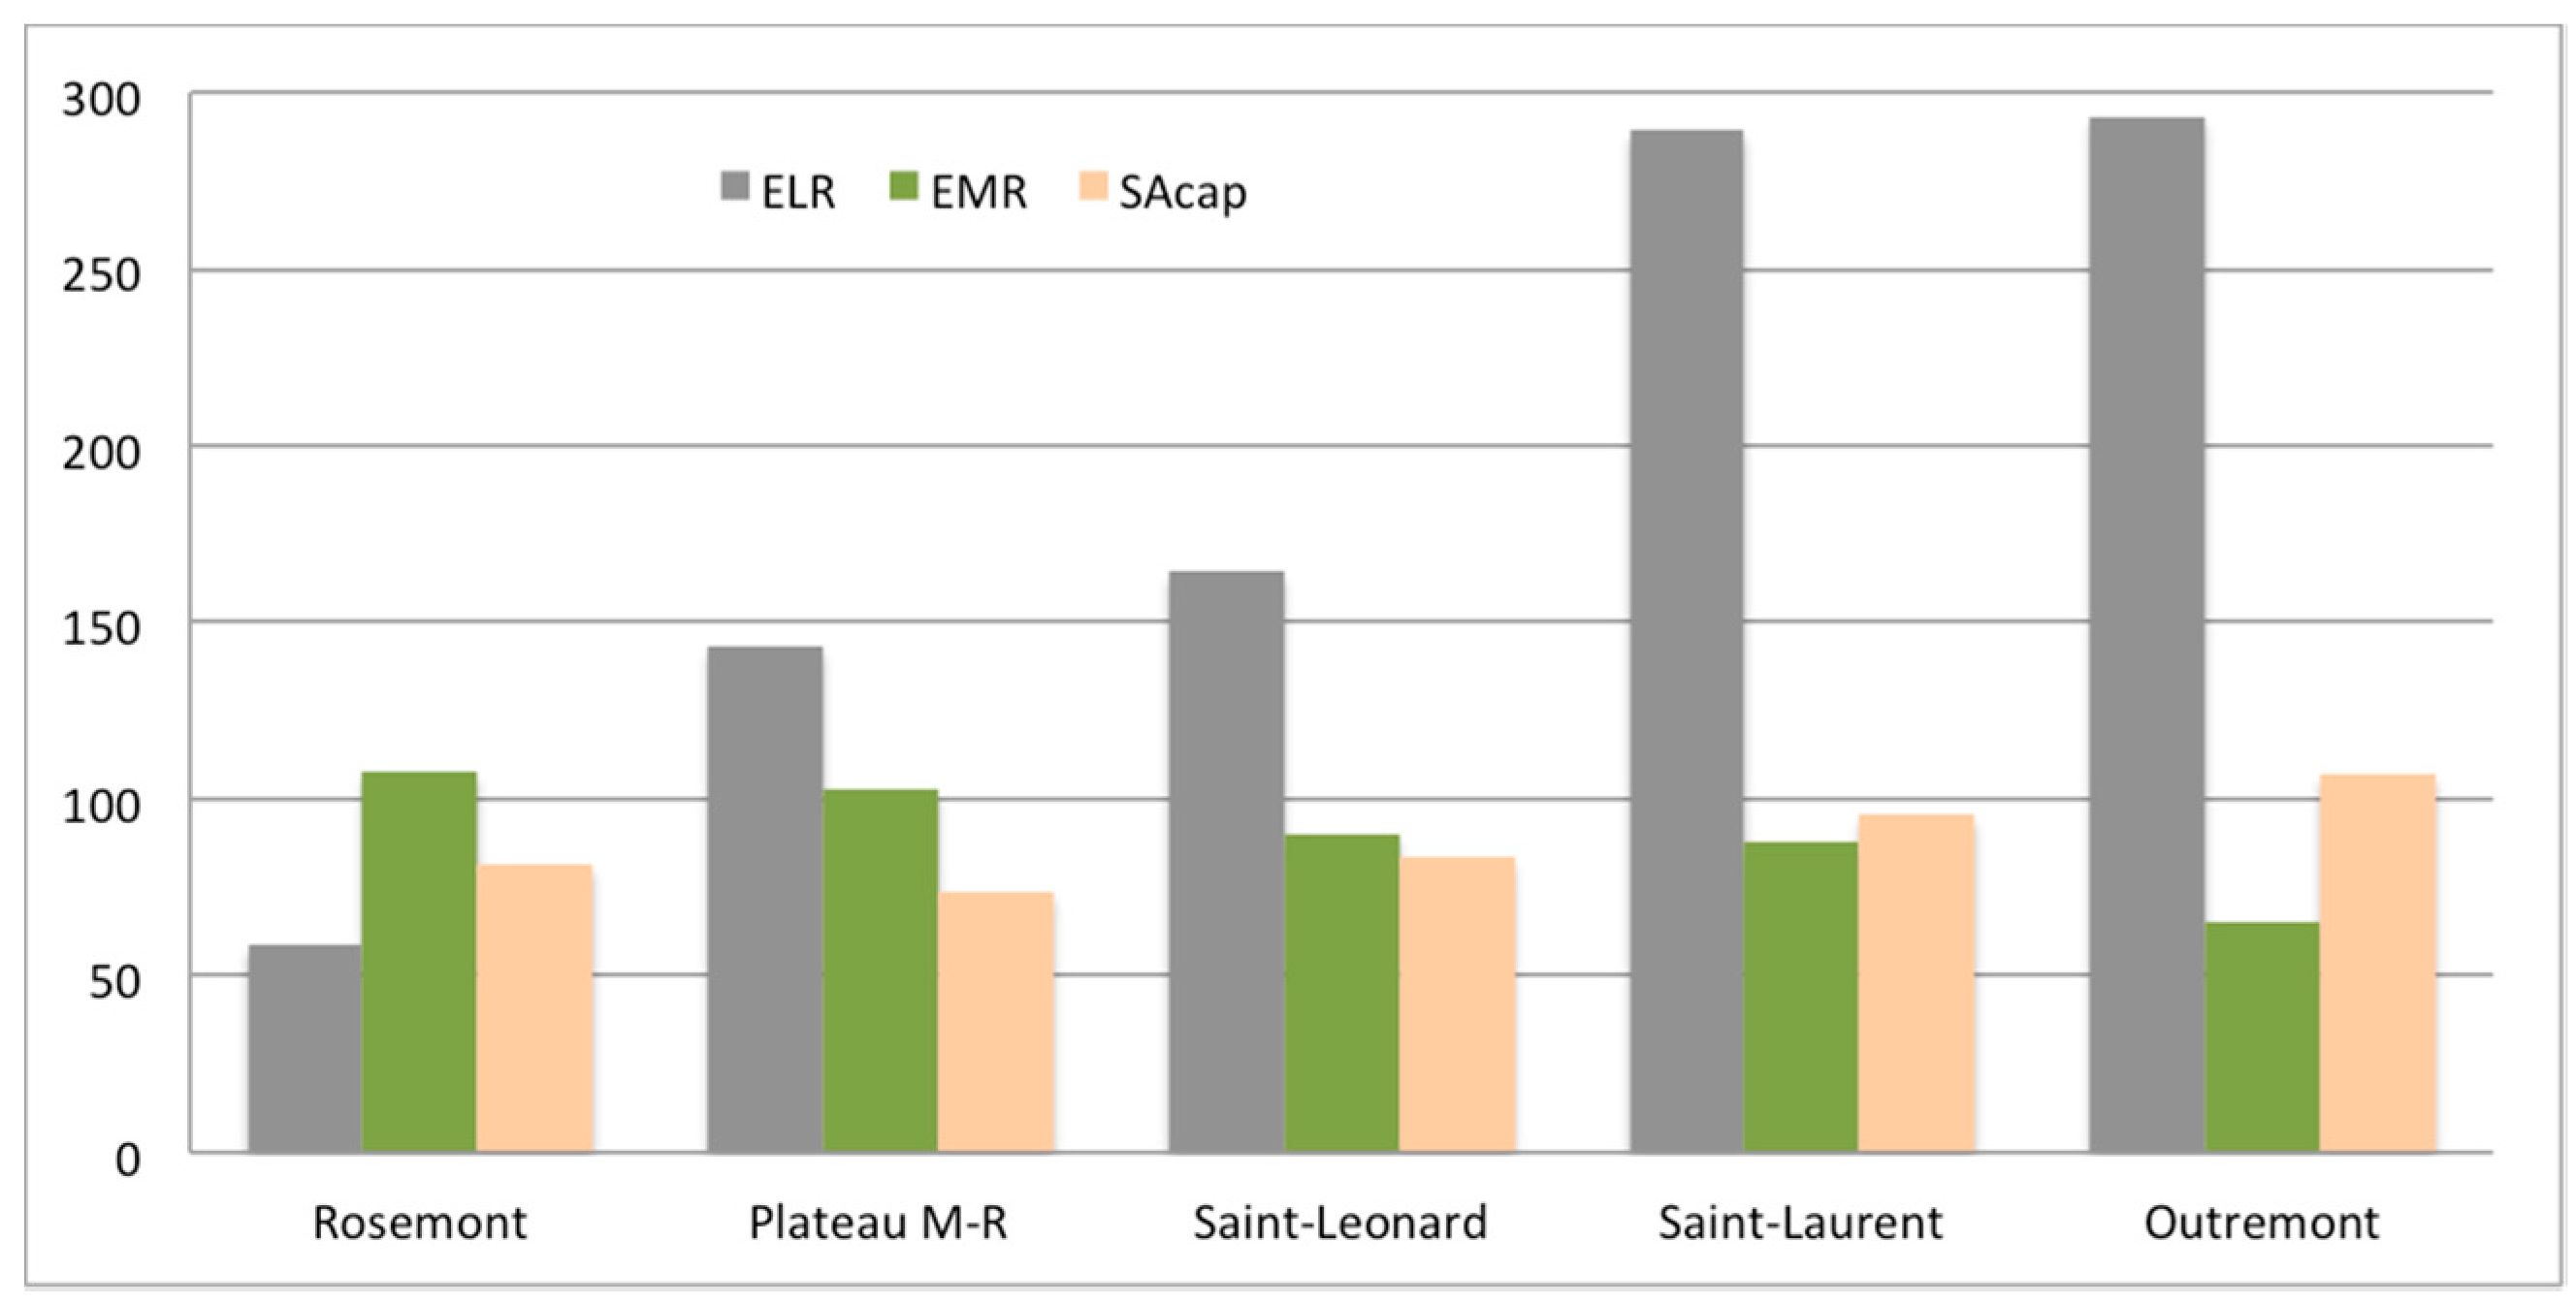
The work has a sustainable urbanism perspective, since the focus is put on the applicability of sustainability criteria (emergy-based indicators) to support decision-making in urban planning contexts. As already mentioned, the work’s main purpose was to explore the appropriateness of using sustainability indicators as a complement of commonly used parameters in urban physical planning decision-making (e.g., development density, building parameters, accessibility to urban amenities), to collaborate in the setting-up of guidelines for housing units and neighborhoods with better environmental performance. Among the emergy-based indicators calculated for the dwelling operational stage in the five selected housing units (all of which are described in greater detail in the methods, results and discussion sections) are per capita emergy use, indicating resource use intensity on a per dweller basis, empower density, indicating resource use intensity per unit area, and emergy to money ratio, indicating ecological-economic efficiency. It was observed that overall resource utilization (total emergy used) was positively correlated to housing unit size (both with respect to number of occupants and to floor area) and it was also noticed that per household income and per dweller habitable space influenced intensity of resource utilization in the analyzed housing units.

2. Methods and Data

2.1. Emergy Synthesis

An important aspect that should be considered in life-cycle energy studies is that there are different energy qualities organized in a hierarchy; for example, many joules of sunlight are required to generate one joule of electricity [20]. Here, a central idea is the required amount of accumulated energy at the input of a process to obtain one joule, one gram or one dollar at its output, the emergy unit value concept; when this value relates the accumulated energy (measured in seJ, solar emergy joules) in the input to the energy obtained (available) at the output (joules) of a process, it is known as transformity, which is the most widely known emergy unit value and it is also a measure of the energy efficiency of the process [41].
Initially, a balance of the energy accumulated in the biosphere was made [42,43]. Subsequently, from the aforementioned energy balance, transformities of large ecosystems such as forests, marine and wetland ecosystems, agricultural landscapes and lakes were calculated [44,45,46]. Likewise, from these transformities, unit values of resources such as wood, soil, water, among others, were estimated, and so on; emergy unit values of human-made materials, products and services have been calculated with a very good level of detail and are available for their use in studies of different academic disciplines [21,23].
Generally, emergy assessments start with the delimitation of the system under analysis (Figure 1). The system’s diagram should include the most important flows of materials, energy, money, etc. at the input and output. For the evaluation of the housing units, the most important natural flows considered were: energy from the sun, wind kinetic energy, loss of vegetation humidity (evapotranspiration), loss of surface soil, food, water, domestic consumer goods, electricity, fuels, municipal solid wastes and wastewater. Once the system under analysis is delimited, a table is drawn up with the raw data collected and processed to calculate the emergy flows (Table 1), which are computed by multiplying the first ones by the appropriate emergy unit values [41].
In the present study, the only feature not corresponding to dwelling operational stage considered was the building materials in the structure; it was examined to explore the approximate percentage they represent of total emergy used. Although other materials present in dwellings, like non-structural materials and finishes, and related infrastructure, such as streets, sewers and other facilities, are important components contributing to total emergy used, they were not considered in this work because, unlike structural materials, they are present in similar proportions in virtually all cases, and maintenance and other constructive stages appear to have low significance [18] and, for its part, the structure may represent up to 80% of the bulk of a typical construction [47]. Likewise, the distance to downtown was taken into account as an important parameter affecting resource consumption owing to residents’ mobility, which in turn should be considered as a dwelling operational stage inherent activity [48].
Total emergy utilized (U) is the sum of the emergy from purchased goods (items 5 to 21 in Table 1) and the highest value of emergy from renewable resources (items 1 to 4 in Table 1), to avoid double counting [25,49]. The global baseline of emergy accumulated in the biosphere considered in the present study was 15.83 × 1024 seJ/year, which was estimated from solar insolation, deep earth heat and tidal energy [41,43]. Once the aggregate emergy flows are calculated, i.e., renewable (R), non-renewable (N), acquired or purchased (F) and those accumulated in wastes (W), the performance of the system under study is evaluated through indicators and indices (Table 2), which are used as support criteria in decision-making processes [50].
The above-mentioned indicators help to compare the performance of the considered housing units with an emphasis on the environmental support (measured as emergy from the used goods and services) needed for the households’ daily running.
For further methodological issues related to emergy analysis, the following references may be consulted [20,41,43,44,45,46,50,57,58]. For case studies of emergy synthesis in the built environment, the following papers may also be consulted [23,24,25,26,27,28,33,51].

2.2. Data

Five residential units, located in five different boroughs of the City of Montreal, were analyzed. The housing types of the units were: four-story apartment buildings, two and three-story side attached townhouses and three-story complexes in the unit in the borough of Rosemont, two-story side attached small houses and four-story multifamily buildings in Outremont, three-story multifamily building in Plateau Mont-Royal (M-R), seven-story multifamily building in Saint-Laurent and five-story multifamily building in Saint-Leonard, with lot coverage ratios of 42, 80%, 52%, 28% and 50%, respectively [59]. Distance to the city center was estimated indirectly through the length between the location of the residential units and the center of the central business district of the island, which was measured with the help of ArcView 3.3 GIS software. As mentioned above, distance to downtown was estimated as a straight line (rather than network distance) as a proxy to explore the importance of occupants’ mobility on daily resource consumption as the analysis was focused on household day-by-day activities. Table 3 and Table 4 show the most relevant features used in the assessment of the residential units.
The year of study was 2008, however, some information came from sources of slightly different dates, such as the studies related to energy consumption in buildings, the electoral districts statistics profiles, given that all data were scaled down to the most detailed level of disaggregation possible as one of the highest priorities and challenges [34].
In addition, unavailable data for the year of study, especially those belonging to money flows (all expressed in U.S. dollars), were converted to 2008’s value through the application of price indexes [18,60]. Table 5 shows the data processing.

3. Results

Total emergy utilized (U) changed in correspondence with housing unit size, both with respect to dwelling occupancy and building size, as anticipated, and purchased emergy (F) was the dominant flow sustaining dwelling operation and dwellers day-by-day activities.

3.1. Aggregated Emergy Flows

Purchased emergy (F) averaged 99.99% of total emergy used, while renewable emergy (R), local non-renewable emergy (N) and emergy from wastes (W) averaged about 0.0074%, 0.0026% and 15.11% of U, respectively. Table 6 shows the main emergy flows computed for the five housing units. Due to the statistical limitations of the present study, and to the level of data disaggregation, the presented figures may not be significant, but they can lead to interesting traces, especially in urban contexts [82]: the presented figures, especially those relating to natural flows, should be considered with absolute caution.
R corresponded to the kinetic energy from wind for the housing unit in Outremont borough, where lot coverage ratio was the highest (80%), and to the chemical potential of rain (evapotranspiration in green areas) for the rest of the cases, while N corresponded to topsoil loss for the setting-up of the housing units.

3.2. Purchased Emergy and Emergy From Wastes

In the five housing units, both per dweller and per unit of floor area, emergy consumptions were determined, in both cases, the higher the Ucap and the EDHab, the higher the intensity of resource use. Figure 2 shows the itemized flows that were analyzed in the five residential units.
Emergy from food and water accounted for just over 50% of U in the housing units; the units in Saint-Laurent and in Saint-Leonard presented the largest and smallest per resident uses (12,143 × 1012 and 9700 × 1012 seJ/person·year, respectively) and the units in Saint-Laurent and in Outremont presented the highest and the lowest emergy consumption values per unit area (515 × 1012 and 200 × 1012 seJ/m2·year, respectively).
Emergy from basic consumer items and services accounted for nearly 34% of U in the housing units; Outremont exhibited the highest per capita use (9819 × 1012 seJ/person·year) and Plateau Mont-Royal the lowest (4900 × 1012 seJ/person·year) and Saint-Laurent and Rosemont showed the largest and the smallest consumptions per unit area (300 × 1012 and 115 × 1012 seJ/m2·year, respectively).
In all five cases, emergy from energy for both dwelling operation and dwellers mobility, averaged 10% of U in the housing units; Outremont presented the highest per occupant use (2783 × 1012 seJ/person·year) and Plateau Mont-Royal the lowest (1753 × 1012 seJ/person·year), while, once again, Saint-Laurent and Rosemont presented the largest and the smallest consumptions per unit area (81 × 1012 and 39 × 1012 seJ/m2·year, respectively).
As mentioned above (Table 5), the highest percentage of emergy from generated wastes corresponded to the unit in Plateau M-R; the highest per resident emergy from wastes corresponded to the unit in Saint-Leonard (3190 × 1012 seJ/person·year) and the highest per floor area value corresponded to that in Saint-Laurent (113 × 1012 seJ/m2·year), while the lowest per capita amount corresponded to the unit in Saint-Laurent (2654 × 1012 seJ/person·year) and the lowest per square meter of habitable area value corresponded to that in Outremont (47 × 1012 seJ/m2·year).
The contribution of the structural components of the buildings was not significant in terms of emergy utilization when compared to the other analyzed flows; it only averaged 1.2% of U in the housing units. The highest percentage corresponded to the unit in Saint-Leonard (2%), which structure is made out of concrete, and the lowest to that in Plateau M-R (0.3%), which structure is made out of wood. This trend did not vary when the basis of comparison was changed (per capita or per square meter) and, when concrete and steel were combined with wood (Rosemont and Outremont, respectively), emergy from the structure decreased markedly. Finally, Table 7 condenses the main emergy-based indicators calculated the five residential units.

4. Discussion

4.1. Net Density and Distance to City Center

Density of occupation is one of the most important features determining urban form, which is why many studies consider this parameter among the variables to analyze [9]. In this regard, net density of the residential units did not seem to influence per capita emergy use corresponding to energy for dwelling operation (including that for dwellers mobility), while it appeared to slightly affect per square meter use (Figure 3).
With respect to the emergy needed for dwelling operation of the housing units, with the exception of the unit in Outremont, outcomes on a per dweller basis show disparities with respect to findings of other similar studies in which energy use for building operation in low-density zones is 1.5 times higher, or more, than that in high-density areas [10,18], while per unit area results did not differ significantly. This may be attributed to the particular characteristics of the selected housing units (net density, dwelling typology and dwelling occupancy) and to differences in the mixing of electricity (in Montreal, its origin is hydraulic) and fuels considered in the present study.
Emergy from energy for the mobility of dwellers is more affected by distance to the city center than other variables like density (Figure 3), in a like manner to other works, which have found that distance to the core of the inner city is more relevant than parameters like housing typology, density and spatial arrangement of roads [11]. The units in Saint-Laurent and Saint-Leonard exhibited the highest values both on a per capita basis and per square meter of built-up area; both are the most distant to the city center (Table 3) and have the highest car use split, 66.5% and 65.7% respectively [73]. The relatively high and low consumption of the units in Rosemont and Plateau M-R may also be explained by the combination of distance to downtown and automobile mode split (48.1% and 33%, respectively).

4.2. Per household Income and Available Space Per Person

Total emergy use per dwelling (EH) can be considered as proxy for living quality in the built environment [33], in this case the housing units, and, in the same way, per dweller emergy can also be taken as proxy for standard of living. Because of this, it was examined whether an equivalent economic indicator at the ‘micro’ level, per household income, could be associated to per dweller emergy utilization and to emergy use per dwelling, presuming that income levels vary in accordance to Ucap and EH. This general trend was found, although more markedly for the two units with higher incomes, since the other three units have nearly equal incomes (Figure 4a).
It was also observed that increasing per dweller space availability, which occurs frequently as a result of the decrease of both housing density and accommodation of occupants by dwelling, decreases resource utilization intensity, measured as empower density of the living space, but up to some point: from around more than 50 m2/person, increasing per resident space availability did not result in a decrease of EDHab (Figure 4b). Empower density is the total emergy used in a given area (in this case, the habitable area) per unit time; as mentioned above, it is an indicator of resource use intensity with high values for industrial activities and urban centers [83]; it may also may indicate scarcity of available land or need of support land [23]. Ucap, EH and EDHab may also evidence ‘abuse’ of resource consumption, depending on the origin of the emergy flows.

4.3. Emergy-Based Performance Indicators

As mentioned in Table 2, ELR is the ratio of non-renewable and purchased emergy to renewable emergy, it evaluates the balance between non-renewable and renewable resources, so the higher its value, the less sustainable the system under study [83]. On the other hand, EMR illustrates the capacity of money to buy emergy [25], but it also can be taken as a proxy for economic-ecological efficiency: higher values of the emergy to money ratio are associated to lower levels of resource utilization efficiency [84]. In turn, carrying capacity can be calculated through the surface of land needed (SA) to acquire sufficient inputs to satisfy the resource demands of a population (in this case, the housing units’ residents) circumscribed to a local system (Montreal Island), based on the regional system’s level of development, specifically through its ELR [83].
With respect to these indicators, given that for each one of them lower values correspond to better performances, in addition to their individual values (displayed in Figure 5), the simultaneous performance of the three indicators can be appreciated by taking into account the combined surface of the three bars of each housing unit. Rosemont presented the lowest ELR, which may be explained by the contribution of renewable resources coming from green areas and by the habitable area to lot area ratio (the lowest). Outremont showed the lowest EMR, where the high-income level translates into a high emergy utilization rate. The relatively low per capita and per household emergy use in Plateau M-R is reflected in a smaller need of per dweller support area. The best-combined performance corresponded to the housing unit in Rosemont.
As mentioned above, per household empower may inform on living quality in housing areas. For its part, emergy from the wastes generated in the housing units (here, municipal solid wastes and wastewater) divided by the total number of households in each unit is an indicator of their environmental load. High values of EH correspond to higher availability of resources, whereas high values of WH indicate greater impacts. In Figure 6, EH to WH ratios obtained for the residential units are plotted; these ratios may assist for assigning a sustainability ranking: in the graphic, a higher slope indicates a larger proportion of acquired commodities and services to generated pollutants [33]. In the studied units, the ranking, in descending order, was: Outremont, Saint-Laurent, Rosemont, Saint-Leonard and Plateau Mont-Royal. Higher household incomes in Outremont and Saint-Laurent units, which give them a greater ability to acquire emergy, do not seem to translate into a markedly greater amount of per household emergy from wastes.

5. Conclusions

We emphasize the exploratory nature of the present work; limitations of this kind of case studies are widely recognized. However, despite the strict lack of statistical representativeness, it is possible to pull interesting findings out, which become the basis for future research avenues.
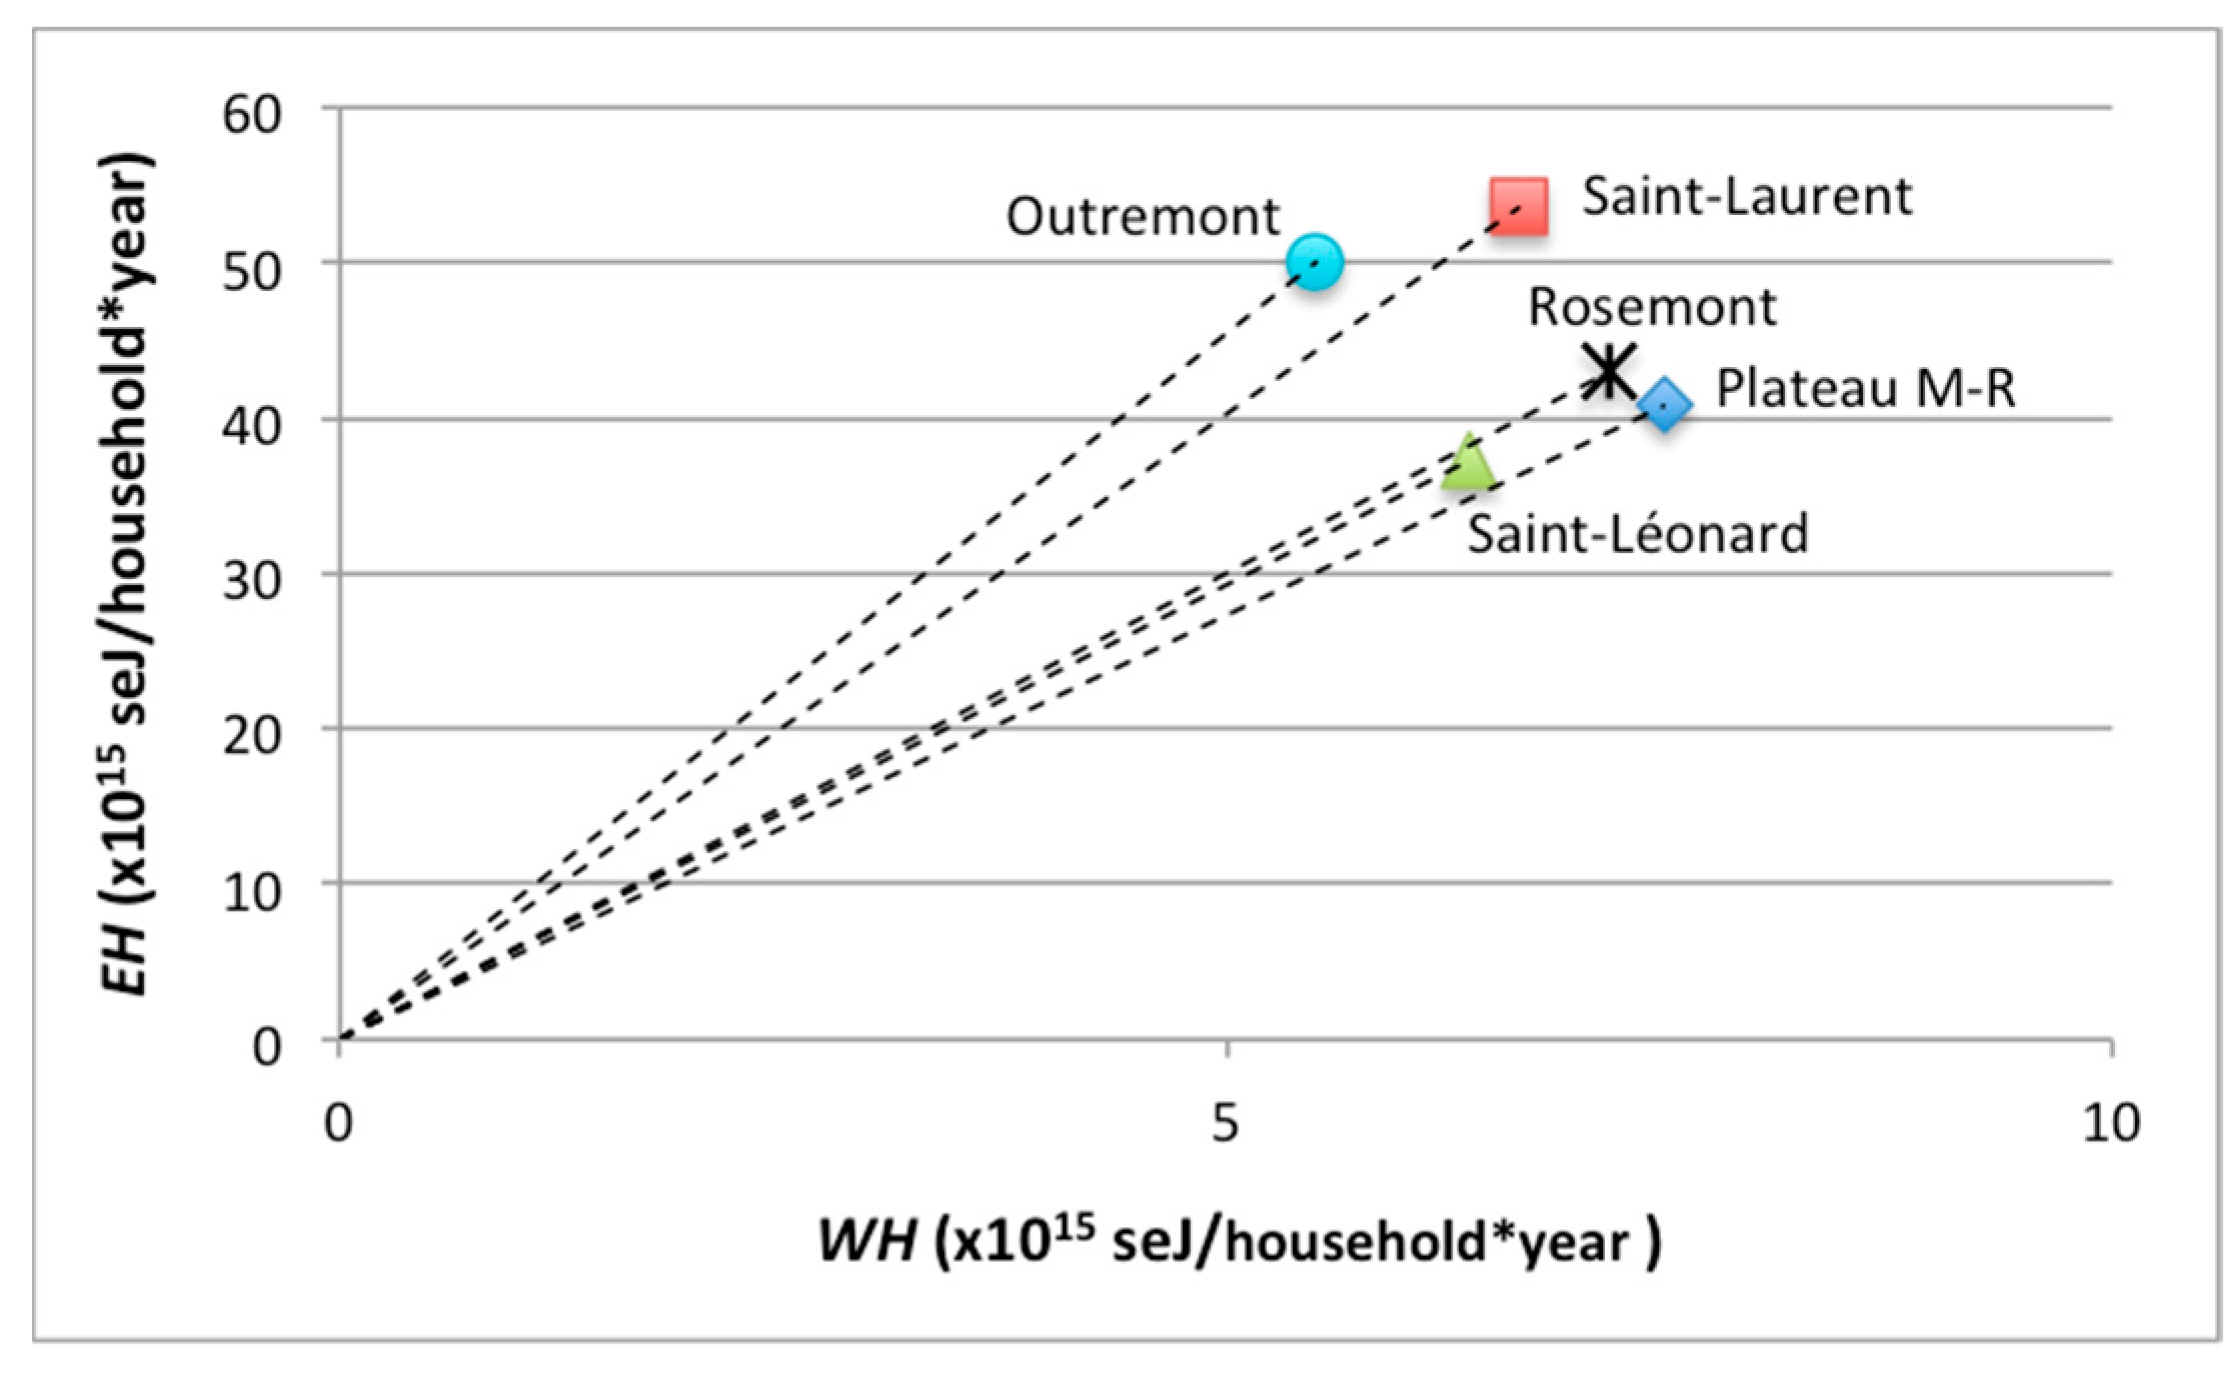
The general aim of the study was to evaluate the environmental work supporting day-by-day activities in housing units by means of the emergy synthesis method. As expected, total emergy used, and the associated total emergy-based ecological footprint, is a function of housing unit size both with respect to number of occupants and to built-up area.
For all the itemized flows analyzed (with the exception of wastes and building materials in the structure) the largest per dweller emergy utilizations were associated to the housing units with the highest income levels. Also, the highest emergy use per unit floor area was always related to the dwelling unit with the smallest per capita space availability, and the lowest emergy utilizations per square meter of habitable area corresponded to the units with the lowest net housing densities.
With regard to emergy from wastes, on a per capita basis, greater amounts generated coincided with lower per household incomes in the analyzed residential units. This trend was confirmed when the ratio of per household emergy from wastes to per household empower was examined; the best efficiencies were found for high-income housing units.
Although the contribution of the structural components of the analyzed buildings was no significant in terms of emergy utilization, it was found that concrete was the material with the highest emergy by square meter of constructed area, despite having an intermediate transformity (when compared to wood and steel). Notably, when concrete and steel were combined with wood, emergy from the structure decreased, confirming the suitability of using environmentally sound building materials.
The housing unit that exhibited the best emergy-based performance has the second highest per dweller habitable space, the second lowest lot coverage percentage, the lowest net housing density, a moderate income level and it was the only one presenting a variety of housing types. Results suggest that, from the variables considered, the most important ones affecting the intensity of emergy utilization are per household income, per capita habitable space and, to a lesser extent, distance to downtown. In the analyzed residential units, while access to a higher level of income increased per capita emergy in all cases, increasing the availability of space per occupant did not result in a decrease of empower density after 50 square meters per person. Thus, emergy-based indicators may be a useful help for the set up of housing unit design guidelines aiming at the compliance of building regulations (dwelling size and housing typology) and to serve as complementary criteria for zoning distribution in urban master plans (housing units allocation).
Lastly, it is necessary to investigate more case studies to support or reject the apparent trends found in this study, including housing units with lower and higher development densities than those considered here. Future research avenues should take into consideration analyses at the scale of blocks and urban planning unities (neighborhoods and urban zoning) and methodologies for the quantification of consumption and travel patterns at the individual level and overall neighborhood consumption patterns. Future work should also include, in greater detail, space availability, housing typology, income level, distance to work and commercial centers, access to urban amenities and infrastructure, different weather conditions, among other aspects.

Acknowledgments

The authors would like to thank the anonymous reviewers for their careful reading and for their constructive comments and suggestions to improve the quality of the paper.

Author Contributions

Ricardo Enrique Vega-Azamar held the emergy synthesis analysis and managed the data and drew the manuscript up. Rabindranarth Romero-López held the system dynamics analysis of the built environment and helped with the manuscript draft. Norma Angélica Oropeza-García contributed to the mass and energy balance and helped with the manuscript draft. Mathias Glaus held the life cycle energy analysis and revised the manuscript. Robert Hausler held the environmental information management and revised the manuscript. Herlinda del Socorro Silva-Poot reviewed the housing typologies and other urban planning parameters and helped with the manuscript draft. All of the authors contributed to the work in this manuscript.

Conflicts of Interest

The authors declare no conflict of interest.

References

  1. Cities and Climate Change: Global Report on Human Settlements, 1st ed. 2011. Available online: https://unhabitat.org/books/cities-and-climate-change-global-report-on-human-settlements-2011/ (accessed on 18 April 2017).
  2. Urbanization and Development. Emerging Futures. Available online: https://unhabitat.org/wp-content/uploads/2014/03/WCR-%20Full-Report-2016.pdf (accessed on 18 April 2017).
  3. State of World Cities 2008/2009, Harmonious Cities, 1st ed. Available online: https://unhabitat.org/books/state-of-the-worlds-cities-20082009-harmonious-cities-2/ (accessed on 18 April 2017).
  4. UNEP. Global Environmental Outlook 3 (Geo-3), 1st ed. Available online: http://www.grid.unep.ch/geo/geo3/ (accessed on 18 April 2017).
  5. Steemers, K. Energy and the city: Density, buildings and transport. Energy Build. 2003, 35, 3–14. [Google Scholar] [CrossRef]
  6. Chen, S.; Chen, B. Network environ perspective for urban metabolism and carbon emissions: A case study of Vienna, Austria. Environ. Sci. Technol. 2012, 46, 4498–4506. [Google Scholar] [CrossRef] [PubMed]
  7. Tukker, A.; Cohen, M.J.; Hubacek, K.; Mont, O. The impacts of household consumption and options for change. J. Ind. Ecol. 2010, 14, 13–30. [Google Scholar] [CrossRef]
  8. Newman, P.W.G.; Kenworthy, J.R. Gasoline consumption and cities. A comparison of U.S. Cities with a global survey. J. Am. Plan. Assoc. 1989, 55, 24–37. [Google Scholar] [CrossRef]
  9. Bramley, G.; Power, S. Urban form and social sustainability: The role of density and housing type. Environ. Plan. B Plan. Des. 2009, 36, 30–48. [Google Scholar] [CrossRef]
  10. Perkins, A.; Hamnett, S.P.; Zitto, R.; Trebilcock, D. Transport, housing and urban form: The life cycle energy consumption and emissions of city centre apartments compared with suburban dwellings. Urban Policy Res. 2009, 27, 377–396. [Google Scholar] [CrossRef]
  11. CMHC. Greenhouse Gas Emissions from Urban Travel: Tool For Evaluating Neighbourhood Sustainability; Canada Mortgage and Housing Corporation: Ottawa, ON, Canada, 2000; p. 61. [Google Scholar]
  12. Ramesh, T.; Prakash, R.; Shukla, K.K. Life cycle energy analysis of buildings: An overview. Energy Build. 2010, 42, 1592–1600. [Google Scholar] [CrossRef]
  13. Jones, R.V.; Fuertes, A.; Lomas, K.J. The socio-economic, dwelling and appliance related factors affecting electricity consumption in domestic buildings. Renew. Sustain. Energy Rev. 2015, 43, 901–917. [Google Scholar] [CrossRef]
  14. Decker, E.H.; Elliott, S.; Smith, F.A.; Blake, D.R.; Rowland, F.S. Energy and material flow through the urban ecosystem. Annu. Rev. Energy Environ. 2000, 25, 685–740. [Google Scholar] [CrossRef]
  15. Hendriks, C.; Obernosterer, R.; Müller, D.; Kytzia, S.; Baccini, P.; Brunner, P.H. Material flow analysis: A tool to support environmental policy decision making. Case studies on the city of Vienna and the Swiss lowlands. Local Environ. 2000, 5, 311–328. [Google Scholar] [CrossRef]
  16. Muñiz, I.; Galindo, A. Urban form and the ecological footprint of commuting. The case of Barcelona. Ecol. Econ. 2005, 55, 499–514. [Google Scholar] [CrossRef]
  17. Rees, W.; Wackernagel, M. Urban ecological footprints: Why cities cannot be sustainable—And why they are a key to sustainability. Environ. Impact Assess. Rev. 1996, 16, 223–248. [Google Scholar] [CrossRef]
  18. Norman, J.; MacLean, H.L.; Kennedy, C.A. Comparing high and low residential density: Life-cycle analysis of energy use and greenhouse gas emissions. J. Urban Plan. Dev. 2006, 132, 10–21. [Google Scholar] [CrossRef]
  19. Treolar, G.; Love, P.; Holt, G. Using national input-output data for embodied energy analysis of individual residential buildings. Constr. Manag. Econ. 2001, 19, 49–61. [Google Scholar] [CrossRef]
  20. Odum, H.T. Environmental Accounting: Emergy and Environmental Decision Making, 1st ed.; John Wiley: New York, NY, USA, 1996; p. 384. [Google Scholar]
  21. Ascione, M.; Bargigli, S.; Campanella, L.; Ulgiati, S. Exploring an urban system’s dependence on the environment as a source and a sink: The city of Rome (Italy) across space and time scales. ChemSusChem 2011, 4, 613–627. [Google Scholar] [CrossRef] [PubMed]
  22. Huang, S.-L. Urban ecosystems, energetic hierarchies, and ecological economics of Taipei metropolis. J. Environ. Manag. 1998, 52, 39–51. [Google Scholar] [CrossRef]
  23. Ascione, M.; Campanella, L.; Cherubini, F.; Ulgiati, S. Environmental driving forces of urban growth and development. An emergy-based assessment of the city of Rome, Italy. Landsc. Urban Plan. 2009, 93, 238–249. [Google Scholar] [CrossRef]
  24. Lei, K.; Wang, Z.; Ton, S. Holistic emergy analysis of Macao. Ecol. Eng. 2008, 32, 30–43. [Google Scholar] [CrossRef]
  25. Zhang, Y.; Yang, Z.; Liu, G.; Yu, X. Emergy analysis of the urban metabolism of Beijing. Ecol. Model. 2011, 222, 2377–2384. [Google Scholar] [CrossRef]
  26. Vega-Azamar, R.E.; Glaus, M.; Hausler, R.; Oropeza-García, N.A.; Romero-López, R. An emergy analysis for urban environmental sustainability assessment, the island of Montreal, Canada. Landsc. Urban Plan. 2013, 18, 18–28. [Google Scholar] [CrossRef]
  27. Brown, M.T.; Buranakarn, V. Emergy indices and ratios for sustainable material cycles and recycle options. Resour. Conserv. Recycl. 2003, 38, 1–22. [Google Scholar] [CrossRef]
  28. Pulselli, R.M.; Simoncini, E.; Pulselli, F.M.; Bastianoni, S. Emergy analysis of building manufacturing, maintenance and use: Em-building indices to evaluate housing sustainability. Energy Build. 2007, 39, 620–628. [Google Scholar] [CrossRef]
  29. Brown, M.T.; Vivas, B. Landscape development intensity index. Environ. Monit. Assess. 2005, 101, 289–309. [Google Scholar] [CrossRef] [PubMed]
  30. Hau, J.L.; Bakshi, B.R. Promise and problems of emergy analysis. Ecol. Model. 2004, 178, 215–225. [Google Scholar] [CrossRef]
  31. Reza, B.; Sadiq, R.; Hewage, K. Emergy-based life cycle assessment (Em-LCA) of multi-unit and single-family residential buildings in Canada. Int. J. Sustain. Built Environ. 2014, 3, 207–224. [Google Scholar] [CrossRef]
  32. Reza, B.; Sadiq, R.; Hewage, K. Emergy-based life cycle assessment (Em-LCA) for sustainability appraisal of infrastructure systems: A case study on paved roads. Clean Technol. Environ. Policy 2014, 16, 251–266. [Google Scholar] [CrossRef]
  33. Li, D.; Wang, R. Hybrid emergy-LCA (HEML) based metabolic evaluation of urban residential areas: The case of Beijing, China. Ecol. Complex. 2009, 6, 484–493. [Google Scholar] [CrossRef]
  34. Codoban, N.; Kennedy, C.A. Metabolism of neighborhoods. J. Urban Plan. Dev. 2008, 134, 21–31. [Google Scholar] [CrossRef]
  35. Pauleit, S.; Duhme, F. Assessing the environmental performance of land cover types for urban planning. Landsc. Urban Plan. 2000, 52, 1–20. [Google Scholar] [CrossRef]
  36. Luederitza, C.; Langa, D.J.; Von Wehrden, H. A systematic review of guiding principles for sustainable urban neighborhood development. Landsc. Urban Plan. 2013, 118, 40–52. [Google Scholar] [CrossRef]
  37. Kennedy, C.; Pincetl, S.; Bunje, P. The study of urban metabolism and its applications to urban planning and design. Environ. Pollut. 2011, 159, 1965–1973. [Google Scholar] [CrossRef] [PubMed]
  38. ISQ. Bulletin Statistique Régional Montréal, Édition 2015 (Montreal Regional Statistical Bulletin, 2015 Edition). Available online: http://www.stat.gouv.qc.ca/statistiques/profils/bulletins/2015/06-Montreal.pdf (accessed on 18 April 2017).
  39. City of Montreal. The Montreal Economy. Available online: http://www.montreal2025.com/decouvrir_economie.php?lang=en (accessed on 27 October 2011).
  40. Communauté Métropolitaine de Montréal. Les Forms D’habitat et la Planification des Densités Résidentielles (Housing Types and Planning of Residential Densities). Available online: http://projet.pmad.ca/fileadmin/user_upload/pmad2011/documentation/20110309_formesHabitat.pdf (accessed on 13 February 2012).
  41. Brown, M.T.; Ulgiati, S. Emergy analysis and environmental accounting. In Encyclopedia of Energy; Cleveland, C.J., Ed.; Elsevier Academic Press: Oxford, UK, 2004; pp. 329–354. [Google Scholar]
  42. Odum, H.T.; Brown, M.T.; Brandt-Williams, S.L. Handbook of Emergy Evaluation. Folio #1. Introduction and Global Budget. Available online: http://www.cep.ees.ufl.edu/emergy/documents/folios/Folio_01.pdf (accessed on 18 April 2017).
  43. Odum, H.T. Handbook of Emergy Evaluation. Folio #2. Emergy of Global Processes. 2000. Available online: http://www.cep.ees.ufl.edu/emergy/documents/folios/Folio_02.pdf (accessed on 18 April 2017).
  44. Brandt-Williams, S.L. Handbook of Emergy Evaluation. Folio #4. Emergy of Florida Agriculture. 2002. Available online: http://www.cep.ees.ufl.edu/emergy/documents/folios/Folio_04.pdf (accessed on 18 April 2017).
  45. Brown, M.T.; Bardi, E. Handbook of Emergy Evaluation. Folio #3. Emergy of Ecosystems. Available online: http://www.cep.ees.ufl.edu/emergy/documents/folios/Folio_03.pdf (accessed on 18 April 2017).
  46. Kangas, P.C. Handbook of Emergy Evaluation. Folio #5. Emergy of Landforms. Available online: http://www.cep.ees.ufl.edu/emergy/documents/folios/Folio_05.pdf (accessed on 18 April 2017).
  47. Buckley, M.; Halsall, R.; Vollering, B.; Webber, D. Considering Sustainability in the Selection of Structural Systems. Available online: http://livebuilding.queensu.ca/files/Considering%20Sustainability.pdf (accessed on 22 June 2012).
  48. Bastos, J.; Batterman, S.A.; Freire, F. Significance of mobiity in the life-cycle assessment of buildings. Build. Res. Inf. 2016, 44, 376–393. [Google Scholar] [CrossRef]
  49. Campbell, D.E.; Brandt-Williams, S.L.; Meisch, M.E.A. Environmental Accounting Using Emergy: Evaluation of the State of West Virginia. Available online: http://www.epa.gov/nheerl/publications/files/wvevaluationposted.pdf (accessed on 26 September 2010).
  50. Brown, M.T.; Ulgiati, S. Emergy-based indices and ratios to evaluate sustainability: Monitoring economies and technology towards environmentally sound innovation. Ecol. Eng. 1997, 9, 51–69. [Google Scholar] [CrossRef]
  51. Huang, S.-L.; Chen, C.W. Theory of urban energetics and mechanisms of urban development. Ecol. Model. 2005, 189, 49–71. [Google Scholar] [CrossRef]
  52. Pulselli, R.M. Integrating emergy evaluation and geographic information systems for monitoring resource use in the Abruzzo region (Italy). J. Environ. Manag. 2010, 91, 2349–2357. [Google Scholar] [CrossRef] [PubMed]
  53. Bastianoni, S.; Marchettini, N.; Niccolucci, V.; Pulselli, F.M. Environmental accounting for the lagoon of Venice and the case of fishing. Ann. Chim. 2005, 95, 143–152. [Google Scholar] [CrossRef]
  54. Bastianoni, S.; Campbell, D.E.; Ridolfi, R.; Pulselli, F.M. The solar transformity of petroleum fuels. Ecol. Model. 2009, 220, 238–249. [Google Scholar] [CrossRef]
  55. Brown, M.T.; Ulgiati, S. Emergy evaluations and environmental loading of electricity production systems. J. Clean. Prod. 2002, 10, 321–334. [Google Scholar] [CrossRef]
  56. Castellini, C.; Bastianoni, S.; Grani, C.; Dal Bisco, A.; Brunetti, M. Sustainability of poultry production using the emergy approach: Comparison of conventional and organic rearing systems. Agric. Ecosyst. Environ. 2006, 114, 343–350. [Google Scholar] [CrossRef]
  57. Brown, M.T.; Ulgiati, S. Energy quality, emergy and transformity: H.T. Odum’s contributions to quantifying and understanding systems. Ecol. Eng. 2004, 178, 201–213. [Google Scholar] [CrossRef]
  58. Le Corre, O. Emergy, 1st ed.; ISTE Press-Elsevier: Oxford, UK, 2016; p. 178. [Google Scholar]
  59. Leloup, X.; Séraphin, I. Étude Post Occupation de Projets Résidentiels Pour Familles en Milieu Urbain Dense (Post Occupancy Study of Residential Projects for Families in Dense Urban Environment), 1st ed.; INRS Institut National de la Recherche Scientifique: Montreal, QC, Canada, 2009; p. 120. [Google Scholar]
  60. Canada, S. Consumer Price Indexes, Historical Summary. Available online: http://www.statcan.gc.ca/tables-tableaux/sum-som/l01/cst01/econ46a-eng.htm (accessed on 12 July 2012).
  61. National Aeronautics and Space Administration. Insolation levels. Surface meteorology and solar energy data set. In Proceedings of the Rise and Shine 2000, the 26th Annual Conference of the Solar Energy Society of Canada Inc. and Solar, Halifax, NS, Canada, 21–24 October 2000. [Google Scholar]
  62. Canada, E. Canadian Climate Normals or Averages 1971–2000. Montreal Trudeau International Airport Station. Available online: http://climate.weatheroffice.gc.ca/climate_normals/results_e.html?stnID=5415&lang=e&dCode=1&StationName=MONTREAL&SearchType=Contains&province=ALL&provBut=&month1=0&month2=12 (accessed on 22 November 2011).
  63. Davies, J.H.; Davies, D.R. Earth’s surface heat. Solid Earth 2010, 1, 15–24. [Google Scholar] [CrossRef]
  64. Canada, S. Food Statistics 2008; Statistics Canada: Ottawa, ON, Canada, 2009; p. 44. [Google Scholar]
  65. Montreal, C. Profils des 58 Districts Électoraux de la Ville de Montréal, Édition 2009 (City of Montreal’s 58 Electoral Districts Profiles, 2009 Edition). Available online: https://ville.montreal.qc.ca/pls/portal/docs/PAGE/MTL_STATS_FR/MEDIA/DOCUMENTS/58%20DISTRICTS%20%C9LECTORAUX_2009.PDF (accessed on 18 April 2017).
  66. City of Montreal. Profils Économiques des Arrondissements. Montréal en Statistiques. Par Territoire. Arrondissements de Montréal. (Economic Profiles of Boroughs. Montreal in Statisics. By Territory. Montreal’s Boroughs). Available online: http://ville.montreal.qc.ca/portal/page?_pageid=6897,67845597&_dad=portal&_schema=PORTAL (accessed on 4 May 2012).
  67. City of Montreal. Eau Potable Traitée, Agglomération de Montréal, Moyenne Annuelle (Treated Drinking Water, Agglomeration of Montreal, Annual Average). Available online: http://ville.montreal.qc.ca/portal/page?_pageid=6897,67889708&_dad=portal&_schema=PORTAL (accessed on 29 March 2011). (In French).
  68. CMHC. Analysis of the annual energy and water consumption of apartment buildings in the cmhc histar database. CMHC’s Tech. Ser. Res. Highlights 2001, 142, 1–4. [Google Scholar]
  69. CWC. Energy and the environment in residential construction. Canadian Wood Council. Sustain. Build. Ser. No 2004, 1, 15. [Google Scholar]
  70. Baouendi, R.; Zmeureanu, R.; Bradley, B. Energy and emission estimator: A prototype tool for designing canadian houses. J. Archit. Eng. 2005, 11, 50–59. [Google Scholar] [CrossRef]
  71. Canada, S. Households and the Environment: Energy Use 2007; Statistics Canada: Ottawa, ON, Canada, 2010; p. 39. [Google Scholar]
  72. Liu, R. Energy Consumption and Energy Intensity in Multi-Unit Residential Buildings in Canada. Available online: http://www.cbeedac.com/publications/documents/MURBsrp04.pdf (accessed on 12 March 2012).
  73. Agence Métropolitaine de Transport. Mobilité des Personnes dans la Région de Montréal Enquête Origine-Destination 2008. (Mobility of people in the Montreal area origin-destination survey 2008; data processing: R.E Vega-Azamar). Available online: https://www.amt.qc.ca/Media/Default/pdf/section8/mobilite-des-personnes-dans-la-region-de-montreal.pdf (accessed on 26 January 2015).
  74. NRC-OEE. Fuel Consumption Guide 2008; Natural Resources Canada: Ottawa, ON, Canada, 2007; p. 65. [Google Scholar]
  75. Páez, A.; Mercado, R.G.; Farber, S.; Morency, C.; Roorda, M. Accessibility to health care facilities in Montreal island: An application of relative accessibility indicators from the perspective of senior and non-senior residents. Int. J. Health Geogr. 2010, 9, 1–9. [Google Scholar] [CrossRef] [PubMed]
  76. Bonenfant, R.R.J. How to Estimate the Cost of Structural Steel. American Society of Professional Estimators’ Technical Paper. Estimating Today. January 2009. Available online: http://www.aspenational.org/userfiles/file/Technical%20Papers/2009/TechPaper_January2009.pdf (accessed on 5 June 2012).
  77. Farnsworth, E. How to Estimate the Cost of a Timber Framed Structure. American Society of Professional Estimators. Technical Paper. Estimating Today. December 2010. Available online: http://www.aspenational.org/userfiles/file/Technical%20Papers/2010/ET-2010December-TechPaper.pdf (accessed on 3 July 2012).
  78. Nocus, S.F. How to Estimate the Cost of Load Bearing Wood Framed Walls. American Society of Professional Estimators’ Technical Paper. Estimating Today. April 2009. Available online: http://www.aspenational.org/userfiles/file/Technical%20Papers/2009/TechPaper_April2009.pdf (accessed on 3 July 2012).
  79. Schlesier, B.E. How to Estimate the Cost of Concrete Construction. American Society of Professional Estimators’ Technical Paper. Estimating Today. March 2010. Available online: http://www.aspenational.org/userfiles/file/Technical%20Papers/2010/TechPaper_March2010.pdf (accessed on 3 July 2012).
  80. City of Montreal. Portrait 2010 des Matiéres Résiduelles de L’agglomération de Montréal (2010 Portrait of Municipal Solid Wastes of the Agglomeration of Montreal). Available online: http://ville.montreal.qc.ca/pls/portal/docs/PAGE/ENVIRO_FR/MEDIA/DOCUMENTS/PORTRAIT_MATIERES_RESIDUELLES2010.PDF (accessed on 28 September 2012). (In French).
  81. Purenne, P. Rapport Annuel 2008. Analyse de la Qualité des Eaux Brutes et de L’eau Traitée à la Station D’épuration et Évaluation du Rendement des Installations (Annual Report 2008. ANALYSIS of the Quality of Raw and Treated Water at the Treatment Plant and Evaluation of the Facilities’ Performance). Available online: http://ville.montreal.qc.ca/pls/portal/docs/PAGE/EAU_FR/MEDIA/DOCUMENTS/AN08STAF.PDF (accessed on 6 April 2011). (In French).
  82. Vega-Azamar, R.E.; Romero-López, R.; Glaus, M.; Oropeza-García, N.A.; Hausler, R. Sustainability assessment of the residential land use in seven boroughs of the island of Montreal, Canada. Sustainability 2015, 7, 2454–2472. [Google Scholar] [CrossRef]
  83. Brown, M.T.; Ulgiati, S. Emergy measures of carrying capacity to evaluate economic investments. Popul. Environ. 2001, 22, 471–501. [Google Scholar] [CrossRef]
  84. Cai, Z.F.; Zhang, L.X.; Zhang, B.; Chen, Z.M. Emergy-based analysis of Beijing-Tianjin-Tangshan region in China. Commun. Nonlinear Sci. Numer. Simul. 2009, 14, 4319–4331. [Google Scholar] [CrossRef]
Figure 1. Diagram of the flows considered in the selected housing units.
Sustainability 09 00663 g001
Figure 2. Emergy requirements of the five residential units: (a) on a per capita basis, and (b) per square meter of habitable space. F&W: food and water; E&F: electricity and fuels; BM: building materials in the structure; G&S: basic goods and services acquired; W: wastes.
Sustainability 09 00663 g002
Figure 3. Emergy from dwellings operation and from dwellers transport: (a) on a per capita basis, and (b) by square meter of habitable area.
Sustainability 09 00663 g003
Figure 4. (a) Per household income (USD/year), emergy use per dweller (×1012 seJ/household·year) and per dweller emergy (×1012 seJ/person·year), and (b) Per capita available space (m2/person) and empower density of the habitable space (×1013 seJ/m2·year).
Sustainability 09 00663 g004
Figure 5. Environmental loading ratio (×102, dimensionless), emergy to money ratio (×1010 seJ/USD·year) and per dweller support area (m2/person) for the five residential units.
Sustainability 09 00663 g005
Figure 6. Per household empower per household and per household emergy from wastes.
Sustainability 09 00663 g006
Table 1. Emergy synthesis of the analyzed flows in the housing units (Outremont’s case).
ItemQuantityUnitTransformity (seJ/J, g, $)References (Transformity)Emergy (seJ/Year)
Renewable resources (R)
1Solar radiation5.96 × 1 012J/year1.00[20]5.96 × 1012
2Wind4.80 × 1010J/year2.45 × 103[43]3.92 × 10¹³
3Rain (evapotranspiration)2.54 × 10⁹J/year3.10 × 104[43]2.88 × 10¹³
4Surface heat flux1.91 × 109J/year1.07 × 104After [43]2.04 × 10¹³
Local non-renewables resources (N)
5Topsoil loss1.13 × 104g/year2.29 × 109[43,51]2.59 × 10¹³
Purchased resources (F)
6Cereals4.63 × 106g/year9.82 × 108[20,52]4.55 × 10¹⁵
7Fruits4.14 × 106g/year1.23 × 109[20,52]5.08 × 10¹⁵
8Vegetables7.98 × 106g/year5.96 × 109[20,44]4.75 × 10¹⁶
9Meat4.87 × 106g/year3.17 × 1010[44,53]1.54 × 10¹⁷
10Fish4.84 × 105g/year1.53 × 1011[20,53]7.38 × 10¹⁶
11Milk and other diaries6.90 × 106g/year2.41 × 1010[20,44]1.66 × 10¹⁷
12Eggs5.46 × 105g/year1.07 × 1011[44]5.84 × 10¹⁶
13Sugars and syrups1.74 × 106g/year1.55 × 108[41,44]2.70 × 10¹⁴
14Potable water8.26 × 109g/year3.00 × 106[52]2.48 × 10¹⁶
15Natural gas1.88 × 1012J/year4.00 × 104[54]7.52 × 10¹⁶
16Electricity4.70 × 1011J/year6.23 × 104[55]2.93 × 10¹⁶
17Gasoline8.89 × 106g/year2.92 × 109[54]2.59 × 10¹⁶
18Diesel8.89 × 105g/year2.83 × 109[54]2.52 × 10¹⁵
19Electricity (transport)1.01 × 10¹⁰J/year6.23 × 104[55]6.30 × 10¹⁴
20aBuilding structure (steel)2.54 × 10⁶g/year3.27 × 109[23,49]8.32 × 10¹⁵
20bBuilding structure (wood)3.27 × 1 06g/year6.48 × 108[49,56]2.12 × 10¹⁵
21Basic costumer items (spending)3.05 × 10⁵$/year1.54 × 1012[26]4.71 × 10¹⁷
Wastes (W)
22Municipal solid wastes5.81 × 1010J/year1.80 × 106[51]1.05 × 10¹⁷
23Wastewater3.31 × 1010J/year6.66 × 105[51]2.20 × 10¹⁶
Table 2. Emergy-based indicators calculated for the case studies.
IndicatorCalculationUnitIndication
Per capita emergy (Ucap)U/number of residents in the residential unitseJ/person·yearStandard of living
Empower per household (EH)U/number of dwellings in the residential unitseJ/household·yearLiving quality
Empower density of the habitable area (EDHab)U/total habitable area in the residential unit’s dwellingsseJ/m2·yearIntensity of resource utilization
Emergy to money ratio (EMR)U/total income of the residential unitseJ/USDEcological economic efficiency
Environmental loading ratio (ELR)[N + F]/R-Balance non-renewable to renewable resources
Per capita support area (SAcap)([N + F]/[ELR × (R/area)]Montreal)/number of residents in the residential unitm2/personEmergy-based ecological footprint
Per household emergy of wastes (WH)W/number of dwellings in the residential unitseJ/household·yearEnvironmental loading
Table 3. Main features of the housing units.
CaseNet Density (dw/ha)Year of OccupationNumber of DwellingsNumber of ResidentsStructure’s MaterialDistance to DT (km)
Rosemont851997–2000217510Concrete/Wood7.0
Outremont17120012348Steel/Wood4.9
Plateau M-R18020063689Wood2.3
Saint-Laurent271200783208Concrete7.7
Saint-Léonard32320054794Concrete7.9
Table 4. Housing typologies of the residential units.
CaseHousing TypologyNumber of BedroomsAvg. Habitable Area (m2/dw)Avg. Occupants Per Dwelling
RosemontLow-rise apartment buildings, side attached houses and triplexes1 to 6114.02.35
OutremontSide attached small houses, low-rise big apartment buildings1 to 6116.12.10
Plateau M-RLow-rise apartment buildings1 to 484.52.50
Saint-LaurentMid-rise apartment buildings1 to 459.12.50
Saint-LeonardMid-rise apartment buildings1 to 558.52.00
Table 5. Data processing.
ItemProcessingReferences
Natural resourcesLong period averages[61,62,63]
FoodPer capita averages for Canadian cities adjusted by food spending and per household income in electoral districts[64,65,66]
WaterPer capita treated drinking water adjusted by consumption by house type[67,68]
Energy from dwelling operationsEnergy consumption by house type[69,70,71,72]
Energy from transportCalculated from the metropolitan survey of people’s mobility[34,73,74,75]
Building materials in the structureMaterials take-off estimation[76,77,78,79]
Basic consumer itemsHousehold expenditure in boroughs adjusted by electoral districts’ per household income[65,66]
Municipal solid wastesPer capita generation of municipal solid wastes in boroughs[80]
WastewaterTreated wastewater adjusted by water consumption estimated for the units[67,68,81]
Table 6. Total emergy used (U) and emergy flows (as % of U) in the housing units.
CaseU (×1018 seJ/Year)Renewable (R)Non-Renew (N)Purchased (F)Wastes (W)
Rosemont9.3080.0171%0.0053%99.98%16.70%
Outremont1.1500.0034%0.0023%99.99%11.01%
Plateau M-R1.4670.0070%0.0026%99.99%18.33%
Saint-Laurent4.4430.0035%0.0013%99.99%12.42%
Saint-Leonard1.7530.0061%0.0016%99.99%17.10%
Table 7. Emergy indicators estimated for the housing units.
Housing UnitUcapEHEDHabEMRELRSAcapWH
Rosemont1.83 × 10164.29 × 10163.76 × 10141.07 × 1012586481.587.16 × 1015
Outremont2.40 × 10165.00 × 10164.31 × 10146.48 × 101129321107.135.51 × 1015
Plateau M-R1.65 × 10164.07 × 10164.82 × 10141.03 × 10121431773.687.47 × 1015
Saint-Laurent2.14 × 10165.35 × 10169.06 × 10148.75 × 10112891395.496.65 × 1015
Saint-Leonard1.87 × 10163.73 × 10166.38 × 10149.03 × 10111643183.396.38 × 1015

