
EH-GC: An Efficient and Secure Architecture of Energy Harvesting Green Cloud Infrastructure


Department of Computer Science and Engineering, Seoul National University of Science and Technology, (SeoulTech) Seoul 01811, Korea
*
Author to whom correspondence should be addressed.
Sustainability 2017, 9(4), 673; https://doi.org/10.3390/su9040673
Submission received: 7 April 2017
/
Revised: 19 April 2017
/
Accepted: 21 April 2017
/
Published: 24 April 2017
(This article belongs to the Collection Advanced IT based Future Sustainable Computing)
Abstract
:Nowadays, the high power consumption of data centers is the biggest challenge to making cloud computing greener. Many researchers are still seeking effective solutions to reduce or harvest the energy produced at data centers. To address this challenge, we propose a green cloud infrastructure which provides security and efficiency based on energy harvesting (EH-GC). The EH-GC is basically focused on harvesting the heat energy produced by data centers in the Infrastructure-as-a-Service (IaaS) infrastructure. A pyroelectric material is used to generate the electric current from heat using the Olsen cycle. In order to achieve efficient green cloud computing, the architecture utilizes a genetic algorithm for proper virtual machine allocation, taking into consideration less Service Level Agreement (SLA) violations. The architecture utilizes Multivariate Correlation Analysis (MCA) correlation analysis based on a triangular map area generation to detect Denial of Service (DoS) attacks in the data center layer of the IaaS. Finally, the experimental analysis is explained based on the energy parameter, which proves that our model is efficient and secure, and that it efficiently reuses the energy emitted from the data center.
1. Introduction
In line with the growth of high-speed networks in recent decades, there has been an alarming increase in their use, leading to the generation of thousands of simultaneous E-commerce transactions and millions of web requests every day. This constantly expanding use is dealt with by large-scale data centers, which integrate many servers with other infrastructures, for example, networking, storage, and cooling systems. Many giant companies around the world, such as Yahoo ( Sunnyvale, CA, USA), eBay ( San Jose, CA, USA), Amazon ( Seattle, WA, USA), Microsoft (Albuquerque, NM, USA), and Google (Menlo Park, CA, USA) operate such data centers.
Artificial intelligence is a type of technology with the potential to improve the existing cloud platform. Over the last few years, there has been a tremendous amount of investment in the artificial intelligence capabilities of the cloud computing platform, with the aim of making it greener. The rise in cloud computing has quickly led to the adoption of a subscriber-based approach by giving access to on-demand and scalable infrastructure services. Clients can store, access, and share any measure of data in Cloud [1]. In other words, small and medium-sized enterprises and organizations do not need to worry about acquiring, designing, managing, and maintaining their own IT infrastructure. Instead, they can concentrate on honing their core skills by leveraging a number of cloud computing advantages, for example, speedier and less expensive software development capabilities at a lower cost, and on-demand computing resources. Additionally, cloud computing also delivers a tremendous amount of computing power to organizations that need to process the huge volume of data generated almost every day.
Cloud computing provides efficient and convenient services to consumers, with flexibility and availability. However, there are too many challenges and issues related to the utilization and security aspects of cloud computing [1]. In addition, the expansion of cloud services has led to the creation of geographically distributed data centers with millions of servers. Major cloud service providers devour many megawatts of power to operate such data centers, with the related annual power bills amounting to millions of dollars. According to current trend estimates, the United States’ data centers alone are expected to consume about 73 billion kWh per year by 2020 [2]. In fact, all the data centers around the world devour more power than most countries in the world, except for four countries [3]. However, this massive energy consumption results not only in high electricity costs, but also in high carbon emissions. In the United States, 1 kWh of power discharges around 500 g of CO2 [4].
The most common energy sources of carbon emission rates are shown in [3,4]. Here, we note that renewable energy sources have a significantly lower carbon emission rate than fossil fuels such as oil, gas, and coal. Large IT companies began building data centers on renewable energy, such as Facebook’s solar data center in Oregon and Green House Data’s wind-powered data center in Wyoming. In April 2012, Greenpeace released a report which raised the question of how to clean the Cloud [5]. They examined data centers built by major Internet companies and classified them according to the efficiency of the cloud installations and their electricity sources. There have been many commercial enterprises and academic efforts to reduce the carbon footprint and energy costs by applying more energy-efficient computing techniques and more effective energy cooling and distribution systems. However, only energy efficiency will stem the progress of the IT carbon footprint. To maintain worldwide greenhouse gas emissions at a safe level, renewable energy sources are becoming a prioritized choice for IT organizations seeking to power their rapidly growing data center infrastructures.
Issues related to cloud security are relevant to the various stakeholders as follows; decision-making on cloud adoption [6], resource management and service quality delivery [7,8], Distributed Denial of Service (DDoS) attacks [9,10,11], fatal attacks [12], machine learning-based cloud security [13], Threat and Risk Management (TRM) schemes [14], an integrated cloud incident handling and forensics model [15], a cross tenant access control model [16], and so on.
In this paper, we propose a novel EH-GC architecture based on the energy harvesting from renewable resources and the efficient allocation of Virtual Machines (VMs) in the data center to achieve green cloud computing. The architecture is capable of harvesting the waste energy generated within a data center. Moreover, to protect the datacenter against a DoS attack, the architecture uses MCA correlation analysis.
The rest of this paper is composed as follows; In Section 2, we discuss related works—requirements for green cloud computing, electric conversion, and the MCA technique. Section 3 presents our proposed EH-GC, including an EH-GC architecture overview, pyroelectric energy harvesting, a genetic algorithm for VM allocation, and DoS detection in the data center network. In Section 4, we discuss the performance evaluation and experimental results for our proposed EH-GC. Finally, we summarize and conclude our research in Section 5.
2. Related Works
2.1. Requirements for Green Cloud Computing
Cutting-edge data centers working within the Cloud computing model are facilitating diverse applications ranging from those that run for just a few moments, to those that continue running for much longer timeframes on shared hardware platforms. The need to deal with various applications in a data center creates the challenge of provisioning and allocating on-demand resources in response to varying workloads over time. Datacenter resources are statically allocated to applications, in light of their advanced features, to provide performance guarantees and to maintain isolation. Until recently, high performance was the only concern regarding data center deployment, and this demand was met without paying much attention to energy consumption. However, data centers are costly to maintain, as well as being hostile to the environment. They generate enormous carbon footprints and high energy costs because of the enormous amount of electricity needed to cool and power the numerous servers facilitated by them. Due to these high energy costs, cloud service providers must take steps to guarantee that their overall revenue is not significantly diminished.
Reducing the energy consumption of data centers is a complex and challenging problem as data and computing applications are growing so fast that larger servers and disks are needed to process them quickly enough. Green computing is designed to ensure not only the use and efficient processing of the computing infrastructure, but also to reduce energy consumption. To ensure the sustainability of the future growth of cloud computing, green computing is very important. Otherwise, cloud computing with more invasive front-end client devices that interact with back-end data centers will cause a huge escalation in energy consumption. To deal with this issue, while driving green cloud computing, data center resources must be designated in an energy-efficient manner. Specifically, Cloud assets must not be exclusively designated to fulfill the QoS requirements determined by the clients using Service Level Agreements (SLAs), but also to diminish power consumption [17,18,19,20].
2.2. Pyroelectric Energy Conversion
Waste heat is an essential by-product of all the thermodynamic cycles used in a heat pump, refrigeration, and power systems. The need to develop more energy-efficient engineering models has led to particular attention on waste heat devices [21]. The small efficiencies of Carnot have hampered the development of such devices. Stirling engines and Organic Rankine cycles have been used to convert waste heat into mechanical work. Notably, Stirling engines have been used for applications such as air liquefaction, cryogenic refrigeration, and heat pumps. In addition, thermoelectric devices use the Seebeck effect to directly convert a stationary temperature difference at the junction of two dissimilar semiconductors or metals into electrical energy. On the other hand, pyroelectric energy converters directly convert heat energy into electricity using temperature versus time oscillations combined with a cycle, as shown in the electric field of motion diagram [22].
The harvesting of pyroelectric energy is one possible way toward producing a voltage by cooling or heating pyroelectric materials. These materials do not require a temperature gradient similar to a thermocouple. Rather, they require temperature changes that vary over time. These changes in temperature alter the areas of the particles in the crystal structure of the pyroelectric material, which produces the voltage. To continue producing electricity, the entire crystal must be continuously subjected to temperature changes. Otherwise, due to the leakage current, the produced pyroelectric voltage gradually disappears [23]. Pyroelectric energy harvesting offers a greater effectiveness compared to thermoelectric harvesting. Furthermore, it is much simpler to achieve by utilizing a restricted surface heat exchange and by proposing harvesting with high-temperature sources [24,25].
2.3. Multi-Variate Corrélation Analysis Technique
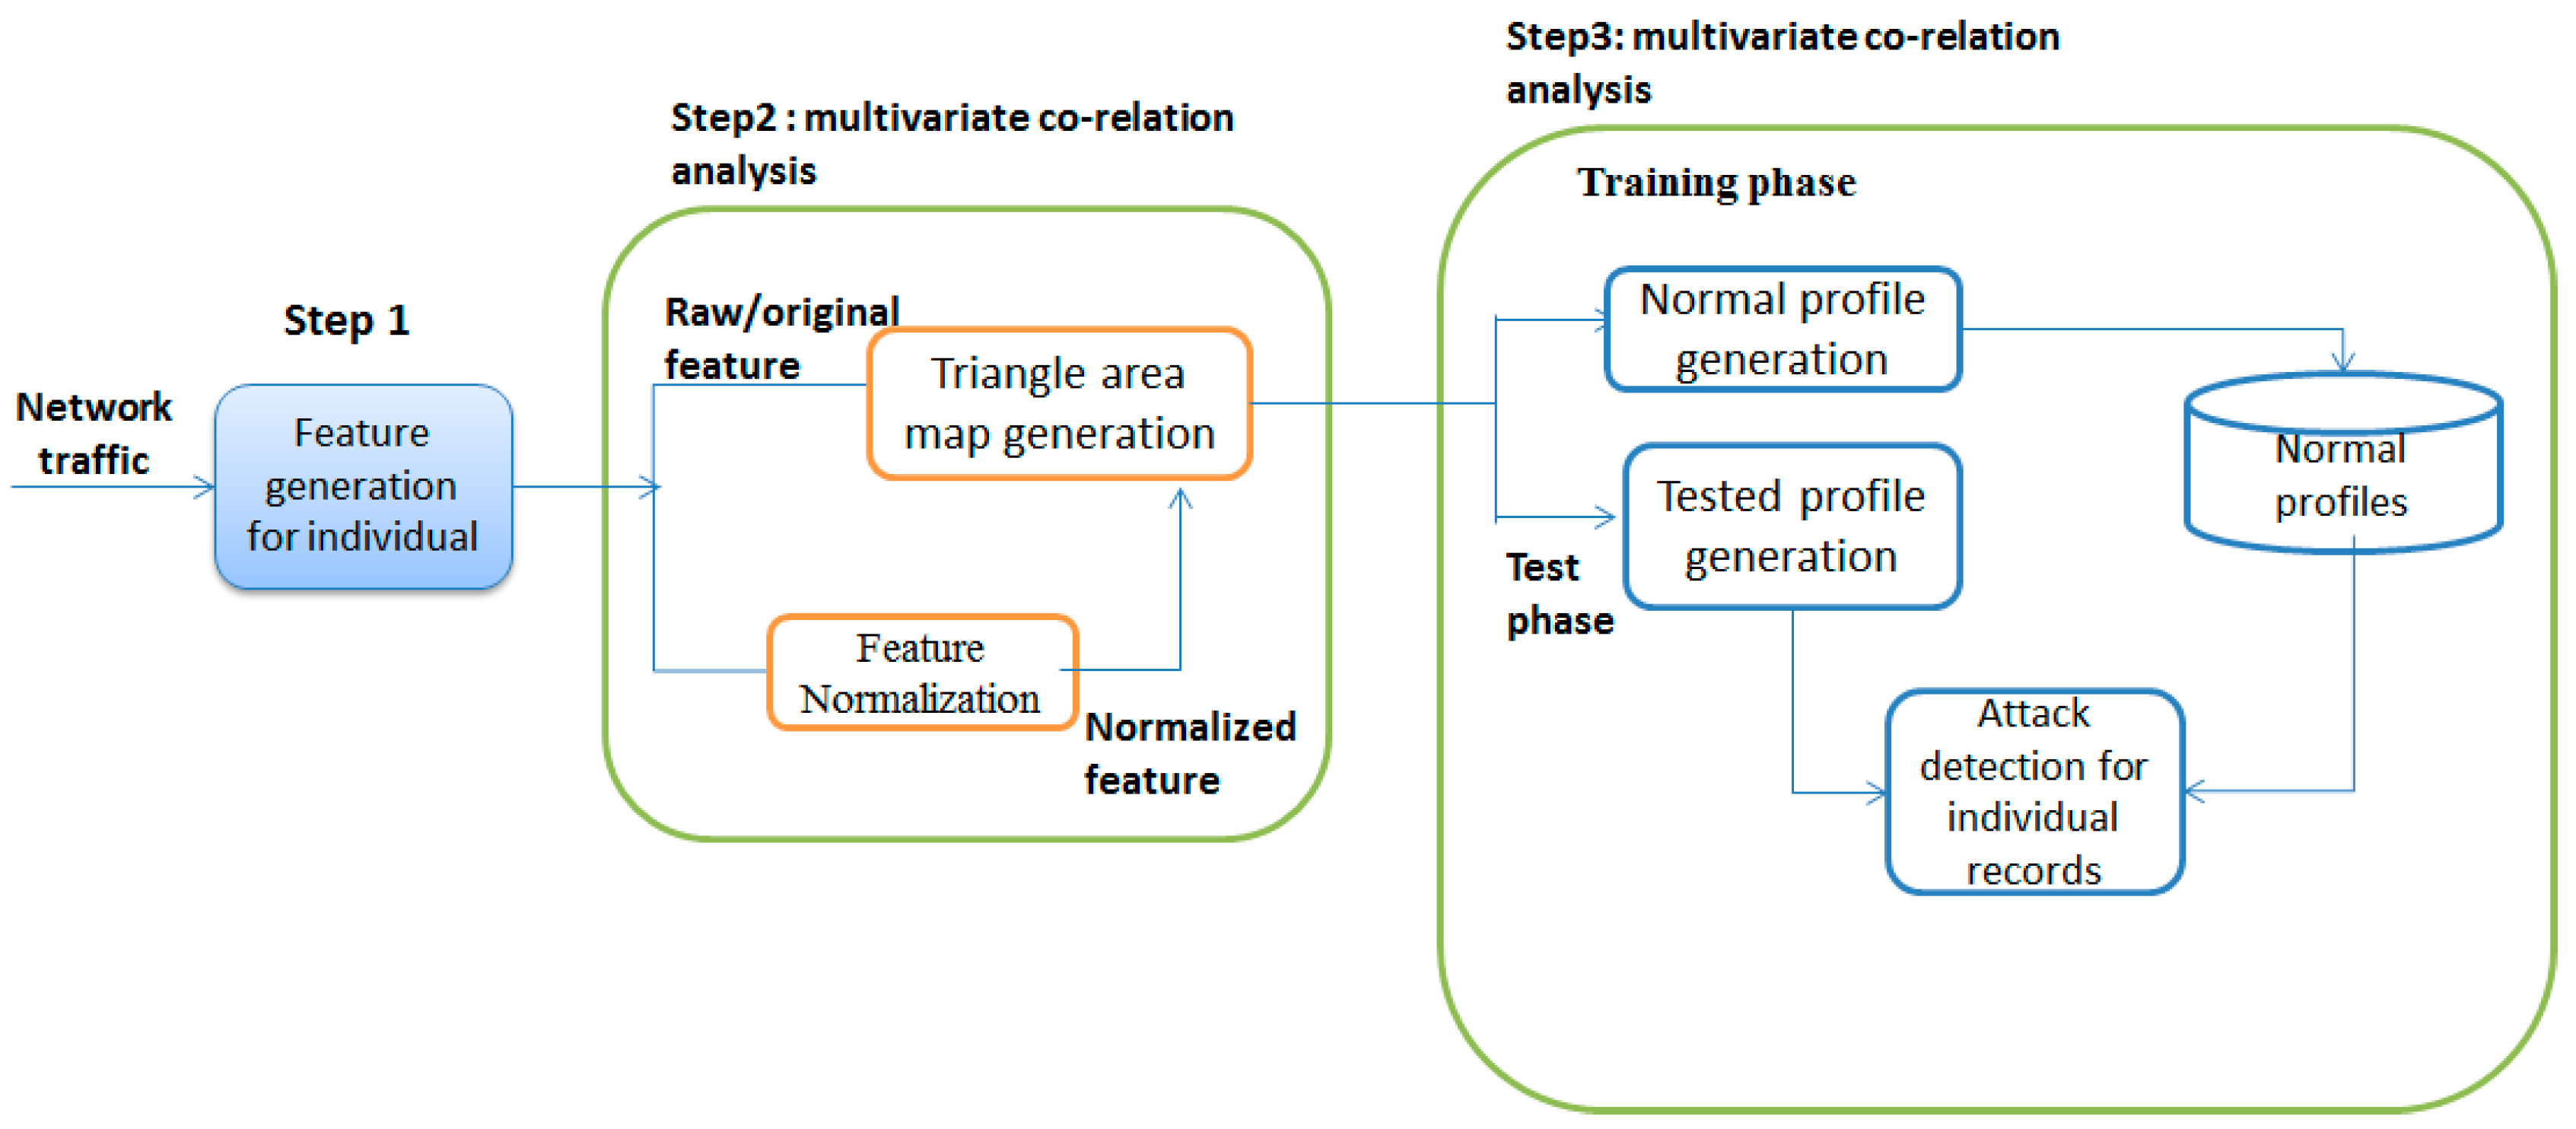
MCA, which plays a major role in the field of data analysis, is an artificial intelligence-based feature extraction technique for original and legitimate data. MCA is used for the characterization of accurate network traffic by extracting the geometrical correlations between network traffic features. As shown in Figure 1, the detection process consists of three major steps:
- Step 1:
- Basic features are generated in a well-defined time interval.
- Step 2:
- MCA incorporates a multivariate correlation investigation, in which triangle area map generation is connected to separate the relationships between two particular features inside every movement case originating from the initial step.
- Step 3:
- MCA contains the decision-making based on the training and testing phase.
The concept of the multivariate correlation analysis approach is incorporated into the co-relation investigation to characterize the network traffic instances and to convert them into the respective images [26].
2.4. Existing Researches
Kartyik et al. addressed the problem of VM consolidations in the large data center of IaaS [27]. The authors tackled the problem of energy consumption in the data center. They used the Bin completion technique to handle the energy consumption problem. Bin completion is an artificial intelligence-based algorithm for the bin packing problem. In this paper, the authors utilized the machine learning algorithm for CPU utilization and for investigating its effect on energy consumption and SLA violations.
Si-Yuan Jing et al.’s research [28] discussed the challenges and issues related to security, QoS, and power consumption in cloud computing. The paper studied a state-of-the-art technique for power saving in IaaS, in order to achieve green cloud computing. The authors proposed a feasible solution for better energy management in IaaS infrastructure for building green cloud computing.
Anton Beloglazov et al. proposed an energy-aware resource algorithm to minimize the operational cost of resource allocation in the data center for cloud computing. The authors also surveyed research papers based on energy efficient computing and proposed a principle for energy efficient management, energy efficient resource allocation, and a scheduling algorithm considering QoS expectations [29].
Yashi Goyal et al.’s research [30] concerned the high energy consumption and CO2 emissions in large data centers and surveyed various techniques to reduce the energy consumption. The authors proposed an energy efficient hybrid technique for selecting VMs with a low utilization host policy algorithm to meet the energy efficiency requirement. The authors also considered the SLA violations.
Jiachen Yang et al. established a simplified task algorithm for energy management in cloud computing. The simplified model was based on game theory as a mathematical tool. The paper focused on the following points; establishes a mathematical model to calculate the stability of computing nodes; establishes a cooperative game model for the task scheduling of cloud computing using game theory; and discusses the problem of task scheduling in cloud computing, which is modeled as a multi-stage sequential game model [31].
Yee-Yang Teing et al.’s research [32] surveyed a cloud-enabled big data storage solution and introduced the collection, analysis, challenges in identification, and archiving of digital evidence. The authors focused on reducing the investigation time and resources involved in a real time investigation of the user’s activities on a cloud-enabled big data platform. The authors tried to judge the data wreckage of forensic value from a Syncany private cloud storage service, which was a general record engine for a large data platform.
Opeyemi Osanaiye et al. discussed the widespread adoption of cloud computing that has attracted cyber criminals. The authors focused on DDoS attacks targeting cloud resources, services, and bandwidths. The authors proposed an ensemble-based multi - filter feature selection method, which combined the outputs of the four filter methods to make an excellent selection. Next, an extensive experimental evaluation of this method was performed using the intrusion detection benchmark data set NSL-KDD and the decision tree classifier [33].
Saru Kumari et al. presented a design of a provably secure biometrics-based multi-cloud server authentication scheme. The authors discussed inter-related research trends, research challenges, a user’s privacy, and an efficient security solution of big data and Cloud of Things (CoT). The user authentication set-up for the multi-cloud-server was designed to function as an expert system, permitting its users to obtain the desired services and resources from cloud server registration authority. The authors devised a biometrics-based authentication method for building a multi-cloud server environment [34].
3. EH-GC: Energy Harvesting Architecture in Green Cloud Infrastructure
3.1. EH-GC Architecture Overview
In this section, we propose the EH-GC architecture to make cloud computing greener. The proposed architecture is shown in Figure 2. In the cloud environment, the emission of energy is very high, and our proposed architecture utilizes the wastage of emitted energy from a larger data center network. The model also focuses on providing proper VM allocation, while taking into consideration less SLA violations. Because of the vulnerability in the data center, it is possible to generate DoS/DDoS attacks, which cause more energy emission within the data center environment. To counter DoS/DDoS attacks, we use an MCA correlation analysis technique. The components of the EH-GC architecture are as follows.
3.1.1. Green Broker and CSP
In green cloud computing, the role of the green broker is to manage the selection of the greenest cloud service providers. When a client requests services (software, platform, or infrastructure), the green broker checks the public directory of service providers, which consist of the green service, cost value, and accessed time for the least carbon emissions. The carbon emission directory contains all of the related data on the energy parameters of service providers.
3.1.2. Green Service Layer
The proposed architecture is designed such that it keeps track of the overall energy management and provides energy efficient and secure services. This layer contains the following four major components:
VM Migration allocation: The allocation of VM is one of the major challenges for establishing green cloud computing. To maximize the utilization of minimum expense, resource management, and VM allocation, such as the minimization of migrations to the proper host for computations, the architecture applies an energy aware algorithm using a genetic algorithm. The EH-GC architecture proposes an energy aware genetic algorithm that considers SLA parameters such as the throughput and response time, and fewer SLA violations.
VM Manager: This provides a monitoring service that collects comprehensive factors such as the overall energy usage, application workload resource utilization, and much more. The VM manager serves as a data supplier and provides on-demand reports by playing out the total and pruning authenticated raw monitoring data.
Power management: The EH-GC aims to efficiently maintain the power management of the data center. It focuses on efficiently minimizing the servers’ power consumption in order to reduce carbon emissions.
Security mechanism: The EH-GC concentrates on the data center network layer are used to detect DoS attacks in the real-time network traffic in a smart home. Compromised VMs can cause a DoS/DDoS attack. The architecture analyses the network flow packet in the data center network using Multivariate Correlation Analysis (MCA), which is applied to our system for traffic classification by extracting correlation features between network traffics.
3.1.3. Virtualization Layer
Multiple operating systems are run on the single server nodes of the data center. In order to be energy efficient, the VMs providing services are set to the online mode, but otherwise, they are left idle or offline to save energy.
3.1.4. Data Center Layer
This is the main component of our architecture. A large number of data centers are working together, and one data center consists of many servers, with many VMs running on each server’s system. Because of the computation, a huge amount of energy is emitted by the data center, so the EH-GC architecture focuses on harvesting the emitted energy and storing the power, in order to reuse and re-supply it to the data center.
3.1.5. Energy Harvesting
In nature, there is a wide variety of renewable energy sources. To make the cloud greener, the proposed model applies an energy harvesting technique to the data center network. Certain resources, such as the wind, thermal energy, solar power, and radio frequency, can provide the required amount of power. Energy harvesting is an assuring solution to the energy efficiency problem. None of these solutions should result in the generation of CO2 emissions. Figure 3 shows the system architecture of the energy harvesting procedure. The energy harvested from the external energy source is converted to electrical energy, which is managed by a power management component that stores the harvested energy or immediately delivers it to another component. It also contains an AC/DC converter and makes it available to the micro-controller.
3.2. Pyroelectric Energy Harvesting
The emitted waste heat energy can be directly converted to electrical energy. This process requires a special type of material, named pyroelectric, whose particularity is that it possesses a spontaneous polarization which generates an electric dipole moment per unit volume, without applying an electric field [35]. To harvest waste heat energy into electric energy, we apply the Olsen cycle to this material [36].
3.2.1. Olsen Cycle and Leakage Current
The Olsen cycle, also called the Ericsson cycle, is applied to a film or a slab of pyroelectric material sandwiched between two electrodes. The electrodes have two surfaces, hot and cold, whose temperature is and , respectively. The Olsen cycle comprises two isothermal and two isoelectric field processes. Because of the properties of the pyroelectric material, it is dielectric and its resistance power should be ideally infinite. The leakage current is subjected or generated in the pyroelectric material upon applying the electric field or increasing the temperature. The electric resistance decreases when the temperature is increased, causing leaked current flows in the material.
To measure the performance of pyroelectric material for energy harvesting, we consider two parameters, namely and , where is the energy harvesting parameter in (Joules per cubic meter per square kelvin).
3.2.2. Electric Subsystem
Figure 4 shows the electric circuit diagram used to perform the Olsen cycle. The electric subsystem consists of the Sawyer-Tower Bridge [37], to apply the electric field and measure the generated charge Q in the pyroelectric material. The resistive voltage divider is placed parallel to the Sawyer-Tower Bridge in order to measure the electric field. The electrometer measures the voltage V1 of the film capacitor C1. The electric displacement is defined as:
where A is the film surface area per cm2. The magnitude of the electric field E across the PE material is calculated as:
and the leakage current is defined as:
3.3. Genetic Algorithm for VM Allocation
In this section, we use the fitness function of the genetic algorithm for VM allocation. The EH-GC proposes an energy aware algorithm model with the focus on providing efficient VM allocation in order to achieve green computation for data centers. The algorithm also considers SLA violations while migrating VMs.
3.3.1. System Mode
The system is fully concentrated on the IaaS infrastructure of cloud computing. In the data center of the IaaS, there are N data centers, and each data center contains n physical machines. Each physical machine contains s number of VMs. The performance of the system can be evaluated in terms of MIPS (Million instructions per second), and its performance will be degraded when there is a violation of the SLA agreement. The system works as follows:
- Steps 1:
- Initialize VMs and Hosts with CPU utilization and define SLA for VMs and Host features;
- Steps 2:
- Initialize genetic algorithm GA with SLA parameters = {Energy, Response time, Throughput};
- Steps 3:
- Use fitness function fn of GA and if ;
- Steps 4:
- , the fitness function is valid and feasible, and the return VM allocation is true;
- Steps 5:
- Otherwise, drop the VMs and check the performance metrics, and then increment the SLA violation;
- Steps 6:
- Return migration list and SLA violation;
where is the current VMs, is the total population, is the resource time required by users, and is the provider’s response time. is the execution time of each request and is the durability provided by the vendor.
3.3.2. SLA Violation Metrics
To achieve green cloud computing, it is necessary to meet the QoS requirement. There are many parameters for categorizing the QoS requirement differently, based on performance, such as the throughput, response time, and CPU utilization. As these parameter values vary from application to application, it is important to define a random workload for each VM with CPU utilization to deploy the IaaS. It is also very important to minimize the number of SLA violations and maintain the performance level of the system. Fewer SLA violations cause less energy consumption, which in turn causes lower carbon emissions, resulting in a green cloud computing environment.
3.4. DoS Detection in Data Center Network Using MCA Analysis
3.4.1. MCA Detection Analysis
To ensure the availability of our proposed framework against DoS attacks, multivariate correlation analysis (MCA) is applied to our system for traffic classification by extracting the correlation between the network traffic features, as shown in Figure 5. The MCA approach employs triangle area map generation. The approach extracts the correlated data between features in an observed data object, such as the network traffic records. The arbitrary data set is given by , where and represent zth n-dimensional traffic records. To find the correlation between the xth and yth features in the vector , the vector is first projected on the two-dimensional Euclidean space, as follows:
The two vectors and have m number of elements having zero value, except and , which have a value of 1 in and , respectively. can be defined as the Cartesian coordinate system and is depicted as a two-dimensional Euclidean subspace having the Cartesian coordinate points .
The triangle formed with the origin is and its area is defined as follows:
where
For a correct and accurate analysis, we need to calculate all the triangle areas in vector . A triangle map area is constructed when all the triangle areas are arranged based on their indexes. For instance, the map has a size of n × n, and the is coordinated on the xth row and yth column. Additionally, the diagonal value is is a symmetric matrix with a zero value of elements which are present on the diagonal places.
When the two TAMs are compared, the differences can easily be identified on the upper or lower triangles, due to the symmetry in nature. Thus, to investigate the TAMs, we chose either the upper triangle or the lower triangle. So, the correlation in the traffic record can be represented by the upper or lower triangles of their . For consistency, we use the lower triangle for both TAMs, so the new correlation vector is:
Thus, as previously mentioned, for the data set R, its geometrical multi-correlation expression can be represented by:
In Equation (1), is applied in practice, but it can be simplified as:
The MCA approach explained above brings the following benefits for data analysis. First, it does not require a historical knowledge of the data. Second, it results in a lower latency in decision-making. Third, it provides geometrical analysis.
3.4.2. Detection Mechanism
As mentioned earlier, the MCA approach using TAM is very fruitful for data analysis. In this subsection, we present a threshold-based anomaly detector to analyze the legitimate traffic. To detect anomaly packets, first we generate the normal profile by using legitimate traffic, and then we compare and investigate it with the original incoming traffic. When the dissimilarity is greater than the threshold value, it is announced as an attack; otherwise, it is tagged as legitimate traffic. It is a matter of concern that the normal profiles and threshold value may influence the performance of the anomaly detector, because an influenced normal profile can cause an accurate decision about legitimate traffic; thus, we used the MCA approach and generated the TAM to detect network traffic in the data center and to make it greener.
3.4.3. Normal Profile Generation
Assume number of legitimate traffic records is analyzed by the MCA approach using triangle area map generation. In TAM, the lower part of the triangle of number of legitimate traffic records is denoted as:
Algorithm 1 shows the normal profile generation algorithm, in which the Mahalanobis Distance (MD) [38] estimates and builds the normal profile between the individual legitimate training traffic records (). Moreover, the expectation () of the legitimate training traffic records is presented.
| Algorithm 1 Normal Profile Generation Algorithm |
| Input: with elements |
Generate covariance matrix for using (12) for to do /* mahalanobis distance between and computed using (14) */ end for return |
3.4.4. Threshold Selection
To differentiate an attack from legitimate traffic, the threshold selection is defined as:
where α ranged from one to three in a normal distribution. This means that the detection decision varies from 67% to 99%, with a certain level of confidence in association with the different value of selecting λ. Therefore, if the MD is between observed traffic records and their normal profile is greater than the threshold, then it is considered as an attack.
3.4.5. Attack Detection
For DoS attack detection, the lower triangle () of the TAM of a perceived record is produced by using the proposed TAM-based MCA approach. Then, the md between and stored in the respective pre-generated normal profile is computed using Equation (4). The detailed detection algorithm is shown in Algorithm 2.
| Algorithm 2 Mahalanobis Distance-Based Attack Detection Algorithm | |
| Input: Observed traffic record , normal profile and parameter | |
| Generate for the observed traffic record | |
| if then | |
| return Normal | |
| else | |
| return Attack | |
| end if | |
4. Experimental Evaluation
In this Chapter, we present the experimental evaluation of the proposed EH-GC architecture. We evaluate the performance of the EH-GC architecture by considering three components: (a) a genetic algorithm for VM allocation; (b) DoS detection using MCA analysis; and (c) pyroelectric energy harvesting.
4.1. Genetic Algorithm for VM Allocation
To evaluate the effectiveness of the applied genetic algorithm in the EH-GC architecture, we implemented the genetic algorithm as a new VM allocation optimization heuristic in the CloudSim toolkit [39]. The CloudSim is a scalable simulation framework that provides support for the simulation, modeling, and experimentation of virtualized Cloud-based data center environments and Cloud management services for VMs, storage, memory, and bandwidths with different capabilities, domains, and configurations. We evaluated the performance of the applied genetic algorithm based on three parameters: energy consumption, throughput, and SLA violation. The performance of the genetic algorithm (with EH-GC) is compared with the Minimization of Migration (MM) algorithm (without EH-GC) proposed by Anton Beloglazov et al. [29]. In the data center layer of the EH-GC architecture, a large number of data centers comprise many physical machines running together. One physical machine is demonstrated as 1000 MIPS. Energy consumption is evaluated according to the standard power model of all VMs and hosts. When the simulation process is started, a random list of VMs is created. To access the VMs’ movement, the upper threshold value of the MM algorithm is utilized. In our simulation, we considered a range of 50–300 VMs to measure the power consumption.
Energy consumption: Figure 6 shows the energy consumption for both the proposed genetic algorithm and MM algorithm. The x-axis depicts the time of the experiment and the y-axis denotes the total energy consumption of the server in kilowatt-hours (Kwh). For each point T (hour) on the x-axis, its corresponding point on the y-axis represents the total energy consumed between point T (hour) and previous point T-1(hour). It can be easily seen in Figure 6 that at every time of the experiment, the energy consumption by the same number of migrated VMs in the case of the genetic algorithm is lower than that of the MM algorithm.
Throughput: It describes the MIPS execution time that is required by VMs. Figure 7 shows a comparison of the MM algorithm with our proposed genetic algorithm, in which the proposed algorithm has a better throughput than the MM algorithm.
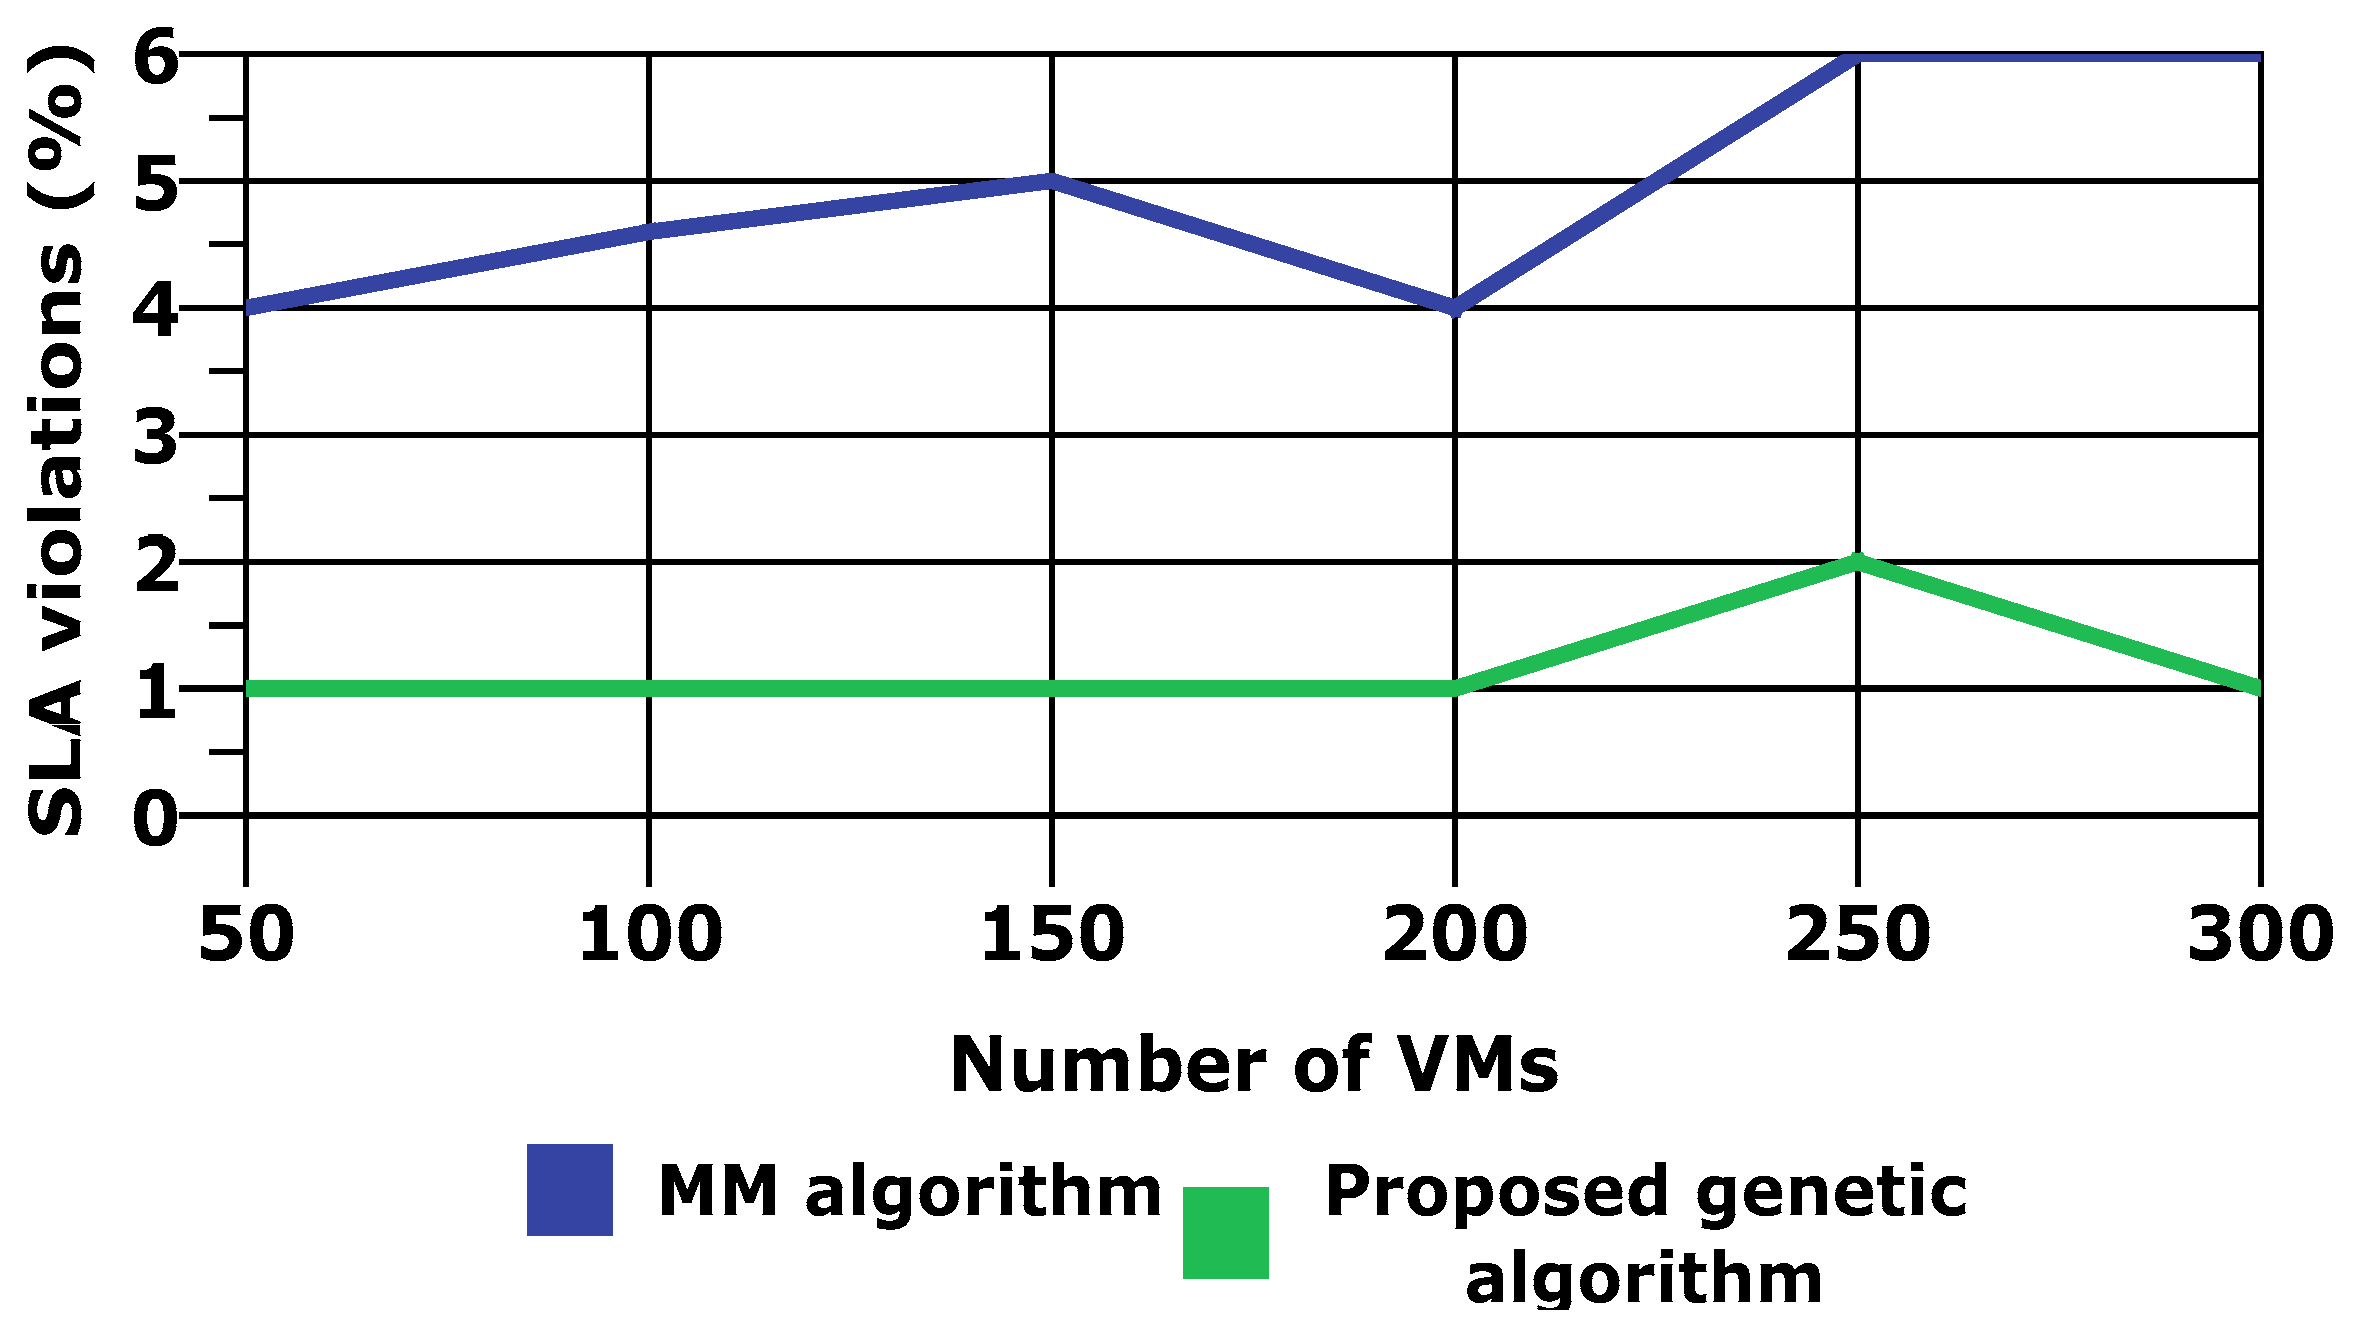
SLA violation: It is known that less SLA violations lead to a more efficient algorithm and better energy conservation. The performance of our system can also be considered by the SLA parameter. Figure 8 shows that the proposed algorithm has a very low number of violations compared to the existing MM algorithm.
Table 1 presents the quantitative analysis between the proposed model and existing algorithms. Specifically, Table 1 summarizes the percentage improvement obtained with our proposed EH-GC scheme over the existing MM algorithm. The performance of the system can be measured by the consumption of energy, throughput of the system, and minimum violation of SLA.
4.2. DoS Detection Using MCA Analysis
This section presents the evaluation of the security mechanism applied in EH-GC. The MCA analysis is used as a security mechanism that detects DoS attacks in the data center network. We evaluated the performance of MCA analysis by using the KDD Cup 99 dataset [40]. In the evaluation, we used 10% of the KDD Cup 99 dataset as a labeled dataset that consisted of six different types of DOS attack (Neptune, Pod, Smurf, Back, Teardrop, and Land attacks) and three kinds of normal traffic (ICMP, UDP, and TCP). Table 2 summarizes the evaluation results of MCA analysis regarding standard evaluation metrics. From the evaluation results, it can be observed that the MCA analysis applied in EH-GC attains an excellent accuracy, high detection rate, and lower false positive rate.
4.3. Pyroelectric Energy Harvesting
This section presents an evaluation of pyroelectric energy harvesting in EH-GC. For evaluation purposes, we used three different films, namely (a) porous film, (b) purified film, and (c) dense film, from commercial P (VDF-TrFE) pellets. All films were prepared by using the procedure as described in [41] and initialized with the commercial Copolymer of 60/40 P (VDF-TrFE). The Copolymer P (VDF-TrFE) is a ferroelectric material that is subjected to a leakage current for a high temperature or high electric field [42,43]. The thickness of the porous, purified, commercial thin films were about 11 µm, 50 µm, and 50 µm, respectively. The surface area of all films was 1 cm2. The porosity of the porous and purified films was estimated to be about 33% and 16%, respectively.
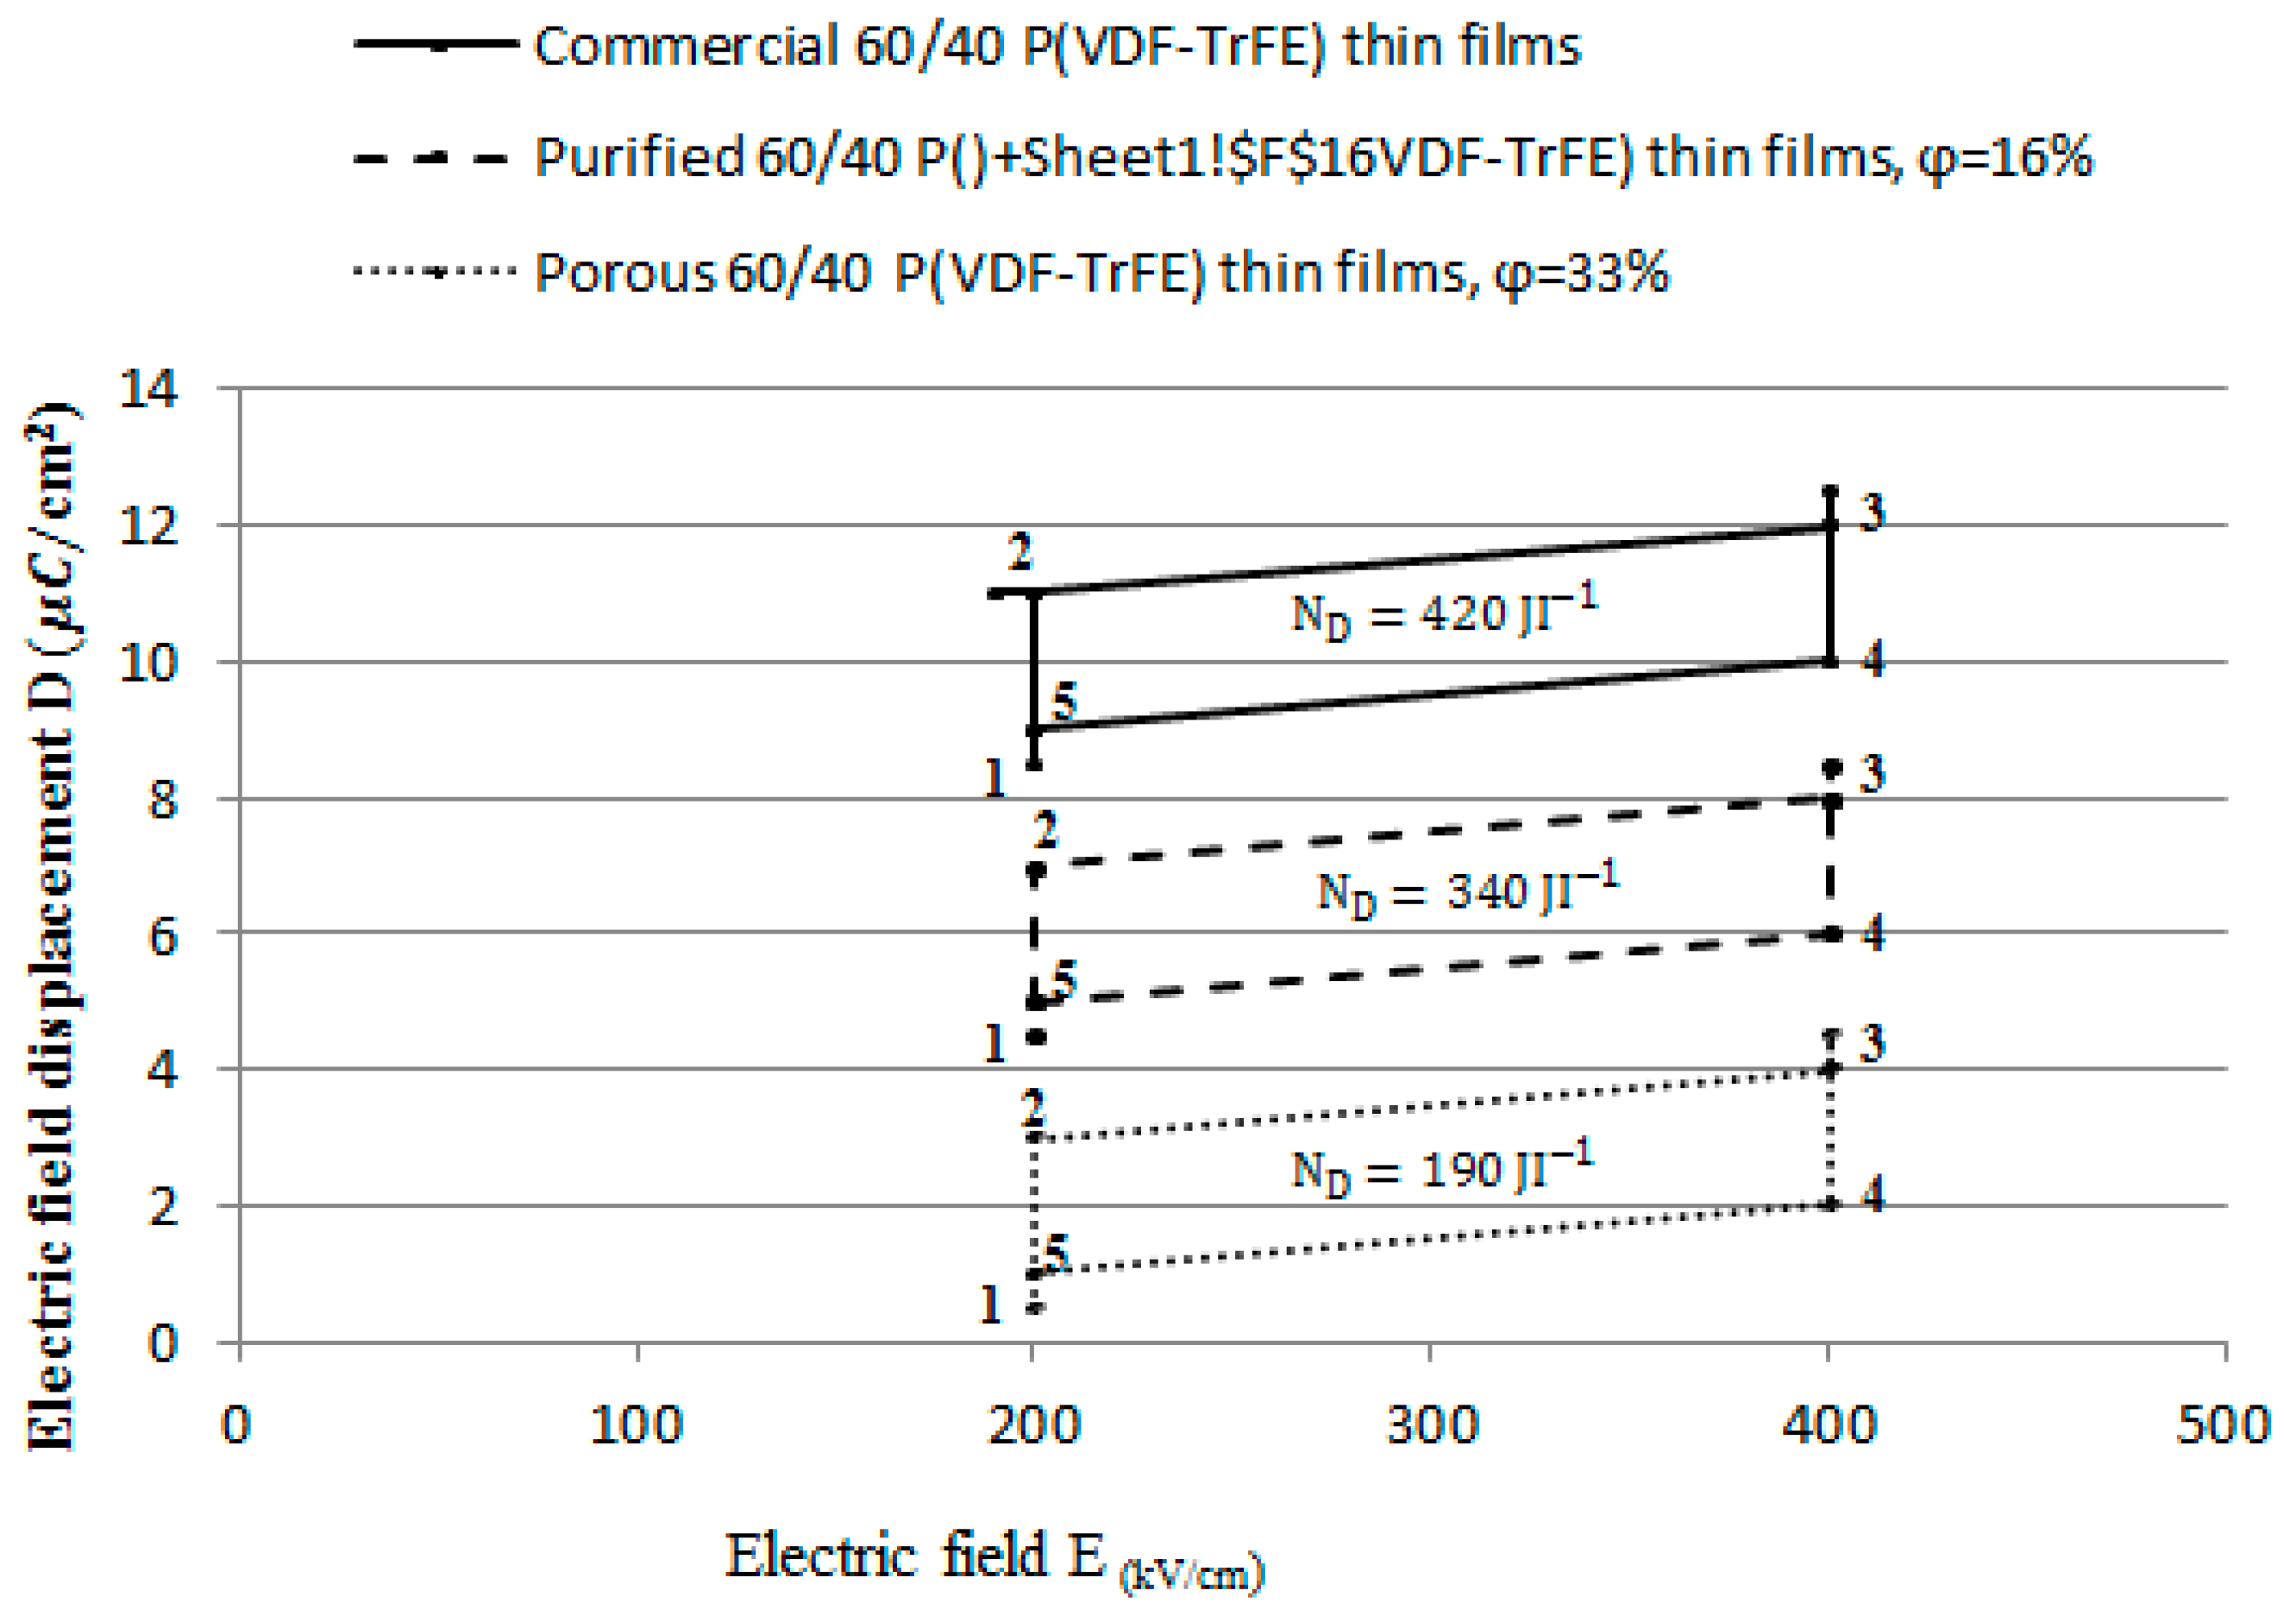
We carried out experiments by applying the multiple Olsen cycles to five different samples of each type of film. The total power and energy densities of each type of film were calculated by averaging the result obtained over multiple Olsen cycles of five different samples. Figure 9 represents the energy conversion cycle for each type of film on displacement versus the electric field (D–E) diagram. The hot and cold temperatures, and , are 250 °C and 1000 °C, respectively. The electric field of the cold and hot surfaces, and , is 200 and 400 kVcm−1, respectively. In Figure 9, the cycle does not start and end with the same point, which means that point 1 and point 5 are different points. However, we conjectured that, during the entire cycle, the offset between 1 and 5 is related to the charge conducted to the pyroelectric films, and this conducted charge may round the shape of processes 2–3 and 4–5.
We identified a considerable leakage current during the experiment. The electric resistivity of the commercial film is . Under these conditions, the commercial film generates the highest energy density per cycle at , followed by purified film at . Therefore, we can say that if the electric resistivity is increasing, the leakage current is decreasing, thereby maximizing the energy density generated per cycle.
5. Conclusions
We studied various issues and challenges related to the power consumption, waste heat, and carbon emissions in data centers in the IaaS for green cloud computing. The carbon emission rate is increasing day by day. We also studied many currently available renewable energy resources which can significantly lower the carbon emission rate.
In this paper, we proposed a novel EH-GC architecture that is focused on harvesting the heat energy produced in large data centers. The architecture is based on harvesting energy from renewable resources and efficient VMs allocation in data centers, in order to achieve green cloud computing. Two kinds of artificial intelligence-based techniques, genetic and multivariate correlation analysis, are used in our proposed architecture to achieve efficient power consumption and utilization. The architecture is capable of harvesting the waste energy generated within a data center. To protect a data center against a DoS attack, the architecture uses MCA correlation analysis. Finally, the experimental analysis was explained based on the energy parameter, which proved that our architecture is efficient and secure, and reuses waste energy to make cloud computing greener.
Acknowledgments
This research was supported by the MSIP (Ministry of Science, ICT and Future Planning), Korea, under the ITRC (Information Technology Research Center) support program (IITP-2017-2014-0-00720) supervised by the IITP (Institute for Information & communications Technology Promotion).
Author Contributions
Saurabh Singh: Research for the related works, analysis, design, meliorating the proposed model, and drafting the article. Pradip Kumar Sharma: Acquisition of data, analysis, and interpretation of related works, conception, and meliorating the complete model. Seo Yeon Moon: Related work, design and conception of the model. Jong Hyuk Park: Total supervision of the paperwork, review, comments, assessment, etc.
Conflicts of Interest
The authors declare no conflict of interest.
References
- Singh, S.; Jeong, Y.S.; Park, J.H. A survey on cloud computing security: Issues, threats, and solutions. J. Netw. Comput. Appl. 2016, 75, 200–222. [Google Scholar] [CrossRef]
- Shehabi, A.; Smith, S.; Sartor, D.; Brown, R.; Herrlin, M.; Koomey, J.; Masanet, E.; Horner, N.; Azevedo, I.; Lintner, W. United States Data Center Energy Usage Report; LBNL-1005775; Lawrence Berkeley National Laboratory: Berkeley, CA, USA, 2016; Volume 4, pp. 1–4. [Google Scholar]
- Ren, C.; Wang, D.; Urgaonkar, B.; Sivasubramaniam, A. Carbon-aware energy capacity planning for datacenters. In Proceedings of the 2012 IEEE 20th International Symposium on Modeling, Analysis and Simulation of Computer and Telecommunication Systems, Washington, DC, USA, 7–9 August 2012; pp. 391–400. [Google Scholar]
- Gao, P.X.; Curtis, A.R.; Wong, B.; Keshav, S. It’s not easy being green. ACM SIGCOMM Comput. Commun. Rev. 2012, 42, 211–222. [Google Scholar] [CrossRef]
- Cook, G. How Clean Is Your Cloud? 2012. Available online: http://www.greenpeace.org/international/Global/international/publications/climate/2012/iCoal/HowCleanisYourCloud.pdf (accessed on 2 April 2017).
- Mink, A.L. US Federal Agencies and Cloud: A Common Decision Framework for Determining Which Legacy IT Systems Should Migrate to Cloud. Ph.D. Dissertation, George Mason University, Fairfax, VA, USA, 2015. Available online: http://mars.gmu.edu/handle/1920/9705 (accessed on 16 April 2017).
- Subashini, S.; Kavitha, V. A survey on security issues in service delivery models of cloud computing. J. Netw. Comput. Appl. 2011, 34, 1–11. [Google Scholar] [CrossRef]
- Garrison, G.; Wakefield, R.L.; Kim, S. The effects of IT capabilities and delivery model on cloud computing success and firm performance for cloud supported processes and operations. Int. J. Inf. Manag. 2015, 35, 377–393. [Google Scholar] [CrossRef]
- Nelson, P. Cybercriminals Moving into Cloud Big Time, Report Says. Available online: http://www.networkworld.com/article/2900125/malware-cybercrime/criminals-moving-into-cloud-big-time-says-report.html (accessed on 7 April 2017).
- Singh, S.; Sharma, P.K.; Park, J.H. SH-SecNet: An Enhanced Secure Network Architecture for the Diagnosis of Security Threats in a Smart Home. Sustainability 2017, 9, 513–532. [Google Scholar] [CrossRef]
- Osanaiye, O.; Choo, K.-K.R.; Dlodlo, M. Distributed Denial of Service (DDoS) Resilience in Cloud: Review and Conceptual Cloud DDoS Mitigation Framework. J. Netw. Comput. Appl. 2016, 67, 147–165. [Google Scholar] [CrossRef]
- Somani, G.; Gaur, M.S.; Sanghi, D.; Conti, M.; Buyya, R. DDoS attacks in cloud computing: issues, taxonomy, and future directions. Comput. Commun. 2017, 105, 30–48. [Google Scholar] [CrossRef]
- Keegan, N.; Ji, S.Y.; Chaudhary, A.; Concolato, C.; Yu, B.; Jeong, D.H. A survey of cloud-based network intrusion detection analysis. Hum. Centric Comput. Inf. Sci. 2016, 6, 1–16. [Google Scholar] [CrossRef]
- Kar, J.; Mishra, M.R. Mitigating Threats and Security Metrics in Cloud Computing. J. Inf. Process. Syst. 2016, 12, 226–233. [Google Scholar]
- Rahman, N.H.A.B.; Cahyani, N.D.W.; Choo, K.-K.R. Cloud incident handling and forensic-by-design: Cloud storage as a case study. Concurr. Comput. Pract. Exp. 2016. [Google Scholar] [CrossRef]
- Alam, Q.; Malik, S.U.R.; Akhunzada, A.; Choo, K.-K.R.; Tabbasum, S.; Alam, M.A. Cross Tenant Access Control (CTAC) Model for Cloud Computing: Formal Specification and Verification. IEEE Trans. Inf. Forensics Secur. 2017, 12, 1259–1268. [Google Scholar] [CrossRef]
- Huang, C.J.; Guan, C.T.; Chen, H.M.; Wang, Y.W.; Chang, S.C.; Li, C.Y.; Weng, C.H. An adaptive resource management scheme in cloud computing. Eng. Appl. Artif. Intell. 2013, 26, 382–389. [Google Scholar] [CrossRef]
- El Amraoui, A.; Manier, M.A.; El Moudni, A.; Benrejeb, M. A genetic algorithm approach for a single hoist scheduling problem with time windows constraints. Eng. Appl. Artif. Intell. 2013, 26, 1761–1771. [Google Scholar] [CrossRef]
- Rodríguez, G.; Soria, Á.; Campo, M. Artificial intelligence in service-oriented software design. Eng. Appl. Artif. Intell. 2016, 53, 86–104. [Google Scholar] [CrossRef]
- Zhu, W.; Lee, C. A Security Protection Framework for Cloud Computing. J. Inf. Process. Syst. 2016, 12, 538–547. [Google Scholar]
- Thombare, D.G.; Verma, S.K. Technological development in the Stirling cycle engines. Renew. Sustain. Energy Rev. 2008, 12, 1–38. [Google Scholar] [CrossRef]
- Sebald, G.; Pruvost, S.; Guyomar, D. Energy harvesting based on Ericsson pyroelectric cycles in a relaxor ferroelectric ceramic. Smart Mater. Struct. 2007, 17, 1–6. [Google Scholar] [CrossRef]
- Basagni, S.; Naderi, M.Y.; Petrioli, C.; Spenza, D. Wireless Sensor Networks with Energy harvesting. 2013. Available online: https://pdfs.semanticscholar.org/ab43/3e2af3da6cee743bf82727631a80831b81cb.pdf (accessed on 1 April 2017).
- Moreno, R.C.; James, B.A.; Navid, A.; Pilon, L. Pyroelectric energy converter for harvesting waste heat: Simulations versus experiments. Int. J. Heat Mass Transf. 2012, 55, 4301–4311. [Google Scholar] [CrossRef]
- Lee, F.Y.; Navid, A.; Pilon, L. Pyroelectric waste heat energy harvesting using heat conduction. Appl. Therm. Eng. 2012, 37, 30–37. [Google Scholar] [CrossRef]
- Tan, Z.; Jamdagni, A.; He, X.; Nanda, P.; Liu, R.P. A system for denial-of-service attack detection based on multivariate correlation analysis. IEEE Trans. Parallel Distrib. Syst. 2014, 25, 447–456. [Google Scholar]
- Karthik, C.; Sharma, M.; Maurya, K.; Chandrasekaran, K. Green intelligence for cloud data centers. In Proceedings of the 2016 3rd International Conference on Recent Advances in Information Technology (RAIT), Kolkata, India, 5 March 2016; pp. 591–597. Available online: http://ieeexplore.ieee.org/xpl/mostRecentIssue.jsp?punumber=7503253 (accessed on 3 April 2017).
- Jing, S.Y.; Ali, S.; She, K.; Zhong, Y. State-of-the-art research study for green cloud computing. J. Supercomput. 2013, 65, 445–468. [Google Scholar] [CrossRef]
- Beloglazov, A.; Abawajy, J.; Buyya, R. Energy-aware resource allocation heuristics for efficient management of data centers for cloud computing. Future Gener. Comput. Syst. 2012, 28, 755–768. [Google Scholar] [CrossRef]
- Goyal, Y.; Arya, M.S.; Nagpal, S. Energy efficient hybrid policy in green cloud computing. In Proceedings of the 2015 International Conference on Green Computing and Internet of Things (ICGCIoT), Delhi, India, 8–10 October 2015; pp. 1065–1069. [Google Scholar]
- Yang, J.; Jiang, B.; Lv, Z.; Choo, K.-K.R. A task scheduling algorithm considering game theory designed for energy management in cloud computing. Future Gener. Comput. Syst. 2017. [Google Scholar] [CrossRef]
- Teing, Y.Y.; Dehghantanha, A.; Choo, K.-K.R.; Abdullah, M.A.; Muda, Z. Greening Cloud-Enabled Big Data Storage Forensics: Syncany as a Case Study. IEEE Trans. Sustain. Comput. 2017. [Google Scholar] [CrossRef]
- Osanaiye, O.; Cai, H.; Choo, K.-K.R.; Dehghantanha, A.; Xu, Z.; Dlodlo, M. Ensemble-based Multi-Filter Feature Selection Method for DDoS Detection in Cloud Computing. EURASIP J. Wirel. Commun. Netw. 2016, 2016, 1–10. [Google Scholar] [CrossRef]
- Kumari, S.; Xiong, L.; Wu, F.; Das, A.K.; Choo, K.-K.R.; Shen, J. Design of a Provably Secure Biometrics-based Multi-cloud-server Authentication Scheme. Future Gener. Comput. Syst. 2017, 68, 320–330. [Google Scholar] [CrossRef]
- Lang, S.B. Sourcebook of Pyroelectricity; Gordon Breach: New York, NY, USA, 1974; pp. 1–489. [Google Scholar]
- Olsen, R.B.; Briscoe, J.M.; Bruno, D.A.; Butler, W.F. A pyroelectric energy converter which employs regeneration. Ferroelectrics 1981, 38, 975–978. [Google Scholar] [CrossRef]
- Lines, M.E.; Glass, A.M. Principles and Applications of Ferroelectrics and Related Materials; Oxford University Press: Oxford, UK, 1977; pp. 1–604. [Google Scholar]
- De Maesschalck, R.; Jouan-Rimbaud, D.; Massart, D.L. The mahalanobis distance. Chemom. Intell. Lab. Syst. 2000, 50, 1–18. [Google Scholar] [CrossRef]
- Calheiros, R.N.; Ranjan, R.; Beloglazov, A.; De Rose, C.A.; Buyya, R. CloudSim: A toolkit for modeling and simulation of cloud computing environments and evaluation of resource provisioning algorithms. Softw. Pract. Exp. 2011, 41, 23–50. [Google Scholar] [CrossRef]
- Stolfo, S.J.; Fan, W.; Lee, W.; Prodromidis, A.; Chan, P.K. Cost-based modeling for fraud and intrusion detection: Results from the JAM project. In Proceedings of the DARPA Information Survivability Conference and Exposition, Hilton Head, SA, USA, 25–27 January 2000; Volume 2, pp. 130–144. [Google Scholar]
- Navid, A.; Lynch, C.S.; Pilon, L. Purified and porous poly (vinylidene fluoride-trifluoroethylene) thin films for pyroelectric infrared sensing and energy harvesting. Smart Mater. Struct. 2010, 19, 055006–055019. Available online: http://iopscience.iop.org/article/10.1088/0964-1726/19/5/055006/pdf (accessed on 1 April 2017). [CrossRef]
- Vanderpool, D.; Yoon, J.H.; Pilon, L. Simulations of a prototypical device using pyroelectric materials for harvesting waste heat. Int. J. Heat Mass Transf. 2008, 51, 5052–5062. [Google Scholar] [CrossRef]
- Incropera, F.P.; DeWitt, D.P.; Bergman, T.L.; Lavine, A.S. Introduction to Heat and Mass Transfer; John Wiley & Sons Inc.: New York, NY, USA, 2002; pp. 1–1039. [Google Scholar]
Figure 1.
MCA detection process.

Figure 2.
Proposed EH-GC architecture.

Figure 3.
Energy harvesting power management.
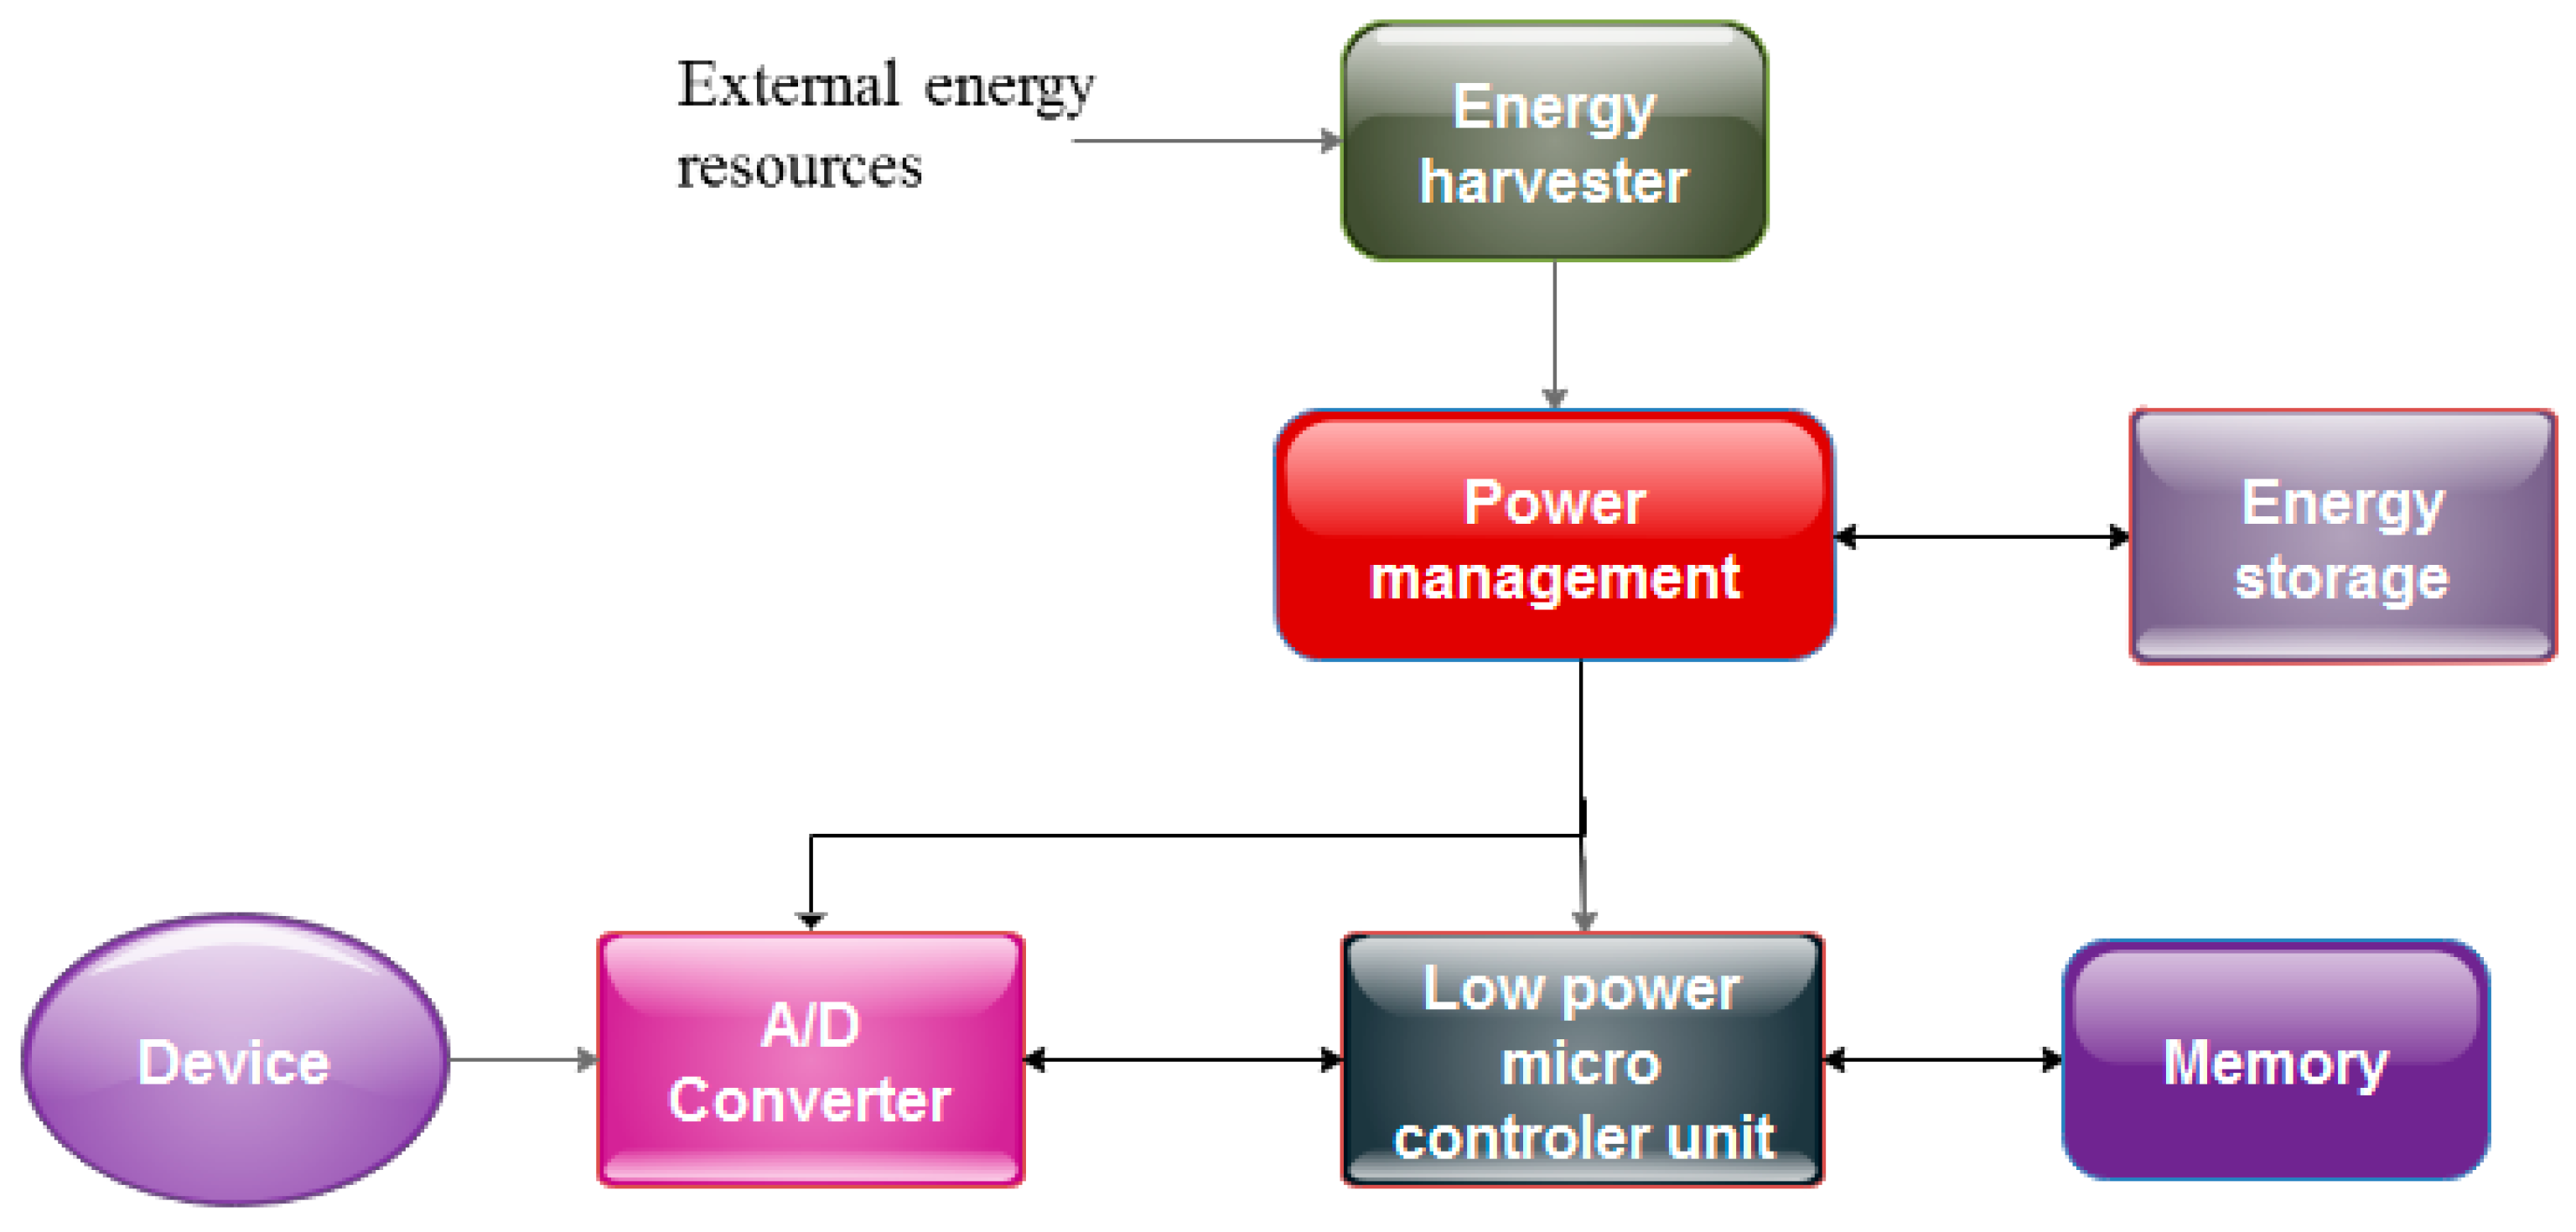
Figure 4.
Circuit diagram used to perform the Olsen cycle.
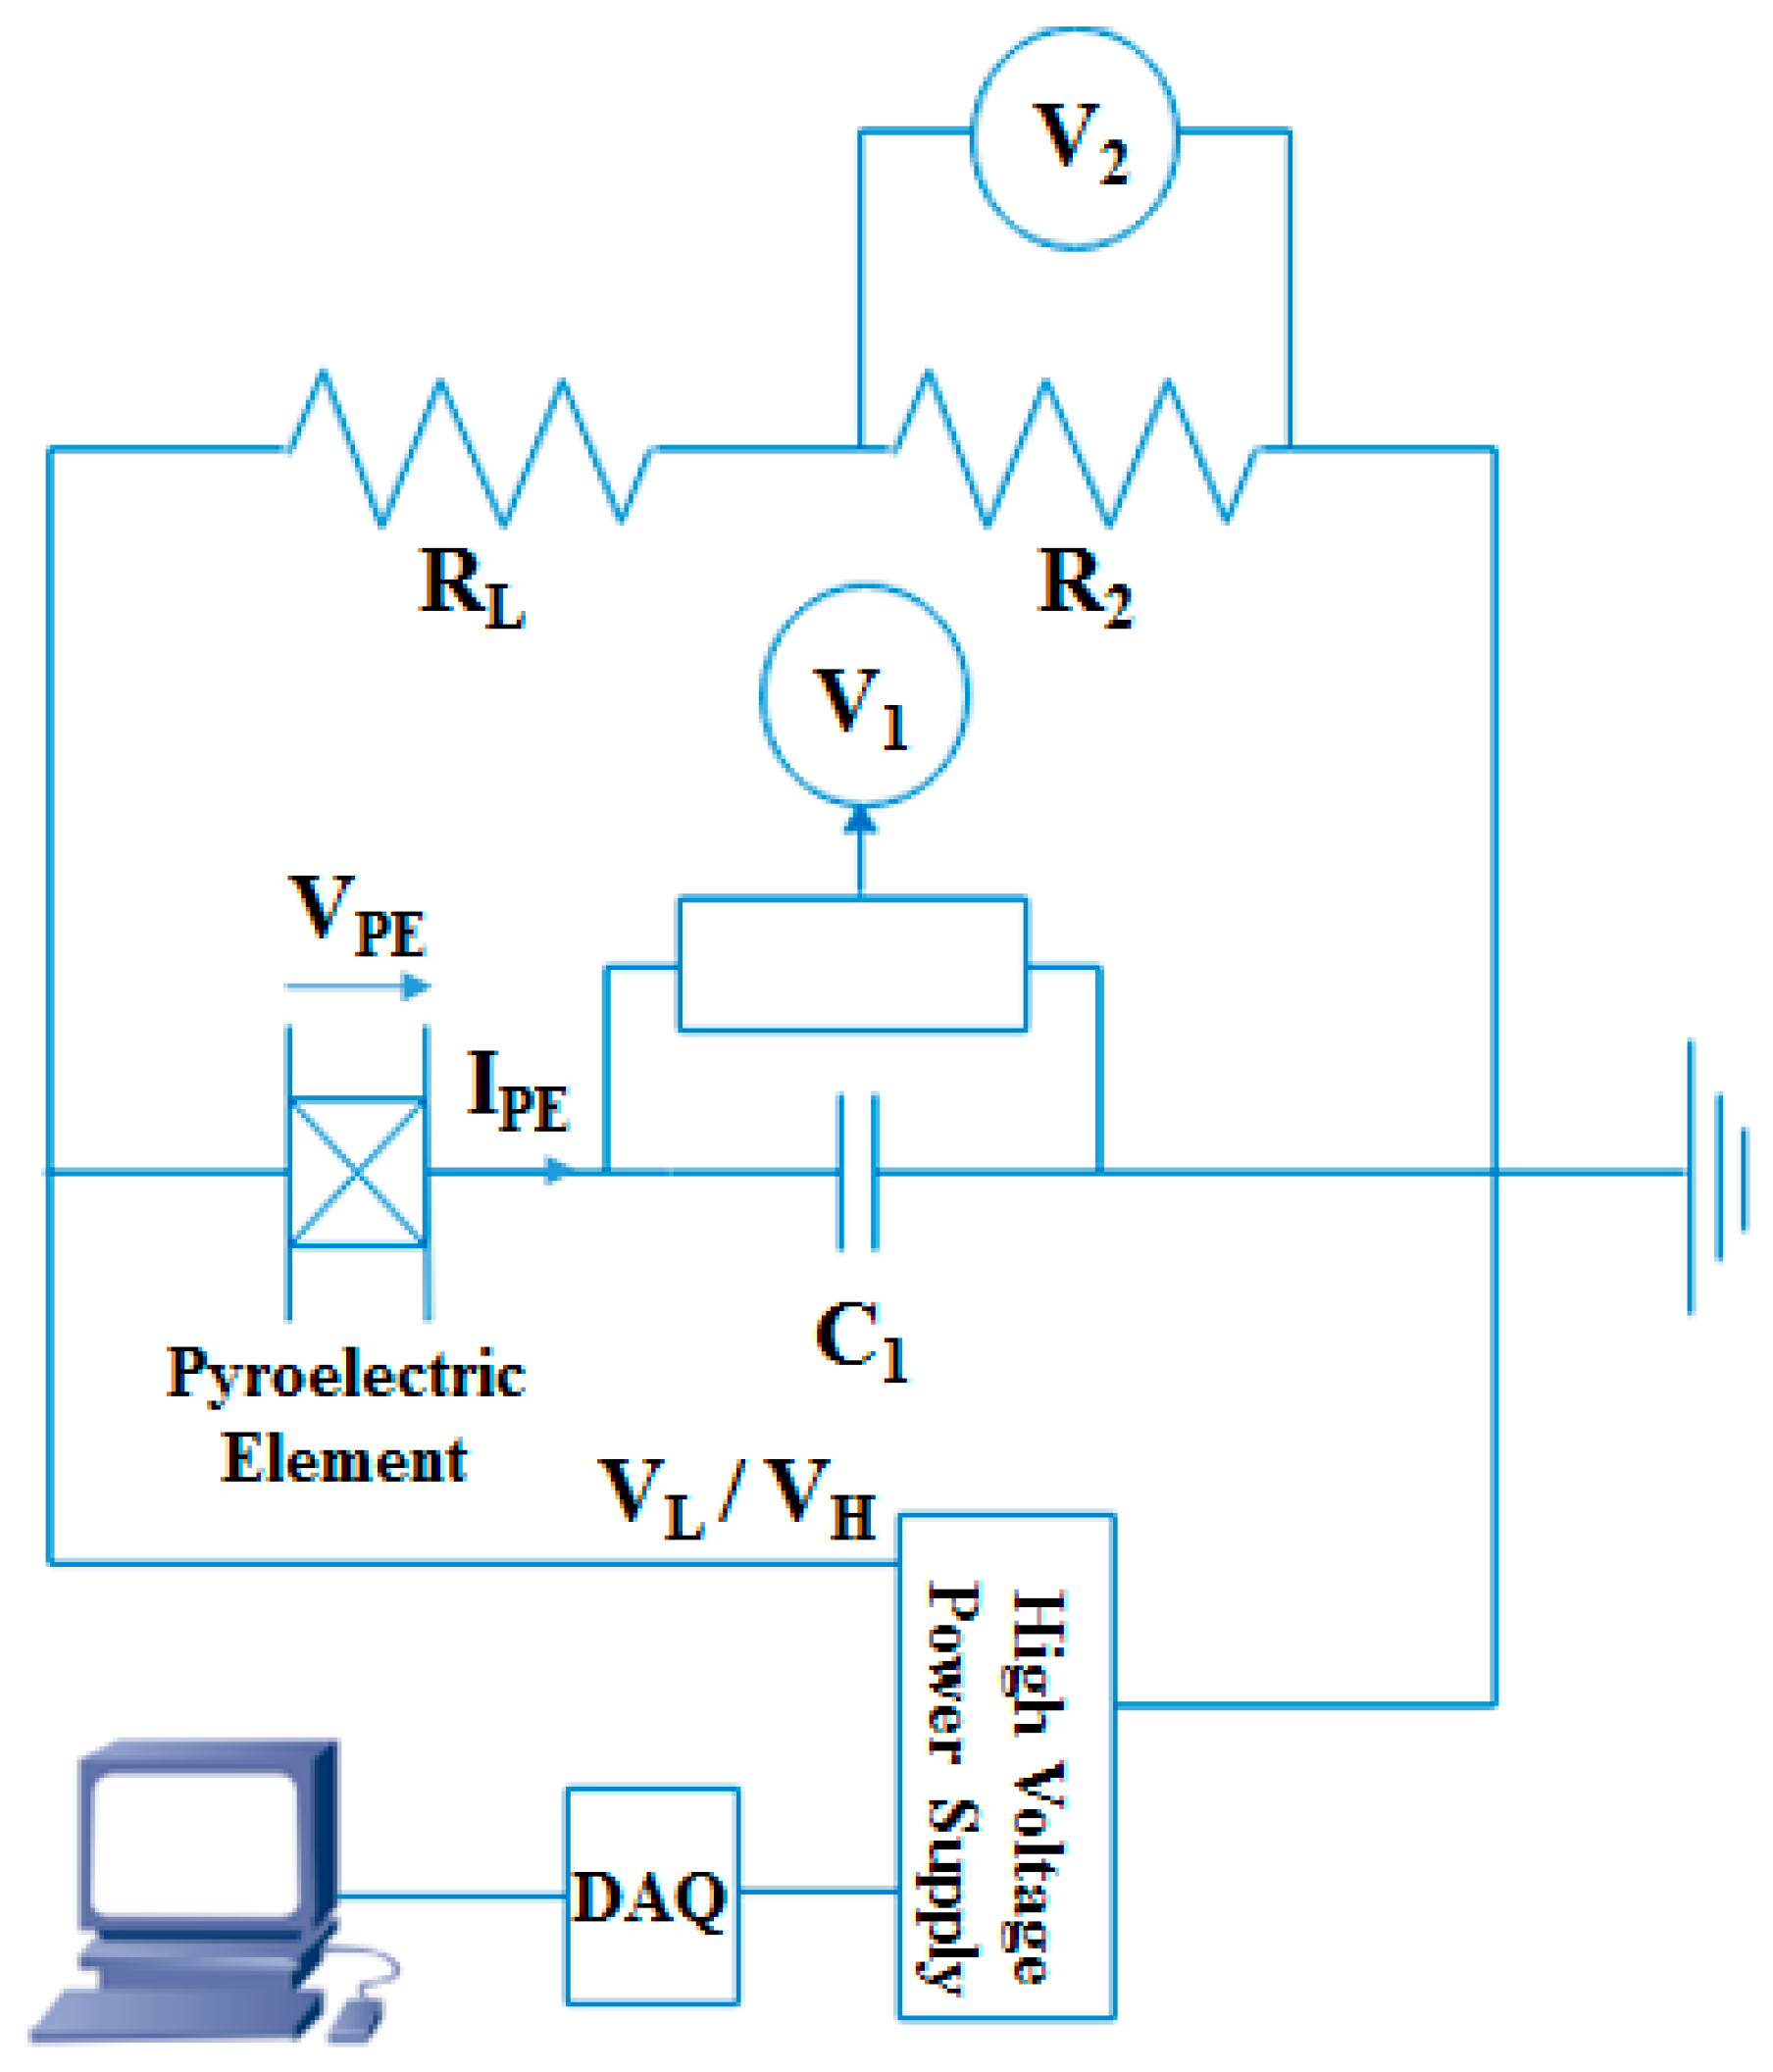
Figure 5.
Flow analysis diagram.
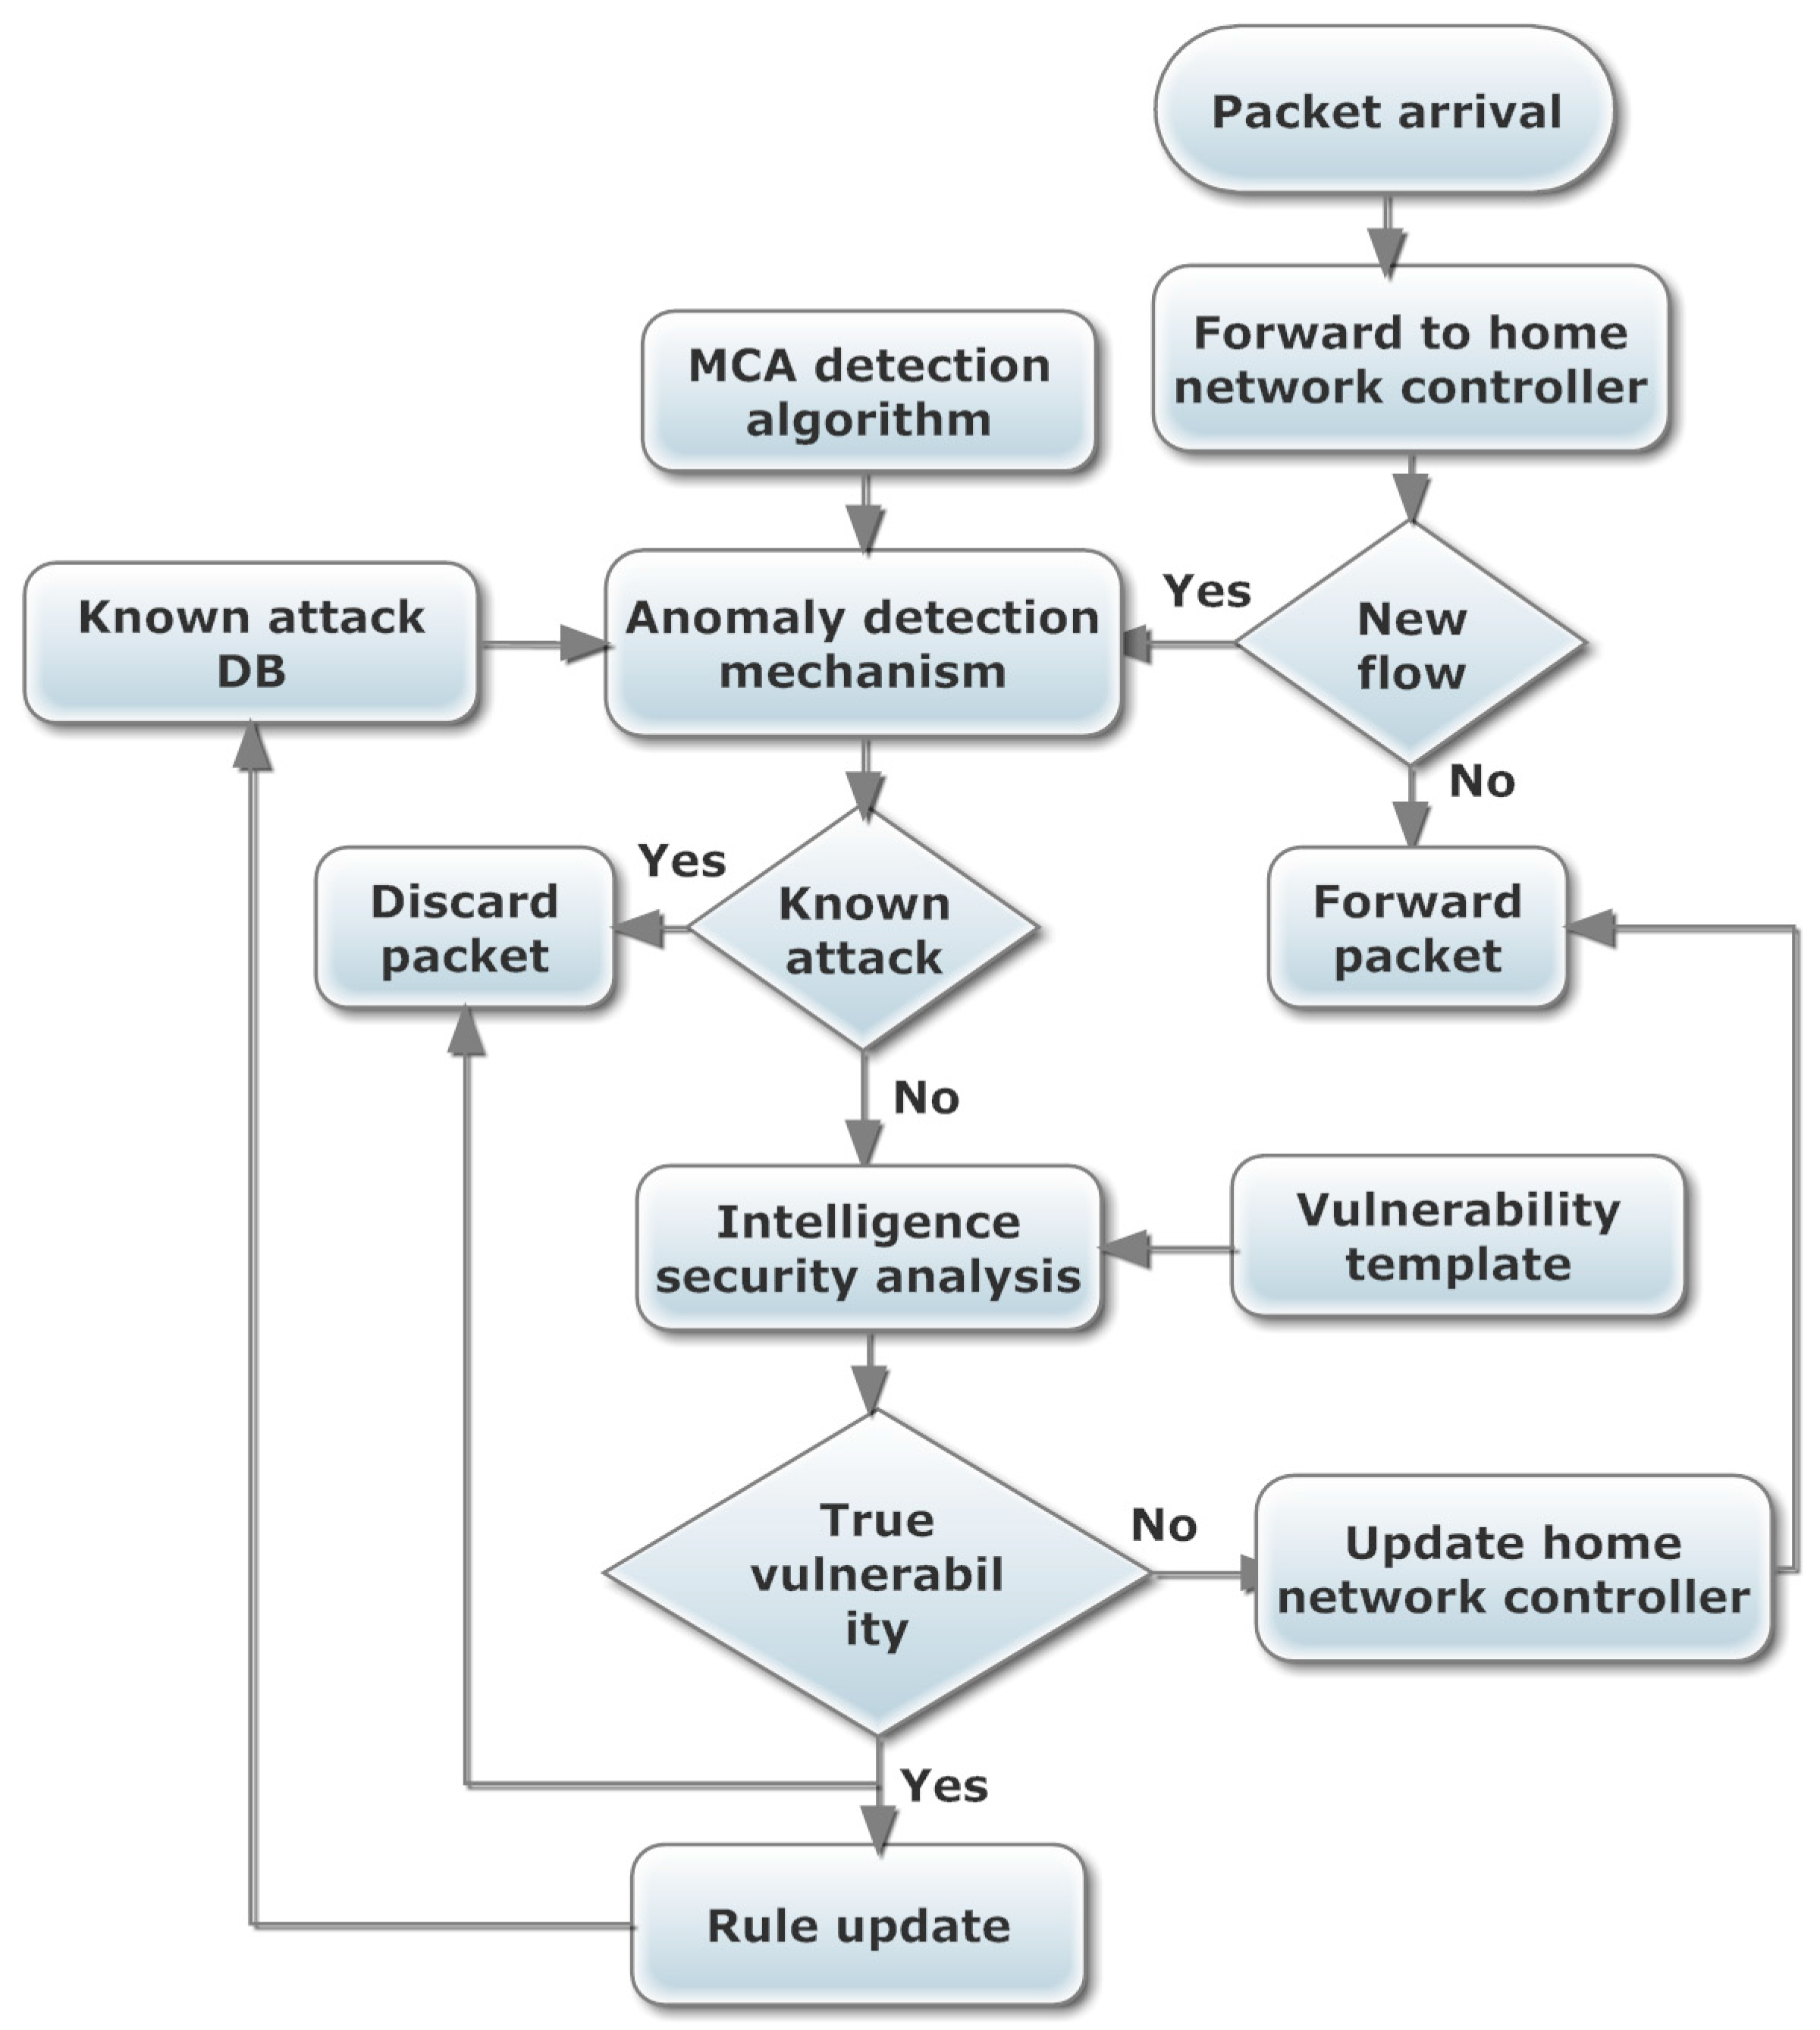
Figure 6.
Energy consumption of the system.
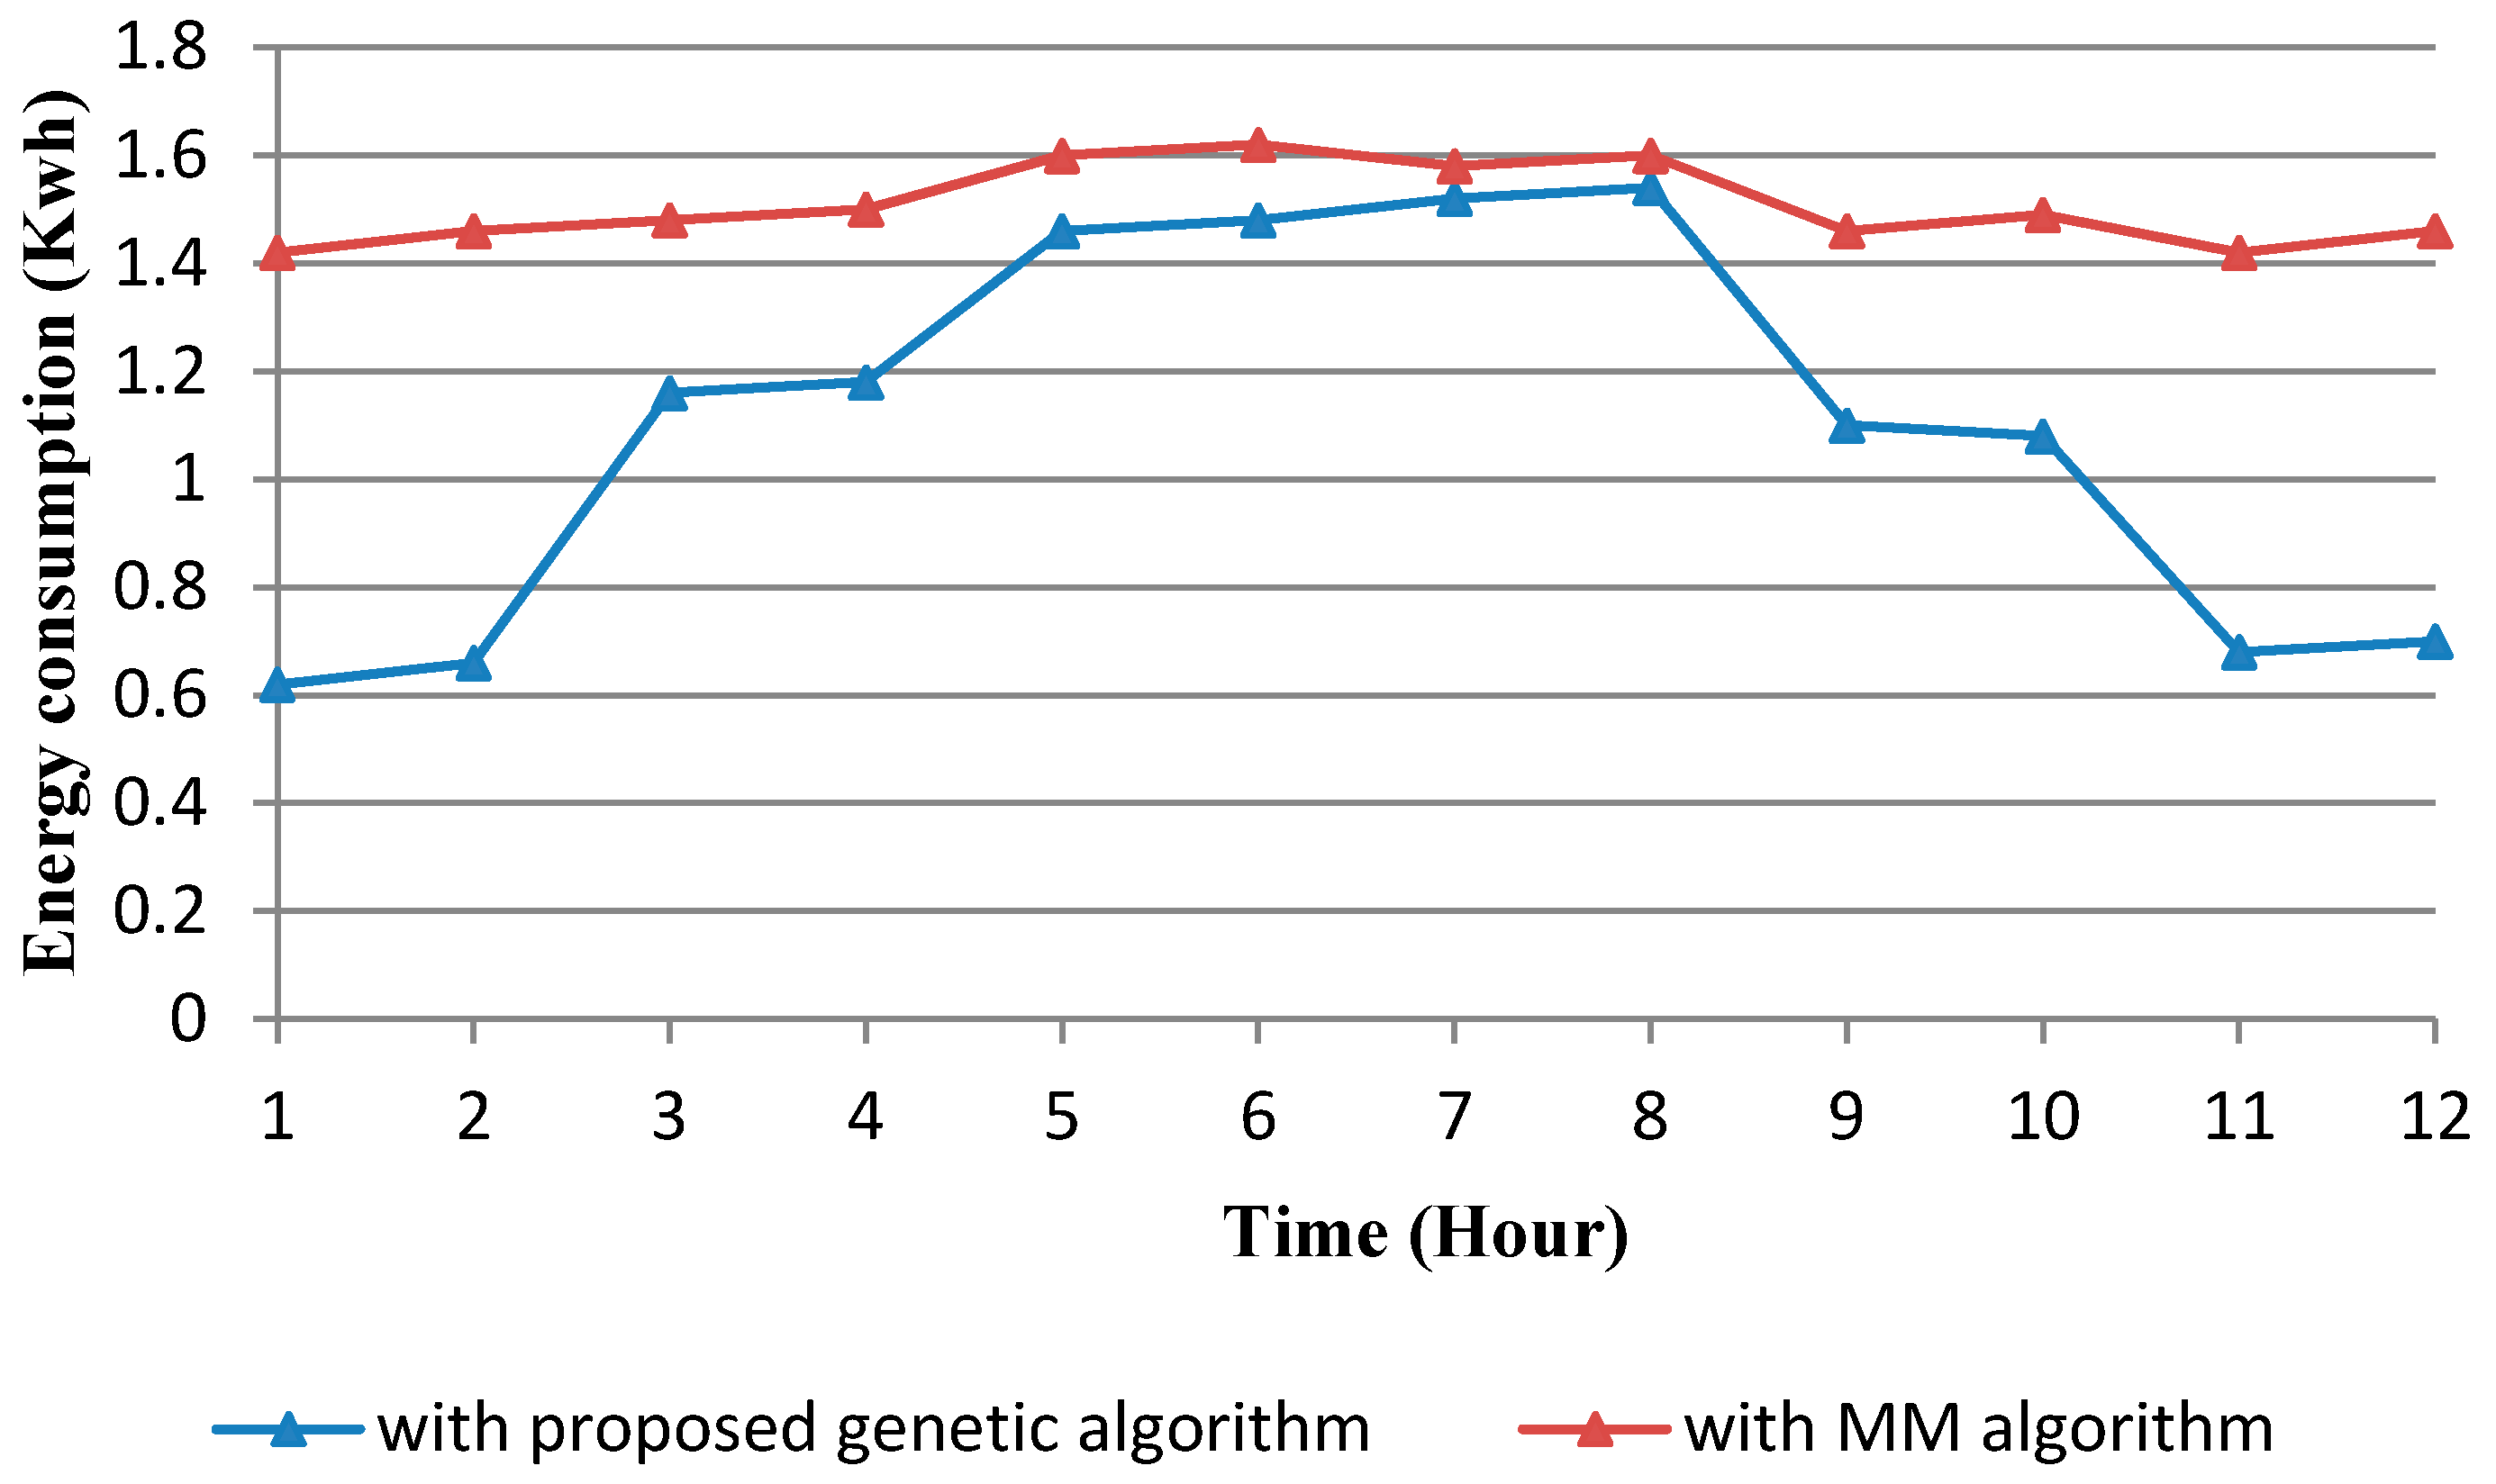
Figure 7.
Throughput of the system.
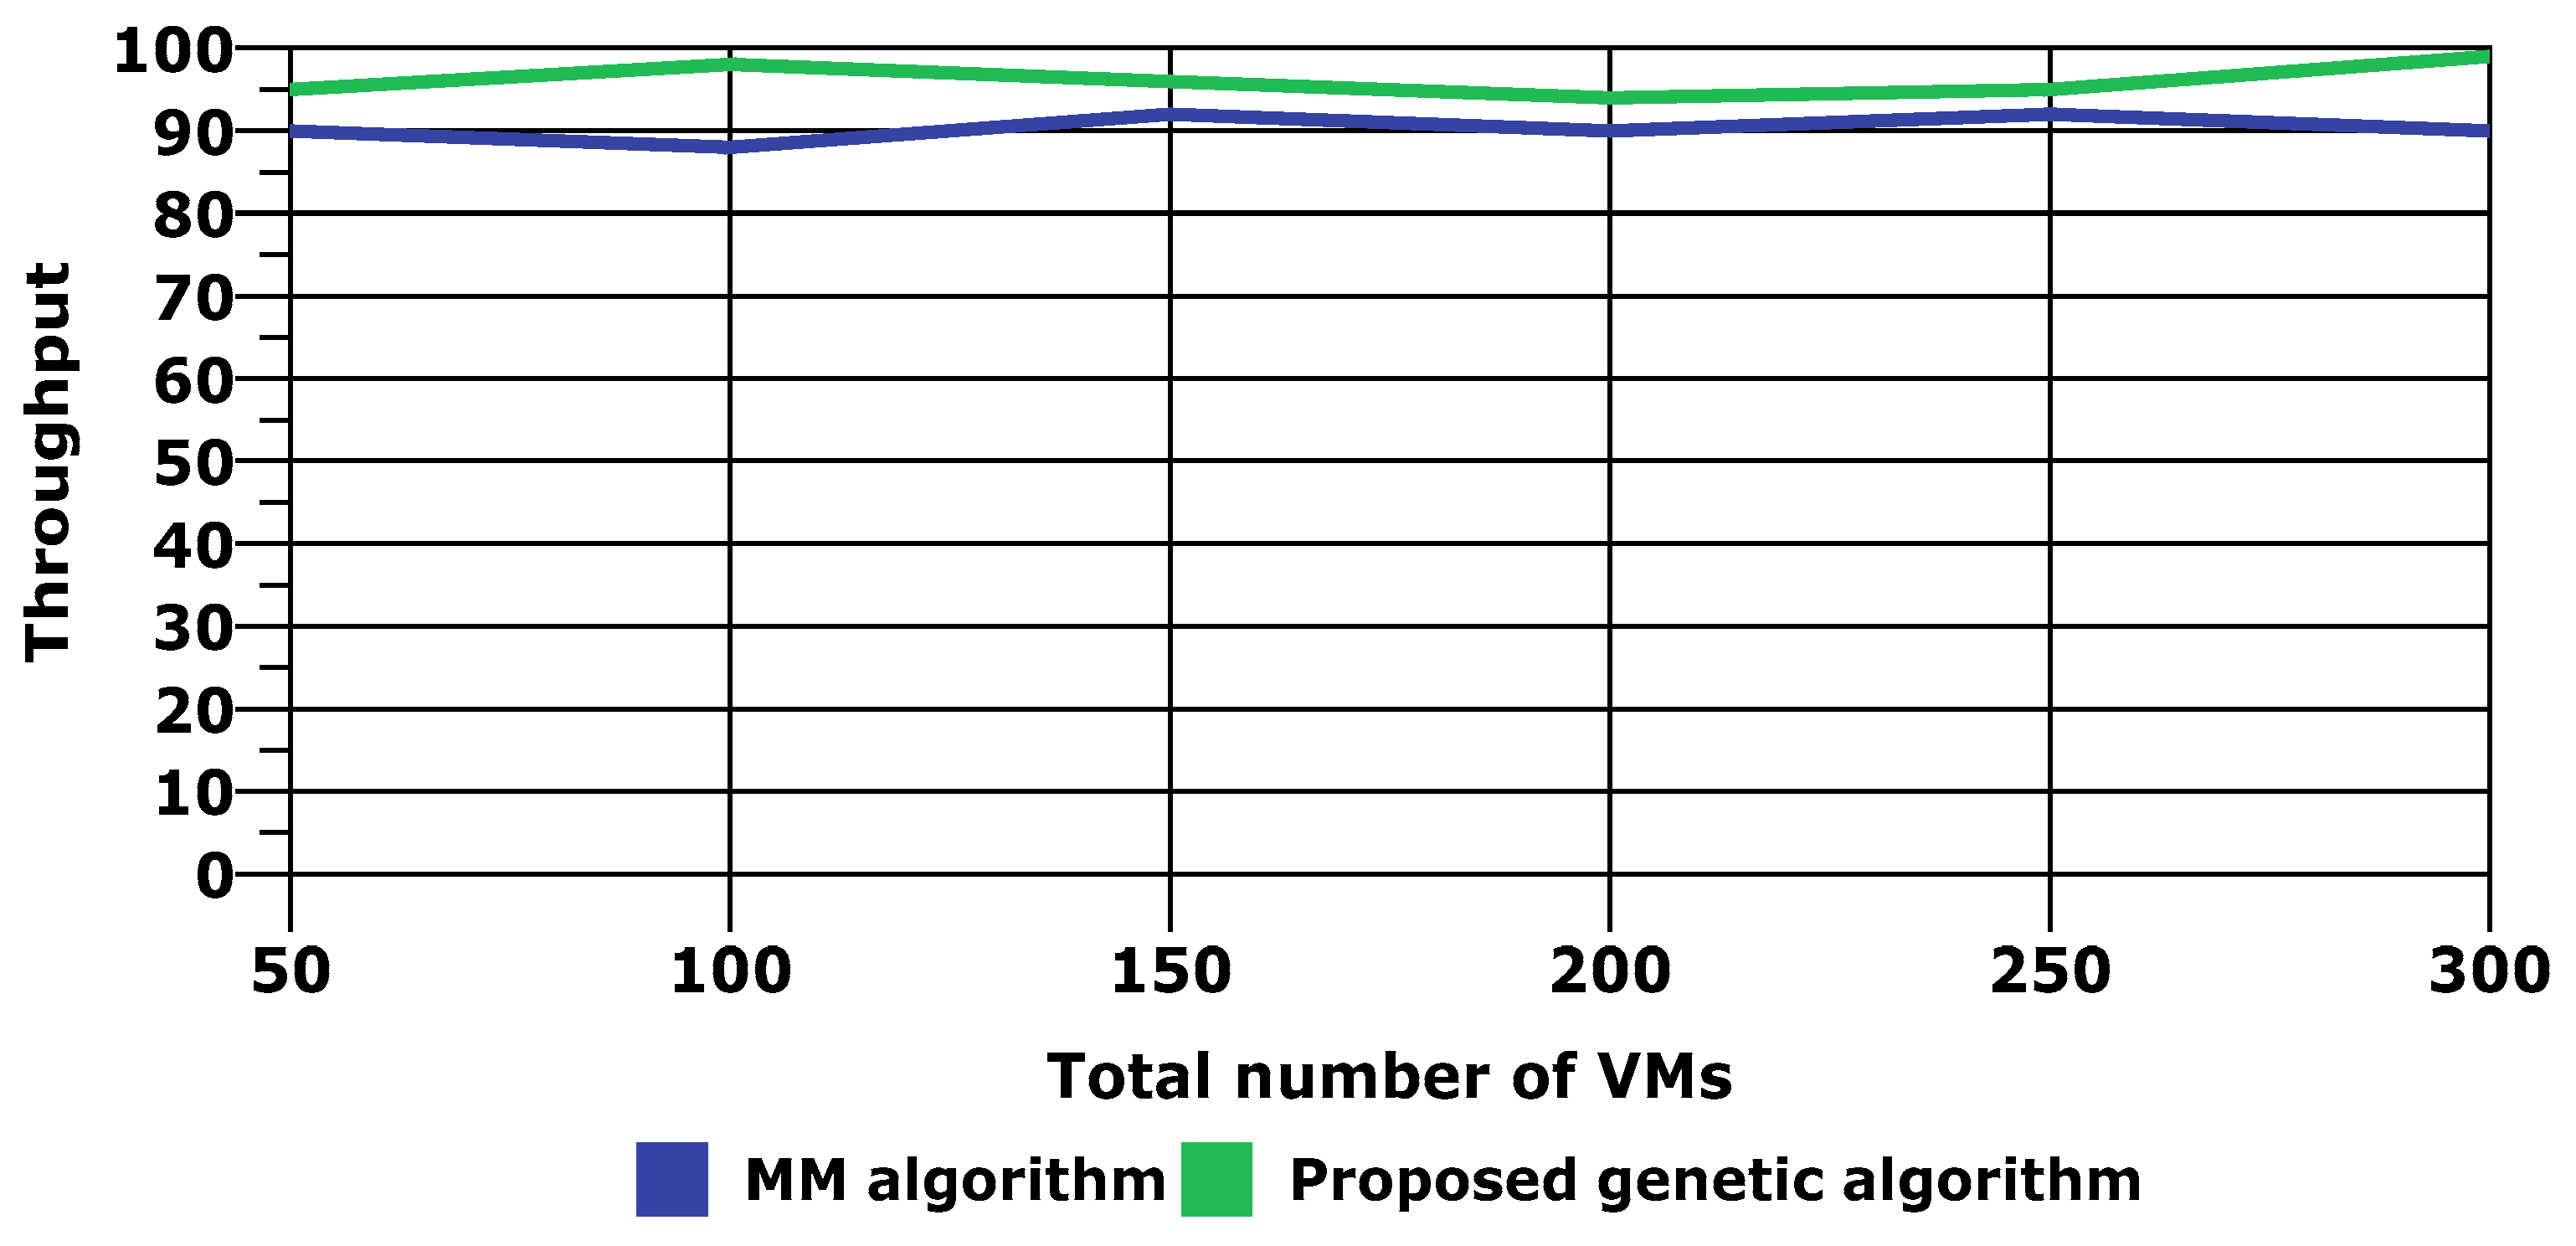
Figure 8.
SLA Violation.

Figure 9.
Electric displacement versus electric field D-E diagram.

Table 1.
Percentage improvement with EH-GC over MM algorithm.
| Performance Parameter | Percentage Improvement |
|---|---|
| Energy consumption | 26.64% |
| Throughput | 6% |
| SLA voilation | 76% |
Table 2.
Evaluation results of MCA analysis.
| Evaluation Metrics | Accuracy | False Positive Rate | Detection Rate |
|---|---|---|---|
| Value | 94.15% | 1.30% | 94.90% |
© 2017 by the authors. Licensee MDPI, Basel, Switzerland. This article is an open access article distributed under the terms and conditions of the Creative Commons Attribution (CC BY) license (http://creativecommons.org/licenses/by/4.0/).
Share and Cite
MDPI and ACS Style
Singh, S.; Sharma, P.K.; Moon, S.Y.; Park, J.H. EH-GC: An Efficient and Secure Architecture of Energy Harvesting Green Cloud Infrastructure. Sustainability 2017, 9, 673. https://doi.org/10.3390/su9040673
AMA Style
Singh S, Sharma PK, Moon SY, Park JH. EH-GC: An Efficient and Secure Architecture of Energy Harvesting Green Cloud Infrastructure. Sustainability. 2017; 9(4):673. https://doi.org/10.3390/su9040673
Chicago/Turabian StyleSingh, Saurabh, Pradip Kumar Sharma, Seo Yeon Moon, and Jong Hyuk Park. 2017. "EH-GC: An Efficient and Secure Architecture of Energy Harvesting Green Cloud Infrastructure" Sustainability 9, no. 4: 673. https://doi.org/10.3390/su9040673
Note that from the first issue of 2016, this journal uses article numbers instead of page numbers. See further details here.