
Economic Analysis of a Traceability System for a Two-Level Perishable Food Supply Chain

Academy of Chinese Energy Strategy, China University of Petroleum-Beijing, 18 Fuxue Road, Changping, Beijing 102249, China
Sustainability 2017, 9(5), 682; https://doi.org/10.3390/su9050682
Submission received: 31 March 2017
/
Revised: 21 April 2017
/
Accepted: 21 April 2017
/
Published: 26 April 2017
(This article belongs to the Special Issue Sustainability in Food Supply Chain and Food Industry)
Abstract
:Food waste stemmed from food contamination and ineffective quality control is a significant challenge to food management. Supply chain traceability has become an essential task of the food industry for guaranteeing food quality and safety and reducing food waste. Radio Frequency Identification (RFID) has emerged as a lead technology in the development of traceability systems, which enable automatically capturing of food information along the supply chain. However, the significant investment cost has been a major obstacle in the diffusion of traceability systems in the food industry. This study conducts a cost-benefit analysis of a RFID-enabled traceability system for a two-level perishable food supply chain, which consists of an upstream supplier and a downstream retailer. Consumer perceptions of food quality and safety are jointly considered when evaluating the value of a traceability system. The optimal decisions of the supply chain participants are derived in both centralized and decentralized systems, in terms of wholesale price, order quantity, price markdowns, and granularity level of the traceability system. The results show that a dynamic pricing policy supported by the traceability system could significantly reduce food waste and improve the retailer’s performance. We further propose a two-part tariff contract to coordinate the supply chain and to distribute benefits and costs of the traceability system between supply chain participants. This study demonstrates that a well-developed traceability system could significantly improve the supply chain performance and become a profitable investment for the food industry.
1. Introduction
In the past two decades, food traceability has drawn huge attention due to consumers’ increasing concern over the quality, safety, and environmental sustainability of food products. The European Commission defines food traceability as the ability to trace and follow a food, feed, food-producing animal, or substance intended to be, or expected to be incorporated into a food or feed, through all stages of production, processing, and distribution [1]. Since 1 January 2005, supply chain traceability has become a legal obligation and an essential task for the food industry in the EU [2]. China has also explored the implementation of food traceability systems in order to promote food export and deal with food safety issues [3]. However, the management of perishable food products is still far from satisfactory due to their nature of quality deterioration over time. It is estimated that approximately 33% of the global food product is wasted or lost every year [4]. Specifically, the perishable food loss at grocery retailers is around 15% due to damage and spoilage [5], while the loss of fruits and vegetables is as high as 35% in the transportation process [6]. Ineffective food quality control during the transportation and retailing process as well as food contamination incidents are the main reasons leading to food waste. Severe food waste not only affects the profits of supply chain participants, but also becomes a major challenge to sustainable food supply chains. Consequently, a critical issue is to integrate traceability functions with perishable food supply chain management so as to reduce food waste and improve supply chain performance.
The emerging techniques provide new opportunities for enhancing the efficiency of the traceability systems. Badia-Melis et al. [7] reviewed the technological advancements in food traceability, including Radio Frequency Identification (RFID) and very recent advancements such as chemometrics [8], isotope analysis [9], and DNA analysis [10,11,12]. RFID has emerged as a lead technology in developing food traceability systems during the last decade. RFID is widely used for product identification and for gathering information of products automatically. Its technology is based on wireless communication between a tag attached to an object (RFID tag) and an interrogator (RFID reader) [13]. The RFID tags embed specific sensors (such as temperature, humidity) that enable the automatic capture of related data that are critical to the quality and the safety of food (such as history of temperature, humidity, and time period), thus providing the managing system with a real-time description of the state of the perishable food [14]. Using the RFID monitoring system, the operator can make decisions to prevent damage when something abnormal occurs during the transportation process, such as withdrawal of non-consumable food and avoidance of traffic jams [15]. The retailers can utilize the dynamically identified food quality information to support the dynamic pricing decision, such as price markdowns when food approaches expiration dates [16].
Despite the great advantages, the traceability system also imposes a considerable cost on the supplier and the retailer. The cost of RFID tags and the significant initial investment to build up the traceability infrastructures are major obstacles in the diffusion of RFID-enabled traceability systems in supply chain management [17]. Recently, Meyer et al. [18] pointed out that the gradual reduction of RFID costs made it possible to track and trace not only high value products but also cheap ones like fruits and vegetables. However, cost remains one of the major barriers for RFID implementation. Therefore, the trade-off between the investment costs and the benefits derived from real-time traceability becomes a crucial issue for the decision maker. Moreover, traceability also affects supply chain structure because a successful and efficient traceability system requires coordination among all participants of the supply chain [19]. Consequently, a key economic question is who bears the costs and who reaps the benefits of such a traceability system.
This paper aims to conduct an economic analysis for a perishable food supply chain in consideration of the RFID traceability system. The profits generated by the use of a RFID traceability system have been considered in comparison to supply chain profits when the traceability system is not adopted. A distribution scheme of the benefits and costs of the traceability system among participants has been proposed to synchronize their activities in the supply chain.
2. Literature Review
During the last decade, RFID-enabled food traceability systems have been given considerable attention. Many studies have developed traceability frameworks based on RFID technology and demonstrated the advantages of such traceability systems in various food supply chains. Regattieri et al. [20] provided a general framework for the traceability of food products and proposed a traceability system for cheese products based on alphanumeric codes and RFID technology. They highlighted that RFID enables an effective traceability system and RFID tag costs reduction would produce widespread diffusion of RFID applications in food traceability. Abad et al. [21] developed a traceability system using RFID tags with embedded temperature and relative humidity sensors for an intercontinental fresh fish logistic chain from South Africa to Europe. Their study validated that the traceability system not only helps to improve the competitiveness and logistics management of the fish/food companies, but also reinforces the confidence of the consumers. Farooq et al. [22] proposed an ePedigree (electronic pedigree) traceability system based on the integration of RFID technology (to track food products), sensor networks (to monitor food conditions), and ePedigree concept (to combat counterfeit products). They found the ePedigree traceability system could efficiently monitor and control agricultural food quality and prevent the distribution of counterfeit food products. Barge et al. [23] presented an item-level RFID traceability system for a high value, pressed, long-ripened cheese. They investigated the effectiveness of RFID technology by experimenting with different techniques of RFID tags to verify their reading performance and system reliability. Another RFID-based framework is suggested by Qian et al. [24], incorporating RFID technology and 2D barcodes, to validate a traceability system for a wheat flour mill in China. The above studies focused on how to develop food traceability systems for various food products. However, they did not include a cost-benefit analysis to verify the potential added value of traceability to the participants, which is of vital importance for the introduction of a traceability system in food supply chains.
There have been few quantitative research studies that identify the benefits of traceability systems to supply chain participants. Recently, Gautam et al. [25] considered a case of kiwifruit traceability from growers to cool-stores with RFID tags. They proposed a multi-objective integer non-linear programming model to allocate the optimum pack-houses and cool-stores such that the delivery took place with minimized transportation costs and minimized liability costs on the occurrence of contamination. They found the traceability system to be an efficient tool for reducing the loss in value of perishable products during the transportation process. Aiello et al. [2] also evaluated the expected value of a RFID-enabled traceability system in the transportation process, in terms of traceability allowing proper selection of the destination of food products based on their remaining quality. Their results confirmed the importance of determining the optimal granularity level of a traceability system through a cost-benefit analysis. Wang and Li [26] analyzed the value of a traceability system from a retailer’s perspective. They investigated the retailer’s benefits from having accurate product shelf life information provided by a RFID-based traceability system. A dynamic pricing policy based on dynamically identified food shelf life was proposed in their work. Most of the previous research found on traceability systems tends to focus on traceability either in the transportation process or in the retailing process, thereby largely neglecting to investigate the value of traceability from a supply chain framework. It has been pointed out that a traceability system should be discussed and implemented at the entire supply chain and that the activities of all participants should be synchronized to realize its greatest benefits [14]. Hence, we consider a two-level supply chain consisting of a supplier and a retailer, and evaluate the value of traceability in both the transportation process and the retailing process. The decision-making mechanism in a supply chain framework is especially important, as the supplier and retailer must decide which traceability level to implement (i.e., granularity level [27]), and how the costs and benefits should be distributed between them.
The importance of quality and safety of perishable food has been widely remarked upon by the literature. Quality has been considered to be a key factor influencing consumers’ purchasing decisions. Empirical studies have found that consumers are sensitive to the freshness of perishable food and usually give a lower valuation to expiring food [28]. Therefore, previous studies dealing with the deterioration of product quality over time have usually assumed quality dependent demand [29,30]. Food safety is a factor that is different from food quality and is difficult to observe. However, few studies have modelled consumer perceptions of food safety. A food product that appears to be of high quality may be unsafe because it might be contaminated with toxic chemicals, undetected pathogenic organisms, or physical hazards [31]. In recent years, consumer awareness of food safety has been heightened due to a sequence of food contamination incidents [22]. The implementation of a traceability system efficiently improves food safety by tracing and tracking food along the supply chain. Even though traceability by itself cannot produce safer or higher-quality products, it acts as a monitoring system providing real-time information and offering early detection and faster response to abnormal accidents. Lu et al. [32] investigated consumer perceptions of food safety and found that consumers from different countries are willing to pay a premium for food that is traceable. Jin et al. [33] showed that Chinese consumers are willing to pay for food traceability systems that provide safety certificates and detailed information about chemical pesticides used in food production. Since safety is another key element of consumer perceptions of food and linked to purchasing decisions [34], we specifically consider the demand promotion by food safety improvement. The benefit of traceability systems is evaluated both from quality and safety perspectives.
The contribution of this paper is threefold: (i) an economic analysis of the traceability system is first conducted in a two-level supply chain framework, including both the transportation and retailing process; (ii) a profit sharing scheme is proposed for the distribution of benefits and costs of a traceability system among supply chain participants; (iii) consumer perceptions of food quality and safety are jointly considered when evaluating the value of traceability system. The rest of this paper is organized as follows. The degradation model of perishable foods, the demand of consumers, and the price markdown policy of retailers are described in Section 3. In Section 4, the optimal decisions of supply chain participants in the decentralized system are presented in terms of order quantity, wholesale price, price markdown rate, and granularity level. In Section 5, the optimal decisions in the centralized system are presented and a two-part tariff contract is proposed to coordinate the supplier-retailer decentralized system. A numerical example is illustrated in Section 6 to show the benefit of the traceability system and to provide some managerial insights. Finally, this paper is summarized in Section 7.
3. Problem Description
We investigate the following problem: A retailer purchases from a supplier a type of fresh food that is prone to deterioration during transportation and retailing. A RFID-based traceability system is implemented in the supply chain, where all transport packages are RFID tagged before they leave the supplier’s inventory. The supplier is responsible for transporting the perishable food, but the delivery time is unstable due to the influences of random factors (such as transportation congestion and bad weather). Moreover, many environmental stresses influence the transportation process, such as extreme temperatures or moisture [35], leading to the variation in quality of foods as they arrive at the retail store.
3.1. Model of Food Degradation
The mathematical models used to describe the quality degradation of perishable products have been presented by many authors [36,37]. These models describe how the quality of perishable products varies with environmental conditions and over different time periods. One of the widely-used models for prediction of food degradation was addressed by Labuza [38] as follows:
where represents the quality of the perishable food, represents the degradation rate, and represents the chemical order of the reaction. Note that n = 0 represents the case when the quality decays linearly at a constant rate. A survey by Tsiros and Heilman [28] revealed that consumers’ willingness to pay decreases linearly through the shelf life for food with relative lower Product Quality Risk (PQR) (such as fresh fruits and vegetables) and exponentially for food with relatively higher PQR (such as pork and chicken). Pawsey [39] proposed a linear model to estimate the quality degradation of fresh vegetables. This study focuses on the case of fresh fruits and vegetables, and therefore utilizes the following linear quality deterioration equations:
where is the deterioration rate of the food, is the initial quality when the food product reaches the supplier, and is the quality when the food product arrives at the retailer.
3.2. Demand Function
The price, quality, and safety of perishable foods all impact on consumer perceptions of food and link to purchasing decisions. Therefore, we assume consumers’ demand depends on price, quality, and safety. One of the most important issues in the implementation of traceability systems is the traceability level to implement and the cost of the traceability system. We define as granularity level of the traceability system, which can also be considered as the investment effort for food safety, since consumer perceptions of food safety level mainly come from the traceability level. The demand function can be expressed in the following additive form:
A is the market scale parameter, , , and are all nonnegative constant parameters, representing price elasticity, demand sensitivity to quality, and demand expansion effectiveness to safety, respectively. The cost of the investment is given by , where is an investment parameter. This quadratic assumption is widely used in the literature to describe the decreasing returns of investment [40,41].
3.3. Food Transportation
Transportation is considered to be the most crucial step in the food supply chain from farm to fork due to the potential stresses affecting the products during the shipment process [42]. The variable is denoted as the delivery time, which is assumed to be a continuous random variable with the expectation of . Changes in packaging time and the long transport distance usually lead to unstable timing of deliveries. In this situation, the supplier makes his wholesale price policy as follows: before the transportation process, he determines a basic wholesale price corresponding to the committed delivery time ; when the food product arrives at the retailer, he then sets the actual wholesale price w based on the realized delivery time . is a decreasing function of , which can be expressed as
where is the flexible rate of price changing per unit time. In the case of delivery delay, is a compensation rate to the retailer for the extent of food deterioration; when the delivery time is shorter than the committed time, is a compensation rate to the supplier for providing fresher food.
3.4. Dynamic Pricing
Dynamic pricing is one of the most crucial issues in the field of perishable food management. In practice, it is common to sell deteriorated items at a discount price to influence the consumer’s buying behavior and to minimize the spoilage waste. However, frequent changing of prices over time is impractical in reality. A common approach employed in retail stores is to mark down the price of perishable food products several times when they approach their expiration dates. For example, Home Plus (one of the leading supermarkets in Korea) marks down the fresh fruit two or three times in their daily operations and offers the same markdown rate for each price changing (the markdown rate may differ for different goods). A RFID-enabled traceability system monitors parameters that are critical to the quality of food and provides information for evaluating product shelf life. Based on this real-time product shelf life information, the retailer thus determines the markdown rate to optimize her profit.
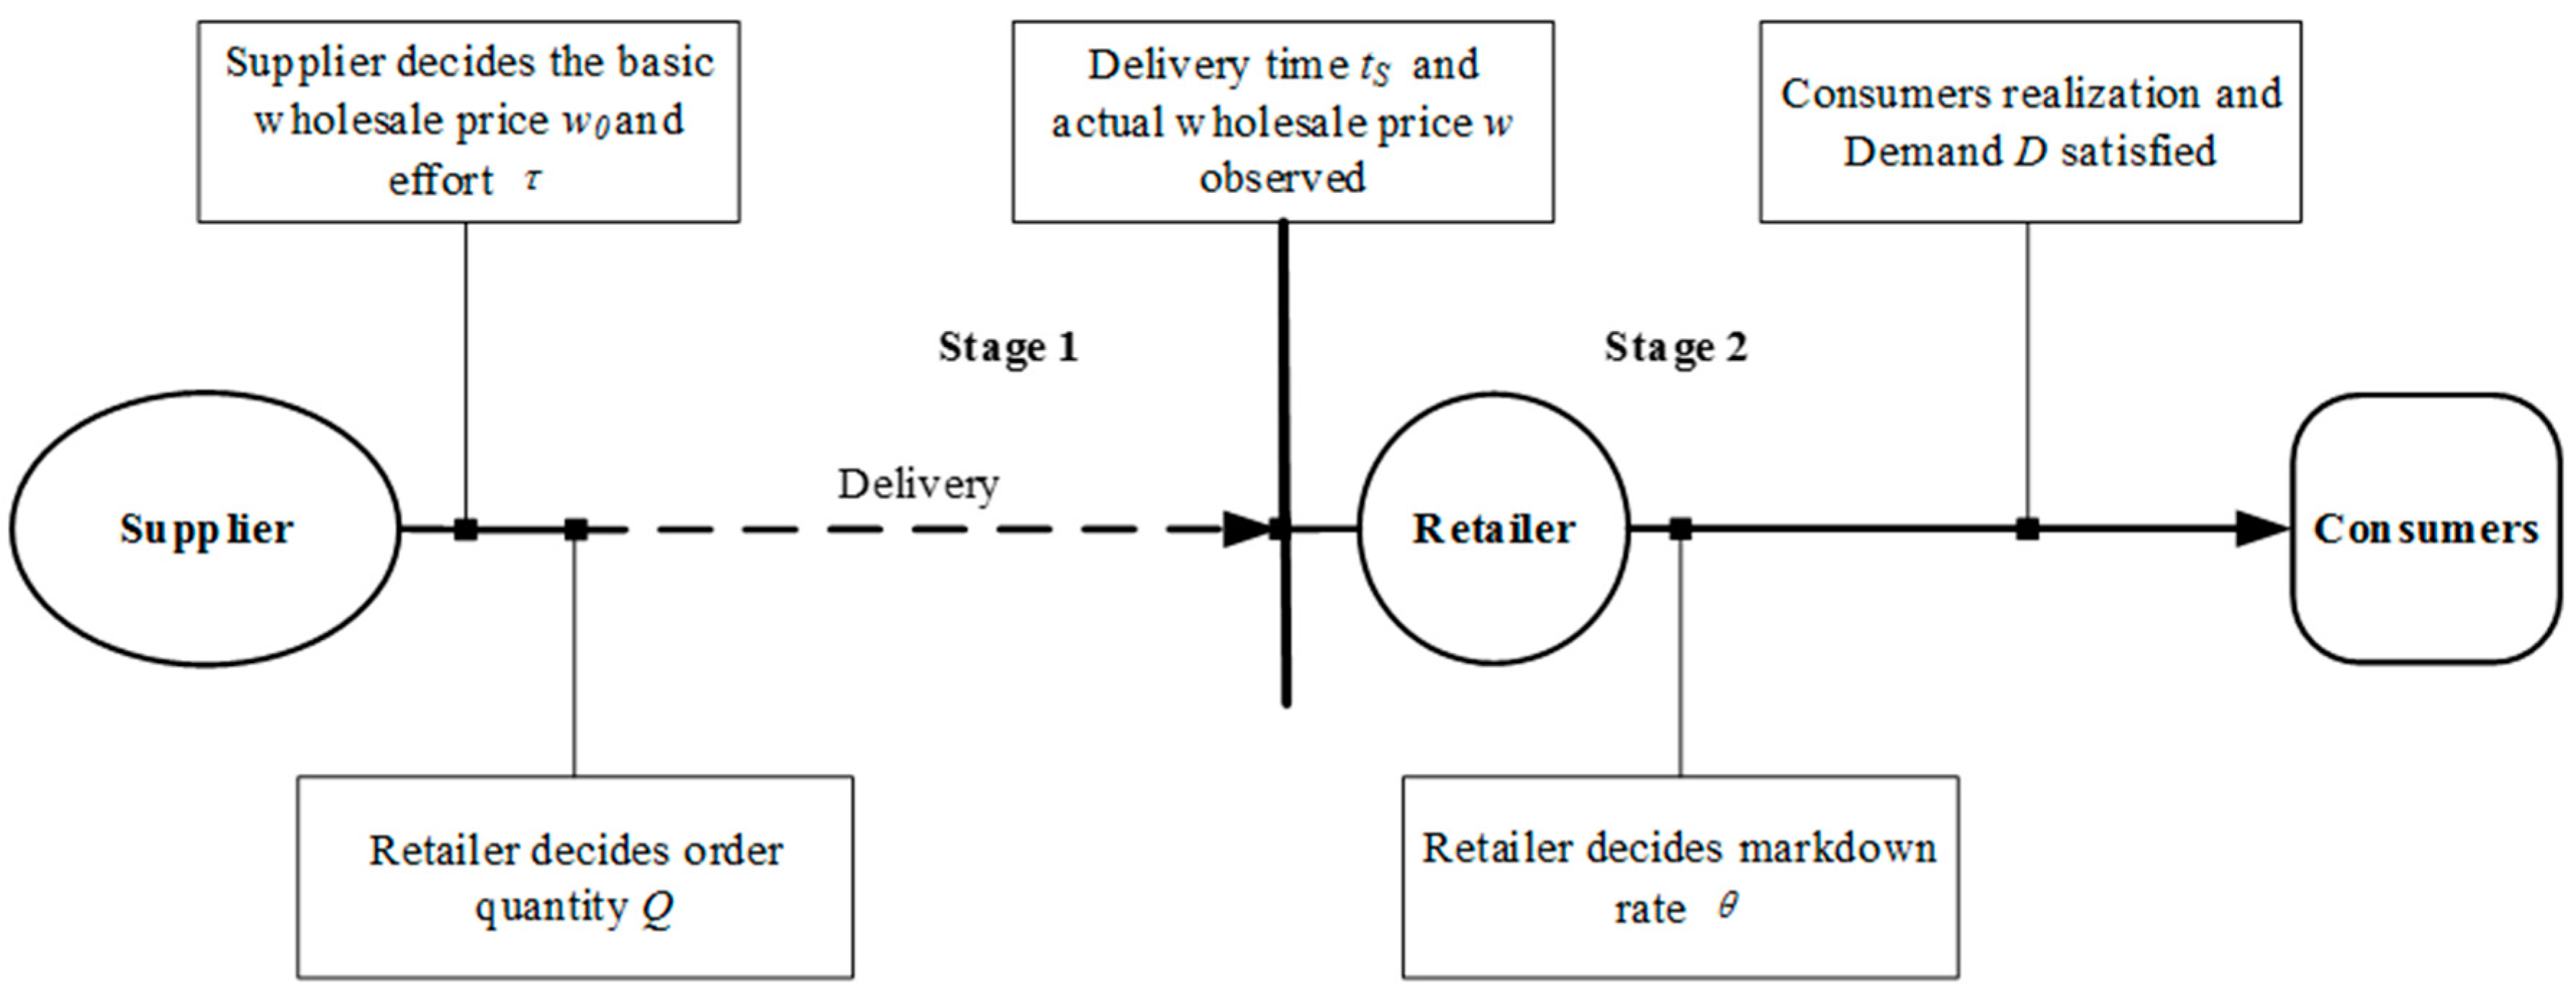
The sequence of events is shown in Figure 1. In the first stage before transportation, the supplier jointly determines the basic wholesale price and the granularity level , whereas the retailer determines the order quantity . Then the supplier proceeds to deliver the food product. In the second stage, the food product arrives at the retailer after time , then the actual wholesale price is observed. Finally, the retailer sets the markdown rate based on the quality of food.
We consider two types of supply chain structures: a decentralized supply chain, where the supplier acts as the leader and the two parties individually maximize their own profits; and a centralized supply chain, where decisions are made by the channel agent to maximize the supply chain’s total profit.
For ease of reference, we summarize the notations as follows.
| Symbol | Description |
| Demand function | |
| Nonnegative demand parameter representing the market potential | |
| Nonnegative coefficient representing the demand sensitivity to price | |
| Nonnegative coefficient representing the demand sensitivity to food quality | |
| Nonnegative coefficient representing the demand expansion effectiveness to food safety | |
| T | The length of selling period |
| t | Selling time in the retail store with |
| tS | Actual delivery time of food from the supplier to the retailer |
| t0 | Committed delivery time |
| k | Flexible rate per unit time if the actual delivery time differs from the committed delivery time |
| Value deterioration parameter | |
| Initial quality when the food product reaches the supplier | |
| p0 | Exogenous initial retail price |
| c | Purchasing cost per item per period |
| Investment parameter for the traceability system | |
| Expected profit | |
| Decision variables | |
| Price markdown rate of the retailer | |
| Q | Order quantity of the retailer |
| w0 | Basic wholesale price of the supplier before the food product is delivered |
| Granularity level of the traceability system | |
Throughout the remainder of this study, superscripts are used to indicate the concerned supply chain level (S, supplier; R, retailer; SC, supply chain), and subscripts are used to distinguish different supply chain structures (D, decentralized system; C, centralized system; Co, supply chain coordination).
4. Optimal Decisions in the Decentralized System
In this section, we investigate the optimal decisions for the supplier and the retailer in a decentralized system and solve this problem in a backward order. Firstly, we characterize the markdown rate of the retailer, given any realization of delivery time , the order quantity , the basic wholesale price , and the granularity level . Secondly, the optimal order quantity is investigated, given an arbitrary basic wholesale price and granularity level . Finally, we will derive the supplier’s joint optimal decisions on the basic wholesale price and the granularity level , using the response function of the retailer.
4.1. Optimal Decisions of the Retailer
The retailer faces a two-stage decision problem. In the second stage, the purchased food is delivered to the retailer, thus the delivery time and the corresponding wholesale price are observed, and are known as well.
Theorem 1.
For given , , , and realization of and , the retailer determines the markdown rate as
where are denoted for ease of exposition.
Proof.
Assume that the retailer applies the same markdown rate for number of price markdowns, which is
Given an exogenous initial retail price , the ith markdown price can be expressed as
Then the demand Function (4) becomes
for , where and .
The demand in the ith price markdown period can be derived as:
Hence the demand over period can be expressed as
From Equation (11), we derive the optimal markdown rate . ☐
Then we consider the optimal order quantity of the retailer. For any given basic wholesale price and granularity level , the retailer’s expected profit can be expressed as
where is the expectation of the actual wholesale price .
Theorem 2.
For any given basic wholesale price and granularity level , the optimal order quantity of the retailer is given by
where and are denoted for ease of exposition.
Proof.
Taking the first- and second-derivatives of with respect to , we have
Therefore, is strictly concave in , and that maximizes is determined by the first-order condition. ☐
4.2. Optimal Decisions of the Supplier
The supplier, as the game leader, jointly determines the basic wholesale price and granularity level . After the delivery is realized, the actual wholesale price is determined based on the delivery time .
Theorem 3.
For , the basic wholesale price and granularity level are given by
Proof.
The supplier’s expected profit is
Substituting Equation (13) into the above equation, we derive the first-order derivative of with respect to and , respectively.
The second-order derivative of with respect to and is given by
So the determinant is
For , the Hessian Matrix is negative definite, indicating that the supplier’s profit function is jointly concave in and . From the first-order condition, we get
Substituting the value of into the value of , we get
Substituting into the value of , we get
Substituting into Equation (5), we obtain the optimal basic wholesale price . ☐
5. Optimal Decisions in the Centralized System
In the literature of supply chain coordination, numerous coordination mechanisms have been developed to motivate the participants to act cooperatively, such that the profit of the channel can achieve the level of the centralized system. In order to coordinate the decentralized system, we first evaluate the case of the centralized system.
5.1. Optimal Decisions of the Supply Chain
In the centralized system, the supplier and retailer act as a single entity with a common objective of maximizing the system’s profit. Therefore, the wholesale price w becomes an internal parameter. The channel agent faces a two-stage problem of deciding the markdown rate in the second stage, and deciding the order quantity and in the first stage.
The expected profit of the channel is
Similar to Section 3, the optimal decisions can also be derived in a backward order. We obtain the following results.
Theorem 4.
For a given , the channel agent determines the markdown rate as
where the optimal order quantity is given by
The proof of Theorem 4 is similar to that of Theorems 1 and 2 and thereby omitted.
Theorem 5.
In the centralized system, the granularity level on the traceability system is given by
Proof.
Substituting Equation (31) into Equation (29), the expected profit function of the channel is expressed as
We then derive the second-order derivative of with respect to , which is
Equation (34) shows that is concave in . From the first-order condition, we obtain . ☐
5.2. Supply Chain Coordination
In the decentralized system, the supplier bears the risk that the food deteriorates in the delivery process as well as the risk of random delivery times. As a consequence, to coordinate the supply chain, the retailer should share some risks by providing appropriate compensation schemes. Moreover, there usually exists a one-sided free-rider problem when adopting RFID technology in supply chain management. The reason is that, once RFID tags are attached on the products by the upstream supplier, the downstream retailer can benefit from RFID without any variable cost. Hence, from the supplier’s perspective, he may have no incentive to adopt RFID due to its high costs. In this situation, it is necessary for the retailer to provide extra compensation payment to the supplier in order to enable the implementation of RFID along the supply chain. The extra compensation payment distributes the benefits from the traceability system among supply chain participants.
We propose a two-part tariff contract [39,43,44] to coordinate the perishable food supply chain. Under the two-part tariff contract, in addition to the wholesale price , an extra payment is provided by the retailer to motivate the supplier to cooperate. Therefore, the expected profit functions for the retailer and the supplier become
Theorem 6.
Under the decentralized system, if the supplier sets the wholesale price equal to , while the retailer agrees to give the supplier a compensation such that and , then the supply chain coordination is achieved.
Proof.
Similar to Theorem 2, taking the first-order derivative of with respect to , we then obtain the optimal order quantity
By coordination, the optimal decisions in the centralized system should be adopted, so that the channel profit loss due to incoordination can be eliminated and both parties are better off.
Substituting the value of and into the above equation, we get . Note that if the order quantity is the same as that of the centralized system, the markdown rate will also be identical for any realization of . Substituting , , , and in Equations (35) and (36), we get and . depends on the bargaining powers of the two parties, provides the upper bound of while provides the lower bound of . Both of the two parties are better off after coordination. ☐
6. Numerical Analysis
In this section, we illustrate a numerical example to show the critical importance of the traceability system to supply chain participants, and a conduct sensitivity analysis with respect to the system parameters to provide managerial insights for the perishable food supply chain.
6.1. Benefits of The Traceability System to the Retailer
We make an example of a perishable food product that has a 72 h selling period in a retail store. The input parameters are set as , , , , , , , , , and in appropriate unit [26,45].
For retailers, food traceability represents an added value that is mainly related to the use of a dynamic pricing policy based on real-time shelf life information. In order to demonstrate the expected benefits of the traceability system to the retailer, we conduct a numerical analysis with three scenarios. The “no discount” scenario represents the current practice without food traceability and price markdowns, which serves as a benchmark for analysis. While the other two scenarios illustrate different pricing policies adopting a food traceability plan. As shown in Table 1, the performance of the traceability system is evaluated by comparison of the retailer’s profits in three scenarios. The “markdown twice” scenario outperforms the others by conducting two markdowns, which are provided at and , respectively. In comparison with the current practice, the retailer’s profit increases by 10.05% and 12.33% for the “markdown once” and “markdown twice” scenarios, respectively, which shows critical importance of traceability system to the retailer.
The increased profit is mainly contributed by the raised demand under the price markdown policy. Figure 2 shows how the price markdown in discrete time affects food demand with quality deterioration. The demand promotion with one markdown is 24.8% and achieves 34.7% with two markdowns. Due to the deterioration nature of perishable food, its demand decreases over time. As such, excessive inventories have to be thrown away after the expiration date, which is a waste of food and a loss for the retailer. Therefore, a dynamic pricing policy supported by the traceability system can significantly improve the retailer’s performance in the perishable food supply chain.
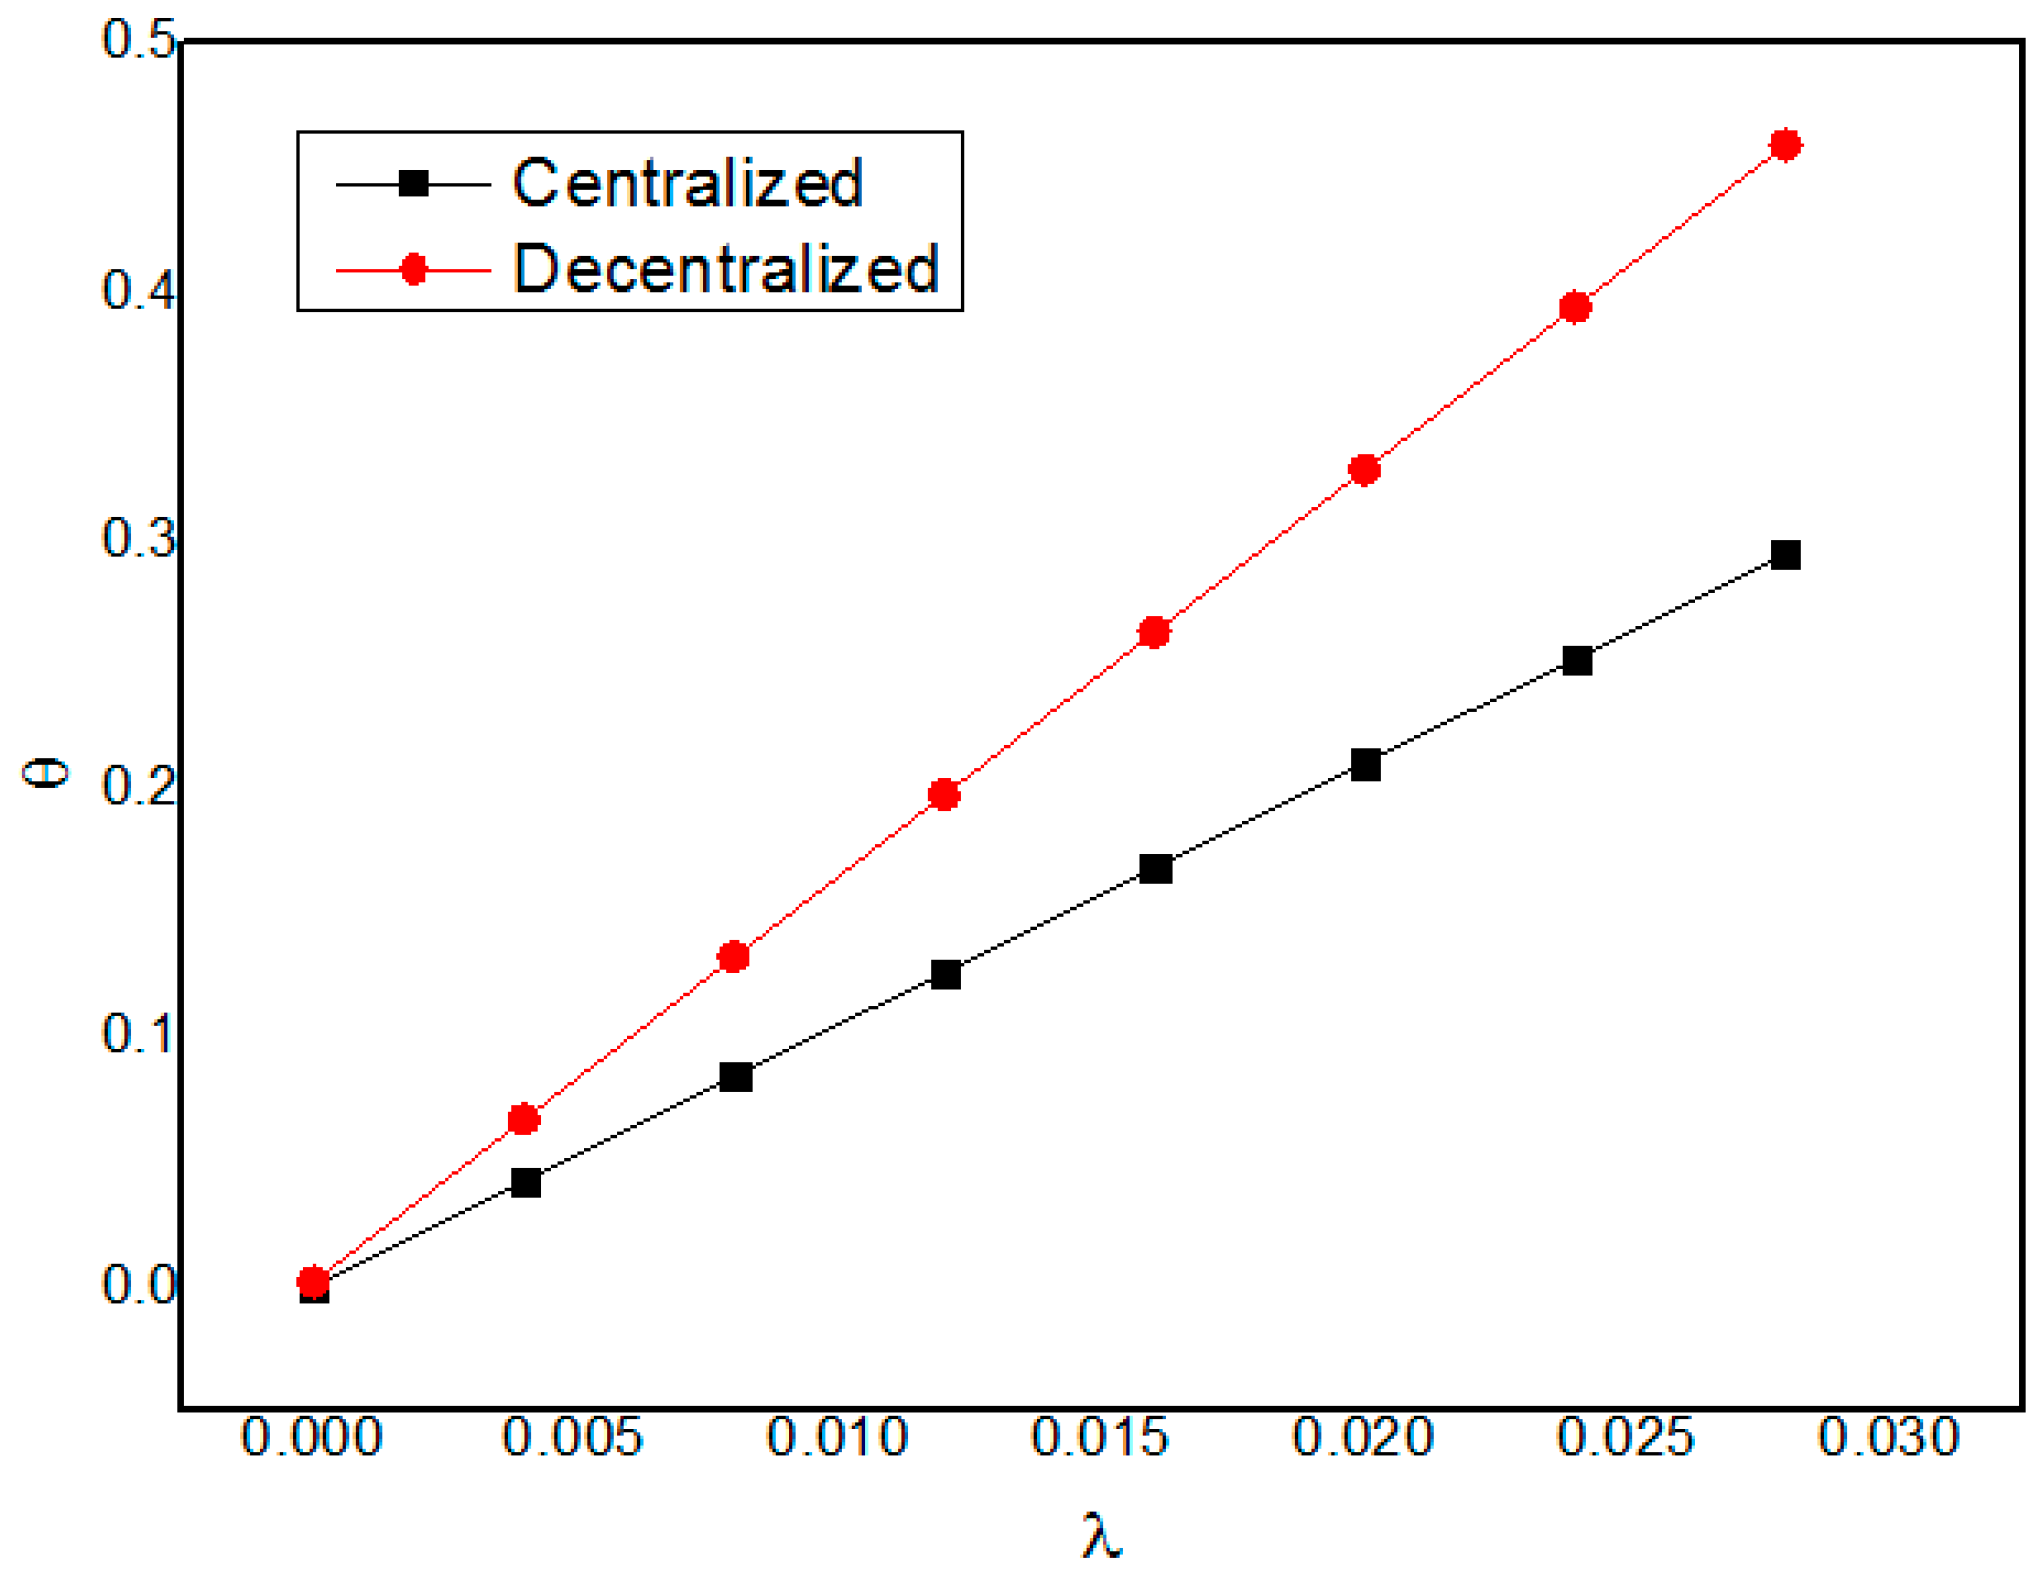
The optimal pricing policy is affected by the deterioration rate of the product. Figure 3 shows a positive relationship between the deterioration rate of food and the corresponding markdown rate. This result is consistent with general intuition: when a product is prone to a high deterioration rate, the retailer often provides a high discount rate as it approaches the expiration date in order to minimize food waste. For example, retailers often offer a sale on bananas with a certain degree of ripeness so as to sell them before they ripen even further. Figure 2 also shows that θ = 0 when λ = 0, i.e., the non-perishable product is sold at a constant price without any discount, which is the common situation unless there is a sales promotion. Note that the centralized supply chain conducts a lower discount rate in comparison with the decentralized supply chain.
6.2. Benefits of the Traceability System to the Supplier
For successful implementation of the traceability system, it is crucial to evaluate the benefit of traceability accessed by the supplier. From the supplier’s perspective, the food traceability system is considered a tool to guarantee food policy requirements and to preserve food quality and safety. With the traceability system, accurate time-temperature profiles can be dynamically monitored when food products are delivered from the supplier to the retailer, thus the supplier is able to control the temperature and minimize the deterioration rate of the food product.
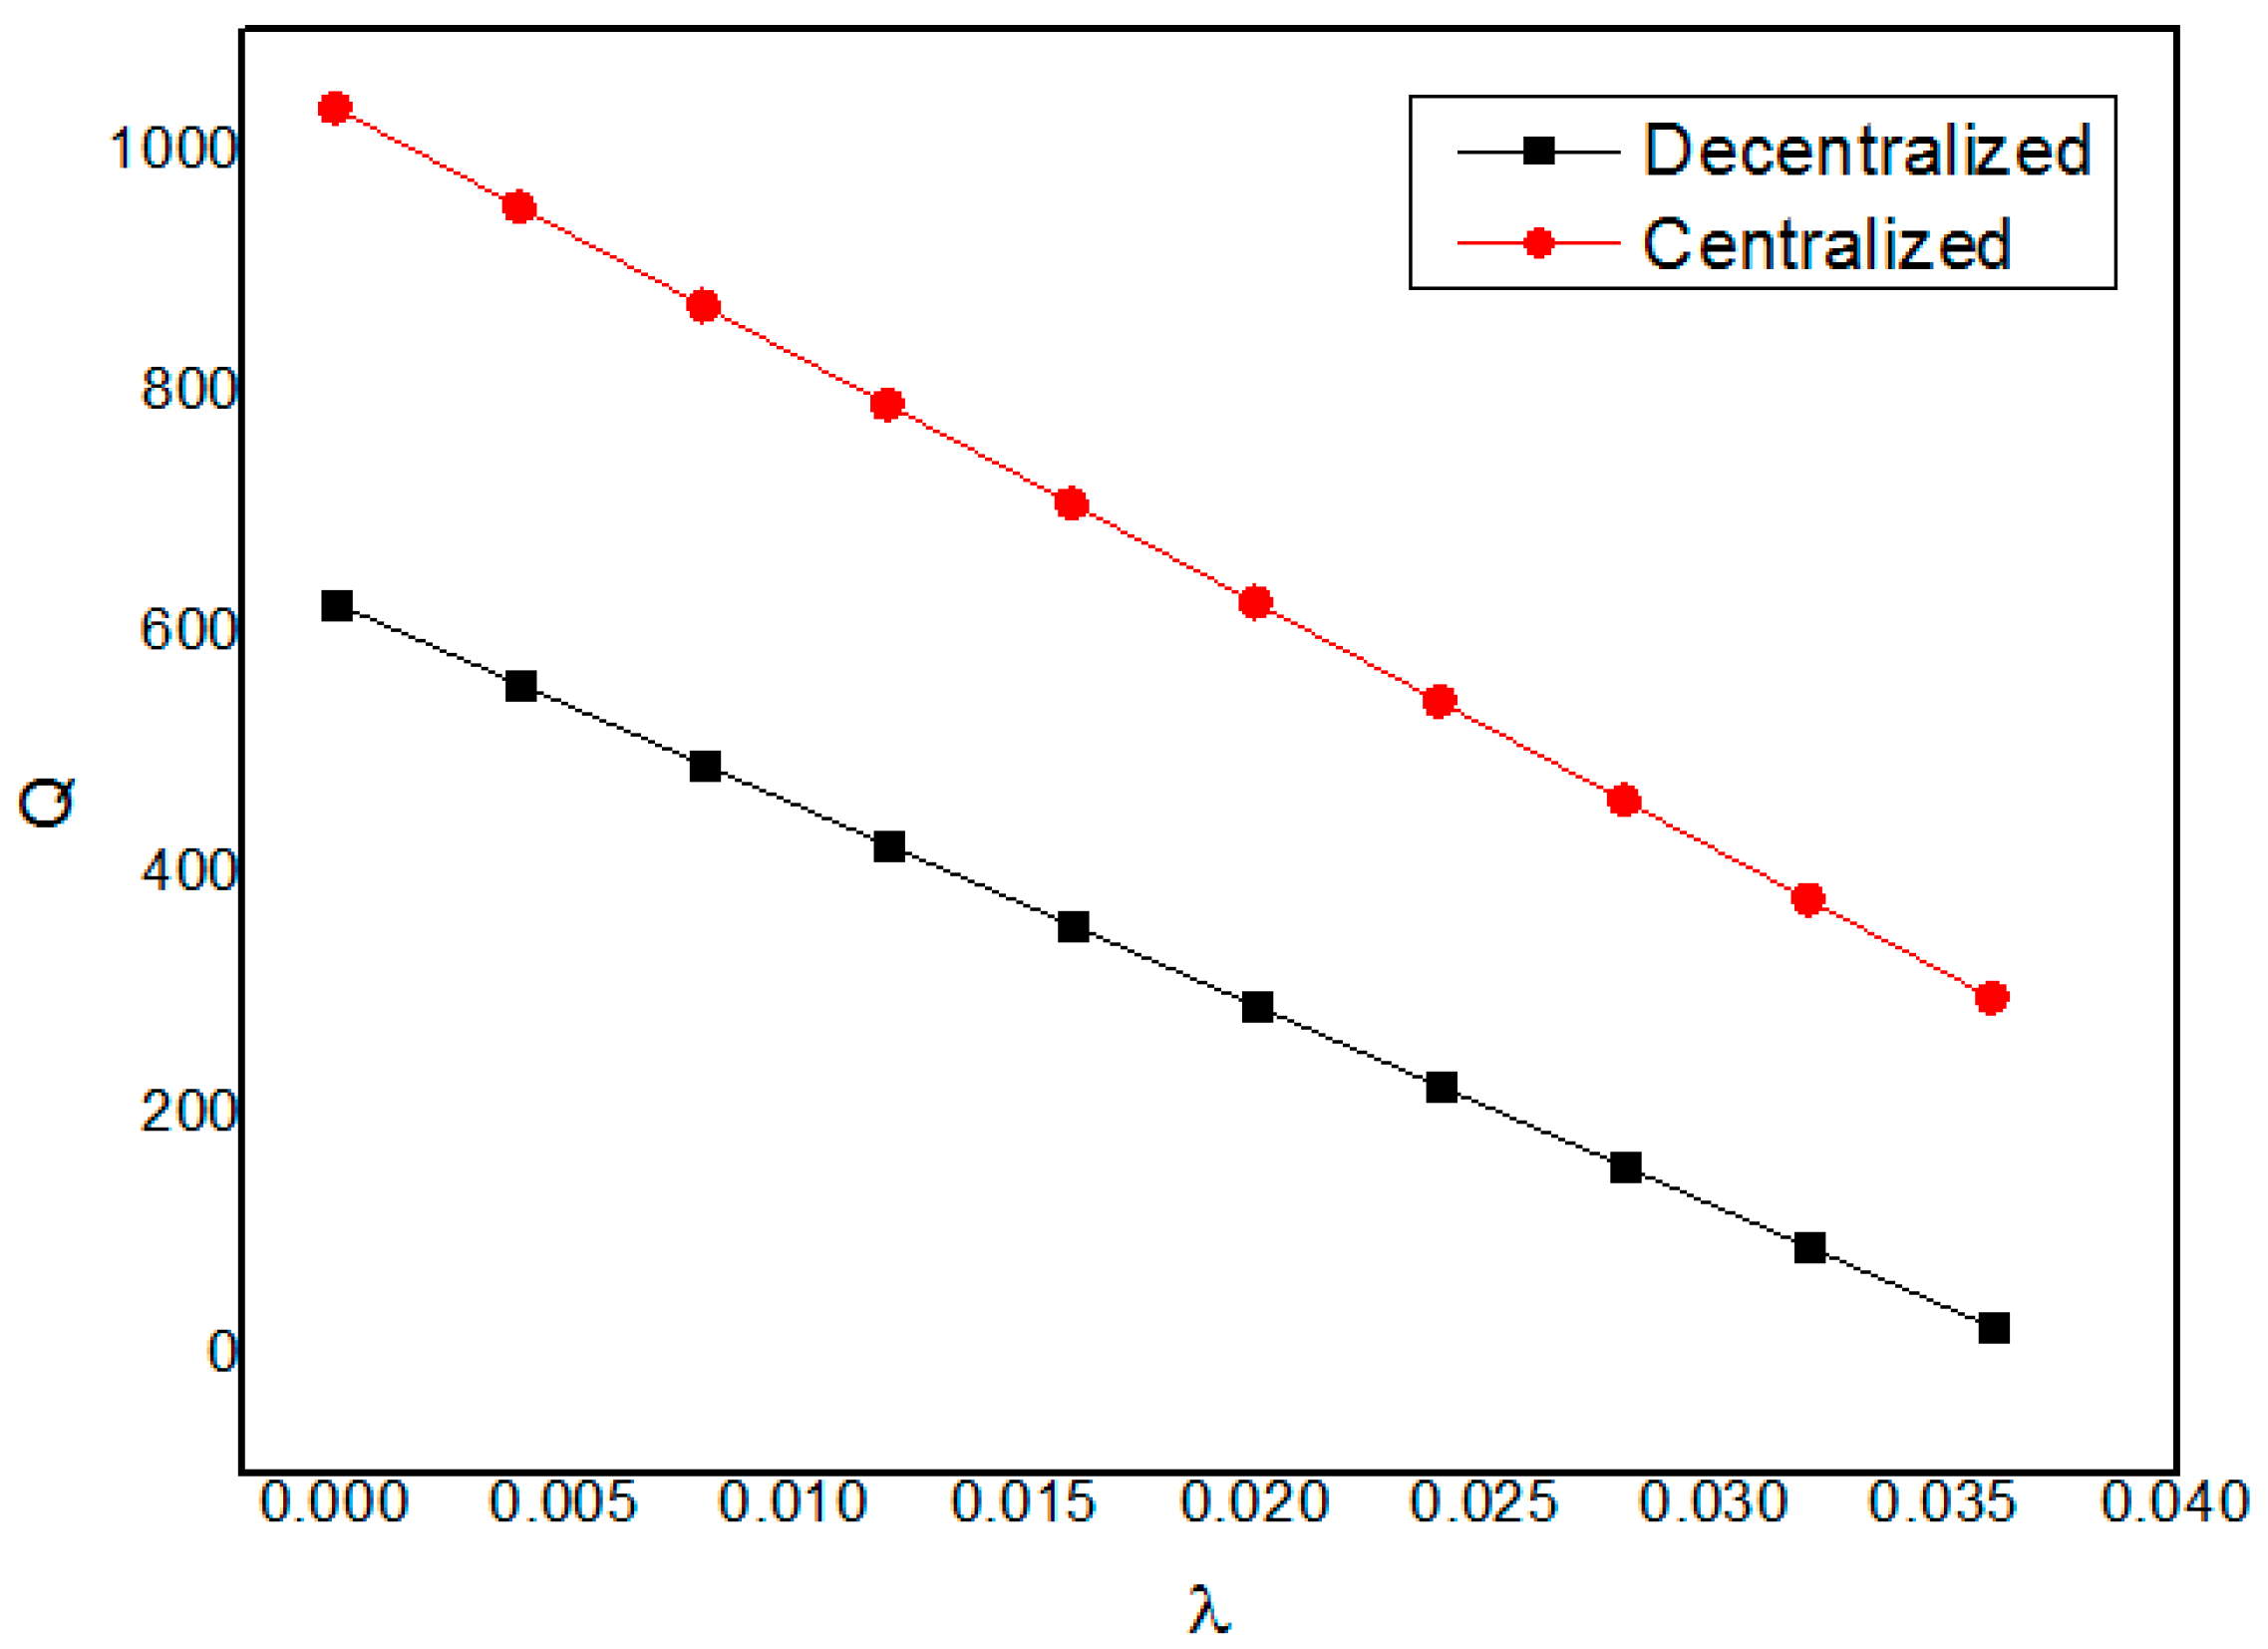
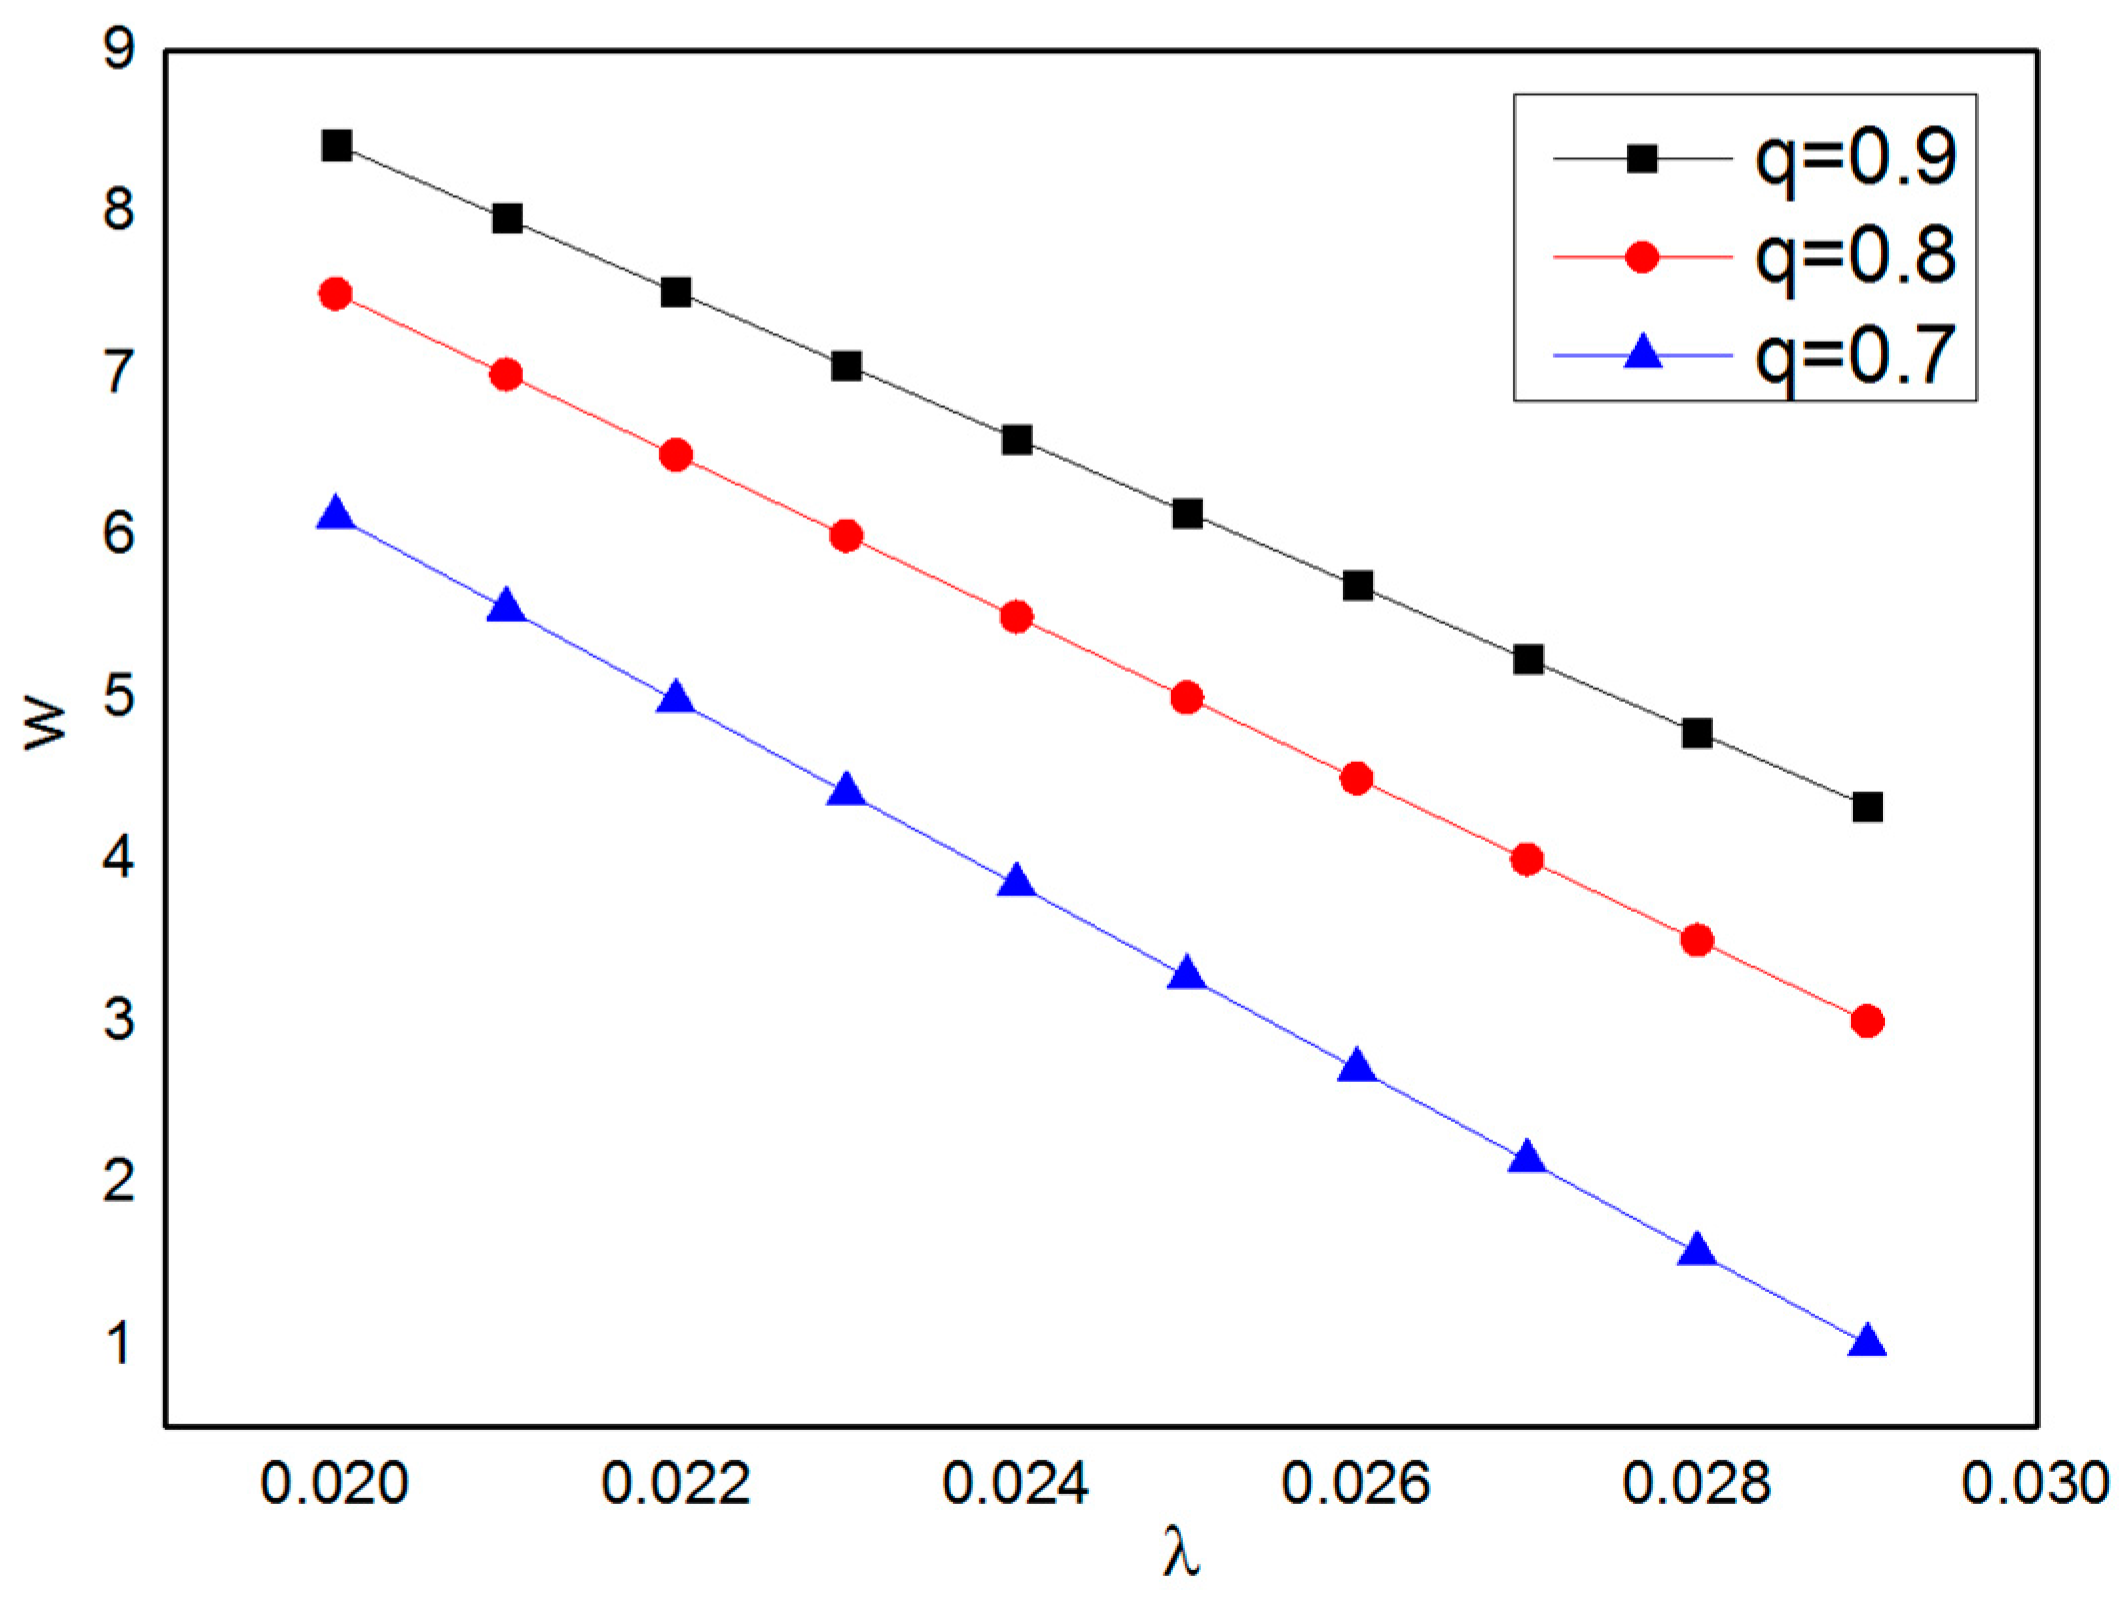
Our numerical analysis shows that the deterioration rate has a negative relationship with the supplier’s wholesale price (Figure 4) and the order quantity from the retailer (Figure 5). Since the supplier’s profit mainly depends on the wholesale price as well as the order quantity, these results demonstrate the significant effect of deterioration rate minimization on the supplier’s profit. We define to represent the quality status of the food product when it reaches the retailer. A high value of means a high level of product quality. As shown in Figure 4, the supplier can take advantage of the well traced and monitored quality with a high wholesale price. Figure 5 shows that the supplier’s enhanced ability to mimimize deterioration rates also stimulates the retailer to order more.
6.3. Benefits of the Traceability System to the Supplier
From the consumers’ perspective, the traceability system represents an added value that is mainly related to safety guarantees of the food product. Hence, the implementation and benefits of the traceability system also depend on the consumers’ awareness of food safety.
Table 2 reveals that when consumers have greater awareness of food safety issues, the supplier expends more efforts on the traceability system, and the retailers are motivated to order more. is the channel profit difference between the centralized system and the decentralized system. Table 2 shows that the loss of channel profit due to incoordination also increases with consumers’ awareness of food safety, indicating that the participants in the decentralized system are more likely to cooperate when consumers are more willing to pay for food that is more likely to be safe from safety issues.
7. Conclusions
There is an increasing requirement for a traceability system that provides transparent information regarding the quality and safety of food supply chains. The information provided by traceability systems is of vital importance in reducing food waste throughout supply chains. RFID has emerged as a lead technology in the development of traceability systems and has been widely used to detect real-time food quality deterioration and food contamination incidents. This paper conducted a cost-benefit analysis of a RFID-enabled traceability system for perishable food supply chains, and proposed a decision-making mechanism and profit sharing scheme between supply chain participants. The profits of supply chain participants with a traceability system were obtained in both centralized and decentralized systems.
Our analytical and numerical results showed that a well implemented traceability system not only satisfies legal requirements, but it can also become a profitable investment for the food supply chain. Some managerial insights for supply chain participants were provided. First, a dynamic pricing policy supported by the traceability system could promote demand and reduce food waste and hence significantly improve the retailer’s performance. Second, the deterioration rate minimization ability of the traceability system was the most important factor affecting the supplier’s profit. Third, incremental profits were greater when deploying the traceability system under a centralized supply chain in comparison to those under a decentralized supply chain. We also found that the greatest benefit of food traceability could be realized when it was implemented at the entire supply chain level and engaged all the participants involved. We thereby provided a profit sharing mechanism to facilitate coordination among supply chain participants. The results showed that participants are more likely to cooperate with each other when consumers have greater awareness of food safety.
Acknowledgments
The work was supported by Science Foundation of China University of Petroleum, Beijing (No. 2462014YJRC036). This work was also supported by Ministry of Education in China (MOE) Project of Humanities and Social Sciences (Project No. 15YJC630195).
Conflicts of Interest
The author declares no conflict of interest.
References
- European Commission. European Commission Regulation No 178/2002 of the European Parliament and the Council of 28. Off. J. Eur. Commun. Available online: http://ec.europa.eu/economy_finance/publications/pages/publication1719_en.pdf (accessed on 20 February 2017).
- Aiello, G.; Enea, M.; Muriana, C. The expected value of the traceability information. Eur. J. Oper. Res. 2015, 244, 176–186. [Google Scholar] [CrossRef]
- Feng, J.; Fu, Z.; Wang, Z.; Xu, M.; Zhang, X. Development and evaluation on a RFID-based traceability system for cattle/beef quality safety in China. Food Contr. 2013, 31, 314–325. [Google Scholar] [CrossRef]
- Gustavsson, J.; Cederberg, C.; Sonesson, U.; van Otterdijk, R.; Meybeck, A. Global Food Losses and Food Waste. Available online: http://www.fao.org/docrep/014/mb060e/mb060e00.pdf (accessed on 20 February 2017).
- Ferguson, M.; Ketzenberg, M.E. Information sharing to improve retail product freshness of perishables. Prod. Oper. Manag. 2006, 15, 57–73. [Google Scholar]
- Göbel, C.; Langen, N.; Blumenthal, A.; Teitscheid, P.; Ritter, G. Cutting food waste through cooperation along the food supply chain. Sustainability 2015, 7, 1429–1445. [Google Scholar] [CrossRef]
- Badia-Melis, R.; Mishra, P.; Ruiz-García, L. Food traceability: New trends and recent advances. A Review. Food Contr. 2015, 57, 393–401. [Google Scholar] [CrossRef]
- Cozzolino, D. An overview of the use of infrared spectroscopy and chemometrics in authenticity and traceability of cereals. Food Res. Int. 2014, 60, 262–265. [Google Scholar] [CrossRef]
- Zhao, Y.; Zhang, B.; Chen, G.; Chen, A.; Yang, S.; Ye, Z. Recent developments in application of stable isotope analysis on agro-product authenticity and traceability. Food Chem. 2014, 145, 300–305. [Google Scholar] [CrossRef] [PubMed]
- Pasqualone, A.; Montemurro, C.; di Rienzo, V.; Summo, C.; Paradiso, V.M.; Caponio, F. Evolution and perspectives of cultivar identification and traceability from tree to oil and table olives by means of DNA markers. J. Sci. Food Agric. 2016, 96, 3642–3657. [Google Scholar] [CrossRef] [PubMed]
- Pasqualone, A. Cultivar identification and varietal traceability in processed foods: A molecular approach. In Cultivars: Chemical Properties, Antioxidant Activities and Health Benefits; Carbone, K., Ed.; Nova Science Publishers: Hauppage, NY, USA, 2013; pp. 83–105. [Google Scholar]
- Pasqualone, A.; Alba, V.; Mangini, G.; Blanco, A.; Montemurro, C. Durum wheat cultivar traceability in PDO Altamura bread by analysis of DNA microsatellites. Eur. Food Res. Technol. 2010, 230, 723–729. [Google Scholar] [CrossRef]
- Bibi, F.; Guillaume, C.; Gontard, N.; Sorli, B. A review: RFID technology having sensing aptitudes for food industry and their contribution to tracking and monitoring of food products. Trends Food Sci. Technol. 2017, 62, 91–103. [Google Scholar] [CrossRef]
- Dabbene, F.; Gay, P.; Tortia, C. Traceability issues in food supply chain management: A review. Biosyst. Eng. 2014, 120, 65–80. [Google Scholar] [CrossRef]
- Wang, L.; Kwok, S.K.; Ip, W.H. A radio frequency identification and sensor-based system for the transportation of food. J. Food Eng. 2010, 101, 120–129. [Google Scholar] [CrossRef]
- Bakker, M.; Riezebos, J.; Teunter, R.H. Review of inventory systems with deterioration since 2001. Eur. J. Oper. Res. 2012, 221, 275–284. [Google Scholar] [CrossRef]
- Manzini, R.; Accorsi, R. The new conceptual framework for food supply chain assessment. J. Food Eng. 2013, 115, 251–263. [Google Scholar] [CrossRef]
- Meyer, G.G.; Främling, K.; Holmström, J. Intelligent products: A survey. Comput. Ind. 2009, 60, 137–148. [Google Scholar] [CrossRef]
- De Souza Monteiro, D.M.; Caswell, J.A. The Economics of Implementing Traceability in Beef Supply Chains: Trends in Major Producing and Trading Countries. Available online: http://dx.doi.org/10.2139/ssrn.560067 (accessed on 25 April 2017).
- Regattieri, A.; Gamberi, M.; Manzini, R. Traceability of food products: General framework and experimental evidence. J. Food Eng. 2007, 81, 347–356. [Google Scholar] [CrossRef]
- Abad, E.; Palacio, F.; Nuin, M.; de Zarate, A.G.; Juarros, A.; Gómez, J.M.; Marco, S. RFID smart tag for traceability and cold chain monitoring of foods: Demonstration in an intercontinental fresh fish logistic chain. J. Food Eng. 2009, 93, 394–399. [Google Scholar] [CrossRef]
- Farooq, U.; Tao, W.; Alfian, G.; Kang, Y.S.; Rhee, J. ePedigree Traceability System for the Agricultural Food Supply Chain to Ensure Consumer Health. Sustainability 2016, 8, 839. [Google Scholar] [CrossRef]
- Barge, P.; Gay, P.; Merlino, V.; Tortia, C. Item-level Radio-Frequency IDentification for the traceability of food products: Application on a dairy product. J. Food Eng. 2014, 125, 119–130. [Google Scholar] [CrossRef]
- Qian, J.P.; Yang, X.T.; Wu, X.M.; Zhao, L.; Fan, B.L.; Xing, B. A traceability system incorporating 2D barcode and RFID technology for wheat flour mills. Comput. Electron. Agric. 2012, 89, 76–85. [Google Scholar] [CrossRef]
- Gautam, R.; Singh, A.; Karthik, K.; Pandey, S.; Scrimgeour, F.; Tiwari, M.K. Traceability using RFID and its formulation for a kiwifruit supply chain. Comput. Ind. Eng. 2017, 103, 46–58. [Google Scholar] [CrossRef]
- Wang, X.; Li, D. A dynamic product quality evaluation based pricing model for perishable food supply chains. Omega 2012, 40, 906–917. [Google Scholar] [CrossRef]
- Karlsen, K.M.; Donnelly, K.A.M.; Olsen, P. Granularity and its importance for traceability in a farmed salmon supply chain. J. Food Eng. 2011, 102, 1–8. [Google Scholar] [CrossRef]
- Tsiros, M.; Heilman, C.M. The effect of expiration dates and perceived risk on purchasing behavior in grocery store perishable categories. J. Market. 2005, 69, 114–129. [Google Scholar] [CrossRef]
- Blackburn, J.; Scudder, G. Supply chain strategies for perishable products: The case of fresh produce. Prod. Oper. Manag. 2009, 18, 129–137. [Google Scholar] [CrossRef]
- Cai, X.; Chen, J.; Xiao, Y.; Xu, X. Optimization and coordination of fresh product supply chains with freshness-keeping effort. Prod. Oper. Manag. 2010, 19, 261–278. [Google Scholar] [CrossRef]
- Aung, M.M.; Chang, Y.S. Traceability in a food supply chain: Safety and quality perspectives. Food Contr. 2014, 39, 172–184. [Google Scholar] [CrossRef]
- Lu, J.; Wu, L.; Wang, S.; Xu, L.; Xu, L. Consumer preference and demand for traceable food attributes. Br. Food J. 2016, 118, 2140–2156. [Google Scholar] [CrossRef]
- Jin, S.; Zhang, Y.; Xu, Y. Amount of information and the willingness of consumers to pay for food traceability in China. Food Contr. 2017, 77, 163–170. [Google Scholar] [CrossRef]
- Van Rijswijk, W.; Frewer, L.J.; Menozzi, D.; Faioli, G. Consumer perceptions of traceability: A cross-national comparison of the associated benefits. Food Qual. Preference 2008, 19, 452–464. [Google Scholar] [CrossRef]
- Accorsi, R.; Manzini, R.; Ferrari, E. A comparison of shipping containers from technical, economic and environmental perspectives. Transp. Res. Part D Transp. Environ. 2014, 26, 52–59. [Google Scholar] [CrossRef]
- Thornley, J.H.M. Mathematical Models in Plant Physiology; Academic Press: London, UK, 1976. [Google Scholar]
- Thornley, J.; France, J. Mathematical Models in Agriculture; Oxford University Press: New York, NY, USA, 2007. [Google Scholar]
- Labuza, T.P. Application of chemical kinetics to deterioration of foods. J. Chem. Educ. 1984, 61, 348–358. [Google Scholar] [CrossRef]
- Pawsey, R.K. Preventing Losses and Preserving Quality in Food Cargoes. Available online: http://www.fao.org/docrep/v9723t/v9723t05.htm (accessed on 20 February 2017).
- Banker, R.D.; Khosla, I.; Sinha, K.K. Quality and competition. Manag. Sci. 1998, 44, 1179–1192. [Google Scholar] [CrossRef]
- Ghosh, D.; Shah, J. A comparative analysis of greening policies across supply chain structures. Int. J. Prod. Econ. 2012, 135, 568–583. [Google Scholar] [CrossRef]
- Manzini, R.; Accorsi, R.; Ayyad, Z.; Bendini, A.; Bortolini, M.; Gamberi, M.; Gallina Toschi, T. Sustainability and quality in the food supply chain. A case study of shipment of edible oils. Br. Food J. 2014, 116, 2069–2090. [Google Scholar] [CrossRef]
- Jeuland, A.P.; Shugan, S.M. Managing channel profits. Market. Sci. 1983, 2, 239–272. [Google Scholar] [CrossRef]
- Moorthy, K.S. Comment-Managing Channel Profits: Comment. Market. Sci. 1987, 6, 375–379. [Google Scholar] [CrossRef]
- Li, D.; Tang, O.; O’Brien, C.; Wang, X. Improve food retail supply chain operations with dynamic pricing and product tracing. Int. J. Serv. Oper. Inform. 2006, 1, 347–362. [Google Scholar] [CrossRef]
Figure 1.
The sequence of events with a RFID-enabled traceability system.

Figure 2.
Demand with different pricing policies.
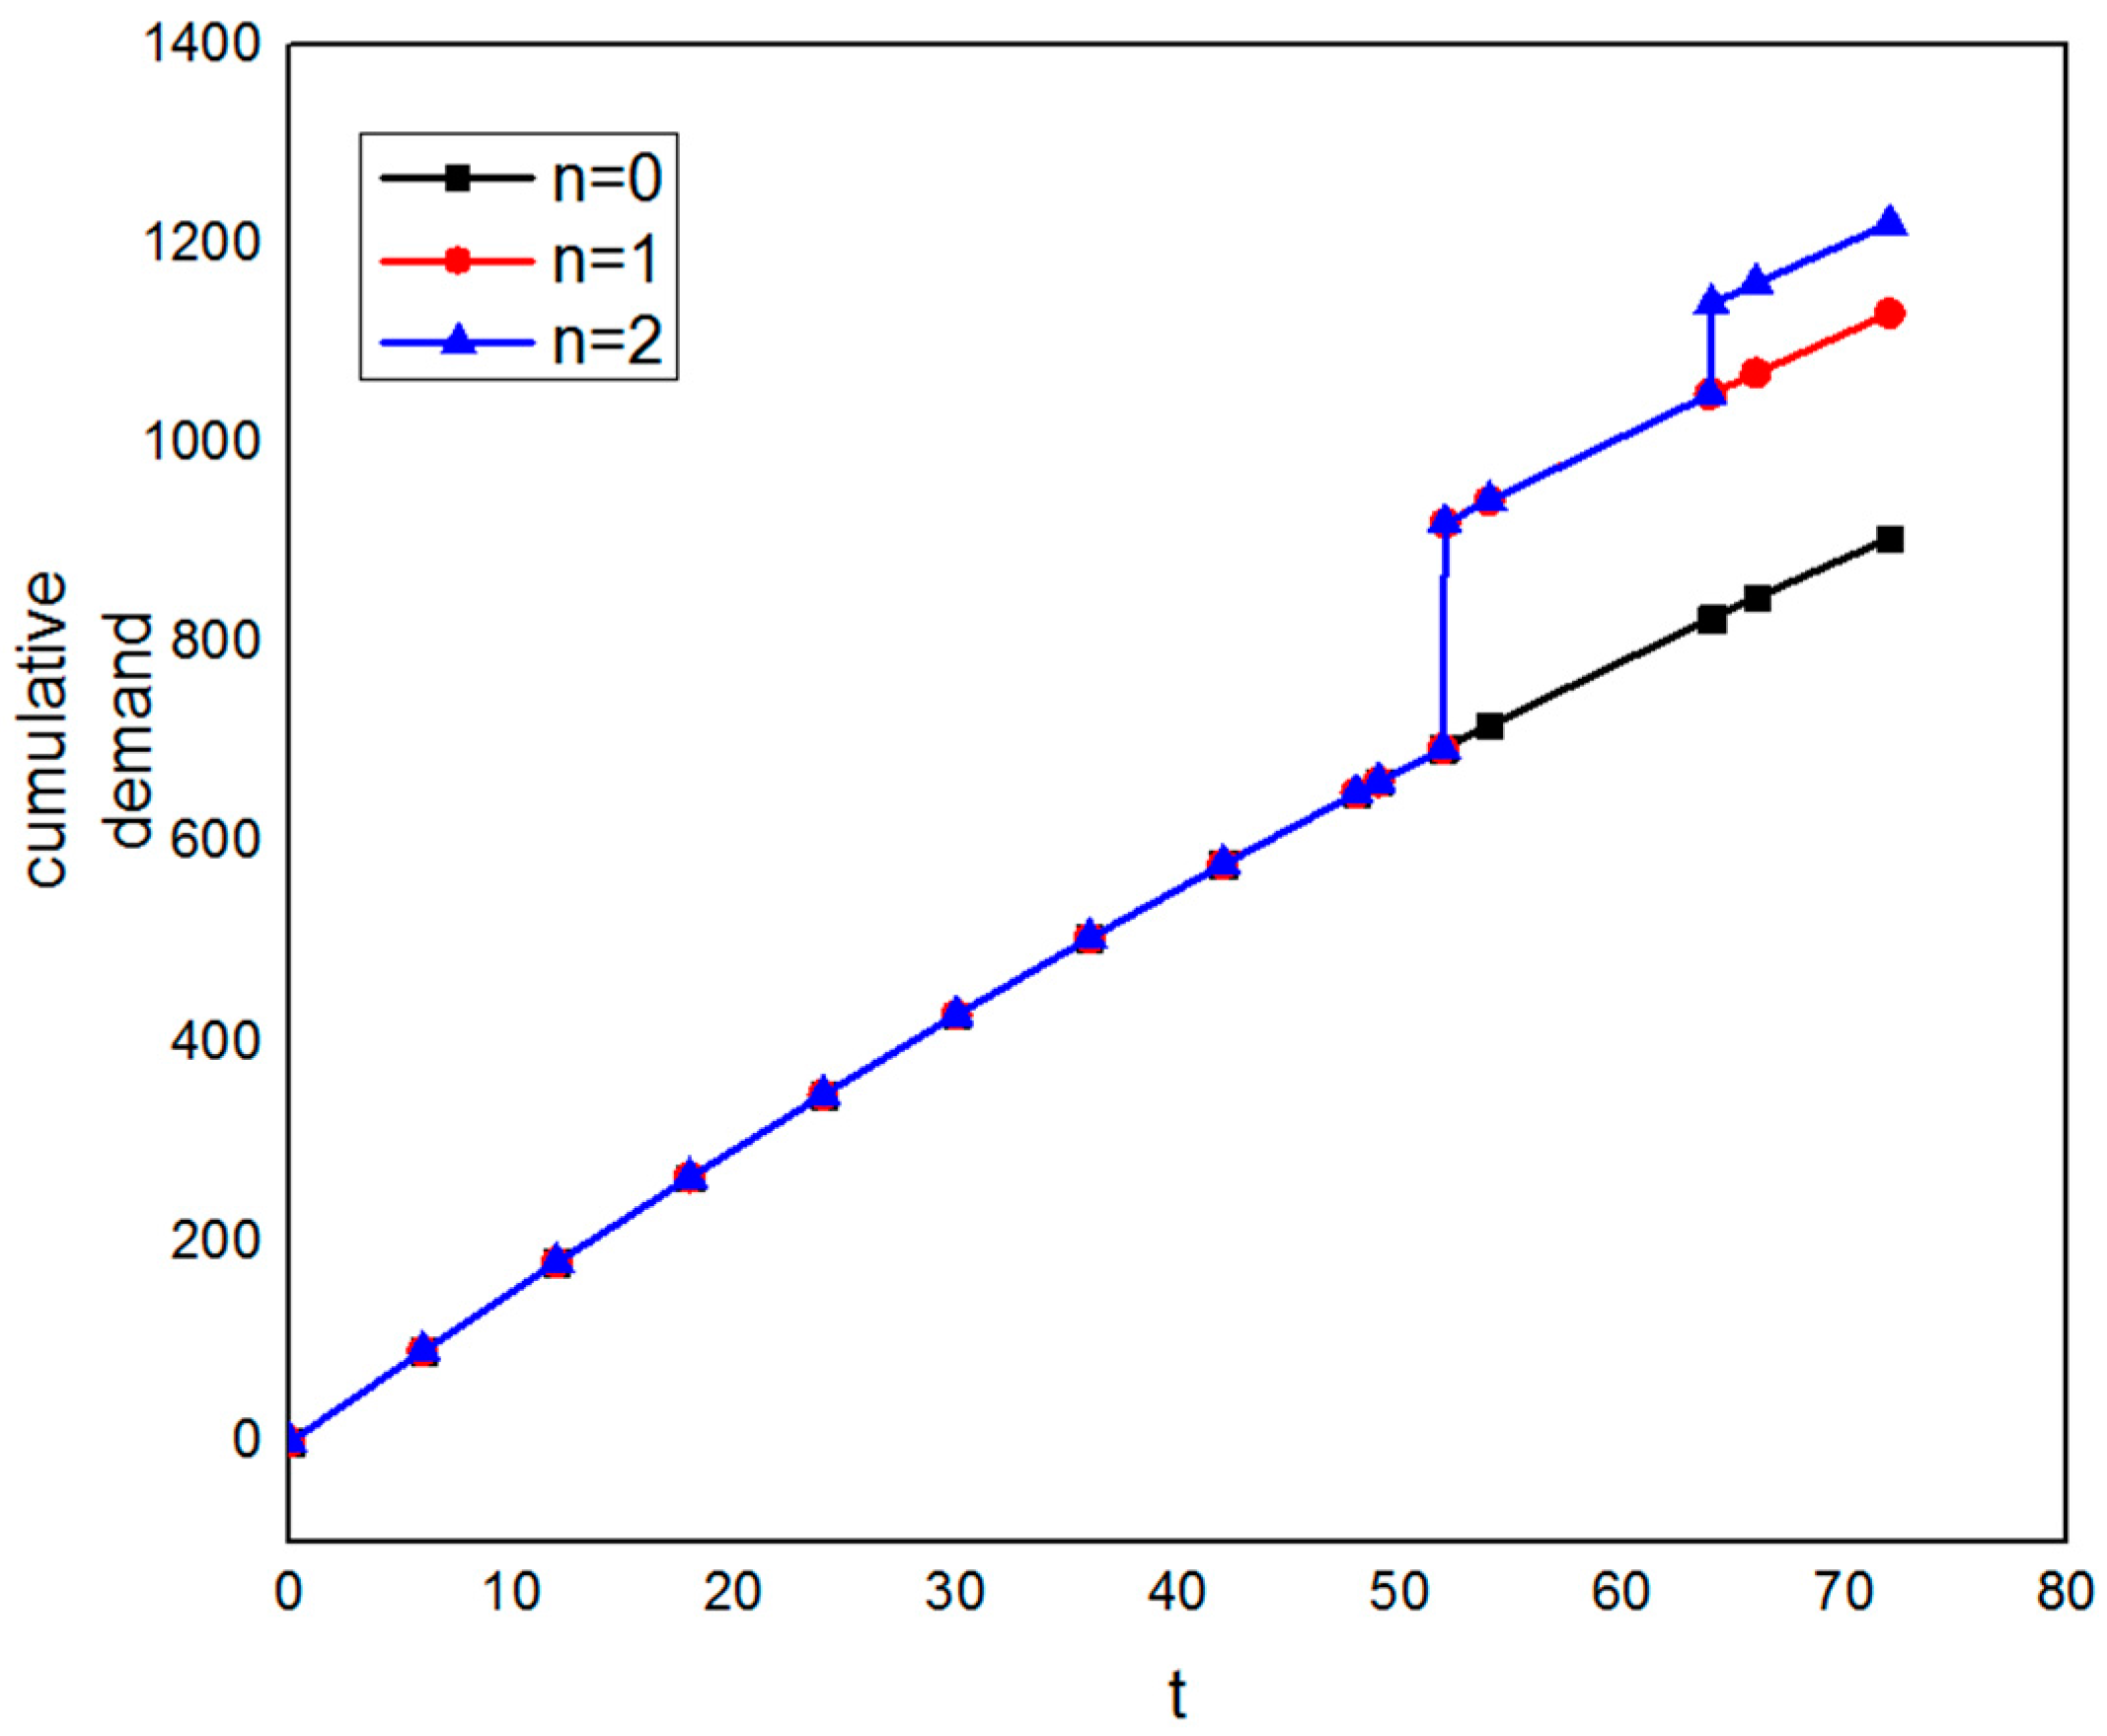
Figure 3.
Markdown rate with respect to deterioration rate .

Figure 4.
Wholesale price with respect to deterioration rate .

Figure 5.
Order quantity with respect to deterioration rate .

Table 1.
Performance of the traceability system.
| Scenarios | Input Parameters | Optimal Markdown Rate | Demand Difference | Profit Difference | ||||
|---|---|---|---|---|---|---|---|---|
| p0 | c | T | T1 | T2 | D% | |||
| No discount | 9 | 3 | 72 | - | - | - | - | - |
| Markdown Once | 9 | 3 | 72 | 52 | - | 22.34% | 24.8% | 10.05% |
| Markdown Twice | 9 | 3 | 72 | 52 | 64 | 21.04% | 34.7% | 12.33% |
Table 2.
Optimal decisions vary with consumers’ awareness of food safety.
| Centralized | Decentralized | |||||
|---|---|---|---|---|---|---|
| 1 | 3.19 | 624.54 | 2.63 | 289.70 | 5.50 | 19.15 |
| 1.1 | 3.22 | 629.61 | 2.69 | 293.13 | 5.58 | 19.68 |
| 1.2 | 3.25 | 634.73 | 2.75 | 296.67 | 5.66 | 20.22 |
| 1.3 | 3.28 | 639.89 | 2.81 | 300.33 | 5.74 | 20.78 |
| 1.4 | 3.31 | 645.10 | 2.87 | 304.12 | 5.83 | 21.35 |
| 1.5 | 3.34 | 650.35 | 2.94 | 308.04 | 5.92 | 21.93 |
| 1.6 | 3.37 | 655.65 | 3.00 | 312.11 | 6.01 | 22.53 |
| 1.7 | 3.40 | 661.00 | 3.07 | 316.32 | 6.10 | 23.14 |
| 1.8 | 3.43 | 666.38 | 3.15 | 320.70 | 6.20 | 23.76 |
| 1.9 | 3.46 | 671.82 | 3.22 | 325.23 | 6.30 | 24.39 |
© 2017 by the author. Licensee MDPI, Basel, Switzerland. This article is an open access article distributed under the terms and conditions of the Creative Commons Attribution (CC BY) license (http://creativecommons.org/licenses/by/4.0/).
Share and Cite
MDPI and ACS Style
Zhu, L. Economic Analysis of a Traceability System for a Two-Level Perishable Food Supply Chain. Sustainability 2017, 9, 682. https://doi.org/10.3390/su9050682
AMA Style
Zhu L. Economic Analysis of a Traceability System for a Two-Level Perishable Food Supply Chain. Sustainability. 2017; 9(5):682. https://doi.org/10.3390/su9050682
Chicago/Turabian StyleZhu, Lijing. 2017. "Economic Analysis of a Traceability System for a Two-Level Perishable Food Supply Chain" Sustainability 9, no. 5: 682. https://doi.org/10.3390/su9050682
Note that from the first issue of 2016, this journal uses article numbers instead of page numbers. See further details here.