
Decomposition Analysis of Forest Ecosystem Services Values


1
Graduate School of Fisheries and Environmental Sciences, Nagasaki University, 1-14 Bunkyo-machi, Nagasaki 852-8521, Japan
2
Graduate School of Human Development and Environment, Kobe University, 3-11 Tsurukabuto, Nada-ku, Kobe 657-8501, Japan
3
Urban Institute & Department of Urban and Environmental Engineering, School of Engineering, Kyushu University, 744 Motooka, Nishiku, Fukuoka 819-0395, Japan
*
Author to whom correspondence should be addressed.
Sustainability 2017, 9(5), 687; https://doi.org/10.3390/su9050687
Submission received: 11 November 2016
/
Revised: 12 April 2017
/
Accepted: 22 April 2017
/
Published: 26 April 2017
(This article belongs to the Special Issue Decision Support for Forest Ecosystem Management Sustainability)
Abstract
:Forest ecosystem services are fundamental for human life. To protect and increase forest ecosystem services, the driving factors underlying changes in forest ecosystem service values must be determined to properly implement forest resource management planning. This study examines the driving factors that affect changes in forest ecosystem service values by focusing on regional forest characteristics using a dataset of 47 prefectures in Japan for 2000, 2007, and 2012. We applied two approaches: a contingent valuation method for estimating the forest ecosystem service value per area and a decomposition analysis for identifying the main driving factors of changes in the value of forest ecosystem services. The results indicate that the value of forest ecosystem services has increased due to the expansion of forest area from 2000 to 2007. However, factors related to forest management and ecosystem service value per area have contributed to a decrease in the value of ecosystem services from 2000 to 2007 and from 2007 to 2012, respectively.
1. Introduction
Ecosystem services play a critical role in environmental protection and sustainable economic production [1]. Human activities have seriously impacted ecosystems worldwide. Bai et al. [2] reported that approximately 24% of the global land area was degraded from 1981 to 2003, and the United Nations Environment Programme (UNEP) [3] noted that approximately 40% of the world’s agricultural land was seriously degraded and exhibited a loss of biodiversity in 2008. To prevent ecosystem loss, 138 countries have supported the Aichi biodiversity target, and 63 countries have supported efforts to ratify and implement the Nagoya Protocol [1].
Corporate forest management of supply chains is required by investors, and the Carbon Disclosure Project (CDP) reported [4] that 180 global companies responded to a questionnaire on forest commodities risks, forest risk assessments, forest risk processes, etc. related to production supply chain processes. The CDP [4] also provided the names of companies that did not respond to the questionnaire. Such information disclosures promote appropriate corporate environmental management in supply chain processes [5,6].
Forests provide fundamental protection for soil and water resources as well as multiple ecosystem services [7]. Main projects and scientific works about ecosystem service economic evaluations were reported in Costanza et al. [8], The Economics of Ecosystems and Biodiversity (TEEB) [9], Common International Classification of Ecosystem Services [10], and Mapping and Assessment of Ecosystems and Their Services [11]. In addition to these key studies, a number of previous studies have estimated the forest ecosystem services in the U.S. [12], Europe [13], China [14], Japan [15], and worldwide [7]. Additionally, several studies have focused on a specific case, such as the impact of climate change on the forests of the Rocky Mountains [16] and urban ecosystem health in Japanese cities [17].
Sutherland et al. [18] noted that most studies regarding ecosystem services are mere snapshots of a single point in time. In addition, these static analyses have a limited ability to clarify the changes in ecosystem services that occur over time. However, determining the reasons underlying ecosystem service changes is useful for planning environmental policies to conserve ecosystem services. Based on this background, we have proposed a research framework for clarifying the major determinants of forest ecosystem services.
The novelty of our research framework is its cost-effective approach to identifying these determinants using public data. As noted above, previous research on forest ecosystem services has been conducted mainly through experiments and field surveys, and although the application of these approaches is useful, they require an extensive research budget and long-term studies to achieve implementation.
One important point for managing ecosystem services is the use of a simple and adequate evaluation method that can be easily understood by government officers and policy makers who are not specialists in natural science. In this sense, such a method would facilitate the development of effective environmental policies and subsidy systems. Based on this background, we attempted to develop a research framework that can perform a decomposition analysis of ecosystem services by focusing on three determining factors: (1) the value per area of forest ecosystem services; (2) the efforts of forest management; and (3) the scale of the forest area. This study, however, only focuses on changes in forest ecosystem services, which is one of the most important variables for explaining ecosystem services. However, endemic species in a forest area were not comprehensively considered, and these species can influence ecosystem services because of the conservation of biodiversity. Contrary to the valuation in TEEB, which specifies the type of ecosystem service (e.g., provisioning, adjusting, biodiversity, etc.), our valuation focuses on the unit value of ecological resources as a source of ecosystem services. Note also that each function of ecology is included in the unit value; namely, the unit value of forest area with endemic species should be more highly valued than a forest area without it.
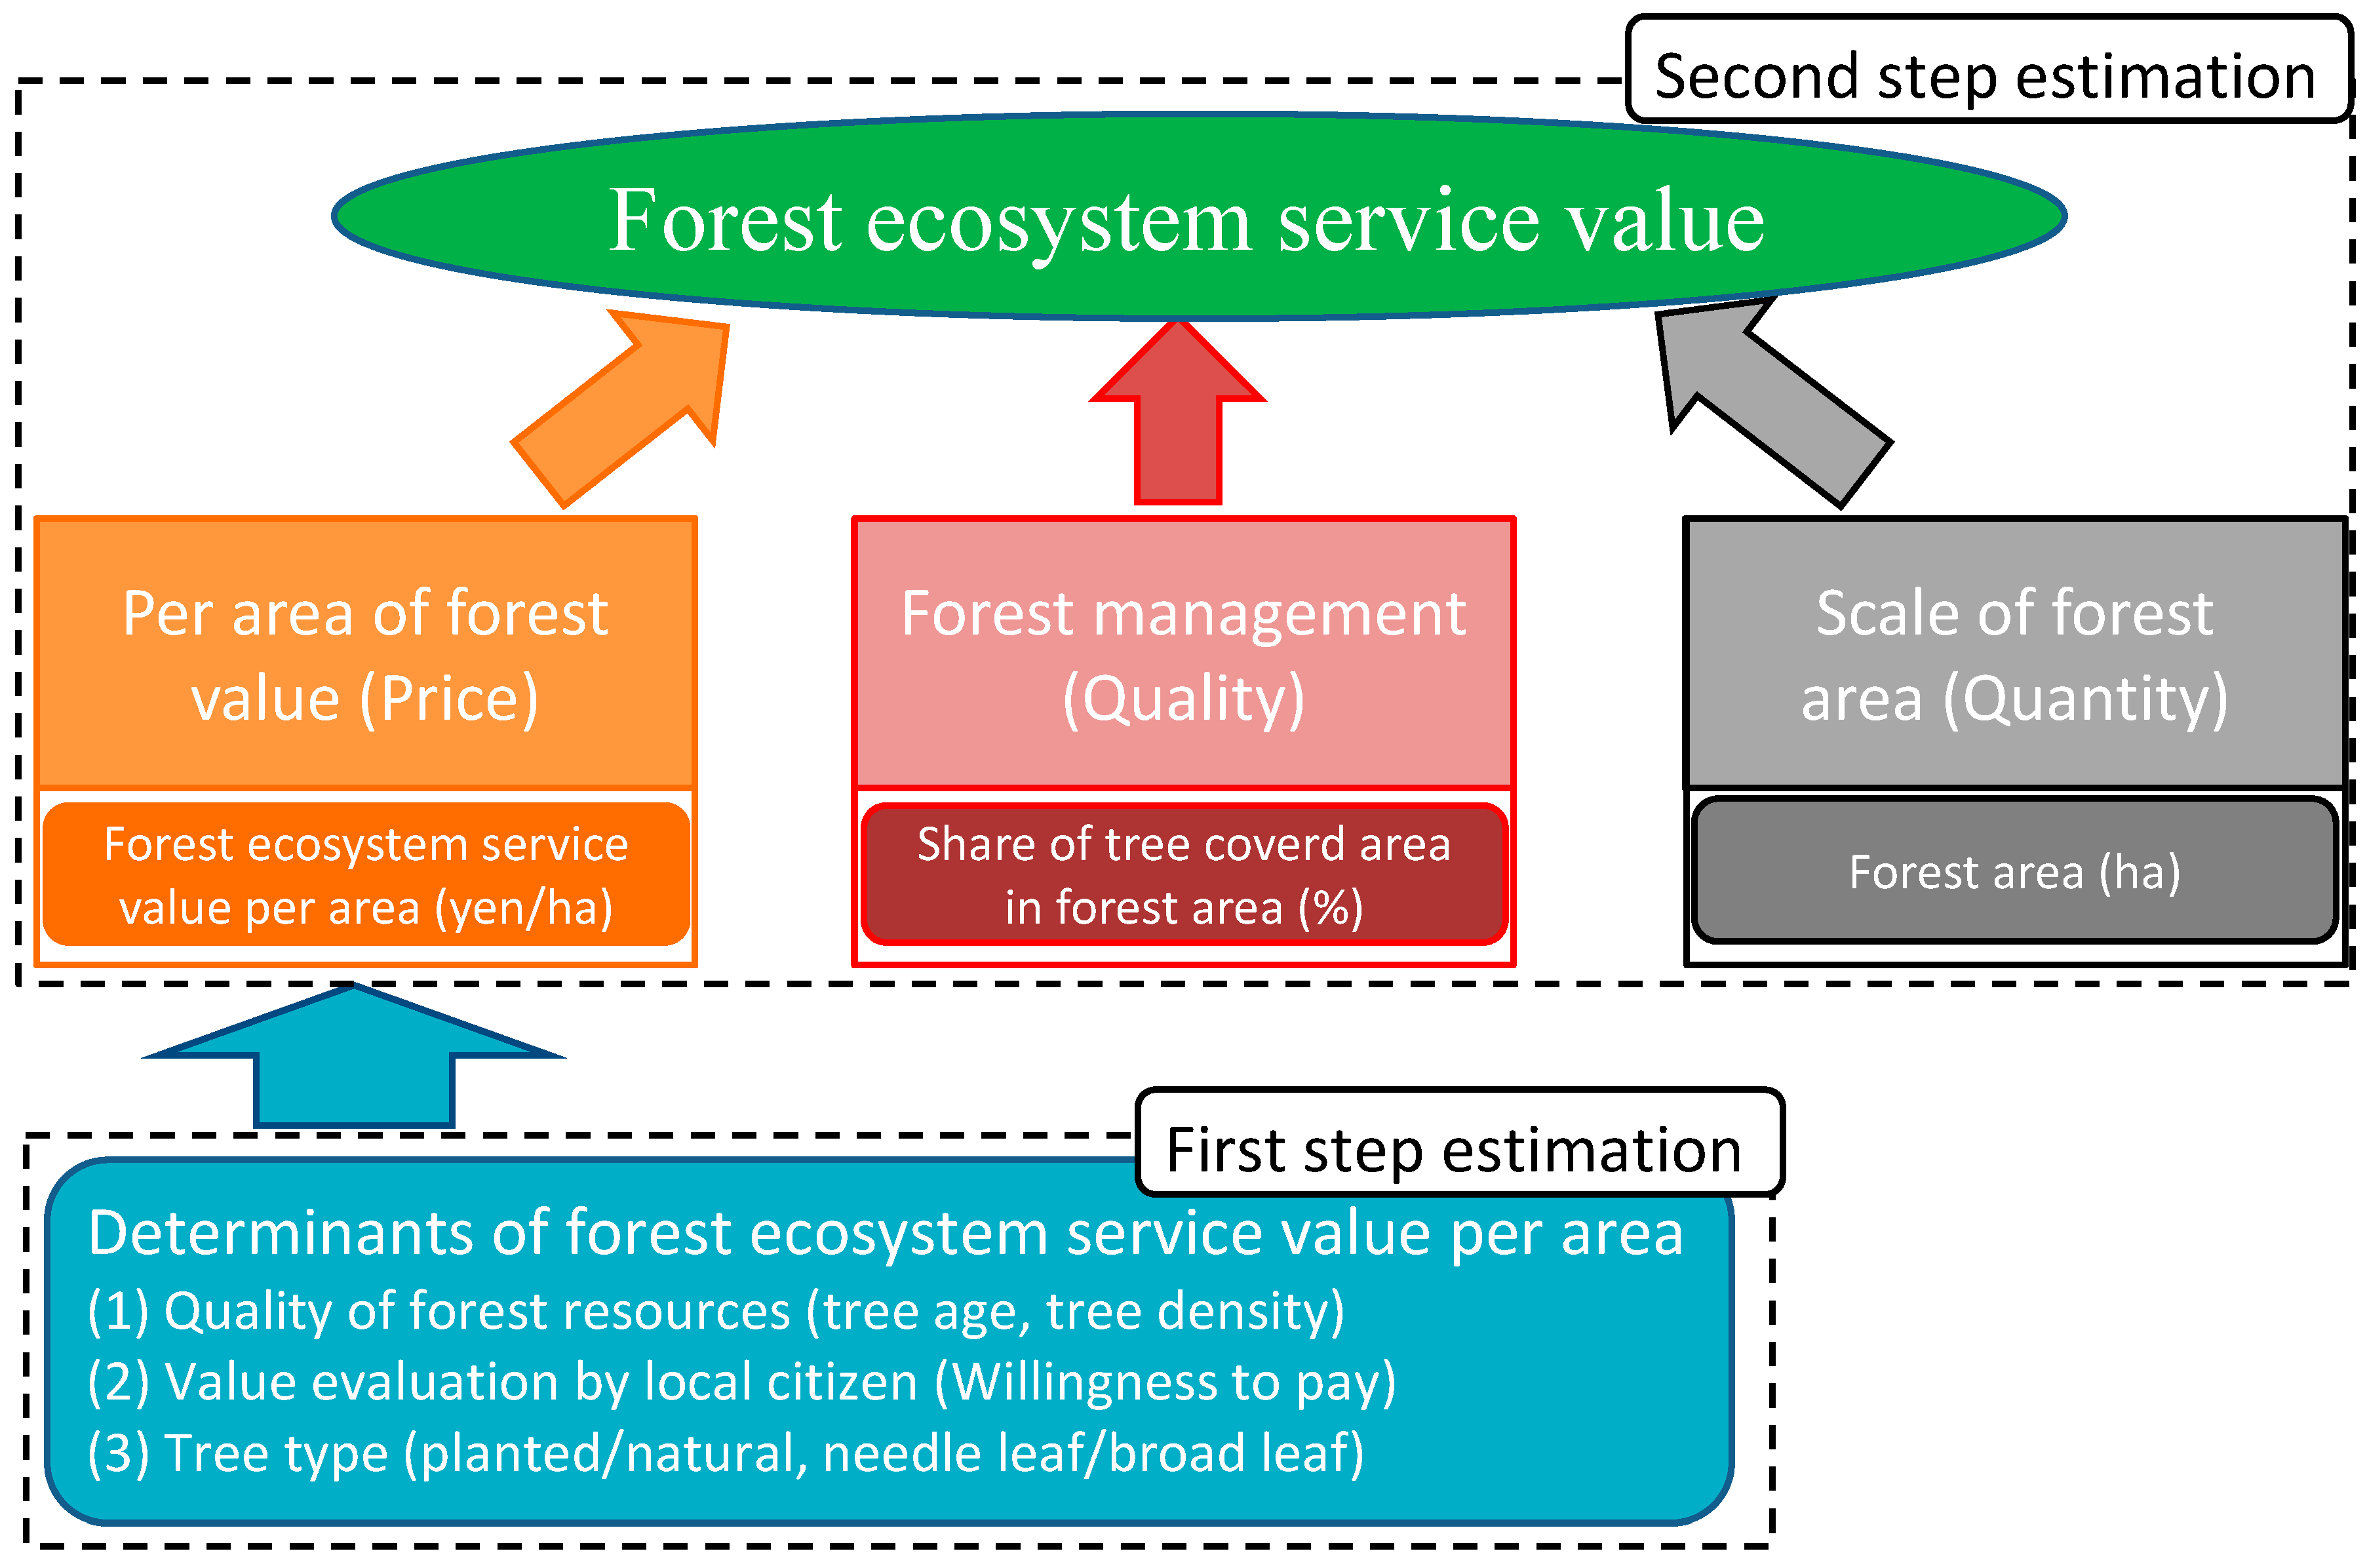
Figure 1 presents research framework for this study, and as such, it displays the three factor constructs of the forest ecosystem system value. Based on this framework, we decompose the change in forest ecosystem service value by incorporating these three factors in the decomposition analysis framework. For the valuation of ecosystem services with nonuse value, stated preference techniques are applicable [19]. Stated preference techniques include the contingent valuation method (CVM) for a single attribute and a discrete choice experiment for multiple attributes. To estimate the unit value of forest stock as a source of ecosystem services, the aforementioned economic approach called the contingent valuation method (CVM) rather than choice modeling, which aims to value multiple attributes, is used in the first step of the estimation. After estimating the value per area, a decomposition analysis to the changes in the ecosystem services is applied by focusing on forest management efforts and on the scale of the forest area. To explain the proposed application, an empirical analysis using data for 47 Japanese prefectures is introduced.
Figure S1 lists the names of Japanese prefectures, and Figure S2 indicates the distribution of labor, by number of persons, in the forest industry in 2010. Figure S2 further indicates that the forest industry is popular in prefectures located in the northern and central areas. Conversely, the labor force is much smaller in prefectures around Tokyo and Osaka. Detailed information with respect to the regional forest industry is provided in the Food and Agriculture Organization of the United Nations (FAO) [20] and Yamaguchi et al. [21].
The remainder of this paper is organized as follows. Section 2 explains the method applied to estimate the value per area of forest ecosystem services. Section 3 describes the methodology and dataset for the decomposition analysis. Section 4 presents a discussion of the results of the decomposition analysis using data from the Japanese prefectures, and Section 5 includes our conclusions.
2. Estimation of the Forest Ecosystem Services Value per Area
2.1. Estimation Method
The unit value of forest stocks is estimated using a contingent valuation method (CVM). We conducted a payment card CVM in all 47 prefectures in Japan. Payment card CVM is a classic method for eliciting information on the demands for non-market goods [22]. As Bateman et al. [23] summarized, a consensus on the elicitation format has not been reached; however, the payment card method has been researched as a potential tool for determining the value of nonmarket goods and services [24]. In the payment card format, the bias derived by the range of the bid cards is considered problematic; however, Rowe et al. [25] showed that if the upper end bid is sufficiently high, errors introduced by the range bias can be reduced. The advantage of the payment card CVM for our study is that we can collect information from each respondent valuation. Therefore, we selected the payment card format with a sufficiently high maximum bid (JPY 20,000).
The respondents were asked to state their willingness to pay for 1 ha of forest preservation in the prefecture in which they live. In the valuation study, we focused on differences in the characteristics of forest stocks, such as the tree species and age, as well as the valuators’ socioeconomic characteristics because a rich forest that provides ecosystem services should be highly valued. To control for the income effect and other valuator-related variables, we included the regression model shown in Equation (1):
where willingness to pay (WTP) represents the acceptable per household payment for one ha of forest preservation land as determined by the payment card CVM and where the first three variables represent the socioeconomic variables of the respondents. While there are debates as to whether the environment constitutes a luxury good or a normal good, it is recognized that income affects the WTP with respect to the environment [26]. Some previous empirical studies have suggested that income level has a significantly positive effect on the WTP [27]. Therefore, based on these studies, we expect the coefficient of income (β1) to be positive. Although the effects of gender (β2) (1 if the respondent is a woman) and age (β3) cannot be predicted, these are fundamental variables used to represent the characteristics of the valuators.
WTP = Constant + β1 × Household income + β2 × Gender + β3 × Age + β4 × Natural forest share +β5 × Broadleaf forest share + β6 × Forest age +β7 × Forest size +ε
The next three variables (β4 to β6) in the equation are related to the characteristics of forest stocks in the region in which the respondents live. The natural forest share and the broadleaf forest share denote the share of natural forest and broadleaf forest to the total amount of forest in each region, respectively. Namely, the sum of the natural forest share and the planted forest share and the sum of the broadleaf forest share and the coniferous forest share should be equal to 1 in each region. The data on the share of forest types is provided by the Forestry Agency of Japan. Generally, logging opportunities are one of the major functions of planted and coniferous forests in Japan. Because the number of foresters has been declining and most respondents are not forest workers, we expect that coefficient β4 may have a positive value overall. In addition, the forest characteristic variable Forest age was introduced in the regression. In Japan, the lack of tree thinning and resulting age of the forests represent serious problems. Aging forests are related to devastation and malfunctioning ecosystem services, such as CO2 absorption and wildlife habitat [28]. Hence, we expect that the coefficient of Forest age (β6) would be negative. We collected forest age data using the weighted average of forest size for each age bracket.
In addition, we introduce the forest size of each prefecture because we check whether respondents’ WTP reflects the size effect. We expect the negative coefficient of forest size (β7) to reflect the scarcity of goods, i.e., the value of an additional hectare decreases as the forest size increases. If the response does not reflect the size of the target, scope insensitivity becomes a concern. As noted by Carson et al. [26], because scope insensitivity is ubiquitous in the CVM, we must verify sensitivity to size.
2.2. Questionnaire Survey for CVM and Forest Unit Value Estimates
We conducted an online social survey from 16 November to 4 December in 2015 and collected 246,642 observations from the database of Nikkei Research Inc. (Tokyo, Japan), which is used by researchers in Japan for academic purposes. On average, approximately 0.3% of the population of each prefecture is covered. After dropping non-responses or protest responses for the CVM questions and other insufficient answers, 195,194 observations from all 47 prefectures in Japan remained. These dropped samples may reflect the quality of institutional trust of each local government. It can be considered that some people exhibit a positive WTP for forest conservation but disagree with the money collection method. Therefore, the relationship between WTP and institutional trust is necessary in future research. Thus, the valid response rate was 78%.
In the questionnaire, the respondents were required to state the annual household WTP for 1 ha of forest preservation in the prefecture by showing the payment card and selecting ranges from JPY 0 to JPY 20,000. Before the CVM survey, we encouraged the participants to recognize the environmental functions and ecosystem services provided by forests (Table 1). Therefore, it was important to ask respondents if they recognized the function of the forest ecosystem, as this question prompted them to consider these functions. Their recognition of each function is reflected in their responses regarding their WTP.
After determining the forest functions, the respondents were asked to indicate their willingness to pay for forest preservation using the payment card CVM (Table 2).
Based on this payment card CVM, we collected data on the unit value of the forest. Descriptive statistics show that the average WTP for throughout Japan for 1 ha of forest preservation is JPY 2374 (SD = 175). At the prefectural level, the highest value is observed in Tokyo (JPY 2811) and the lowest value is observed in Kochi Prefecture (JPY 1964).
After determining the unit value of the forest, we performed the regression estimation using Equation (1) and the ordinary least squares method with data from a single year. Table 3 presents the results of the regression model. Except for β4, the results we obtained were as expected. If the respondents work in the forestry industry, the result is not unusual because a planted forest is more profitable, but the size of the forest is not as large. Though it is difficult to conclude, one potential interpretation is that a natural forest is difficult to manage and is even denuded at times. Accordingly, a respondent may determine that it has a low value. Using these results, we performed a decomposition analysis of the value of forest ecosystem services.
3. Analysis
3.1. Decomposition Analysis of Changes in Value of Forest Ecosystem Services
The WTP estimation model is used to determine the economic value of forest ecosystem services according to local citizens. If we assume the stability of the parameters in the utility function, by introducing the data for independent variables in different years, we obtain the WTP in each year. Although this approach can be used to evaluate the value of forest ecosystems, clarifying the factors underlying the changes in forest ecosystem services value remains difficult. According to Fujii and Managi [17], the ecosystem service evaluation method can clarify the value of the natural capital, even though it is difficult to determine why the value changed. The main factors affecting forest ecosystem services values differ between regions and depend on regional characteristics and the forest planning strategy of local governments. To understand the factors that change the value of forest ecosystem services, we used a decomposition approach that focuses on forest management and the scale of the forest area.
To decompose the changes in the value of forest ecosystem services, the following three indicators are used: (1) the forest ecosystem services value per area (PRICE), (2) the tree covered area in the forest (QUALITY), and (3) the scale of the forest area (QUANTITY). We defined the PRICE indicator as the change in the value of the forest ecosystem services per tree covered area. PRICE data were represented as the WTP score determined by the first step in the estimation using data from the questionnaire and the CVM approach. As the WTP per household was determined in the previous section, we multiplied the number of households to obtain the value of the forest stock in each prefecture. It should be noted that the unit value estimated by CVM in this study is an additional value of 1 ha forest increase. In this research, we estimated the forest stock value by multiplying additional values of 1 ha to all the forests. In this estimation, we assumed that unit value estimated by CVM is the approximate score of the average value of 1 ha forest stock per household. However, the average value should be clearly distinguished from the additional value to estimate stock value estimation. This point represents a limitation of this study.
Here, we assume the WTP for 1 ha forest is the unit value of forest. It includes not only direct use value but also non-timber value of forest area. This approach is different from the related research, e.g., Inclusive Wealth Report [29]. In Inclusive Wealth Report, USD 190 and USD 145 are applied as non-timber value of 1 ha forest in developed and developing countries, respectively, and multiplied with only accessible forest (estimated as 10% of forest area). In this sense, non-timber value of inaccessible forest is not valued. On the other hand, our unit value of forest estimated by CVM is not limited by accessibility. Thus, unit value is multiplied with total forest area. This is one interpretation why our estimation of forest value is larger than the previous research.
The QUALITY indicator is calculated as the tree covered area divided by the forest area. Tree covered area is defined by a canopy cover of more than 30%. Forest area is defined as the tree covered area and unstocked area (canopy cover less than 30%), which is established by Forest Law Article 2.1. Thus, QUALITY represents the share of the tree covered area in the forest area. Many forest areas are difficult to maintain because of the lack of human resources in local regions, and the abandonment of forest management leads to an increase in the treeless area. Therefore, the QUALITY indicator reflects the coverage of forest management. Unstocked area includes both harvested land area and treeless area. Thus, an expanding unstocked area due to increasing harvested land area is consistent with appropriate forest management. We confirm the dataset and clarify the share of harvested land area was only 8% of the total unstocked land area in 2012, and most prefectures changed unstocked land area due to changing treeless areas. Therefore, we consider that the QUALITY index can represent the forest resource management of each prefecture. However, this interpretation is available if and only if the treeless area represents a large share in the unstocked land area. Finally, the QUANTITY indicator denotes the scale of the forest area, which is the total forest area. The value of forest ecosystem services (VALUE) is determined according to Equation (2).
Here, we introduce the equation for the decomposition analysis of changes in the value of forest ecosystem services using t year (VALUEt) and t + 1 year (VALUEt+1) data. From equation (2), we obtain Equation (3):
Equation (3) is transformed to a natural logarithmic function to obtain Equation (4):
Multiplying both sides of Equation (4) by yields Equation (5):
Therefore, changes in the value of forest ecosystem services can be decomposed by the changes in PRICE (first term), QUALITY (second term), and QUANTITY (third term). The term operates as an additive weight of emissions estimated within the log mean Divisia index (LMDI) framework. This weight function reflects the scale of the value of forest ecosystem services to the ⊿PRICE, ⊿QUALITY, and ⊿QUANTITY and does not reflect the absolute value of the value of forest ecosystem services.
The LMDI decomposition approach was developed by Ang et al. [30]. Ang [31] noted that the LMDI is the preferred method for decomposition analysis because of its theoretical foundation, adaptability, ease of use and interpretation, and lack of a residual term, which is generated by Laspeyres-type methodologies. The LMDI has been used mainly in energy studies [32]. Recently, the decomposition framework was applied to industrial ecology research to clarify the main driver of toxic chemical emission changes using end-of-pipe and cleaner production factors [33] and patent decomposition analysis to clarify the research and development priority change [34].
3.2. Data Variables for the Decomposition Analysis
In the second step of the estimation, we use the WTP score estimated in the first step of the estimation as well as the following three data variables: forest area (ha), tree covered land area (ha), and unstocked land area (ha), which includes harvested areas and treeless areas. The data for year 2000 were obtained from reports of the 2000 world census of agriculture and forestry [35] in Japan. The data for year 2007 and 2012 were obtained from the State of Forest Resources in 2007 [36] and 2012 [37], respectively.
Table 4 presents a description of the data variables for the second step of the estimation. The share of tree covered land in the forest area decreased from 2000 to 2007, with a minimum score of 78.5% in 2007. This result indicates the presence of a prefecture (e.g., Toyama prefecture) whose tree covered land is less than 80%. The Toyama prefecture, located at the center of mainland Japan, had a 78.5% tree covered land share in 2007 and 2012. The Toyama prefecture is a heavy snowfall area in Japan, and thus disadvantages the forest industry and decreases incentives for planting forests [38].
In addition, the average value and maximum value of the share of tree covered land in the forest area were still high in 2007 and 2012. These results imply that the performance of forest area management became polarized in Japan.
4. Results
Figure 2, Figure 3, Figure 4 and Figure 5 show the results of the decomposition analysis for the value of forest ecosystem services. Figure 2 represents the decomposition analysis results in 47 prefectures in Japan, and Figure 3, Figure 4 and Figure 5 present the regional distribution of each decomposed factor. The vertical axis in Figure 2 shows the value of forest ecosystem services estimated by the results of the CVM and forest area data.
Figure 2A indicates that the value of forest ecosystem services decreased from 2000 to 2012 in Japan. The main contributors to this decline were the quality and price factors, whereas the quantity factor positively affected the value of forest ecosystem services. These results imply that the value of forest ecosystem services increased because of an expansion of forest area. However, the share of the unstocked area in the forest areas increased and there was a weakening of the social value of forest ecosystem in this period, which had a negative impact on the value of forest ecosystem services in Japan.
We then compared the results from 2000 to 2007 (first period) with those of 2007 to 2012 (second period). Figure 2B reveals that whereas the quantity factor mainly contributed to an increase in forest ecosystem services in the first period, it demonstrated a small negative effect in the second period.
Next, we compared the regional distribution of changes in the forest ecosystem services (Figure 3, Figure 4 and Figure 5). Figure 3A displays the value of the forest ecosystem services by prefecture in 2000. Figure 3B,C represent the change rate of the value of forest ecosystem services in the first and second periods, respectively. Figure 3A indicates that the prefectures with large areas tend to place higher values on their forest ecosystem services because prefectures with large land areas tend to have larger forest areas.
Figure 3B suggests that the change in forest ecosystem service values varies among regions in the first period. The southwest region and northeast region showed decreased forest ecosystem services values, whereas the central region on the Pacific side showed increasing values. Additionally, several prefectures presented change rates between 0% and 3%. One advantage of a decomposition approach is the ability to clarify whether the prefectures with low change rates also have low change rates for all three factors or present balanced ratios among all three factors. Thus, Figure 4 displays the regional distribution of each decomposed factor in the first period.
Figure 4B indicates that forest management quality factors reduced the value of forest ecosystem services, especially in the central region. These results imply that forest management in the central region worsened in the first period. In addition, Figure 4C shows that the expansion of forest area increased the value of forest ecosystem services. A comparison of Figure 4B with Figure 4C indicates that many prefectures have similar trends and present a negative effect with respect to the quality of forest management and a positive effect regarding the quantity of forest management. Accordingly, these two factors are balanced in many prefectures.
One interpretation of this trend is that the prefectures in the central and northern regions expanded the forest area, although the number of laborers did not increase. For example, Toyama prefecture and Niigata prefecture decreased with respect to their shares of tree covered land from 93.2% to 78.5% and from 91.9% to 84.5%, respectively in the first period. Nagasaka et al. [39] noted that the Japanese forest industry has experienced challenges since the 1980s because of increases in labor costs in rural areas and a decrease in the domestic timber prices. These conditions reduced the labor force ratio in the forest industry, especially amongst the young labor force. In addition to human resource issues, regional characteristics also affected the quality of forest management. In the winter, heavy snow is observed in Japan, especially in areas along the east coast. This climate condition causes these prefectures to reduce the human resources involved in managing forests.
Finally, Figure 4A indicates that the change in the price factor of forest ecosystem services is similar to the trend in Figure 3B. One interesting point is that changes in the price factor of ecosystem services in the first period are small in Figure 2B, which represents the total change in value in Japan. However, Figure 4A indicates that many prefectures observed significant changes in price factors which disappear upon aggregation among regions. This implies that the regional distribution of the decomposed factor is an important point to consider when investigating the macro-level changes in ecosystem services values.
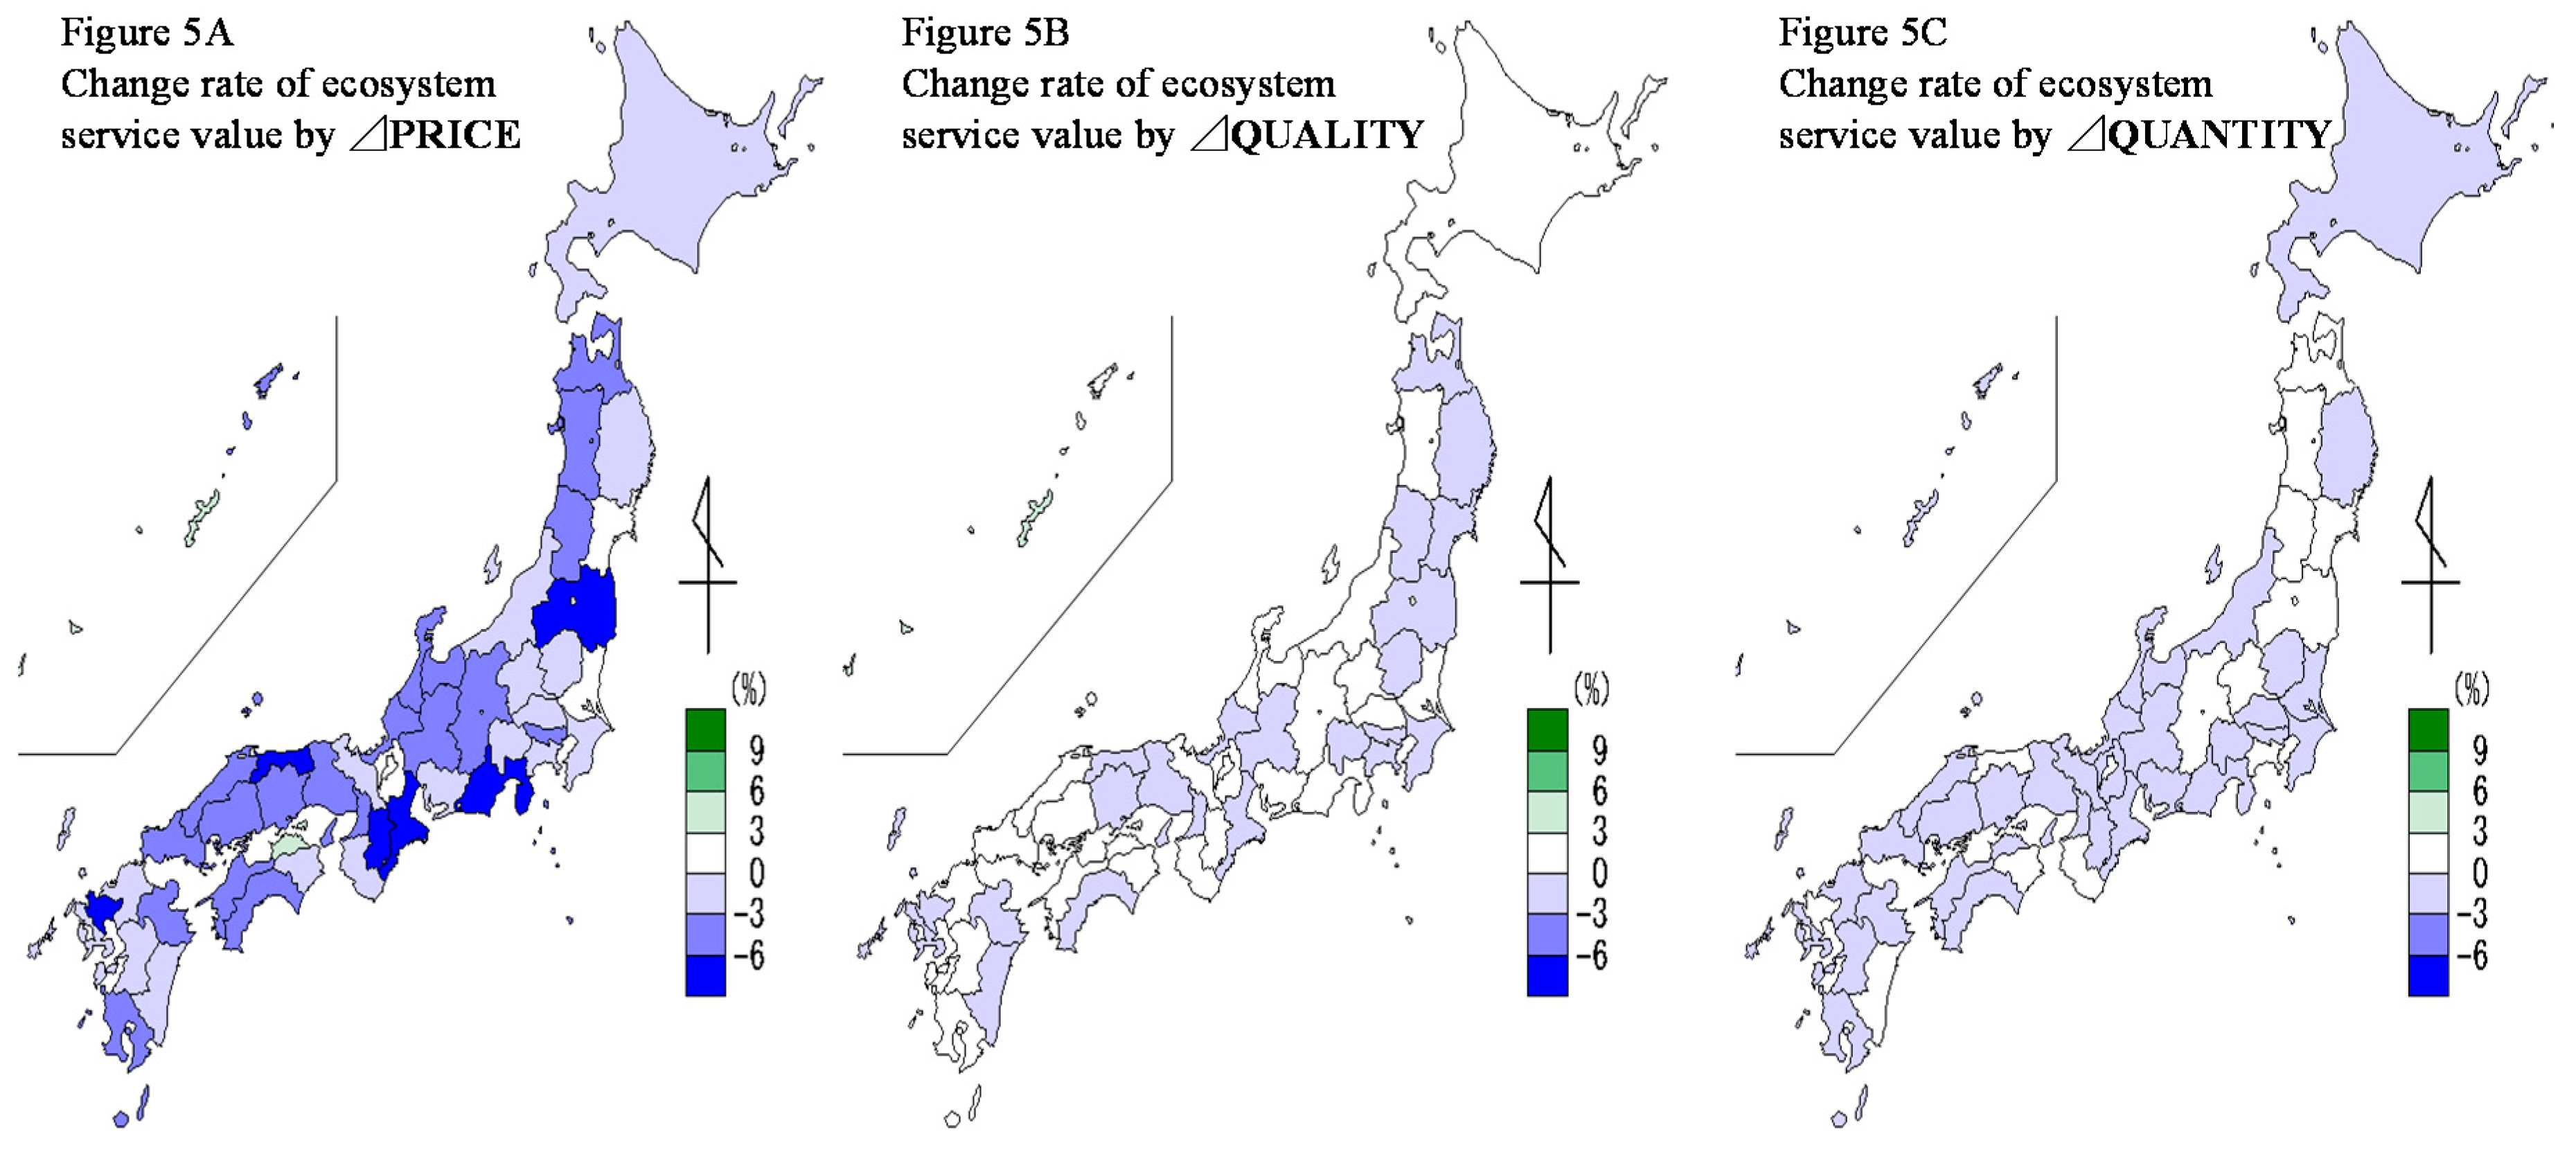
Next, we discuss changes in the value of forest ecosystem services in the second period. Figure 5 shows that most prefectures decreased the value of forest ecosystem services because of decline in price. Figure 5A reveals that a negative contribution of the price factor to the change in ecosystem services values was observed in most of prefectures. Additionally, several prefectures had decreases in value of more than 6% because of changes in the price factor. Compared with these results, Figure 5B,C indicate that a relatively small change occurred in the quality and quantity factors during the second period.
The contributions of forest management and forest land scale were relatively smaller than the price factor in the second period. Additionally, the negative effects of the forest quality factor were reduced compared with that in the first period. These trends can be explained by two reasons. First, the Japanese government enacted the “Forest and Forestry Revitalization Plan” in 2009 to revitalize forests and the forestry industry through the maximum effective use of Japan’s forest resources and establish sustainable forest management and a stable domestic timber supply system [40]. Through the revitalization plan, the forest management field is a high priority for governmental budget allocations and subsidy system designs. Nagasaka et al. [41] noted that this plan had a strong impact on the ongoing forest and forestry management systems in Japan.
Second, forest resources have become a focus of climate change mitigation. The IPCC [42] noted that wood products mitigate GHG emission because they represent carbon storage sources and low carbon energy sources and generate material substitution effects. Kayo et al. [43] estimated the climate change mitigation effect of harvested wood products in Japan and clarified that material and energy substitution effects have considerable potential to reduce GHG emissions in Japan. In material substitution processes, cellulose nanofiber technology improves the quality of wood-based material for building and manufacturing products [44]. These technological innovations of wood-based material and the growth in importance of climate mitigation are additional reasons for the increased focus on improving forest resource management.
As revealed in the empirical study presented herein, the proposed research framework for performing a decomposition analysis of the changes in the forest ecosystem services value can be used to evaluate regional forest planning efforts from three perspectives: price, quality, and quantity. Moreover, the results of the decomposition analysis can provide helpful information for regional forest ecosystem services planning and policy construction.
5. Conclusions
This study examined the decomposed factors that contribute to changes in forest ecosystem services values in Japan, with a focus on two periods. In this work, a decomposition framework was developed using the CVM approach to estimate the forest ecosystem services value per area based on the regional characteristics of forest resources. Our primary findings are summarized as follows.
First, the value of forest ecosystem services has increased due to the expansion of the forest area from 2000 to 2007. However, forest quality factors and forest ecosystem value per area contributed to a decrease in ecosystem services from 2000 to 2007 and from 2007 to 2012, respectively. Thus, we identified that the main determinant of the decrease in forest ecosystem services is the value per area from 2007 to 2012. Additionally, forest ecosystem service value did not experience a significant change between 2000 and 2007 due to the overall balance between forest quantity and quality.
Second, the regional distribution of the decomposed factors associated with changes in forest ecosystem services values varied between the period from 2000 to 2007 and the period from 2007 to 2012. Additionally, most prefectures that showed an expansion of forest area suffered negative effects from forest management from 2000 to 2007. The results indicated that the regional distribution trends are significantly different; therefore, regional issues and problems must be addressed to improve the condition of forest ecosystem services. These regional differences in trends provide helpful information for developing forest policy plans that consider regional characteristics.
The proposed research framework is a useful tool for establishing a strategic plan for the conservation of forest ecosystem services using regional characteristics. We believe that using a research framework that combines contingent valuation methods and a decomposition analysis, which is not associated with high costs or efforts, can facilitate a better understanding among government officers and forest industry workers of the effect of their forest management plans on the value of forest ecosystem services. An important component of this application is its ability to identify the contributions of forest ecosystem services values using three factors: the forest ecosystem services per area (i.e., people’s preferences), forest management (forest resource conservation efforts), and the forest land scale. These estimation results will provide useful information to aid in government policy development and forest planning by forest managers.
Further research is needed to investigate different factors, such as the decomposition analysis of the marine ecosystem service value, and provide key information for constructing marine policies and international agreements on fisheries. Additionally, a decomposition analysis of the forest ecosystem service value in other regional studies is also important, as it can provide valuable information for developing forest policies, especially in developing countries where the forest area is rapidly being degraded [3].
Supplementary Materials
The following are available online at www.mdpi.com/2071-1050/9/5/687/s1, Figure S1: Map and prefecture names in Japan, Figure S2: Number of labor in forest industry.
Acknowledgments
This research was funded by the research program “Policy studies of environmental economics” and S15 of the Environment Research and Technology Development Fund of the Japanese Ministry of the Environment, and a Grant-in-Aid for Specially Promoted Research [26000001B] and Grant-in-Aid for Young Scientists (B) [17K12858] from the Ministry of Education, Culture, Sports, Science and Technology (MEXT), Japan. The results and conclusions of this article do not necessarily represent the views of the funding agencies.
Author Contributions
H.F. contributed to the construction of the dataset, the development of the methodology, and the drafting of the article; M.S. estimated the intensity of ecosystem services; S.M. assisted with the literature revision and conclusions.
Conflicts of Interest
The authors declare no conflict of interest.
References
- UNEP. Contributions of the United Nations Environment Programme (UNEP) towards Achieving the Strategic Plan of Biodiversity (2011–2020) and the Aichi Biodiversity Targets; United Nations Environment Programme: Nairobi, Kenya, 2016. [Google Scholar]
- Bai, Z.G.; Dent, D.L.; Olsson, L.; Schaepman, M.E. Global Assessment of Land Degradation and Improvement: 1. Identification by Remote Sensing. GLADA Report No. 5. 2008. Available online: http://www.isric.org/isric/webdocs/docs/Report%202008_01_GLADA%20international_REV_Nov%202008.pdf (accessed on 27 February 2017).
- UNEP. Environment, Religion and Culture in the Context of the 2030 Agenda for Sustainable Development; United Nations Environment Programme: Nairobi, Kenya, 2016. [Google Scholar]
- CDP. Global Forests Report 2015; CDP: London, UK, 2015. [Google Scholar]
- Matisoff, D.C.; Noonan, D.S.; O’Brien, J.J. Convergence in environmental reporting: Assessing the carbon disclosure project. Bus. Strategy Environ. 2013, 22, 285–305. [Google Scholar] [CrossRef]
- Ben-Amar, W.; McIlkenny, P. Board effectiveness and the voluntary disclosure of climate change information. Bus. Strategy Environ. 2015, 24, 704–719. [Google Scholar] [CrossRef]
- Miura, S.; Amacher, M.; Hofer, T.; San-Miguel-Ayanz, J.; Ernawati; Thackway, R. Protective functions and ecosystem services of global forests in the past quarter-century. For. Ecol. Manag. 2015, 352, 35–46. [Google Scholar] [CrossRef]
- Costanza, R.; D’Arge, R.; de Groot, R.; Farber, S.; Grasso, M.; Hannon, B.; Limburg, K.; Naeem, S.; O’Neill, R.V.; Paruelo, J.; et al. The value of the world’s ecosystem services and natural capital. Nature 1997, 387, 253–260. [Google Scholar] [CrossRef]
- Kumar, P. (Ed.) The Economics of Ecosystems and Biodiversity Ecological and Economic Foundations; Earthscan Publications: London, UK, 2010. [Google Scholar]
- Haines-Young, R.; Potschin, M. Proposal for a Common International Classification of Ecosystem Goods and Services (CICES) for Integrated Environmental and Economic Accounting, Report to the European Environment Agency. 2010. Available online: http://www.nottingham.ac.uk/cem/pdf/UNCEEA-5-7-Bk1.pdf (accessed on 27 February 2017).
- Maes, J.; Zulian, G.; Thijssen, M.; Castell, C.; Baró, F.; Ferreira, A.M.; Melo, J.; Garrett, C.P.; David, N.; Alzetta, C.; et al. Mapping and assessment of ecosystems and their services. In Urban Ecosystems; Publications Office of the European Union: Luxembourg, 2016. [Google Scholar]
- Rocca, M.E.; Miniat, C.F.; Mitchell, R.J. Introduction to the regional assessments: Climate change, wildfire, and forest ecosystem services in the USA. For. Ecol. Manag. 2014, 327, 265–268. [Google Scholar] [CrossRef]
- Mouchet, M.A.; Paracchini, M.L.; Schulp, C.J.E.; Stürck, J.; Verkerk, P.J.; Verburg, P.H.; Lavorel, S. Bundles of ecosystem (dis)services and multifunctionality across European landscapes. Ecol. Indic. 2017, 73, 23–28. [Google Scholar] [CrossRef]
- Zhang, Z.; Gao, J.; Fan, X.; Lan, Y.; Zhao, M. Response of ecosystem services to socioeconomic development in the Yangtze River Basin, China. Ecol. Indic. 2017, 72, 481–493. [Google Scholar] [CrossRef]
- Ninan, K.N.; Inoue, M. Valuing forest ecosystem services: Case study of a forest reserve in Japan. Ecosyst. Serv. 2013, 5, 78–87. [Google Scholar] [CrossRef]
- Rocca, M.E.; Brown, P.M.; MacDonald, L.H.; Carrico, C.M. Climate change impacts on fire regimes and key ecosystem services in Rocky Mountain forests. For. Ecol. Manag. 2014, 327, 290–305. [Google Scholar] [CrossRef]
- Fujii, H.; Managi, S. An evaluation of inclusive capital stock for urban planning. Ecosyst. Health Sustain. 2016, 2, e01243. [Google Scholar] [CrossRef]
- Sutherland, I.J.; Bennett, E.M.; Gergel, S.E. Recovery trends for multiple ecosystem services reveal non-linear responses and long-term tradeoffs from temperate forest harvesting. For. Ecol. Manag. 2016, 374, 61–70. [Google Scholar] [CrossRef]
- Adamowicz, W.; Boxall, P.; Williams, M.; Louviere, J. Stated preference approaches for measuring passive use values: Choice experiments and contingent valuation. Am. J. Agric. Econ. 1998, 80, 64–75. [Google Scholar] [CrossRef]
- FAO. Japan Forestry Outlook Study. Asia Pacific Forestry Sector Outlook Study II. Working Paper No. APFSOS II/WP/2010/30. 2010. Available online: http://www.fao.org/docrep/014/am625e/am625e00.pdf (accessed on 27 February 2017).
- Yamaguchi, R.; Sato, M.; Ueta, K. Measuring regional wealth and assessing sustainable development: An application to a disaster-torn region in Japan. Soc. Indic. Res. 2016, 129, 365–389. [Google Scholar] [CrossRef]
- Cameron, T.A.; Huppert, D.D. OLS versus ML estimation of non-market resource values with payment card interval data. J. Environ. Econ. Manag. 1989, 17, 230–246. [Google Scholar] [CrossRef]
- Bateman, I.J.; Carson, R.T.; Day, B.; Hanemann, M.; Hanley, N.; Hett, T.; Jones-Lee, M.; Loomes, G.; Mourato, S.; Özdemiroglu, E. Economic Valuation with Stated Preference Techniques: A Manual; Edward Elgar Publishing: Cheltenham, UK, 2002. [Google Scholar]
- Covey, J.; Loomes, G.; Bateman, I.J. Valuing risk reductions: Testing for range biases in payment card and random card sorting methods. J. Environ. Plan. Manag. 2007, 50, 467–482. [Google Scholar] [CrossRef]
- Rowe, R.D.; Schulze, W.D.; Breffle, W.S. A test for payment card biases. J. Environ. Econ. Manag. 1996, 31, 178–185. [Google Scholar] [CrossRef]
- Carson, R.T.; Flores, N.E.; Meade, N.F. Contingent valuation: Controversies and evidence. Environ. Res. Econ. 2001, 19, 173–210. [Google Scholar] [CrossRef]
- Jacobsen, J.B.; Lundhede, T.H.; Thorsen, B.J. The effects of current income and expected change in future income on stated preferences for environmental improvements. J. For. Econ. 2013, 19, 206–219. [Google Scholar] [CrossRef]
- Iizuka, K.; Tateishi, R. Estimation of CO2 sequestration by the forests in Japan by discriminating precise tree age category using remote sensing techniques. Remote Sens. 2015, 7, 15082–15113. [Google Scholar] [CrossRef]
- UNU-IHDP; UNEP. Inclusive Wealth Report 2014 Measuring Progress toward Sustainability; Cambridge University Press: Cambridge, UK, 2014. [Google Scholar]
- Kamo, K.; Konoshima, N.; Yoshimoto, A. Statistical analysis of tree-forest damage by snow and wind: Logistic regression model for tree damage and cox regression for tree survival. FORMATH 2016, 15, 44–55. [Google Scholar] [CrossRef]
- Ang, B.; Zhang, F.; Choi, K. Factorizing changes in energy and environmental indicators through decomposition. Energy 1998, 23, 489–495. [Google Scholar] [CrossRef]
- Ang, B.W. Decomposition analysis for policymaking in energy: Which is the preferred method? Energy Policy 2004, 32, e1131–e1139. [Google Scholar] [CrossRef]
- Fujii, H.; Managi, S. Which industry is greener? An empirical study of nine industries in OECD countries. Energy Policy 2013, 57, 381–388. [Google Scholar] [CrossRef]
- Fujii, H.; Managi, S. Decomposition of toxic chemical substance management in three U.S. manufacturing sectors from 1991 to 2008. J. Ind. Ecol. 2013, 17, 461–471. [Google Scholar] [CrossRef]
- Fujii, H.; Yoshida, K.; Sugimura, K. Research and development strategy in biological technologies: A patent data analysis of Japanese manufacturing firms. Sustainability 2016, 8, 351. [Google Scholar] [CrossRef]
- Ministry of Agriculture, Forestry and Fisheries. 2000 World Census of Agriculture and Forestry in Japan. 2000. Available online: http://www.maff.go.jp/j/tokei/census/afc/2010/report_en1.html (accessed on 27 February 2017).
- Ministry of Agriculture, Forestry and Fisheries. State of Forest Resources in 2007 [Only in Japanese]. 2007. Available online: http://www.rinya.maff.go.jp/j/keikaku/genkyou/h19/index.html (accessed on 27 February 2017).
- Ministry of Agriculture, Forestry and Fisheries. State of Forest Resources in 2012 [Only in Japanese]. 2012. Available online: http://www.rinya.maff.go.jp/j/keikaku/genkyou/h24/index.html (accessed on 27 February 2017).
- Nagasaka, K.; Böcher, M.; Krott, M. Are forest researchers only scientists? Case studies on the roles of researchers in Japanese and Swedish forest policy processes. For. Policy Econ. 2016, 70, 147–154. [Google Scholar] [CrossRef]
- Headquarters for the Revitalization of Food, Agriculture, Forestry, and Fisheries. The Basic Policy and Action Plan for the Revitalization of Japan’s Food, Agriculture, Forestry, and Fisheries: Decision of the Headquarters for the Revitalization of Food, Agriculture, Forestry, and Fisheries. 2011. Available online: http://www.cas.go.jp/jp/seisaku/npu/policy05/pdf/20120815/20120815_en.pdf (accessed on 9 November 2016).
- Nagasaka, K.; Böcher, M.; Krott, M. Science-policy interaction: The case of the forest and forestry revitalization plan in Japan. Land Use Policy 2016, 58, 145–151. [Google Scholar] [CrossRef]
- Intergovernmental Panel on Climate Change (IPCC). Climate Change 2014: Mitigation of Climate Change; Working Group III Contribution to the Fifth Assessment Report of the Intergovernmental Panel on Climate Change; IPCC: Geneva, Switzerland, 2014. [Google Scholar]
- Kayo, C.; Tsunetsugu, Y.; Tonosaki, M. Climate change mitigation effect of harvested wood products in regions of Japan. Carb. Balance Manag. 2015, 10, 24. [Google Scholar] [CrossRef] [PubMed]
- Boufi, S.; González, I.; Delgado-Aguilar, M.; Tarrès, Q.; Pèlach, M.À.; Mutjé, P. Nanofibrillated cellulose as an additive in papermaking process: A review. Carbohydr. Polym. 2016, 154, 151–166. [Google Scholar] [CrossRef] [PubMed]
Figure 1.
Research framework of this study.

Figure 2.
Results of the decomposition analysis for the value of ecosystem services in Japan.
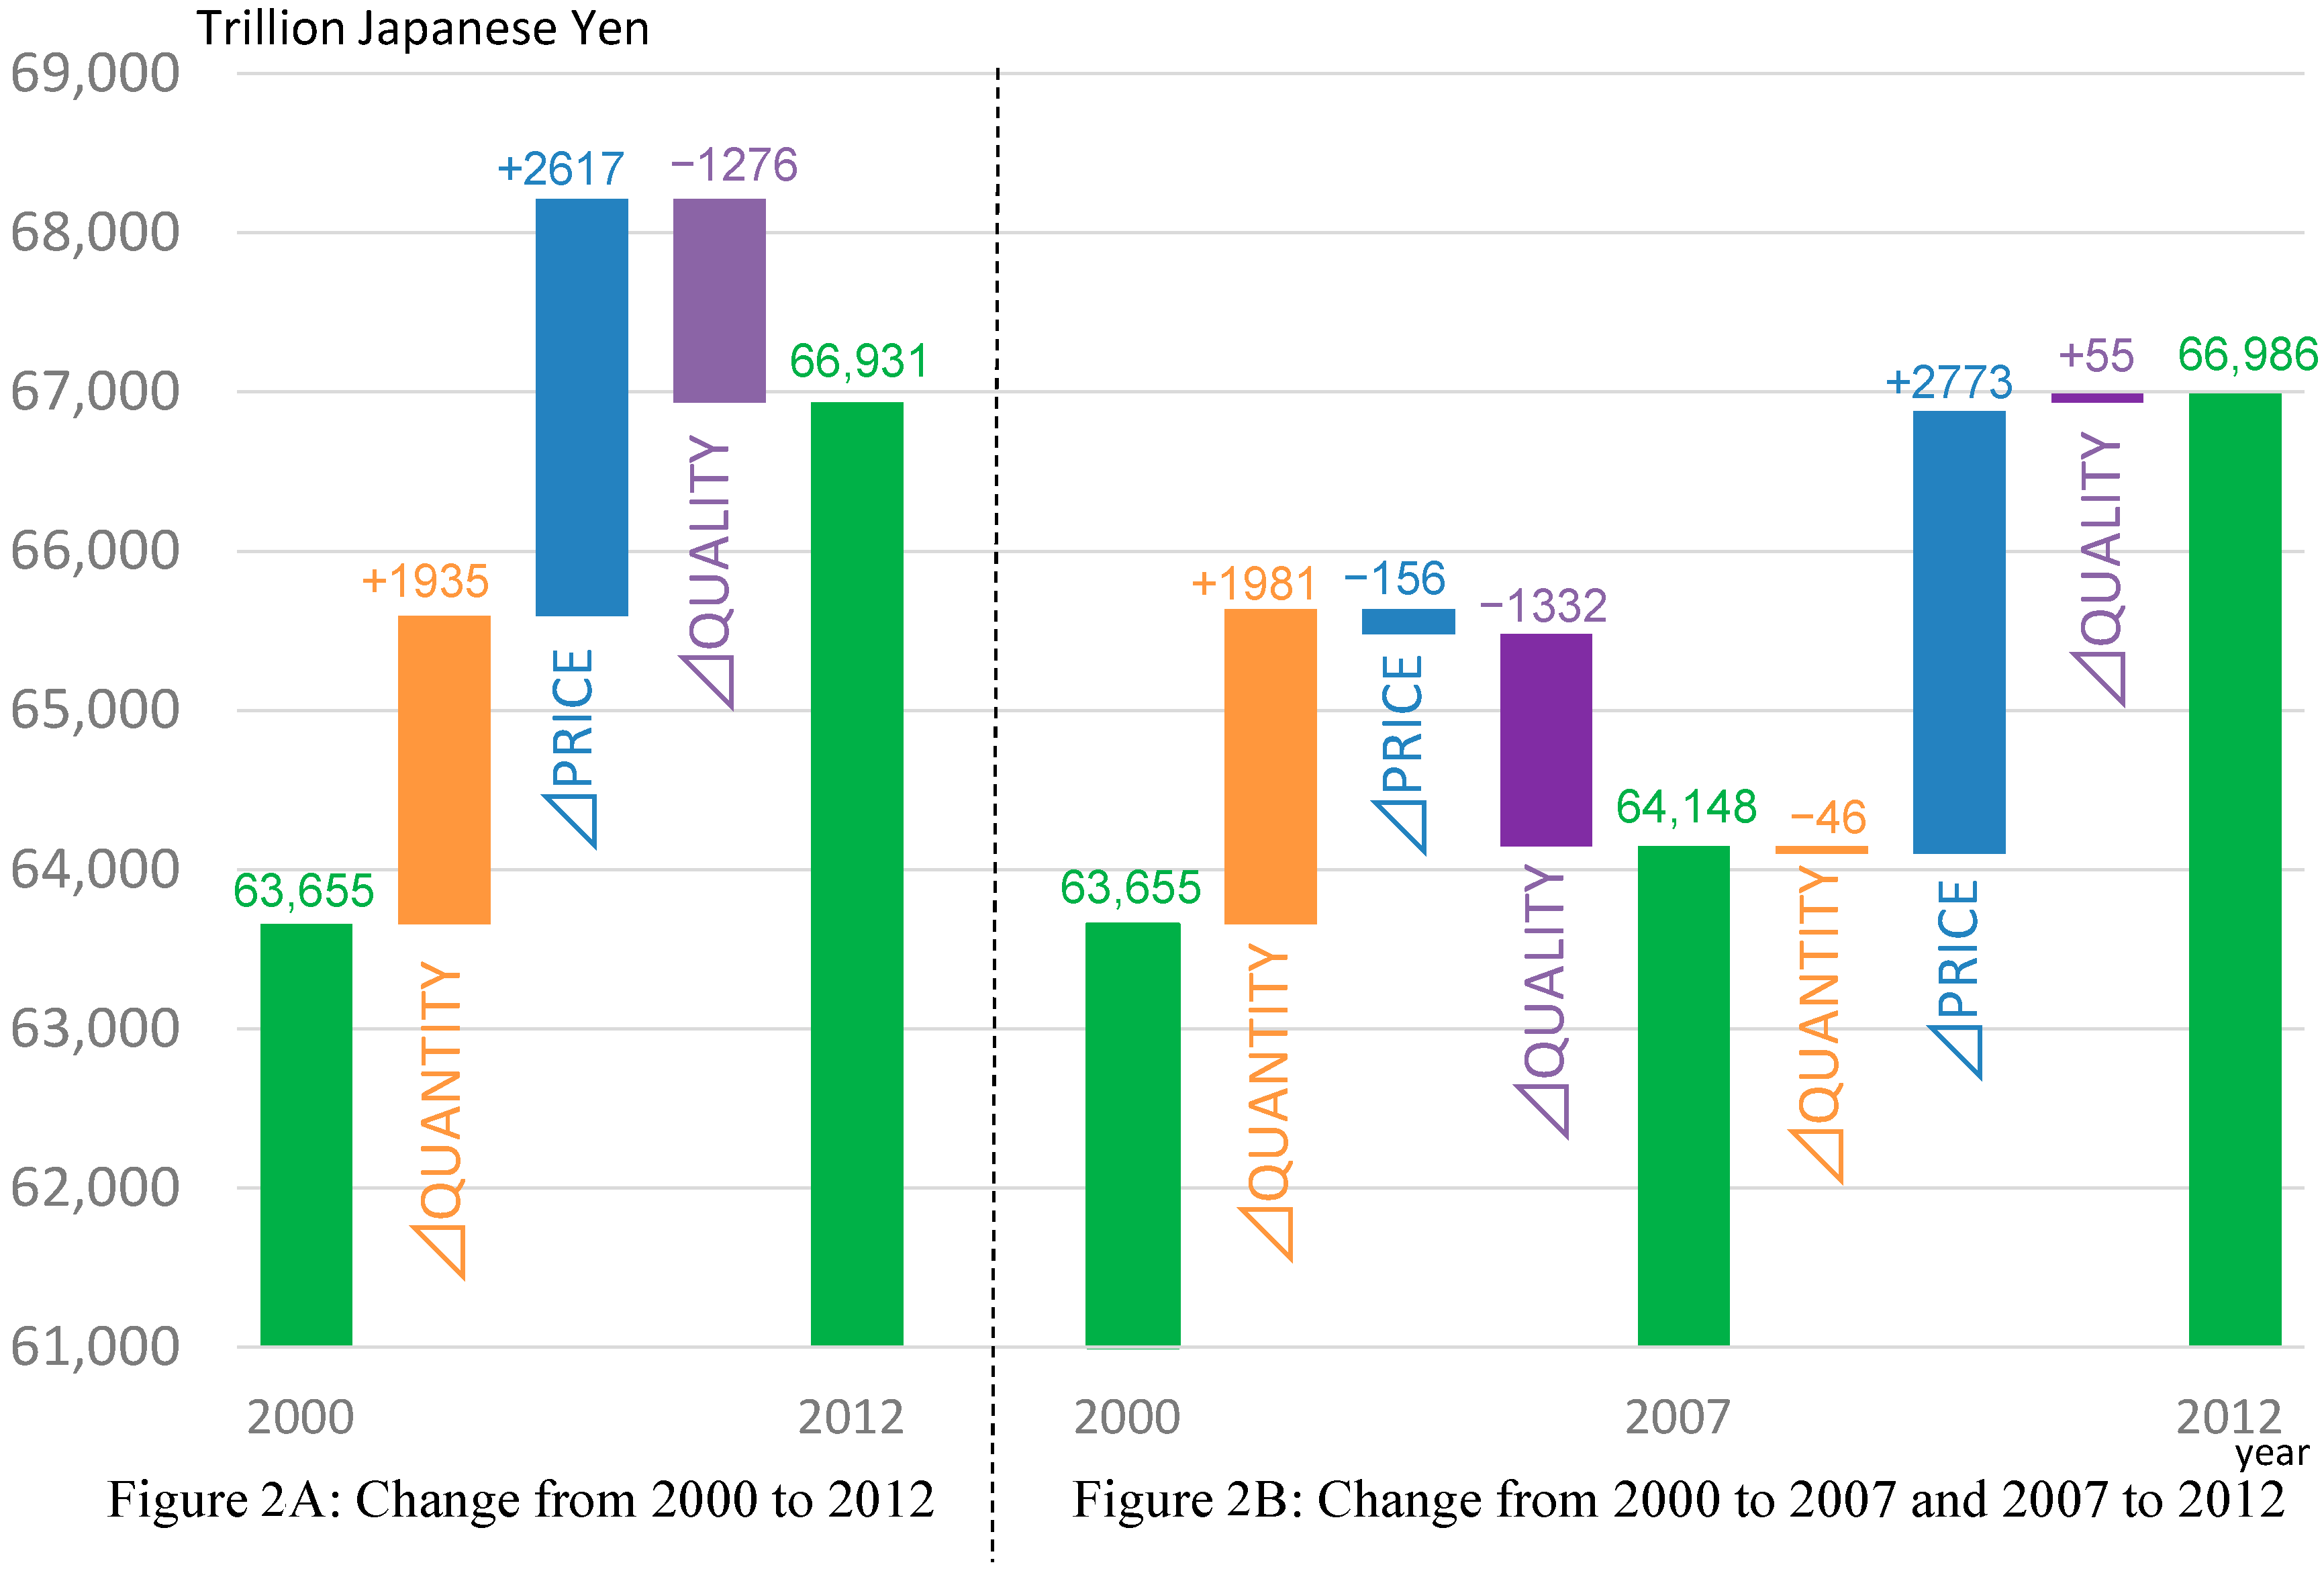
Figure 3.
Regional distribution of the value of forest ecosystem services.
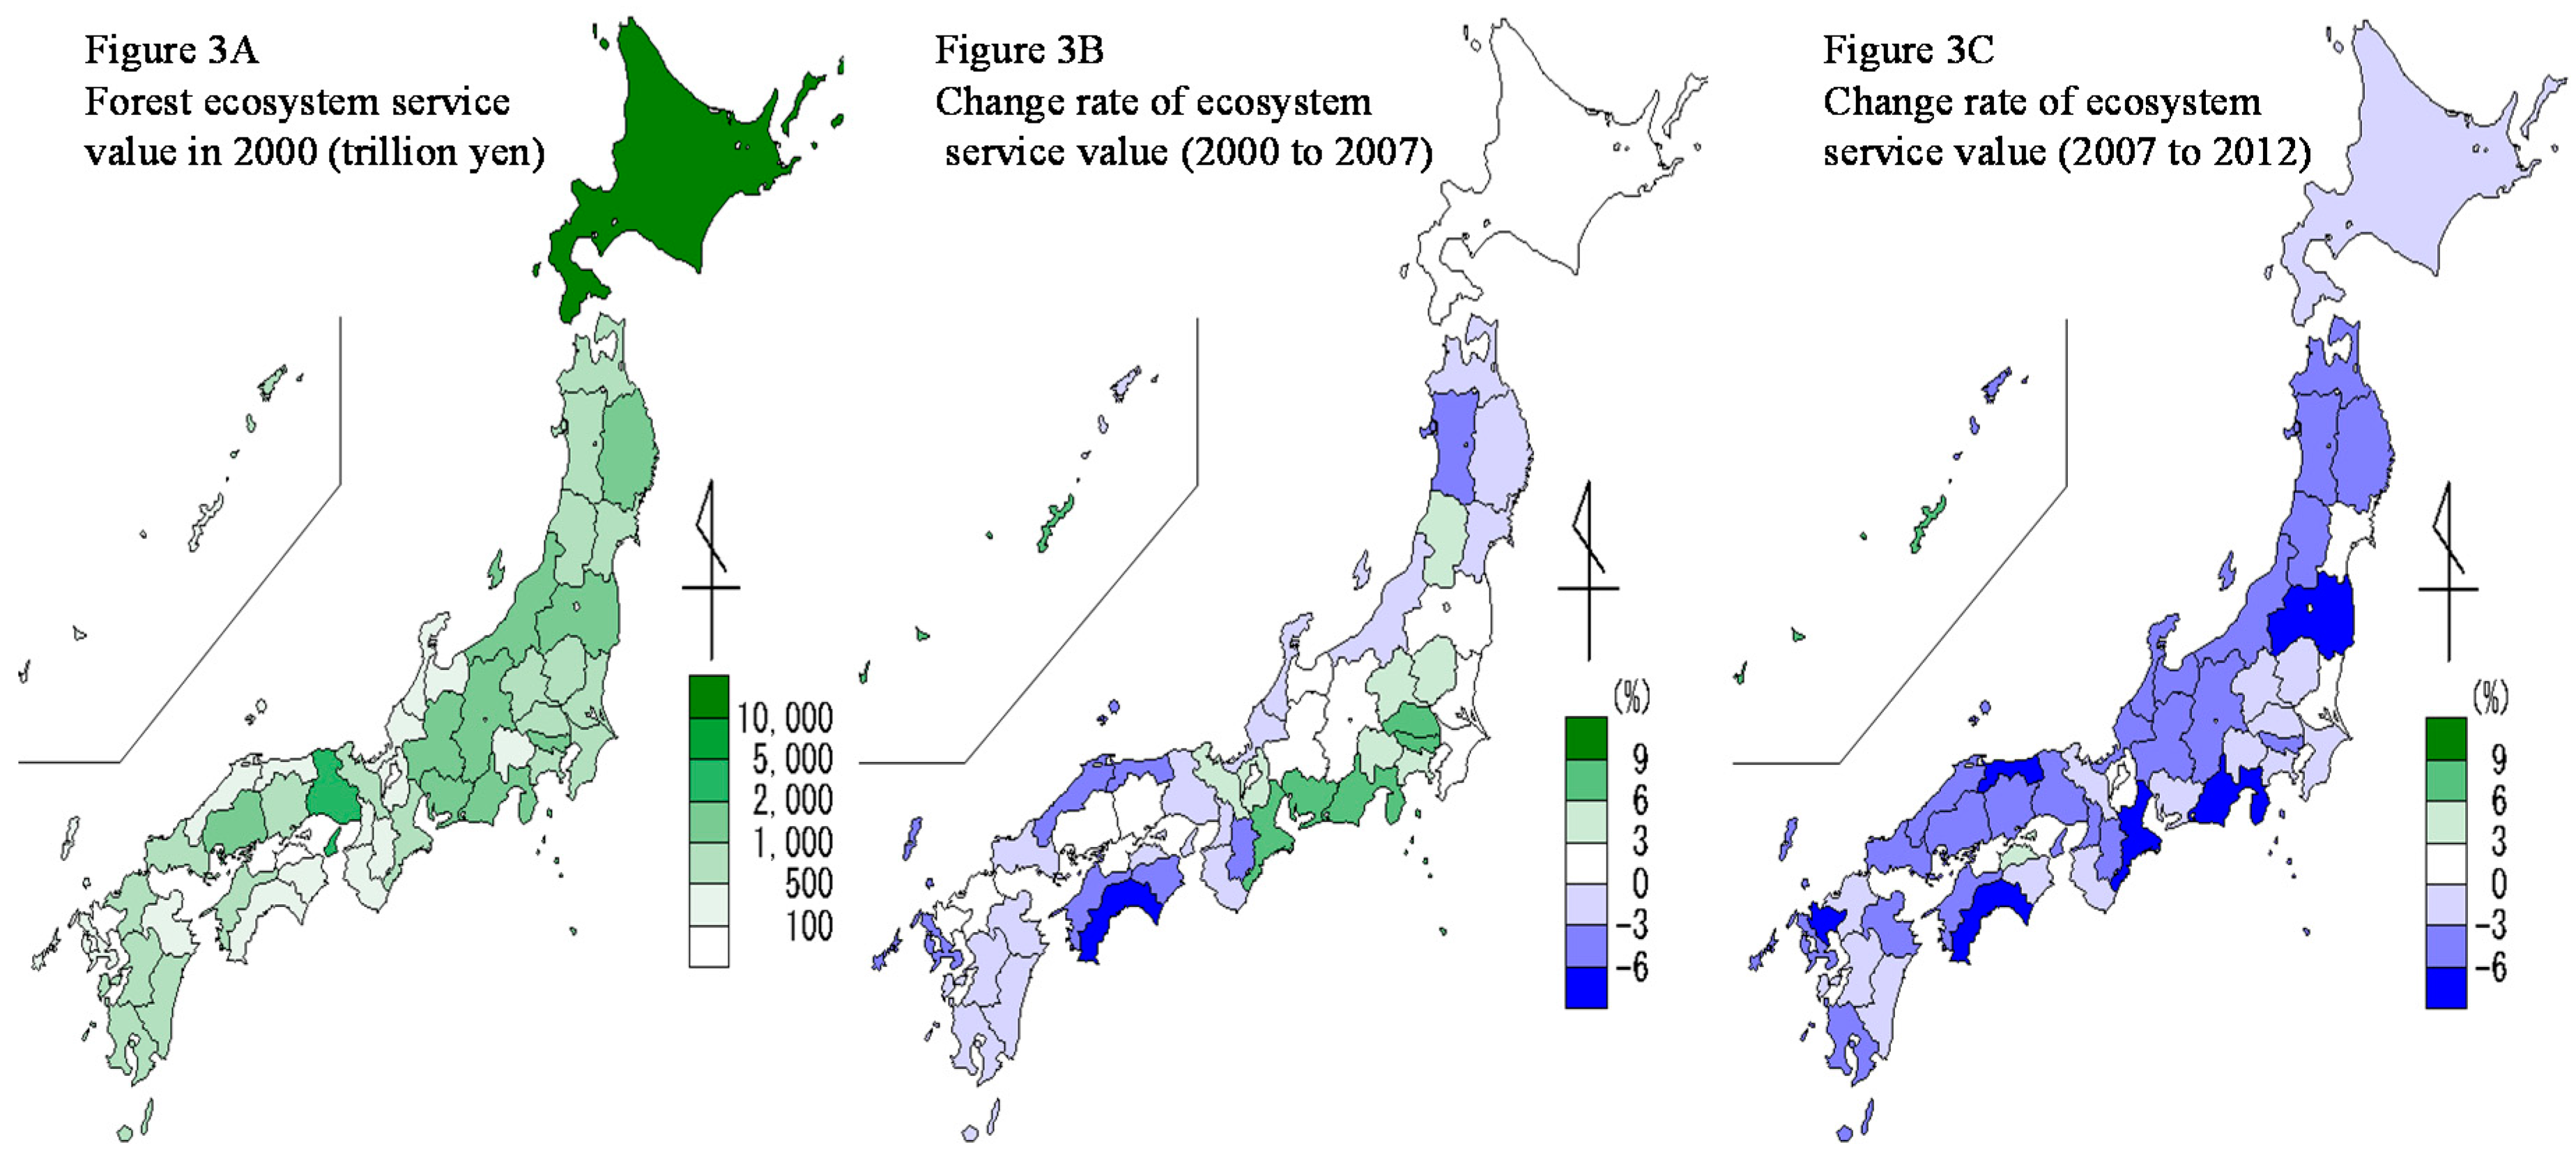
Figure 4.
Regional distribution of each decomposed factor from 2000 to 2007. Note: The sum of the prefectural scores in Figure 4A–C is equal to prefectural score in Figure 2B.
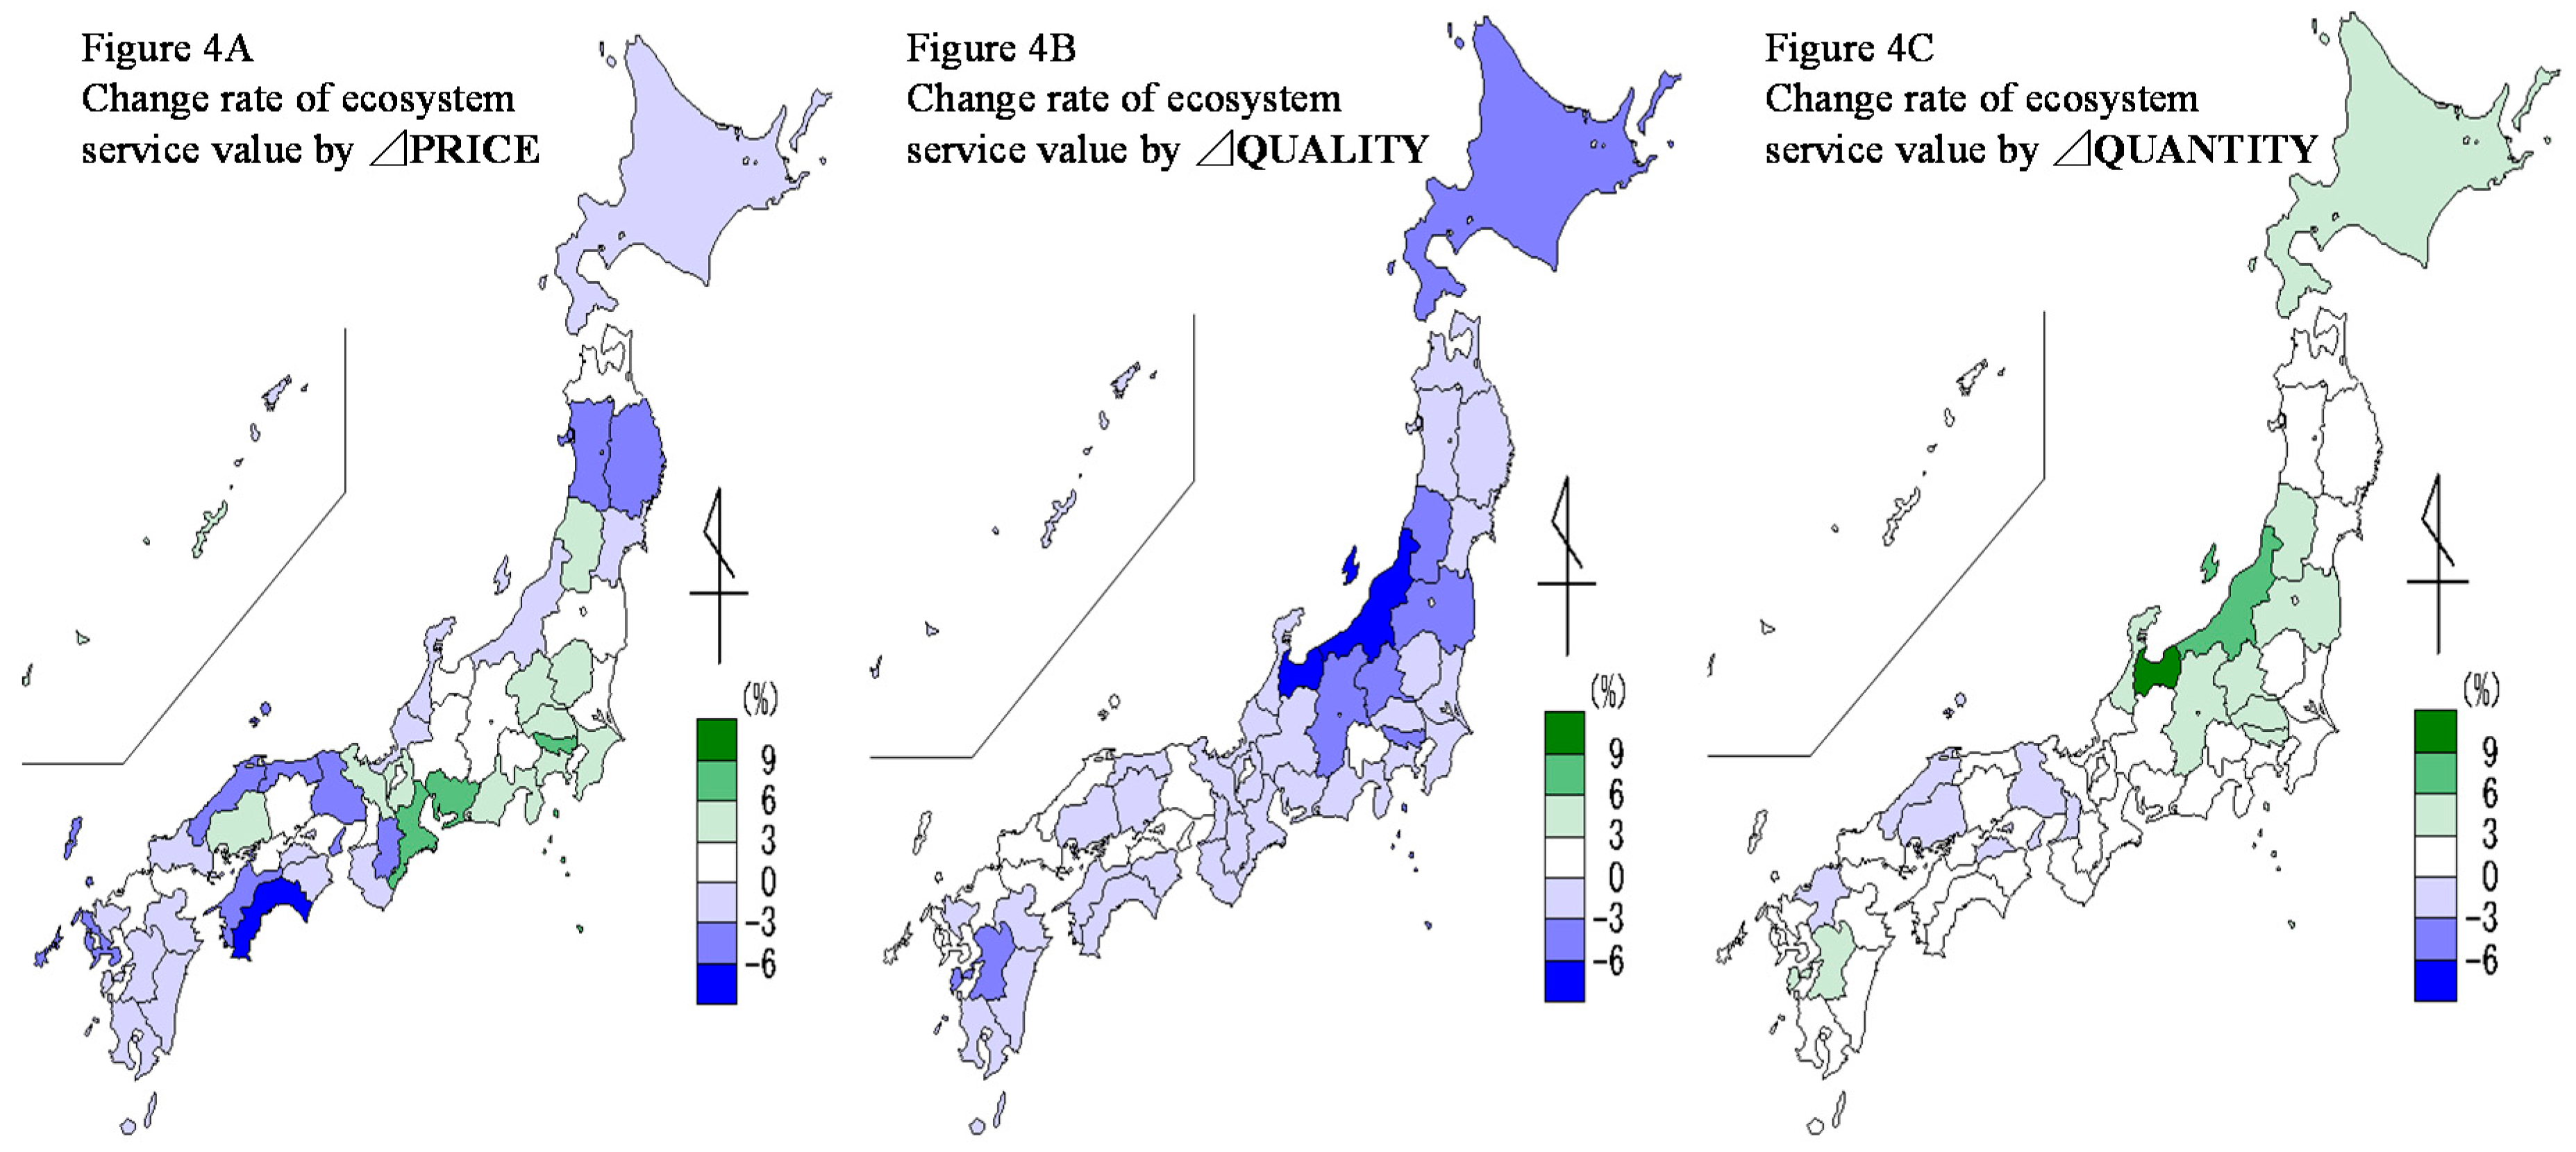
Figure 5.
Regional distribution of each decomposed factor from 2007 to 2012. Note: The sum of the prefectural scores in Figure 5A–C is equal to the prefectural score in Figure 2C.


Table 1.
Recognition of forest functions.
| The forest has various functions that include flood control and soil maintenance as well as timber provisions, recreation, etc. Among these functions, which one is the most important? Indicate the five most important functions from the list below. (Select top five items with rank order.) |
| ( ) Timber provision |
| ( ) Security from disasters (land conservation) |
| ( ) Water purification |
| ( ) Conservation of ecosystem and biodiversity |
| ( ) Provision of recreation services |
| ( ) Spiritual and religious value |
| ( ) Amenity and aesthetic value |
| ( ) CO2 sequestration |
| ( ) Genetic resource |
| ( ) Other |
Table 2.
Payment card contingent valuation method (CVM) question.
| Suppose that the local government is planning to preserve one additional hectare of forest by controlling development and promoting planting. This project requires additional public funding. How much would your household be willing to contribute to the increased costs of the project? Note that the charge will be collected by the local government and used as a fund only for the project. |
| JPY( )(the respondents answer by showing payment card) |
Table 3.
Regression model results estimating the forest value.
| Coefficient Score | Standard Error | t-Value | |
|---|---|---|---|
| β1 (income value) | 1.41 × 10⁻⁴ | 1.88 × 10⁻⁶ | 75.2 |
| β2 (woman share) | −355.45 | 18.77 | −18.94 |
| β3 (age) | −19.89 | 0.76 | −26.03 |
| β4 (natural forest share) | −337.96 | 127.82 | −2.64 |
| β5 (broadleaf share) | 694.95 | 116.24 | 5.98 |
| β6 (forest age) | −9.47 | 2.52 | −3.76 |
| Β7 (forest size) | −207.45 | 58.04 | −3.57 |
| Constant | 2897.27 | 153.14 | 18.92 |
| Sample size | 195,194 | ||
| Adj R-squared | 0.0343 | ||
Table 4.
Description of the data used in the decomposition analysis.
| Year | Data Variable | Unit | Mean | SD | Min | Max |
|---|---|---|---|---|---|---|
| 2000 | Ecosystem services value per forest area (PRICE) | Million yen/ha | 2703 | 3053 | 525 | 17,249 |
| Tree covered land area (A) | ha | 499,825 | 719,882 | 54,059 | 5,081,098 | |
| Unstocked area | ha | 13,386 | 21,244 | 958 | 139,524 | |
| Forest area (QUANTITY) (B) | ha | 513,211 | 739,258 | 55,494 | 5,220,622 | |
| Share of tree covered area in forest area [QUALITY: (A)/(B)] | % (ha/ha) | 97.1% | 2.2% | 90.4% | 99.5% | |
| 2007 | Ecosystem services value per forest area (PRICE) | Million yen/ha | 2762 | 3226 | 502 | 18,456 |
| Tree covered land area (A) | ha | 502,923 | 734,926 | 53,771 | 5,191,577 | |
| Unstocked area | ha | 25,696 | 50,316 | 1257 | 329,089 | |
| Forest area (QUANTITY) (B) | ha | 528,619 | 781,922 | 55,301 | 5,520,666 | |
| Share of tree covered area in forest area [QUALITY: (A)/(B)] | % (ha/ha) | 95.5% | 3.7% | 78.5% | 99.0% | |
| 2012 | Ecosystem services value per forest area (PRICE) | Million yen/ha | 2688 | 3135 | 469 | 17,766 |
| Tree covered land area (A) | ha | 502,507 | 735,741 | 53,485 | 5,198,986 | |
| Unstocked area | ha | 25,558 | 49,044 | 1,088 | 318,966 | |
| Forest area (QUANTITY) (B) | ha | 528,065 | 781,587 | 55,012 | 5,517,952 | |
| Share of tree covered area in forest area [QUALITY: (A)/(B)] | % (ha/ha) | 95.6% | 3.6% | 78.5% | 99.1% |
© 2017 by the authors. Licensee MDPI, Basel, Switzerland. This article is an open access article distributed under the terms and conditions of the Creative Commons Attribution (CC BY) license (http://creativecommons.org/licenses/by/4.0/).
Share and Cite
MDPI and ACS Style
Fujii, H.; Sato, M.; Managi, S. Decomposition Analysis of Forest Ecosystem Services Values. Sustainability 2017, 9, 687. https://doi.org/10.3390/su9050687
AMA Style
Fujii H, Sato M, Managi S. Decomposition Analysis of Forest Ecosystem Services Values. Sustainability. 2017; 9(5):687. https://doi.org/10.3390/su9050687
Chicago/Turabian StyleFujii, Hidemichi, Masayuki Sato, and Shunsuke Managi. 2017. "Decomposition Analysis of Forest Ecosystem Services Values" Sustainability 9, no. 5: 687. https://doi.org/10.3390/su9050687
Note that from the first issue of 2016, this journal uses article numbers instead of page numbers. See further details here.