
MCDM Assessment of a Healthy and Safe Built Environment According to Sustainable Development Principles: A Practical Neighborhood Approach in Vilnius

 ,
,  ,
,
Abstract
:1. Introduction
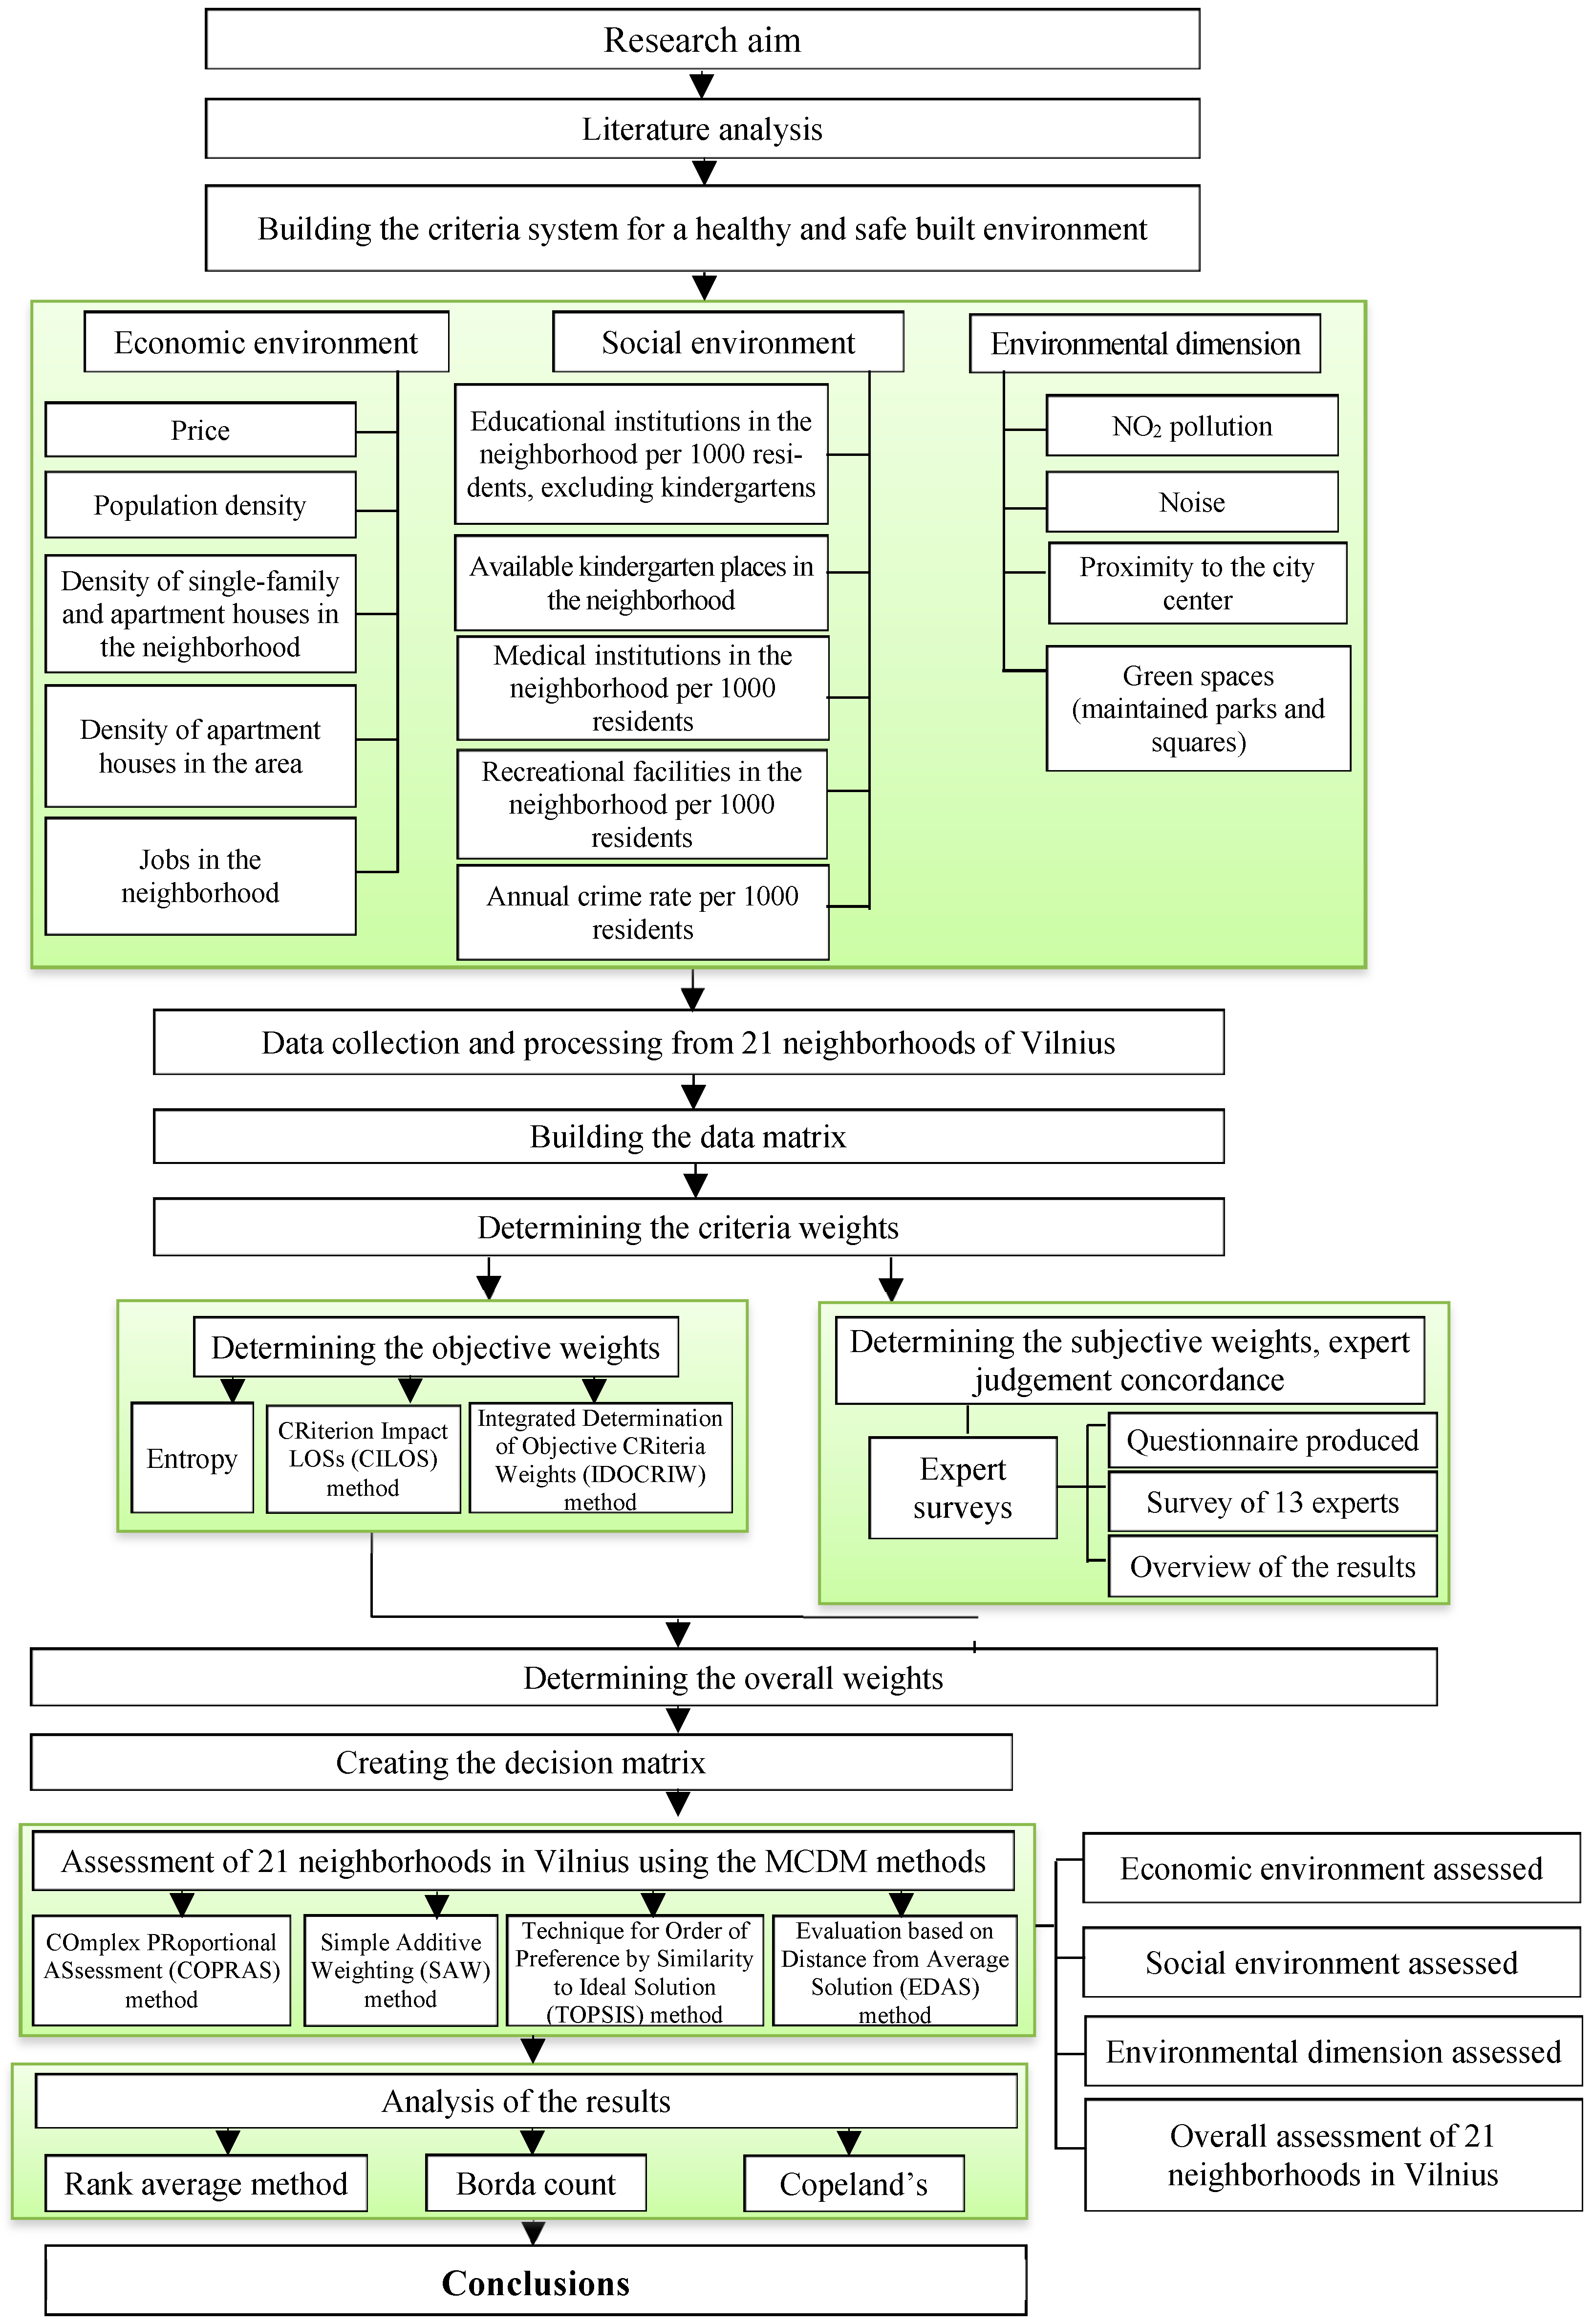
2. Research Methodology
3. Criteria of a Sustainable Built Environment and the Assessment Criteria for a Healthy and Safe Built Environment
- Economic environment factors:
- ∘
- housing prices;
- ∘
- population density;
- ∘
- density of single-family and two-family houses;
- ∘
- density of blocks of flats;
- ∘
- number of jobs.
- Social environment factors:
- ∘
- number of educational institutions (except for kindergartens);
- ∘
- number of places in kindergartens;
- ∘
- number of healthcare institutions;
- ∘
- number of recreational facilities;
- ∘
- crime rates.
- Environmental factors:
- ∘
- air pollution;
- ∘
- noise;
- ∘
- distance to the city center;
- ∘
- green spaces (maintained large parks and small green urban spaces).
4. Selection of the Survey Object
5. The Criteria Weights’ Determination Methods
5.1. Determining the Objective Criteria Weights
5.1.1. The Entropy Method
5.1.2. The Criteria Impact Loss: CILOS Method
5.1.3. Aggregate Objective Weights: The IDOCRIW Method
5.2. Determining the Subjective Criteria Weights Based on an Expert Survey
5.3. Overall Objective and Subjective Weights
6. The Methods Applied
6.1. The COPRAS Method
6.2. The SAW Method
6.3. The TOPSIS Method
6.4. The EDAS Method
6.5. Borda Count and Copeland’s Methods
- A matrix for the assessment (ranking) Sij () of alternatives (a1, a2, …, an) is built with the methods M1, M2, …, Mk applied (Table 5). The average ranking S1, S2, …, Sn for each alternative is calculated.
- The average rankings are then used for paired comparison of the rationality of all alternatives to determine which alternative has the lower average. Matrix B for the comparison of alternatives is built (Table 6). The alternatives compared in the matrix score either one or zero, where one signifies that the alternative in that row is more rational than the alternative in that column, and zero signifies that the alternative is not more rational or they both are equally rational.
- The relative rationality values of each alternative (neighborhood) are added together horizontally .
- The relative rationality values of each alternative (neighborhood) are added together vertically and the alternative’s “losses” are calculated.
- The rational alternative:
7. Results Produced by the MCDM Methods
8. The Assessment Results of the Vilnius Neighborhoods
9. Discussion and Conclusions
- The literature analysis determined that the development of a healthy and safe built environment must rest on the key principles of sustainable development, i.e., the integration of the economic environment, the social environment and the environmental dimension.
- A sustainable built environment is an inseparable component of sustainable community building. Communities should have hospitals, schools, green spaces, public transport and other facilities within easy reach. The community must feel safe and healthy.
- The assessment criteria for a healthy and safe built environment were classified according to the key principles of sustainable development. The economic environment and the social environment were assessed against five criteria; the environmental dimension was assessed against four criteria.
- The objective weights of the criteria for a healthy and safe built environment were determined using the entropy, CILOS and IDOCRIW methods. The subjective weights were determined based on expert judgement, with 13 experts involved. All of the assessments produced concordance of opinion. The objective and subjective weights were integrated to produce the overall weights that ensure a more reliable assessment of the significance the criteria have in the context of sustainable development. According to overall criteria weights, price and population density play the biggest role in the assessment of a healthy and safe built environment in the economic environment. Out of the social environment criteria, the number of medical institutions and the crime rate have the biggest impact. An analysis of the environmental dimension criteria shows that green spaces and air pollution have the biggest impact on the assessments.
- The Vilnius neighborhoods were assessed using the MCDM methods such as COPRAS, SAW, TOPSIS and EDAS. The calculations were a two-stage process. The Vilnius neighborhoods were assessed for each environment, and then, an overall assessment was made in the context of a healthy and safe built environment. The calculations show that the assessments of 21 neighborhoods in Vilnius based on economic, social and environmental criteria differ due to the different impact each environment has on the overall assessment results. In terms of the economic environment, Naujamiestis ranked the highest. In terms of the social environment and environmental protection, Senamiestis was rated the best.
- The results for all three methods (the rank average, Borda count and Copeland’s) are identical. It follows that Senamiestis is the healthiest and safest neighborhood compared to the others with reference to the principles of sustainable development.
Author Contributions
Conflicts of Interest
References
- Anderson, J.E.; Wulfhorst, G.; Lang, W. Energy analysis of the built environment—A review and outlook. Renew. Sustain. Energy Rev. 2015, 44, 149–158. [Google Scholar] [CrossRef]
- Joffe, H.; Smith, N. City dweller aspirations for cities of the future: How do environmental and personal wellbeing feature? Cities 2016, 58, 102–112. [Google Scholar] [CrossRef]
- Sallis, J.F.; Bull, F.; Burdett, R.; Frank, L.D.; Griffiths, P.; Giles-Coti, B.; Stevenson, M. Use of science to guide city planning policy and practice: How to achieve healthy and sustainable future cities. Lancet 2016, 388, 2936–2947. [Google Scholar] [CrossRef]
- Mohtashami, N.; Mahdavinejad, M.; Bemanian, M. Contribution of City Prosperity to Decisions on Healthy Building Design: A case study of Tehran. Front. Archit. Res. 2016, 5, 319–331. [Google Scholar] [CrossRef]
- Elwell, H.; Shulaker, B.; Rippon, J.; Wood, R. Strategic and integrated planning for healthy, connected cities: Chattanooga case study. Prev. Med. 2017, 95, S115–S119. [Google Scholar] [CrossRef] [PubMed]
- Ren, Z.; Anumba, C.J.; Yang, F. Development of CDPM matrix for the measurement of collaborative design performance in construction. Autom. Constr. 2013, 32, 14–23. [Google Scholar] [CrossRef]
- Walsh, C.J. Sustainable Climate Adaptation, the Critical Link between Sustainable Development & Climate Change in the Built Environment. 2012. Available online: http://www.sustainable-design.ie/sustain/CJWalsh-Paper_Sustainable-Adaptation_21-March-2010.pdf (accessed on 16 January 2016).
- Huang, H.; Yin, L. Creating sustainable urban built environments: An application of hedonic house price models in Wuhan, China. J. Hous. Built Environ. 2015, 30, 219–235. [Google Scholar] [CrossRef]
- Barbosa, M.T.G.; Almeida, M. Developing the methodology for determining the relative weight of dimensions employed in sustainable building assessment tools for Brazil. Ecol. Indic. 2017, 73, 46–51. [Google Scholar] [CrossRef]
- Diaz-Sarachaga, J.M.; Jato-Espino, D.; Alsulami, B.; Castro-Fresno, D. Evaluation of existing sustainable infrastructure rating systems for their application in developing countries. Ecol. Indic. 2016, 71, 491–502. [Google Scholar] [CrossRef]
- Pérez-Ortiz, M.; de la Paz-Marín, M.; Gutiérrez, P.A.; Hervás-Martínez, C. Classification of EU countries’ progress towards sustainable development based on ordinal regression techniques. Knowl.-Based Syst. 2014, 66, 178–189. [Google Scholar] [CrossRef]
- Pupphachai, U.; Zuidema, C. Sustainability indicators: A tool to generate learning and adaptation in sustainable urban development. Ecol. Indic. 2017, 72, 784–793. [Google Scholar] [CrossRef]
- Karaca, F.; Raven, P.G.; Machell, J.; Camci, F. A comparative analysis framework for assessing the sustainability of a combined water and energy infrastructure. Technol. Forecast. Soc. Chang. 2015, 90, 456–468. [Google Scholar] [CrossRef]
- Mulliner, E.; Malys, N.; Maliene, V. Comparative analysis of MCDM methods for the assessment of sustainable housing affordability. Omega 2016, 59, 146–156. [Google Scholar] [CrossRef]
- Nilashi, M.; Zakaria, R.; Ibrahim, O.; Majid, M.Z.A.; Zin, R.M.; Chugtai, M.W.; Abidin, N.I.Z.; Sahamir, S.R.; Yakubu, D.A. A knowledge-based expert system for assessing the performance level of green buildings. Knowl.-Based Syst. 2015, 86, 194–209. [Google Scholar] [CrossRef]
- Chen, Z.; Abdullah, A.B.; Anumba, C.J.; Li, H. ANP Experiment for Demolition Plan Evaluation. J. Constr. Eng. Manag. 2014, 140. [Google Scholar] [CrossRef]
- Dong, J.; Chi, Y.; Zou, D.; Fu, C.; Huang, Q.; Ni, M. Energy–environment–economy assessment of waste management systems from a life cycle perspective: Model development and case study. Appl. Energy 2014, 114, 400–408. [Google Scholar] [CrossRef]
- Motuzienė, V.; Rogoža, A.; Lapinskeinė, V.; Vilutienė, T. Construction solutions for energy efficient single-family house based on its life cycle multi-criteria analysis: A case study. J. Clean. Prod. 2016, 112, 532–541. [Google Scholar] [CrossRef]
- Xu, J.; Wand, Y.; Tao, Z. Rough approximation based strategy model between a green building developer and a contractor under a fuzzy environment. Knowl.-Based Syst. 2013, 46, 54–68. [Google Scholar] [CrossRef]
- Hwang, C.-L.; Yoon, K. Multiple Attribute Decision Making. Methods and Applications: A State-of-the-Art Survey; Springer: Berlin/Heidelberg, Germany, 1981. [Google Scholar]
- Ghorabaee, M.K.; Zavadskas, E.K.; Olfat, L.; Turskis, Z. Multi-criteria inventory classification using a new method of Evaluation based on Distance from Average Solution (EDAS). Informatica 2015, 26, 435–451. [Google Scholar] [CrossRef]
- Zavadskas, E.K.; Kaklauskas, A.; Sarka, V. The new method of multicriteria complex proportional assessment of projects. Technol. Econ. Dev. Econ. 1994, 1, 131–139. [Google Scholar]
- Siemens. The Green City Index, A Summary of the GREEN City Index Research Series. 2012. Available online: http://www.siemens.com/entry/cc/features/greencityindex_international/all/en/pdf/gci_report_summary.pdf (accessed on 20 January 2016).
- Mardani, A.; Jusoh, E.K.; Zavadskas, F.; Cavallaro, Z. Khalifah, Sustainable and Renewable Energy: An Overview of the Application of Multiple Criteria Decision Making Techniques and Approaches. Sustainability 2015, 7, 13947–13984. [Google Scholar] [CrossRef]
- Kaklauskas, A.; Zavadskas, E.K. Decision support system for innovation with a special emphasis on pollution. Int. J. Environ. Pollut. 2007, 30, 518–528. [Google Scholar] [CrossRef]
- Li, Y.; Cheng, H.; Beeton, R.J.S.; Sigler, T.; Halog, A. Sustainability from a Chinese cultural perspective: The implications of harmonious development in environmental management. Environ. Dev. Sustain. 2016, 13, 679–696. [Google Scholar] [CrossRef]
- Watts, P.; Custer, B.; Yi, Z.F.; Ontiri, E.; Pajaro, M. A Yin-Yang approach to education policy regarding health and the environment: Early-careerists’ image of the future and priority programmes. Nat. Resour. Forum 2015, 39, 202–213. [Google Scholar] [CrossRef]
- Hashemkhani Zolfani, S.; Zavadskas, E.K.; Turskis, Z. Design of products with both international and local perspectives based on Yin-Yang balance theory and SWARA method. Ekonom. Istraz. Econ. Res. 2013, 22, 153–166. [Google Scholar]
- Medineckiene, M.; Zavadskas, E.K.; Bjork, F.; Turskis, Z. Multi-criteria decision-making system for sustainable building assessment/certification. Arch. Civil Mech. Eng. 2015, 11, 11–18. [Google Scholar] [CrossRef]
- Wang, Y.H.; Deng, X.M.; Marcucci, D.J.; Le, Y.E. Sustainable Development Planning of Protected Areas near Cities: Case Study in China. J. Urban Plan. Dev.-Asce 2013, 132, 133–143. [Google Scholar] [CrossRef]
- Si, J.; Marjanovic-Halburd, L.; Nasiri, F.; Bell, S. Assessment of building-integrated green technologies: A review and case study on applications of Multi-Criteria Decision Making (MCDM) method. Sustain. Cities Soc. 2016, 27, 106–115. [Google Scholar] [CrossRef]
- Ignatius, J.; Rahman, A.; Yazdani, M.; Saparauskas, J.; Haron, S.H. An integrated fuzzy ANP-QFD approach for green building assessment. J. Civil Eng. Manag. 2016, 24, 551–563. [Google Scholar] [CrossRef]
- Zhang, L.; Xu, Y.; Yeh, C.H.; Liu, Y.; Zhou, D.Q. City sustainability evaluation using multi-criteria decision making with objective weights of interdependent criteria. J. Clean. Prod. 2016, 131, 491–499. [Google Scholar] [CrossRef]
- Zavadskas, E.K.; Kaklauskas, A. Model for Lithuanian construction industry development. Transform. Bus. Econ. 2008, 1, 152–168. [Google Scholar] [CrossRef]
- Pourahmad, A.; Hosseini, A.; Banaitis, A.; Nasiri, H.; Banaitiene, N.; Tzeng, G.H. Combination of fuzzy-AHP and DEMATEL-ANP with GIS in a new hybrid MCDM model used for the selection of the best space for leisure in a blighted urban site. Technol. Econ. Dev. Econ. 2015, 25, 773–796. [Google Scholar] [CrossRef]
- Liou, J.J.H. New concepts and trends of MCDM for tomorrow—In honor of professor Gwo-Hshiung Tzeng on the occasion of his 70th birthday. Technol. Econ. Dev. Econ. 2013, 12, 367–375. [Google Scholar] [CrossRef]
- Cavallaro, F. Fuzzy TOPSIS approach for assessing thermal-energy storage in concentrated solar power (CSP) systems. Appl. Energy 2010, 87, 496–503. [Google Scholar] [CrossRef]
- Cavallaro, F. Multi-criteria decision aid to assess concentrated solar thermal technologies. Renew. Energy 2009, 34, 1678–1685. [Google Scholar] [CrossRef]
- Saaty, T.J.; Ergu, D. When is a Decision-Making Method Trustworthy? Criteria for Evaluating Multi-Criteria Decision-Making Methods. Int. J. Inform. Technol. Decis. Making 2015, 16, 1171–1187. [Google Scholar] [CrossRef]
- Kou, G.; Ergu, D.; Lin, C.S.; Chen, Y. Pairwise comparison matrix in multiple criteria decision making. Technol. Econ. Dev. Econ. 2016, 25, 738–765. [Google Scholar] [CrossRef]
- Antucheviciene, J.; Kou, G.; Maliene, V.; Vaidogas, E.R. Mathematical Models for Dealing with Risk in Engineering. Math. Probl. Eng. 2016, 2016, 1–3. [Google Scholar] [CrossRef]
- Li, G.X.; Kou, G.; Peng, Y. Dynamic fuzzy multiple criteria decision making for performance evaluation. Technol. Econ. Dev. Econ. 2015, 25, 705–719. [Google Scholar] [CrossRef]
- Kanapeckienė, L.; Kaklauskas, A.; Zavadskas, E.K.; Raslanas, S. Method and system for multi-attribute market value assessment in analysis of construction and retrofit projects. Expert Syst. Appl. 2011, 311, 14196–14207. [Google Scholar] [CrossRef]
- Mardani, A.; Jusoh, K.M.D.; Nor, Z.; Khalifah, N.; Zakwan, A. Valipour, Multiple criteria decision-making techniques and their applications—A review of the literature from 2000 to 2014. Econ. Res.-Ekonom. Istraz. 2015, 21, 516–571. [Google Scholar] [CrossRef]
- Tzeng, G.-H.; Huang, J.-J. Multiple Attribute Decision Making: Methods and Applications; CRC Press: Boca Raton, FL, USA, 2011. [Google Scholar]
- Liou, J.H.J.; Tamošaitienė, J.; Zavadskas, E.K.; Tzeng, G.-H. New hybrid COPRAS-G MADM Model for improving and selecting suppliers in green supply chain management. Int. J. Prod. Res. 2016, 51, 114–134. [Google Scholar] [CrossRef]
- Kaklauskas, A.; Zavadskas, E.K.; Lapinskeine, V.; Sliogeriene, J.; Gudauskas, R.; Raistenskis, J.; Cerkauskiene, R.; Jackute, I.; Kumzaite, S. Multiple-Criteria Analysis of Life Cycle of Energy-Efficient Built Environment. In Nearly Zero Energy Building Refurbishment: A Multidisciplinary Approach; Torgal, F.P., Mistretta, M., Kaklauskas, A., Granqvist, C.G., Cabeza, L.F., Eds.; Springer: London, UK, 2013; pp. 299–324. [Google Scholar]
- Keall, M.D.; Pierse, N.; Howden-Chapman, P.; Cunningham, C.; Cunningham, M.; Guria, J.; Baker, M.G. Home modifications to reduce injuries from falls in the Home Injury Prevention Intervention (HIPI) study: A cluster-randomised controlled trial. Lancet 2015, 385, 231–238. [Google Scholar] [CrossRef]
- Keall, M.D.; Howden-Chapman, P.; Baker, M.G.; Kamalesh, V.; Cunningham, M.; Cunningham, C.; Guria, J.; Draper, R.; Skelton, P. Formulating a programme of repairs to structural home injury hazards in New Zealand. Accid. Anal. Prev. 2013, 57, 124–130. [Google Scholar] [CrossRef] [PubMed]
- Viteikiene, M.; Zavadskas, E.K. Evaluating the Sustainability of Vilnius City Residential Areas. J. Civ. Eng. Manag. 2007, 2, 149–155. [Google Scholar]
- Dempsey, N.; Brown, C.; Bramley, G. The key to sustainable urban development in UK cities? The influence of density on social sustainability. Prog. Plan. 2012, 73, 89–141. [Google Scholar] [CrossRef]
- Maliene, V.; Malys, N. High-quality housing—A key issue in delivering sustainable communities. Build. Environ. 2009, 42, 426–430. [Google Scholar] [CrossRef]
- Ceccato, V.; Lukyte, N. Safety and sustainability in a city in transition: The case of Vilnius, Lithuania. Cities 2011, 28, 83–94. [Google Scholar] [CrossRef]
- Lee, Y.; Lim, S.; Kim, G. Improvement characteristics shown in holistic regeneration of Ballymun toward sustainable community. Build. Environ. 2010, 45, 279–286. [Google Scholar] [CrossRef]
- IPH Action Areas in Health Inequalities—Developing Healthy and Sustainable Communities. 2010. Available online: http://iph.ie/healthinequalities/healthylivingenvironments (accessed on 6 March 2015).
- Lotteau, M.; Loubet, P.; Pousse, M.; Dufrasnes, E.; Sonnemann, G. Critical review of life cycle assessment (LCA) for the built environment at the neighborhood scale. Build. Environ. 2015, 93, 165–178. [Google Scholar] [CrossRef]
- Mulliner, E.; Smallbone, K.; Maliene, V. An assessment of sustainable housing affordability using a multiple criteria decision making method. Omega 2013, 41, 270–279. [Google Scholar] [CrossRef]
- Sohn, D.-W. Residential crimes and neighbourhood built environment: Assessing the effectiveness of crime prevention through environmental design (CPTED). Cities 2016, 52, 86–93. [Google Scholar] [CrossRef]
- Charoenkit, S.; Kumar, S. Environmental sustainability assessment tools for low carbon and climate resilient low income housing settlements. Renew. Sustain. Energy Rev. 2014, 38, 509–525. [Google Scholar] [CrossRef]
- Conejos, S.; Langston, C.; Smith, J. AdaptSTAR model: A climate-friendly strategy to promote built environment sustainability. Habitat Int. 2013, 37, 95–103. [Google Scholar] [CrossRef]
- Conejos, S.; Langston, C.; Smith, J. Designing for better building adaptability: A comparison of adaptSTAR and ARP models. Habitat Int. 2014, 41, 85–91. [Google Scholar] [CrossRef]
- Cozens, P. Crime prevention through environmental design in Western Australia: Planning for sustainable urban futures. Int. J. Sustain. Dev. Plan. 2008, 3, 272–292. [Google Scholar] [CrossRef]
- Arni, A.G.; Khairil, W.A. Promoting Collaboration between Local Community and Park Management towards Sustainable Outdoor Recreation. Proc. Soc. Behav. Sci. 2013, 91, 57–65. [Google Scholar] [CrossRef]
- Chan, E.; Lee, G.K.L. Critical factors for improving social sustainability of urban renewal projects. Soc. Indic. Res. 2008, 82, 243–256. [Google Scholar] [CrossRef]
- Deng, Y.; Li, Z.; Quigley, J.M. Economic returns to energy-efficient investments in the housing market: Evidence from Singapore. Reg. Sci. Urban Econ. 2012, 43, 506–515. [Google Scholar] [CrossRef]
- El Asmar, J.-P.; Taki, A.H. Sustainable rehabilitation of the built environment in Lebanon. Sustain. Cities Soc. 2014, 10, 22–38. [Google Scholar] [CrossRef]
- Fitzgerald, B.G.; O’Doherty, T.; Moles, R.; O’Regan, B. A quantitative method for the evaluation of policies to enhance urban sustainability. Ecol. Indic. 2012, 18, 371–378. [Google Scholar] [CrossRef]
- Lamķquiz, P.J.; López-Domķnguez, J. Effects of built environment on walking at the neighbourhood scale. A new role for street networks by modelling their configurational accessibility? Transp. Res. 2015, 74, 148–163. [Google Scholar] [CrossRef]
- Nuuter, T.; Lill, I.; Tupenaite, L. Comparison of housing market sustainability in European countries based on multiple criteria assessment. Land Use Policy 2015, 42, 642–651. [Google Scholar] [CrossRef]
- Oltean-Dumbrava, C.; Watts, G.; Miah, A. Transport infrastructure: Making more sustainable decisions for noise reduction. J. Clean. Prod. 2013, 42, 58–68. [Google Scholar] [CrossRef]
- Sun, X.; Liu, X.; Li, F.; Tao, Y.; Song, Y. Comprehensive evaluation of different scale cities’ sustainable development for economy, society, and ecological infrastructure in China. J. Clean. Prod. 2015. [Google Scholar] [CrossRef]
- Xing, Y.; Horner, R.M.W.; El-Hamar, M.A.; Bebbington, J. A framework model for assessing sustainability impacts of urban development. Account. Forum 2009, 33, 209–224. [Google Scholar] [CrossRef]
- Yin, Y.; Mizokami, S.; Aikawa, K. Compact development and energy consumption: Scenario analysis of urban structures based on behavior simulation. Appl. Energy 2015, 159, 449–457. [Google Scholar] [CrossRef]
- ERABUILD. State-of-the-Art of Benchmarking in Construction and Real Estate—Developing Indicators for Transparency. CREDIT Report 1; Project Application; Danish Building Research Institute: Aalborg, Denmark, 2007. [Google Scholar]
- Lazauskaitė, D.; Burinskienė, M.; Podvezko, V. Subjectively and objectively integrated assessment of the quality indices of the suburban residential environment. Int. J. Strat. Property Manag. 2015, 19, 297–308. [Google Scholar] [CrossRef]
- Zavadskas, E.K.; Podvezko, V. Integrated determination of objective criteria weights in MCDM. Int. J. Inform. Technol. Decis. Making 2016, 12, 267–283. [Google Scholar] [CrossRef]
- Kurilov, J.; Vinogradova, I.; Kubilinskienė, S. New MCEQLS fuzzy AHP methodology for evaluating learning repositories: A tool for technological development of economy. Technol. Econ. Dev. Econ. 2016, 21, 142–155. [Google Scholar] [CrossRef]
- Shannon, C.E. A mathematical theory of communication. Bell Syst. Tech. J. 1948, 27, 379–423. [Google Scholar] [CrossRef]
- Cavallaro, F.; Zavadskas, E.K.; Raslanas, S. Evaluation of Combined Heat and Power (CHP) Systems Using Fuzzy Shannon Entropy and Fuzzy TOPSIS. Sustainability 2016, 8, 556. [Google Scholar] [CrossRef]
- Mirkin, B. Problema Grupovogo Vibora; Halsted Press: Moskva, Russia, 1974. [Google Scholar]
- MacCrimmon, K.R. Decision Making among Multiple—Attribute Alternatives: Survey and Consolidated Approach. RAND Memorandum; Rand Corporation: St. Monica, CA, USA, 1968. [Google Scholar]
- Borda, J.C. Memoire sur les Elections au Scrutiny; Histoire de l’Academie Royale des Sciences: Paris, France, 1781. [Google Scholar]
- McLean, I. The Borda and Condorcet principles: Three medieval applications. Soc. Choice Welf. 1990, 2, 99–108. [Google Scholar] [CrossRef]
- Erlandson, R. System Evaluation Methodologies: Combined Multi-dimensional Scaling and Ordering Techniques. IEEE Trans. Syst. Man Cybern. 1978, 6, 421–432. [Google Scholar] [CrossRef]
- Fishburn, P. A Comparative Analyses of Group Decision Methods. Behav. Sci. 1971, 16, 538–544. [Google Scholar] [CrossRef]
- Kendall, M. Rank Correlation Methods; Griffin: London, UK, 1975. [Google Scholar]


| Authors | Assessment Criteria for a Sustainable Built Environment as a Building Block of a Healthy and Safe Environment |
|---|---|
| Anderson et al. [1] | Urban form, density (residential, job, neighborhoods), transportation, infrastructure, consumption. |
| Huang and Yin [8] | House prices, green spaces. |
| Mulliner et al. [14,57] | House prices in relation to incomes, rental costs in relation to incomes, interest rates and mortgage availability, availability of social and private rented accommodation, availability of affordable home ownership products, safety (crime level), access to employment opportunities, access to public transport services, access to good quality schools, access to shops, access to health services, access to childcare, access to leisure facilities, access to open green public spaces, quality of housing, energy efficiency of housing, availability of waste management facilities, desirability of the neighborhood area, deprivation in the area, environmental problems (e.g., litter, traffic). |
| Kaklauskas et al. [47] | Green spaces, infrastructure, transportation, unemployment, vandalism, education, neighborhood, air quality, social and recreational centers, ecologically-clean and almost noiseless environments. |
| Viteikiene and Zavadskas [50] | The city center is close, extensive supply of trade services, the schools are close, the kindergartens are close, extensive recreational opportunities, clean air, a nice environment, safe, good transport service to the city center, good transport service to the workplace, a well-attended environment, no noise, no drug addicts, the policlinics are close, the drugstores are close, good facilities for sports, lots of cultural institutions, no alcoholics in sight, no homeless people in sight, the workplace is close, pleasant architecture, well-attended parks. |
| Dempsey et al. [51] | Density, accessible public transport networks, access to services and facilities, safety, job opportunities, education, the neighborhood, green/open spaces, safety and security. |
| Maliene and Malys [52] | Hospitals, schools, shops, good public transport, clean and safe environment, open public spaces, affordability, technical and hygienic requirements, energy saving, ecological building materials. |
| Ceccato and Lukyte [53] | Crime level. |
| Lee et al. [54] | Housing, neighborhood facilities, childcare facilities, infrastructure, recreation and open space, health and safety, community safety, sport, leisure and recreation. |
| Sohn [58] | Density (residential crime, population, bus-stops, parks, streets, intersections), distance to the closest police station, median household income score, average number of building stories. |
| Charoenkit and Kumar [59] | Efficient use of land, walkability, access to public transport, safety, number of jobs/schools/amenities/parks, hospitals, etc., number of residential units, density. |
| Conejos et al. [60,61] | Density, accessibility, occupational health, safety and security, neighborhood and amenity. |
| Cozens [62] | Crime level. |
| Arni and Khairil [63] | Green spaces, recreation and leisure. |
| Chan and Lee [64] | Mass transport, houses, schools, care centers, hospitals, schools, leisure activities, availability of job opportunities, safety and security, density, open spaces and green areas, without traveling too far. |
| Deng and Quigley [65] | Average transaction price, housing stock. |
| El Asmar and Taki [66] | Air pollution, water pollution, building density, population, noise. |
| Fitzgerald et al. [67] | The criteria are grouped into the environment index (recycling, per capita waste volume, sewerage connections, forest areas within a 10-km radius, green energy interests, transport CO2 emissions, level of wastewater treatment etc.), the Socio-Economic index (services index, population density, households with central heating, house price income ratio etc.), the Quality of Life index (health insurance cover, distance to the nearest hospital, community involvement, odor problems, noise problems, sports area satisfaction, green area satisfaction etc.), the Transport index (relative car use, work distance <8 km, work distance >24 km, public transport use, km to the nearest train station, traffic flow index, monthly distance travelled to shops, distance to work, etc.). |
| Lamķquiz and López-Domķnguez [68] | Mobility habits, population, job, neighborhood, accessibility. |
| Nuuter et al. [69] | General economic criteria (GDP per capital, unemployment rate, inflation rate), housing stock criteria (total dwelling stock, number of dwellings, private ownership rate etc.), housing affordability criteria (total housing costs in Purchasing Power Standards (PPS), share of housing costs in disposable incomes, harmonized consumer price in housing index, aggregated affordability index, normal house price index etc.), population and social conditions (inequality of income distribution, population at risk of poverty, population with severe housing deprivation, etc.), housing quality criteria (housing overcrowding rate, average household size, etc.), environmental quality criteria (healthcare index, traffic index, noise from neighbors and street, pollution, crime, quality of life index, etc.). |
| Oltean-Dumbrava et al. [70] | Noise level, pollution. |
| Sun et al. [71] | The criteria for economic development mainly reflect three aspects of the urban economy: overall economic strength, people’s living standards and the industrial structure. The criteria for social progress mainly reflect three aspects of urban society: population quality, public services and living conditions. The criteria for the ecological infrastructure construction mainly include three perspectives of urban ecological infrastructure: the number of green spaces, land utilization and pollution control. |
| Xing et al. [72] | Environmental impact: energy, depletion of resource, climate changes: CO2 emissions, land use, waste, air pollution, biodiversity, water pollution, noise, ground pollution. Social impact: health, quality of life, crime, transportation, leisure, social capital, security, high unemployment, social equity, cultural diversity. Economic impact: whole life cost, job creation, economic growth, unaffordable housing, socio-economic inequity, economic development, wealth, distribution of wealth, leakage from local economies, built facilities/service. |
| Yin et al. [73] | Population density, housing affordability, greenhouse gas emissions, protection of open spaces, environmentally sensitive habitats, road accessibility. |
| Science Direct, Publications | Google Scholar, Results | |
|---|---|---|
| Subsystem of economic environment criteria | ||
| “Healthy and safe” “built environment” “cost” | 13,110 | 16,000 |
| 2017 (45), 2016 (1065), 2015 (987), 2014 (901), 2013 (781), 2012 (730), 2011 (513), 2010 (536), 2009 (487), 2008 (549), 2007 (488), 2006 (472), 2005 (461), 2004 (341), 2003 (350), 2002 (312), 2001 (310), 2000 (264), 1999 (238), 1998 (222), 1997 and earlier (3058) | ||
| “Healthy and safe” “built environment” “density” | 4546 | 6770 |
| 2017 (20), 2016 (418), 2015 (355), 2014 (314), 2013 (291), 2012 (291), 2011 (178), 2010 (183), 2009 (146), 2008 (162), 2007 (141), 2006 (127), 2005 (172), 2004 (100), 2003 (124), 2002 (99), 2001 (98), 2000 (79), 1999 (70), 1998 (59), 1997 and earlier (1119) | ||
| “Healthy and safe” “built environment” “jobs” | 6966 | 7470 |
| 2017 (24), 2016 (515), 2015 (523), 2014 (453), 2013 (425), 2012 (363), 2011 (271), 2010 (315), 2009 (256), 2008 (329), 2007 (263), 2006 (282), 2005 (256), 2004 (191), 2003 (210), 2002 (157), 2001 (142), 2000 (147), 1999 (142), 1998 (119), 1997 and earlier (1583) | ||
| Subsystem of social environment criteria | ||
| “Healthy and safe” “built environment” “schools” | 7239 | 8660 |
| 2017 (21), 2016 (633), 2015 (574), 2014 (547), 2013 (494), 2012 (413), 2011 (307), 2010 (325), 2009 (303), 2008 (353), 2007 (272), 2006 (288), 2005 (247), 2004 (156), 2003 (161), 2002 (138), 2001 (136), 2000 (133), 1999 (98), 1998 (85), 1997 and earlier (1555) | ||
| “Healthy and safe” “built environment” “pre-school” | 324 | 409 |
| 2016 (11), 2015 (12), 2014 (15), 2013 (20), 2012 (6), 2011 (9), 2010 (11), 2009 (8), 2008 (16), 2007 (10), 2006 (4), 2005 (6), 2004 (3), 2003 (3), 2002 (2), 2001 (4), 2000 (3), 1999 (7), 1998 (7), 1997 (3), 1996 and earlier (24) | ||
| “Healthy and safe” “built environment” “hospitals” | 3990 | 4290 |
| 2017 (13), 2016 (248), 2015 (274), 2014 (276), 2013 (208), 2012 (197), 2011 (147), 2010 (185), 2009 (172), 2008 (198), 2007 (163), 2006 (190), 2005 (144), 2004 (92), 2003 (96), 2002 (110), 2001 (68), 2000 (93), 1999 (58), 1998 (43), 1997 and earlier (1015) | ||
| “Healthy and safe” “built environment” “leisure” | 1282 | 4340 |
| 2017 (3), 2016 (60), 2015 (59), 2014 (62), 2013 (62), 2012 (57), 2011 (43), 2010 (63), 2009 (58), 2008 (82), 2007 (71), 2006 (78), 2005 (63), 2004 (42), 2003 (39), 2002 (41), 2001 (29), 2000 (20), 1999 (30), 1998 (28), 1997 and earlier (292) | ||
| “Healthy and safe” “built environment” “crime” | 1310 | 4290 |
| 2017 (4), 2016 (109), 2015 (92), 2014 (85), 2013 (109), 2012 (63), 2011 (54), 2010 (58), 2009 (50), 2008 (71), 2007 (53), 2006 (66), 2005 (56), 2004 (26), 2003 (34), 2002 (28), 2001 (32), 2000 (28), 1999 (15), 1998 (17), 1997 and earlier (260) | ||
| Subsystem of environmental criteria | ||
| “Healthy and safe” “built environment” “pollution” | 5574 | 8490 |
| 2017 (11), 2016 (447), 2015 (355), 2014 (353), 2013 (290), 2012 (301), 2011 (213), 2010 (179), 2009 (191), 2008 (204), 2007 (155), 2006 (166), 2005 (202), 2004 (127), 2003 (131), 2002 (143), 2001 (138), 2000 (121), 1999 (102), 1998 (106), 1997 and earlier (1639) | ||
| “Healthy and safe” “built environment” “noise” | 3594 | 6170 |
| 2017 (13), 2016 (266), 2015 (228), 2014 (242), 2013 (208), 2012 (196), 2011 (142), 2010 (125), 2009 (126), 2008 (150), 2007 (118), 2006 (116), 2005 (125), 2004 (70), 2003 (115), 2002 (99), 2001 (64), 2000 (67), 1999 (66), 1998 (57), 1997 and earlier (1001) | ||
| “Healthy and safe” “built environment” “distance” | 5639 | 7490 |
| 2017 (24), 2016 (472), 2015 (438), 2014 (369), 2013 (360), 2012 (341), 2011 (229), 2010 (255), 2009 (198), 2008 (236), 2007 (208), 2006 (178), 2005 (190), 2004 (136), 2003 (166), 2002 (126), 2001 (114), 2000 (110), 1999 (86), 1998 (90), 1997 and earlier (1313) | ||
| “Healthy and safe” “built environment” “parks” | 4002 | 5510 |
| 2017 (9), 2016 (290), 2015 (240), 2014 (246), 2013 (232), 2012 (202), 2011 (151), 2010 (166), 2009 (167), 2008 (194), 2007 (157), 2006 (158), 2005 (157), 2004 (89), 2003 (88), 2002 (98), 2001 (83), 2000 (77), 1999 (64), 1998 (56), 1997 and earlier (1078) |
| Economic Environment Factors | Social Environment Factors | Environmental Factors | % 1 | ||||||||||||
|---|---|---|---|---|---|---|---|---|---|---|---|---|---|---|---|
| Housing Prices | Population Density | Density of Single-Family and Two-Family Houses | Density of Blocks of Flats | Number of Jobs | Number of Educational Institutions (Except for Kindergartens) | Number of Places in Kindergartens | Number of Healthcare Institutions | Number of Recreational Facilities | Crime Rates | Air Pollution NO2 | Noise | Distance to the City Centre | Green Spaces (Maintained Large Parks and Small Green Urban Spaces) | ||
| Anderson et al. [1] | + | + | + | + | + | 35.71 | |||||||||
| Huang and Yin [8] | + | + | + | + | 28.57 | ||||||||||
| Mulliner et al. [14,57] | + | + | + | + | + | + | + | + | + | 64.29 | |||||
| Kaklauskas et al. [47] | + | + | + | + | + | + | + | + | + | 64.29 | |||||
| Viteikiene and Zavadskas [50] | + | + | + | + | + | + | + | + | + | + | + | 78.57 | |||
| Dempsey et al. [51] | + | + | + | + | + | + | + | + | 57.14 | ||||||
| Maliene and Malys [52] | + | + | + | + | + | + | + | + | 57.14 | ||||||
| Ceccato and Lukyte [53] | + | + | + | 21.43 | |||||||||||
| Lee et al. [54] | + | + | + | + | + | + | 42.86 | ||||||||
| Sohn [58] | + | + | + | + | 28.57 | ||||||||||
| Charoenkit and Kumar [59] | + | + | + | + | + | + | + | + | + | + | 71.43 | ||||
| Conejos et al. [60,61] | + | + | + | + | 28.57 | ||||||||||
| Cozens [62] | + | + | 14.29 | ||||||||||||
| Arni and Khairil [63] | + | + | 14.29 | ||||||||||||
| Chan and Lee [64] | + | + | + | + | + | + | + | + | + | + | + | 78.57 | |||
| Deng and Quigley [65] | + | + | + | 21.43 | |||||||||||
| El Asmar and Taki [66] | + | + | + | + | + | 35.71 | |||||||||
| Fitzgerald et al. [67] | + | + | + | + | + | + | + | + | + | + | 71.43 | ||||
| Lamķquiz and López-Domķnguez [68] | + | + | + | 21.43 | |||||||||||
| Nuuter et al. [69] | + | + | + | + | + | + | + | + | 57.14 | ||||||
| Oltean-Dumbrava et al. [70] | + | + | 14.29 | ||||||||||||
| Sun et al. [71] | + | + | + | + | + | 35.71 | |||||||||
| Xing et al. [72] | + | + | + | + | + | + | + | + | + | 64.29 | |||||
| Yin et al. [73] | + | + | + | + | 28.57 | ||||||||||
| % 2 | 38.46 | 61.54 | 26.92 | 26.92 | 50.00 | 34.62 | 30.77 | 53.85 | 42.31 | 61.54 | 38.46 | 26.92 | 57.69 | 57.69 | |
| Matavimo Vnt | Min/Max * | Antakalnis | Fabijoniškės | Grigiškės | Justiniškės | Karoliniškės | Lazdynai | Naujamiestis | Naujininkai | Naujoji Vilnia | Paneriai | |||
|---|---|---|---|---|---|---|---|---|---|---|---|---|---|---|
| Economic environment factors | Housing prices | Eur/m2 | - | 1888.34 | 1154.10 | 676.10 | 1080.61 | 1222.06 | 1190.30 | 1711.44 | 967.13 | 854.64 | 950.14 | |
| Population density | Residents number/km² | - | 504.40 | 9697.32 | 1580.99 | 9215.44 | 6817.50 | 3019.13 | 4840.00 | 758.42 | 793.16 | 91.12 | ||
| Density of single-family and two-family houses | Number/km2 | + | 44.62 | 106.59 | 76.90 | 39.26 | 11.50 | 54.66 | 116.04 | 40.54 | 89.03 | 19.11 | ||
| Density of blocks of flats | Number /km2 | - | 3.60 | 42.20 | 14.79 | 86.58 | 12.75 | 14.17 | 33.54 | 6.18 | 8.22 | 1.04 | ||
| Number of jobs per 1000 residents | Number | + | 18.20 | 9.30 | 2.00 | 4.60 | 7.20 | 7.20 | 94.60 | 21.50 | 11.00 | 41.70 | ||
| Social environment factors | Number of educational institutions (except for kindergartens) | Institutions 1000 residents | + | 0.4366 | 0.2515 | 0.3563 | 0.2549 | 0.3667 | 0.2894 | 0.5596 | 0.1925 | 0.5454 | 0.3876 | |
| Number of places in kindergartens | Number | + | 1630 | 1567 | 634 | 1731 | 1541 | 2104 | 1507 | 1371 | 1250 | 318 | ||
| Number of healthcare institutions per 1000 residents | Institutions 1000 residents | + | 0.4622 | 0.1006 | 0.0891 | 0.1821 | 0.1100 | 0.0965 | 0.3444 | 0.1283 | 0.0962 | 0.2584 | ||
| Recreational facilities in the neighborhood per 1000 residents | Institutions 1000 residents | + | 0.0770 | 0.1006 | 0.5345 | 0.1457 | 0.1834 | 0.0965 | 0.3874 | 0.2566 | 0.1283 | 0.3876 | ||
| Annual crime rate per 1000 residents | Number | - | 5.6497 | 6.2627 | 5.7907 | 4.843 | 5.6105 | 4.7395 | 13.1284 | 15.2385 | 8.9562 | 13.6951 | ||
| Environmental factors | Air pollution NO2 | µg/m3 | - | 16.5 | 18.4 | 12.8 | 8.9 | 19.89 | 33.4 | 16.87 | 11.6 | 19.92 | 15.15 | |
| Noise | dB | - | 69.4 | 62.93 | 64.49 | 44.2 | 55.57 | 56.22 | 56.94 | 54.37 | 52.05 | 53.29 | ||
| Distance to the city center | km | - | 4.3 | 5.4 | 19.8 | 6.6 | 6.9 | 7.1 | 1.6 | 4.1 | 12.6 | 14.3 | ||
| Green spaces (maintained large parks and small green urban spaces) | % | + | 7.20 | 11.15 | 1.14 | 1.34 | 7.39 | 2.69 | 1.83 | 1.22 | 3.43 | 1.22 | ||
| Matavimo Vnt | Min/Max * | Pašilaičiai | Pilaitė | Rasos | Senamiestis | Šeškinė | Verkiai | Vilk-pėdė | Viršu-liškės | Žirmūnai | Žvėrynas | Šnipiškės | ||
| Economic environment factors | Housing prices | Eur/m2 | - | 1136.80 | 1243.52 | 1601.00 | 2221.89 | 1055.02 | 1481.19 | 1205.37 | 1175.03 | 1582.93 | 2153.47 | 1612.65 |
| Population density | Residents number/km² | - | 4031.22 | 1472.46 | 834.41 | 4321.56 | 7121.14 | 757.93 | 2072.43 | 5893.20 | 5455.29 | 4103.33 | 4917.31 | |
| Density of single-family and two-family houses | Number/km² | + | 74.88 | 48.84 | 97.48 | 186.22 | 55.00 | 70.87 | 38.54 | 22.80 | 23.18 | 256.30 | 188.78 | |
| Density of blocks of flats | Number /km² | - | 13.29 | 7.68 | 9.37 | 40.67 | 41.36 | 5.03 | 11.55 | 31.60 | 27.65 | 72.59 | 56.09 | |
| Number of jobs (per 1000 residents) | Number | + | 10.70 | 6.00 | 7.70 | 49.20 | 9.20 | 22.30 | 9.50 | 7.30 | 37.90 | 10.40 | 21.50 | |
| Social environment factors | Number of educational institutions (except for kindergartens) | Institutions 1000 residents | + | 0.1513 | 0.1969 | 0.2831 | 0.9256 | 0.2553 | 0.1897 | 0.2811 | 0.5430 | 0.2588 | 0.5416 | 0.2607 |
| Number of places in kindergartens | Number | + | 1679 | 551 | 513 | 1015 | 2067 | 1787 | 1009 | 897 | 1479 | 1002 | 746 | |
| Number of healthcare institutions per 1000 residents | Institutions 1000 residents | + | 0.1513 | 0.1476 | 0.1887 | 0.4628 | 0.0638 | 0.3319 | 0.4685 | 0.0679 | 0.2804 | 0.2708 | 0.0652 | |
| Recreational facilities in the neighborhood per 1000 residents | Institutions 1000 residents | + | 0.0908 | 0.3445 | 0.0944 | 0.8227 | 0.1596 | 0.0948 | 0.0937 | 0.4751 | 0.2157 | 0.7221 | 0.3911 | |
| Annual crime rate per 1000 residents | Number | - | 5.9595 | 4.5276 | 13.7775 | 13.421 | 5.9681 | 5.9983 | 11.1965 | 6.7195 | 5.9737 | 7.2207 | 13.9486 | |
| Environmental factors | Air pollution NO2 | µg/m3 | - | 11.00 | 11.20 | 29.16 | 15.36 | 13.47 | 11.07 | 11.90 | 10.07 | 26.37 | 23.92 | 33.72 |
| Noise | dB | - | 48.34 | 49.55 | 52.43 | 54.96 | 52.68 | 31.82 | 53.72 | 45.64 | 57.69 | 49.17 | 41.56 | |
| Distance to the city center | Km | - | 5.9 | 7.1 | 2.5 | 1.6 | 3.7 | 4.9 | 2.9 | 5.7 | 5.6 | 1.2 | 2.3 | |
| Green spaces (maintained large parks and small green urban spaces) | % | + | 4.48 | 0.04 | 7.37 | 21.66 | 8.67 | 20.03 | 17.80 | 10.75 | 2.78 | 1.77 | 0.21 | |
| Methods | M1 | M2 | … | Mk | Average Ranking | |
|---|---|---|---|---|---|---|
| Alternatives | ||||||
| a1 | S11 | S12 | … | S1k | S1 | |
| a2 | S21 | S22 | … | S2k | S2 | |
| … | … | … | … | … | … | |
| an | Sn1 | Sn2 | … | Snk | Sn | |
| Alternative (Neighborhood) | Alternative (Neighborhood) | ||||
|---|---|---|---|---|---|
| a1 | a2 | … | an | ||
| a1 | - | a12 | … | a1n | P1 |
| a2 | a21 | - | … | a2n | P2 |
| … | … | … | … | … | … |
| an | an1 | an2 | … | - | Pn |
| N1 | N2 | … | Nn | ||
| Expert | 1 | 2 | 3 | 4 | 5 | 6 | 7 | 8 | 9 | 10 | 11 | 12 | 13 | Subjective Weight | |
|---|---|---|---|---|---|---|---|---|---|---|---|---|---|---|---|
| Judgement | % | % | % | % | % | % | % | % | % | % | % | % | % | ||
| Areas of sustainable development | Economic environment factors | 50 | 45 | 50 | 40 | 35 | 25 | 35 | 45 | 50 | 50 | 50 | 45 | 30 | 0.4231 |
| Social environment factors | 30 | 30 | 25 | 25 | 25 | 40 | 20 | 20 | 20 | 30 | 15 | 20 | 50 | 0.2692 | |
| Environmental factors | 20 | 25 | 25 | 35 | 40 | 35 | 45 | 35 | 30 | 20 | 35 | 35 | 20 | 0.3077 | |
| Economic environment factors | Housing price (Eur/m2) | 10 | 15 | 50 | 40 | 55 | 10 | 35 | 40 | 40 | 25 | 30 | 35 | 35 | 0.3231 |
| Population density | 30 | 25 | 20 | 25 | 12 | 26 | 20 | 15 | 25 | 15 | 10 | 15 | 18 | 0.1969 | |
| Density of single-family and two-family houses | 20 | 10 | 5 | 5 | 8 | 19 | 5 | 10 | 5 | 10 | 30 | 20 | 12 | 0.1223 | |
| Density of blocks of flats | 25 | 20 | 20 | 20 | 15 | 31 | 15 | 20 | 20 | 20 | 25 | 20 | 10 | 0.2008 | |
| Number of jobs | 15 | 30 | 5 | 10 | 10 | 14 | 25 | 15 | 10 | 30 | 5 | 10 | 25 | 0.1569 | |
| Social environment factors | Number of educational institutions (except for kindergartens) | 9 | 30 | 30 | 20 | 15 | 30 | 20 | 15 | 25 | 20 | 20 | 20 | 16 | 0.2077 |
| Number of places in kindergartens | 20 | 25 | 30 | 25 | 20 | 15 | 15 | 15 | 15 | 22 | 15 | 25 | 14 | 0.1969 | |
| Number of healthcare institutions | 30 | 16 | 5 | 15 | 25 | 20 | 25 | 10 | 15 | 18 | 5 | 5 | 10 | 0.1531 | |
| Number of recreational facilities | 1 | 9 | 5 | 10 | 5 | 10 | 10 | 10 | 10 | 15 | 10 | 10 | 20 | 0.0962 | |
| Annual crime rates | 40 | 20 | 30 | 30 | 35 | 25 | 30 | 50 | 35 | 25 | 50 | 40 | 40 | 0.3462 | |
| Environmental dimension factors | Air pollution NO2 | 14 | 20 | 10 | 17 | 20 | 35 | 10 | 15 | 20 | 20 | 30 | 25 | 15 | 0.2238 |
| Noise | 16 | 35 | 20 | 25 | 30 | 21 | 15 | 30 | 20 | 35 | 30 | 35 | 35 | 0.2669 | |
| Distance to the city center | 50 | 15 | 50 | 23 | 22 | 19 | 35 | 20 | 30 | 20 | 10 | 10 | 20 | 0.2415 | |
| Green spaces (maintained large parks and small green urban spaces) | 20 | 30 | 20 | 35 | 28 | 25 | 40 | 35 | 30 | 25 | 30 | 30 | 30 | 0.2677 |
| Entropy | CILOS | IDOCRIW | Subjective Weights | Overall Weights | |
|---|---|---|---|---|---|
| Housing prices | 0.1879 | 0.2132 | 0.2304 | 0.3231 | 0.3478 |
| Population density | 0.2970 | 0.1933 | 0.3303 | 0.1969 | 0.3039 |
| Density of single-family and two-family houses | 0.0308 | 0.3188 | 0.0564 | 0.1223 | 0.0322 |
| Density of blocks of flats | 0.2196 | 0.1369 | 0.1729 | 0.2008 | 0.1622 |
| Number of jobs | 0.2648 | 0.1378 | 0.2099 | 0.1569 | 0.1539 |
| COPRAS | SAW | TOPSIS | EDAS | Sum of Ranks | Overall Ranking | Rank Average Ranking | Borda Count Ranking | Cope-Land Ranking | |||||
|---|---|---|---|---|---|---|---|---|---|---|---|---|---|
| The Values of the Assessment Criteria | Rank | The Values of the Assessment Criteria | Rank | The Values of the Assessment Criteria | Rank | The Values of the Assessment Criteria | Rank | ||||||
| 1. Antakalnis | 0.0545 | 8 | 0.0551 | 7 | 0.3260 | 10 | 0.5107 | 10 | 35 | 9 | 9 | 9 | 9 |
| 2. Fabijoniškės | 0.0332 | 15 | 0.0330 | 12 | 0.2611 | 17 | 0.2910 | 17 | 61 | 15 | 15 | 15 | 15 |
| 3. Grigiškės | 0.0338 | 13 | 0.0291 | 14 | 0.2930 | 12 | 0.4257 | 13 | 52 | 13 | 13 | 13 | 13 |
| 4. Justiniškės | 0.0146 | 21 | 0.0149 | 21 | 0.0739 | 21 | 0.0023 | 21 | 84 | 21 | 21 | 21 | 21 |
| 5. Karoliniškės | 0.0147 | 20 | 0.0151 | 19 | 0.2139 | 18 | 0.2217 | 19 | 76 | 19 | 19 | 19 | 19 |
| 6. Lazdynai | 0.0283 | 17 | 0.0251 | 17 | 0.2682 | 16 | 0.3908 | 16 | 66 | 17 | 17 | 17 | 17 |
| 7. Naujamiestis | 0.1008 | 2 | 0.0990 | 2 | 0.6708 | 1 | 0.9485 | 1 | 6 | 1 | 1 | 1 | 1 |
| 8. Naujininkai | 0.0546 | 7 | 0.0458 | 8 | 0.3282 | 9 | 0.5235 | 8 | 32 | 7–8 | 7–8 | 7–8 | 7–8 |
| 9. Naujoji Vilnia | 0.0538 | 9 | 0.0456 | 9 | 0.3400 | 7 | 0.5423 | 7 | 32 | 7–8 | 7–8 | 7–8 | 7–8 |
| 10. Paneriai | 0.1200 | 1 | 0.1753 | 1 | 0.3984 | 5 | 0.6175 | 3 | 10 | 2–3 | 2–3 | 2–3 | 2–3 |
| 11. Pašilaičiai | 0.0336 | 14 | 0.0316 | 13 | 0.2900 | 13 | 0.4462 | 11 | 51 | 12 | 12 | 12 | 12 |
| 12. Pilaitė | 0.0348 | 12 | 0.0290 | 15 | 0.2850 | 14 | 0.4082 | 14 | 55 | 14 | 14 | 14 | 14 |
| 13. Rasos | 0.0476 | 10 | 0.0425 | 10 | 0.3391 | 8 | 0.5201 | 9 | 37 | 10 | 10 | 10 | 10 |
| 14. Senamiestis | 0.0813 | 3 | 0.0796 | 3 | 0.5864 | 2 | 0.7827 | 2 | 10 | 2–3 | 2–3 | 2–3 | 2–3 |
| 15. Šeškinė | 0.0232 | 18 | 0.0226 | 18 | 0.1906 | 19 | 0.2514 | 18 | 73 | 18 | 18 | 18 | 18 |
| 16. Verkiai | 0.0599 | 6 | 0.0543 | 5 | 0.3596 | 6 | 0.5917 | 4 | 21 | 6 | 6 | 6 | 6 |
| 17. Vilkpėdė | 0.0300 | 16 | 0.0254 | 16 | 0.2731 | 15 | 0.3947 | 15 | 62 | 16 | 16 | 16 | 16 |
| 18. Viršuliškės | 0.0161 | 19 | 0.0150 | 20 | 0.1862 | 20 | 0.2209 | 20 | 79 | 20 | 20 | 20 | 20 |
| 19. Žirmūnai | 0.0394 | 11 | 0.0377 | 11 | 0.3208 | 11 | 0.4402 | 12 | 45 | 11 | 11 | 11 | 11 |
| 20. Žvėrynas | 0.0656 | 4 | 0.0649 | 4 | 0.4774 | 3 | 0.5652 | 6 | 17 | 4 | 4 | 4 | 4 |
| 21. Šnipiškės | 0.0603 | 5 | 0.0592 | 6 | 0.4416 | 4 | 0.5737 | 5 | 20 | 5 | 5 | 5 | 5 |
| Entropy | CILOS | IDOCRIW | Subjective Weights | Overall Weights | |
|---|---|---|---|---|---|
| Number of educational institutions (except for kindergartens) | 0.1185 | 0.1924 | 0.1180 | 0.2077 | 0.1342 |
| Number of places in kindergartens | 0.1439 | 0.1277 | 0.0951 | 0.1969 | 0.1025 |
| Number of healthcare institutions | 0.2638 | 0.2993 | 0.4085 | 0.1531 | 0.3424 |
| Number of recreational facilities | 0.3546 | 0.1180 | 0.2165 | 0.0962 | 0.1140 |
| Annual crime rate per 1000 residents | 0.1192 | 0.2626 | 0.1619 | 0.3462 | 0.3069 |
| COPRAS | SAW | TOPSIS | EDAS | Sum of Ranks | Overall Ranking | Rank Average Ranking | Borda Count Ranking | Cope-land Ranking | |||||
|---|---|---|---|---|---|---|---|---|---|---|---|---|---|
| The Values of the Assessment Criteria | Rank | The Values of the Assessment Criteria | Rank | The Values of the Assessment Criteria | Rank | The Values of the Assessment Criteria | Rank | ||||||
| 1. Antakalnis | 0.0706 | 2 | 0.0706 | 2 | 0.6994 | 1 | 0.7816 | 2 | 7 | 2 | 2 | 2 | 2 |
| 2. Fabijoniškės | 0.0381 | 17 | 0.0381 | 16 | 0.3556 | 17 | 0.2984 | 17 | 67 | 17 | 17 | 17–18 | 17 |
| 3. Grigiškės | 0.0437 | 12 | 0.0437 | 12 | 0.3816 | 13 | 0.3710 | 11 | 48 | 12 | 12 | 13–14 | 12–13 |
| 4. Justiniškės | 0.0511 | 8 | 0.0511 | 8 | 0.4556 | 8 | 0.4906 | 8 | 32 | 8 | 8 | 8 | 8 |
| 5. Karoliniškės | 0.0438 | 11 | 0.0438 | 11 | 0.3862 | 12 | 0.3908 | 10 | 44 | 11 | 11 | 11 | 11 |
| 6. Lazdynai | 0.0463 | 10 | 0.0463 | 10 | 0.4006 | 10 | 0.3703 | 12 | 42 | 10 | 10 | 10 | 10 |
| 7. Naujamiestis | 0.0579 | 4 | 0.0579 | 4 | 0.5358 | 7 | 0.5575 | 6 | 21 | 5 | 5 | 5 | 5 |
| 8. Naujininkai | 0.0316 | 19 | 0.0316 | 19 | 0.1872 | 20 | 0.0895 | 20 | 78 | 19–20 | 19–20 | 19–20 | 19–20 |
| 9. Naujoji Vilnia | 0.0356 | 18 | 0.0356 | 18 | 0.2984 | 18 | 0.2782 | 18 | 72 | 18 | 18 | 17–18 | 18 |
| 10. Paneriai | 0.0425 | 13 | 0.0425 | 13 | 0.3752 | 14 | 0.3054 | 15 | 55 | 14 | 14 | 13–14 | 14 |
| 11. Pašilaičiai | 0.0419 | 15 | 0.0419 | 15 | 0.3970 | 11 | 0.3620 | 13 | 54 | 13 | 13 | 12 | 12–13 |
| 12. Pilaitė | 0.0471 | 9 | 0.0471 | 9 | 0.4205 | 9 | 0.3914 | 9 | 36 | 9 | 9 | 9 | 9 |
| 13. Rasos | 0.0307 | 20 | 0.0307 | 20 | 0.2363 | 19 | 0.1129 | 19 | 78 | 19–20 | 19–20 | 19–20 | 19–20 |
| 14. Senamiestis | 0.0781 | 1 | 0.0781 | 1 | 0.6718 | 2 | 0.8023 | 1 | 5 | 1 | 1 | 1 | 1 |
| 15. Šeškinė | 0.0397 | 16 | 0.0357 | 17 | 0.3613 | 15 | 0.3038 | 16 | 64 | 16 | 16 | 16 | 16 |
| 16. Verkiai | 0.0571 | 5 | 0.0571 | 5 | 0.5810 | 5 | 0.5977 | 4 | 19 | 4 | 4 | 4 | 4 |
| 17. Vilkpėdė | 0.0569 | 6 | 0.0569 | 6 | 0.6043 | 3 | 0.5507 | 7 | 22 | 6 | 6 | 6 | 6 |
| 18. Viršuliškės | 0.0423 | 14 | 0.0423 | 14 | 0.3593 | 16 | 0.3617 | 14 | 58 | 15 | 15 | 15 | 15 |
| 19. Žirmūnai | 0.0549 | 7 | 0.0549 | 7 | 0.5422 | 6 | 0.5931 | 5 | 25 | 7 | 7 | 7 | 7 |
| 20. Žvėrynas | 0.0625 | 3 | 0.0625 | 3 | 0.5862 | 4 | 0.7127 | 3 | 13 | 3 | 3 | 3 | 3 |
| 21. Šnipiškės | 0.0277 | 21 | 0.0277 | 21 | 0.1507 | 21 | 0.0293 | 21 | 84 | 21 | 21 | 21 | 21 |
| Entropy | CILOS | IDOCRIW | Subjective Weights | Overall Weights | |
|---|---|---|---|---|---|
| Air pollution NO2 | 0.2470 | 0.2934 | 0.3520 | 0.2238 | 0.3179 |
| Noise | 0.2517 | 0.0147 | 0.0180 | 0.2669 | 0.0194 |
| Distance to the city center | 0.3403 | 0.1026 | 0.1695 | 0.2415 | 0.1652 |
| Green spaces (maintained large parks and small green urban spaces) | 0.1609 | 0.5894 | 0.1606 | 0.2677 | 0.4976 |
| COPRAS | SAW | TOPSIS | EDAS | Sum of Ranks | Overall Ranking | Rank Average Ranking | Borda Count Ranking | Cope-Land Ranking | |||||
|---|---|---|---|---|---|---|---|---|---|---|---|---|---|
| The Values of the Assessment Criteria | Rank | The Values of the Assessment Criteria | Rank | The Values of the Assessment Criteria | Rank | The Values of the Assessment Criteria | Rank | ||||||
| 1. Antakalnis | 0.0518 | 7 | 0.0476 | 10 | 0.4717 | 8 | 0.5524 | 7 | 32 | 8 | 8 | 8 | 8 |
| 2. Fabijoniškės | 0.0626 | 5 | 0.0589 | 5 | 0.5891 | 4 | 0.6357 | 5 | 19 | 5 | 5 | 5 | 5 |
| 3. Grigiškės | 0.0128 | 21 | 0.0171 | 21 | 0.1214 | 21 | 0.0159 | 21 | 84 | 21 | 21 | 21 | 21 |
| 4. Justiniškės | 0.0277 | 15 | 0.0279 | 15 | 0.3467 | 16 | 0.3344 | 15 | 61 | 16 | 16 | 16 | 16 |
| 5. Karoliniškės | 0.0453 | 10 | 0.0423 | 11 | 0.4556 | 9 | 0.4972 | 9 | 39 | 9 | 9 | 9 | 9 |
| 6. Lazdynai | 0.0244 | 16–17 | 0.0222 | 18 | 0.3385 | 17 | 0.2738 | 17 | 68.5 | 17 | 17 | 17 | 17 |
| 7. Naujamiestis | 0.0456 | 9 | 0.0495 | 9 | 0.4208 | 11 | 0.4126 | 11 | 40 | 10 | 10 | 10–11 | 10 |
| 8. Naujininkai | 0.0341 | 13 | 0.0293 | 14 | 0.3815 | 14 | 0.3657 | 13 | 54 | 13 | 13 | 13 | 13 |
| 9. Naujoji Vilnia | 0.0244 | 16–17 | 0.0240 | 17 | 0.2527 | 19 | 0.2359 | 19 | 71.5 | 18 | 19 | 19 | 19 |
| 10. Paneriai | 0.0157 | 20 | 0.0172 | 20 | 0.1882 | 20 | 0.1360 | 20 | 80 | 20 | 20 | 20 | 12 |
| 11. Pašilaičiai | 0.0402 | 11 | 0.0379 | 12 | 0.4093 | 12 | 0.4553 | 10 | 45 | 12 | 12 | 12 | 30 |
| 12. Pilaitė | 0.0206 | 19 | 0.0196 | 19 | 0.3209 | 18 | 0.2682 | 16 | 72 | 19 | 18 | 18 | 18 |
| 13. Rasos | 0.0514 | 8 | 0.0546 | 8 | 0.5101 | 7 | 0.5369 | 8 | 31 | 7 | 7 | 7 | 7 |
| 14. Senamiestis | 0.1214 | 1 | 0.1238 | 1 | 0.9604 | 1 | 0.9997 | 1 | 4 | 1 | 1 | 1 | 1 |
| 15. Šeškinė | 0.0621 | 6 | 0.0570 | 6 | 0.5407 | 6 | 0.6152 | 6 | 24 | 6 | 6 | 6 | 6 |
| 16. Verkiai | 0.1016 | 3 | 0.0979 | 2 | 0.8758 | 2 | 0.9158 | 2 | 9 | 2 | 2 | 2 | 2 |
| 17. Vilkpėdė | 0.1019 | 2 | 0.0961 | 3 | 0.8446 | 3 | 0.8835 | 3 | 11 | 3 | 3 | 3 | 3 |
| 18. Viršuliškės | 0.0646 | 4 | 0.0625 | 4 | 0.5787 | 5 | 0.6500 | 4 | 17 | 4 | 4 | 4 | 4 |
| 19. Žirmūnai | 0.0284 | 14 | 0.0256 | 16 | 0.3700 | 15 | 0.3385 | 11 | 56 | 14–15 | 14–15 | 14–15 | 15 |
| 20. Žvėrynas | 0.0400 | 12 | 0.0590 | 7 | 0.4212 | 10 | 0.3887 | 14 | 43 | 11 | 11 | 10–11 | 11 |
| 21. Šnipiškės | 0.0234 | 18 | 0.0297 | 13 | 0.3830 | 13 | 0.2725 | 12 | 56 | 14–15 | 14–15 | 14–15 | 14 |
| Economic Environment Factors ω1 = 0.4231 | Social Environment Factors ω2 = 0.2692 | Environmental Factors ω3 = 0.3077 | EDASThe Overall Values of the Assessment Criteria | Overall Rank | |
|---|---|---|---|---|---|
| 1. Antakalnis | 0.5107 | 0.7816 | 0.5524 | 0.6888 | 4 |
| 2. Fabijoniškės | 0.2910 | 0.2984 | 0.6357 | 0.3339 | 10 |
| 3. Grigiškės | 0.4257 | 0.3710 | 0.0159 | 0.1469 | 20 |
| 4. Justiniškės | 0.0023 | 0.4906 | 0.3344 | 0.0266 | 21 |
| 5. Karoliniškės | 0.2217 | 0.3908 | 0.4972 | 0.2790 | 17 |
| 6. Lazdynai | 0.3908 | 0.3703 | 0.2738 | 0.2826 | 16 |
| 7. Naujamiestis | 0.9485 | 0.5575 | 0.4126 | 0.7658 | 3 |
| 8. Naujininkai | 0.5235 | 0.0895 | 0.3657 | 0.2590 | 18 |
| 9. Naujoji Vilnia | 0.5423 | 0.2782 | 0.2359 | 0.3042 | 13 |
| 10. Paneriai | 0.6175 | 0.3054 | 0.1360 | 0.2951 | 14 |
| 11. Pašilaičiai | 0.4462 | 0.3620 | 0.4553 | 0.4454 | 8 |
| 12. Pilaitė | 0.4082 | 0.3914 | 0.2682 | 0.3081 | 12 |
| 13. Rasos | 0.5201 | 0.1129 | 0.5369 | 0.3634 | 9 |
| 14. Senamiestis | 0.7827 | 0.8023 | 0.9997 | 1.0000 | 1 |
| 15. Šeškinė | 0.2514 | 0.3038 | 0.6152 | 0.2940 | 15 |
| 16. Verkiai | 0.5917 | 0.5977 | 0.9158 | 0.7978 | 2 |
| 17. Vilkpėdė | 0.3947 | 0.5507 | 0.8835 | 0.6423 | 5 |
| 18. Viršuliškės | 0.2209 | 0.3617 | 0.6500 | 0.3160 | 11 |
| 19. Žirmūnai | 0.4402 | 0.5931 | 0.3385 | 0.4623 | 7 |
| 20. Žvėrynas | 0.5652 | 0.7127 | 0.3887 | 0.6099 | 6 |
| 21. Šnipiškės | 0.5737 | 0.0293 | 0.2725 | 0.1858 | 19 |
| COPRAS Priority Ranking | SAW Priority Ranking | TOPSIS Priority Ranking | EDAS Priority Ranking | Rank Average Priority Ranking | Borda Count Priority Ranking | Copeland’s Priority Ranking | |
|---|---|---|---|---|---|---|---|
| Antakalnis | 5 | 5 | 6 | 4 | 4 | 4 | 4 |
| Fabijoniškės | 9 | 9 | 11 | 10 | 10 | 10 | 10 |
| Grigiškės | 20 | 20 | 20 | 20 | 20–21 | 20–21 | 20–21 |
| Justiniškės | 19 | 19 | 21 | 21 | 20–21 | 20–21 | 20–21 |
| Karoliniškės | 17 | 17 | 19 | 17 | 18 | 18 | 18 |
| Lazdynai | 19 | 19 | 17 | 16 | 19 | 19 | 19 |
| Naujamiestis | 3 | 3 | 2 | 3 | 2 | 2 | 2 |
| Naujininkai | 13 | 13 | 13 | 18 | 14–15 | 14–15 | 14–15 |
| Naujoji Vilnia | 15 | 15 | 14 | 13 | 14–15 | 14–15 | 14–15 |
| Paneriai | 2 | 2 | 10 | 14 | 7 | 6–7 | 6–7 |
| Pašilaičiai | 16 | 16 | 12 | 8 | 13 | 13 | 13 |
| Pilaitė | 18 | 18 | 15 | 12 | 17 | 17 | 17 |
| Rasos | 8 | 8 | 9 | 9 | 8 | 8 | 8 |
| Senamiestis | 1 | 1 | 1 | 1 | 1 | 1 | 1 |
| Šeškinė | 14 | 14 | 18 | 15 | 16 | 16 | 16 |
| Verkiai | 4 | 4 | 3 | 2 | 3 | 3 | 3 |
| Vilkpėdė | 6 | 6 | 5 | 5 | 5 | 5 | 5 |
| Viršuliškės | 12 | 12 | 16 | 11 | 12 | 12 | 12 |
| Žirmūnai | 11 | 11 | 8 | 7 | 9 | 9 | 9 |
| Žvėrynas | 7 | 7 | 4 | 6 | 6 | 6–7 | 6–7 |
| Šnipiškės | 10 | 10 | 7 | 19 | 11 | 11 | 11 |
© 2017 by the authors. Licensee MDPI, Basel, Switzerland. This article is an open access article distributed under the terms and conditions of the Creative Commons Attribution (CC BY) license (http://creativecommons.org/licenses/by/4.0/).
Share and Cite
Zavadskas, E.K.; Cavallaro, F.; Podvezko, V.; Ubarte, I.; Kaklauskas, A. MCDM Assessment of a Healthy and Safe Built Environment According to Sustainable Development Principles: A Practical Neighborhood Approach in Vilnius. Sustainability 2017, 9, 702. https://doi.org/10.3390/su9050702
Zavadskas EK, Cavallaro F, Podvezko V, Ubarte I, Kaklauskas A. MCDM Assessment of a Healthy and Safe Built Environment According to Sustainable Development Principles: A Practical Neighborhood Approach in Vilnius. Sustainability. 2017; 9(5):702. https://doi.org/10.3390/su9050702
Chicago/Turabian StyleZavadskas, Edmundas Kazimieras, Fausto Cavallaro, Valentinas Podvezko, Ieva Ubarte, and Arturas Kaklauskas. 2017. "MCDM Assessment of a Healthy and Safe Built Environment According to Sustainable Development Principles: A Practical Neighborhood Approach in Vilnius" Sustainability 9, no. 5: 702. https://doi.org/10.3390/su9050702