
Interrelations of Ecosystem Services and Rural Population Wellbeing in an Ecologically-Fragile Area in North China


1
State Key Laboratory of Urban and Regional Ecology, Research Center for Eco-Environmental Sciences, Chinese Academy of Sciences, Beijing 100085, China
2
University of Chinese Academy of Sciences, Beijing 100049, China
*
Author to whom correspondence should be addressed.
Sustainability 2017, 9(5), 709; https://doi.org/10.3390/su9050709
Submission received: 2 April 2017
/
Revised: 24 April 2017
/
Accepted: 24 April 2017
/
Published: 29 April 2017
Abstract
:Ecosystem services (ES) are indispensable contributors to rural population wellbeing (RPWB). Understanding the relationship between ES and RPWB is important to human welfare and conserving ecosystem services. Ecologically-vulnerable areas are widely distributed in China and are concentrated with impoverished people. This study explored the relations of ES and RPWB in an ecologically-fragile area, and provided some recommendations for regional improvement. We developed an evaluation framework, analyzed the spatio-temporal characteristics of services and RPWB, and examined their relations. Results showed that: (1) the level of RPWB in an ecologically-vulnerable area was lower than that in the downstream region; however, the wellbeing gap between regions has narrowed over time; (2) Regions with a higher ecosystem service capacity had higher levels of rural population wellbeing, and vice versa; (3) In addition to the food supply, other ES indicators were closely associated with RPWB in the region. Specifically, the net income and living space were closely related to food supply, while rural-urban income ratio and water environment were more relevant to the other services. Lastly, it is important to address environment and poverty issues simultaneously.
1. Introduction
Exploring the relations between human wellbeing and ecosystem services (ES) is one of the research hotspots in ecology and relevant disciplines. The consumption of ES enables the fulfillment and improvement of human welfare [1]. Although activities promoting human welfare have influenced ecosystem processes and the regeneration capacity of ES sometimes, a relevant feedback processing occurs between them [2,3]. ES contributes to human wellbeing under the influence of anthropogenic activities, and there are complex interrelationships among them. In order to achieve sustainable and harmonious development of the environment and human wellbeing, it is necessary to determine the linkages between ES and human wellbeing.
An ecologically-fragile area (EFA) has the following characteristics: lack of ecosystem stability, inferior ability to survive and maintain homeostasis from interference, prone to ecosystem degradation, and difficult spontaneous recovery. Compared with a single ecosystem, EFAs are more complicated systems, typically located within various ecotones, marginal zones, and connective band regions. Furthermore, EFAs are natural resource-rich, sensitive, and unstable areas with weak anti-disturbance abilities [4]. Thus, EFAs are usually not suitable for living and production, and people who live in EFAs are always economically disadvantaged [5,6]. Many EFAs, which are in the vicious circle of ecological degradation and poverty, are in the intersectional region of environmental protection and poverty alleviation. Most areas in Western China are EFAs [7]. In recent years, this region has experienced rapid desertification and ecological environment deterioration, which brought harm and loss to local production and living. Understanding the linkages between ES and human wellbeing is essential for policy-makers to balance human demands and the environment.
We selected the northern farming-pastoral region and its downstream region in Northern China as our research area. The Khorchin sandy land, which is a tropical grassland degeneration zone with a fragile ecological environment, is an EFA, where living conditions need to be improved. This northern farming-pastoral area is a crucial barrier that resists the eastward and southward land desertification, and plays an irreplaceable role in safeguarding ecological security and social, as well as economic, stability of the district. Thus, it is important to take measures for ecological protection and livelihood promotion in this region.
In this study, we evaluated the RPWB and key ecosystem services in 2002–2012, and described their spatial distribution and changes over time. Then we conducted spearman correlation analysis between wellbeing and ES in 16 administrative regions in our study area, to discuss the relationship between ES factors and RPWB, especially in the ecologically fragile areas, thus to provide some theoretical support for the regional wellbeing and environmental improvement.
2. Interactions of Ecosystem Services and Human Wellbeing
2.1. Human Wellbeing
Human wellbeing is a broad concept which involves anthropology, psychology, economics, sociology, and other disciplines [8,9]. Many scholars and research institutions conducted human wellbeing studies through the establishment of indicators and hierarchical division of human wellbeing. For example, the Human Development Report [10] selected lifetime, knowledge, and capacity of access to basic resources into its human welfare measurement index. Cummins et al. [11] considered that human wellbeing comprised seven key domains, including the satisfaction of living standard, health, achievement, interpersonal relationship, sense of security, community links, and safety in the future. Clark [12] established an integrated wellbeing concept by overlapping the utility and living quality based on resource demand.
The broadest and most systematic theories of human wellbeing are Sen’s Capability Approach and Millennium Ecosystem Assessment (MA). The Capability Approach focuses directly on the quality of life which is measured by the ‘functioning’ and ‘capability’, where in the capability represents the effective freedom of an individual to choose between different functioning combinations, that is, between different kinds of life [13]. According to MA, human wellbeing is defined in five dimensions, that is, the ability to maintain a high quality of life, health, good social relationships, security, freedom, and choice; the connotation of the five dimensions is a progressive cascade [14] (Figure 1).
The concept of human wellbeing is divided into subjective and objective wellbeing [15]. The objective wellbeing refers to the satisfaction degree of various kinds of demands [16,17], whereas the subjective wellbeing emphasizes individual assessment of self-condition, ideas, and feelings [2,18,19].
Except for the aggregative indicator methods, such as the gross national product (GNP), United Nations Human Development Index (HDI) [20], quality-of-life index [21], human welfare index [22,23], and the survey-based subjective index [24], most of the current wellbeing evaluation studies use the hierarchical classification of MA. In practice, the five dimensions of wellbeing are simplified, some researches even choose the objective part of wellbeing for evaluation. For example, the index system of Yang et al. includes the income, material conditions for good life, health, security, and good social relations [25].
2.2. Ecosystem Services and Human Wellbeing
Ecosystem service (ES) refers to the quantity and quality of services that are provided by the ecosystem processes in a particular time range [14,26,27,28]. It includes provisioning services, regulating services, cultural services, and supporting services, which are indispensable for human wellbeing; and changes of ecosystem directly or indirectly impact human wellbeing.
Human wellbeing affected by the ecosystem accounts for only a subset of wellbeing; however, it is definitely a significant contribution to human wellbeing [29].
The change of ES could directly or indirectly influence each elements of human wellbeing. Owing to the feedback effect from various human activities, the negative and positive feedbacks directly or indirectly influence ES [30].
3. Materials and Methods
3.1. Study Region
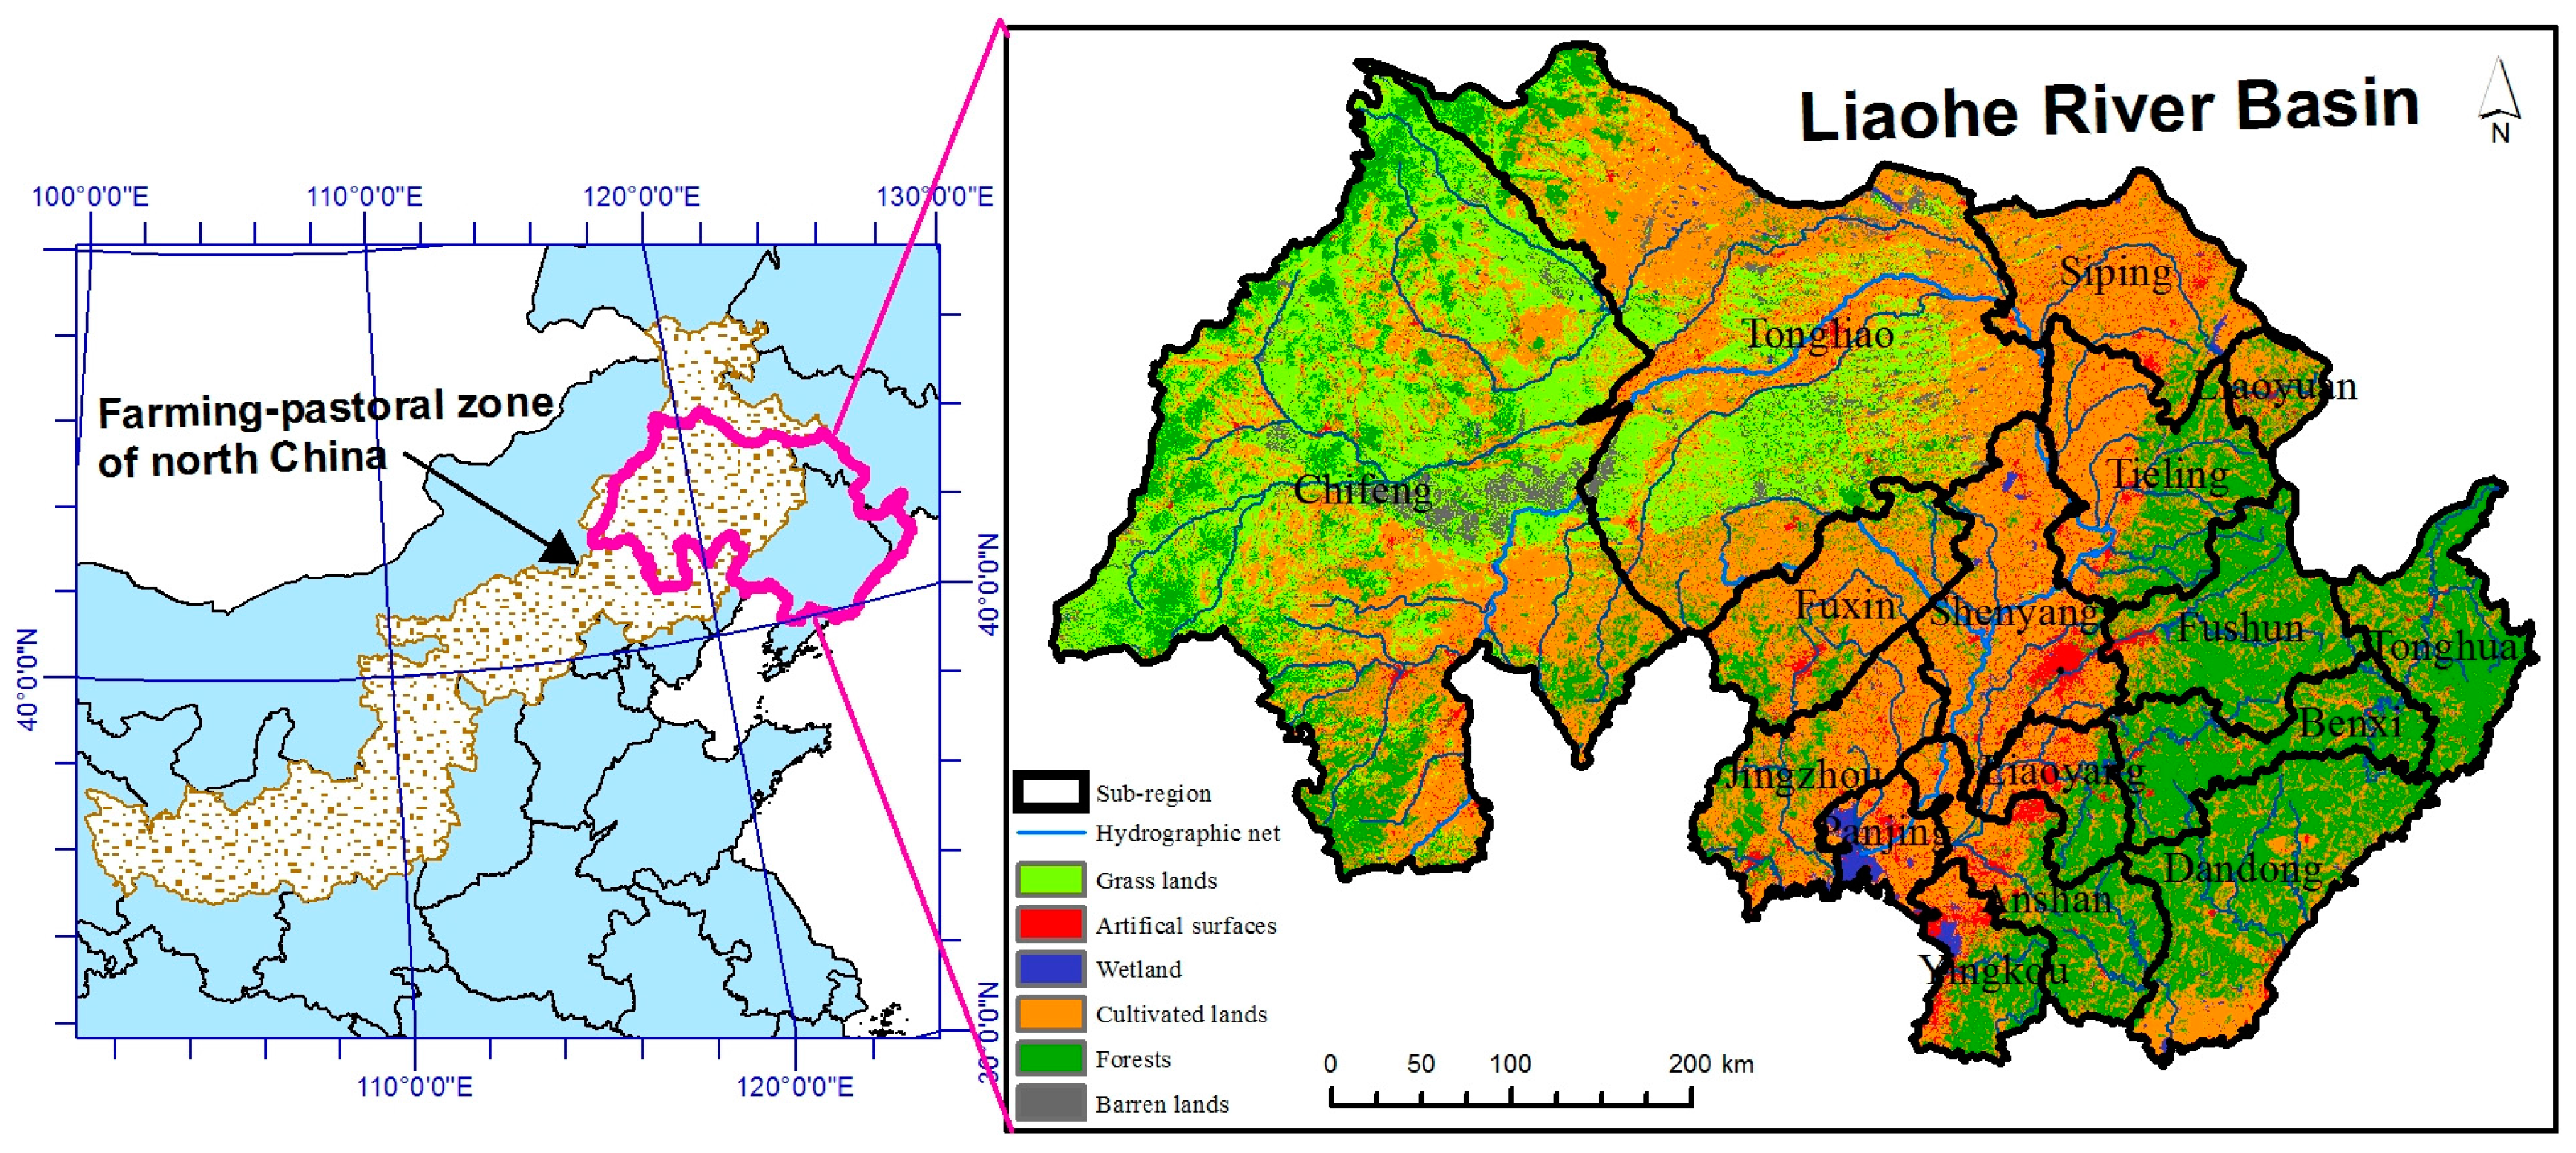
Our research area comprised the grassland and desert-dominated regions in the northwest district, which is an EFA of the ecotone of agriculture-animal husbandry, and the cropland and woodland-dominated regions in the southeast. The region is in the Liao River Basin, and covers the major river systems in this basin. The northwest and southeast districts belong to the upstream and downstream regions, respectively. The whole area is 25.68 × 10⁴ km2 (Figure 2). The indices were calculated in 16 regions, and these sub-regions are the basic administrative units in the region.
Ecosystem composition (Figure 2) of the region showed that the major types of ecosystem in the upstream are grasslands and deserts; the central region comprised the cereal and industrial base, and distributed with cultivated land; and the southeast region comprised the forests. From the northwest to southeast, it emerged as an overt transformation from the grasslands and deserts to cultivated lands and forests. Diverse ecological communities enable great difference in the type and amount of ES.
The upstream region comprises of the Laoha and Xiliao sub-rivers of the Liao River Basin, with grass and desert plants as the main vegetation of this region. The fragile environment and ecological degradations might be caused by the prominent conflicts between land and population. Land degradation has been observed in Khorchin sandy land, which is a source region of sand storms in Northern China. Ecosystem degradation in this region is not only affected by its climatic variations, but also by its overdevelopment, land reclamation, and grazing.
Key industries in the southeast region are food production and old industries. As the water source of this region, the upstream guarantees the regional water supply to a great extent. At the same time, the EFA also plays an important role as the ecological barrier which controls the eastward and southward expansion of desertification. In other words, the upstream EFA region provides the direct ecological barrier for this region, ensuring ecological security of the downstream.
The upstream and the downstream are closely related and interdependent. Understanding the relationship between the EFA and its surrounding areas is significant for the local environment and the residents’ wellbeing.
3.2. Rural Population Wellbeing
We selected rural population wellbeing as our evaluation object which has a relatively greater reliance on the primary industry and is closely linked with ES, and we majorly evaluated its objective wellbeing. The criteria for our study are “objective wellbeing + rural population + ecosystem related”. Based on the existing research, we assessed human wellbeing in three different layers, including economic [31], environmental, and social wellbeing [32]. Specific indicators could be found in Table 1, which was calculated for year 2002, 2004, 2006, 2008, 2010, and 2012.
Farming and grazing activities are the primary income sources of rural populations, and we selected the per capita net income as an indicator of ECWB, as more net income guarantees a better material life. The surface water environmental quality can be ascribed to the regional environmental conditions and water environmental quality is selected as one important indicator. The water environment is indispensable to the survival and reproduction of population and the socio-economic development, and clean water also elevates the comfort level of life. SWB has two indicators. The ratio of rural and urban income is calculated using per capita income of farmers divided by per capita income of urban residents. It illustrates the degree of poverty of the rural inhabitants; a higher ratio represents a smaller gap between the rural and urban areas. The per capita living space assesses the means of living, calculated using residential building areas divided by residential population. In China, housing is one of the most important assets in a rural family. When people have some savings, they are accustomed to maintaining or building larger houses, sometimes even for the next generation of their families.
We normalized the indices by:
where, x refers to the wellbeing indicators including ECWB, ENWB and SWB, is the original value of the index, and is the normalized value within the scope of (0, 1].
3.3. Ecosystem Service
In accordance with the regional ecological and environmental problems, we selected five indicators to assess ES indices [35]: (1) Carbon fixation plays a vital role in climate regulation and climate change mitigation; this effect is mainly revealed in large scale and has its externality; meanwhile, when it yields 1 g of dry substance, the ecosystem absorbs 1.63 g CO2 [36] during the carbon fixation process. This process can serve as an indicator of the regional vegetation, better ecosystem quality, higher biomass, and carbon fixation service. (2) The EFA experienced low river flow in recent years; thus, we chose the hydrological adjustment service. (3) Seated in the arid and semi-arid area, the region faces serious wind erosion and is threatened by desertification; therefore, we chose the sand-fixation service. (4) River has a high sediment concentration, accompanied with soil impoverishment and water loss and soil erosion issues; thus, we selected the soil conservation service. (5) The last index is food supply, which represented agriculture, forestry, animal husbandry, and fishery product availability in the region.
The data of ES was provided by the “Survey and Assessment of National Ecosystem Changes”, which includes 90 m classifying land data, 250 m hydrological adjustment, sand fixation, carbon fixation, and soil conservation (Table 2). Food supply was calculated using the Statistical Yearbook data. Detailed materials and methodologies can be found in Supplementary Materials of Ouyang [37]. We used the ES data in 2002 and 2012 in our research.
4. Results
4.1. Spatial Distribution and Change of Rural Population Wellbeing
From 2002 to 2012 the economic wellbeing of rural population in different regions showed different magnitudes of improvement. RPWB was found at the lowest level in the EFA, at a higher level in the eastern part, and the southeast forest region showed the highest levels of RPWB (Figure 3).
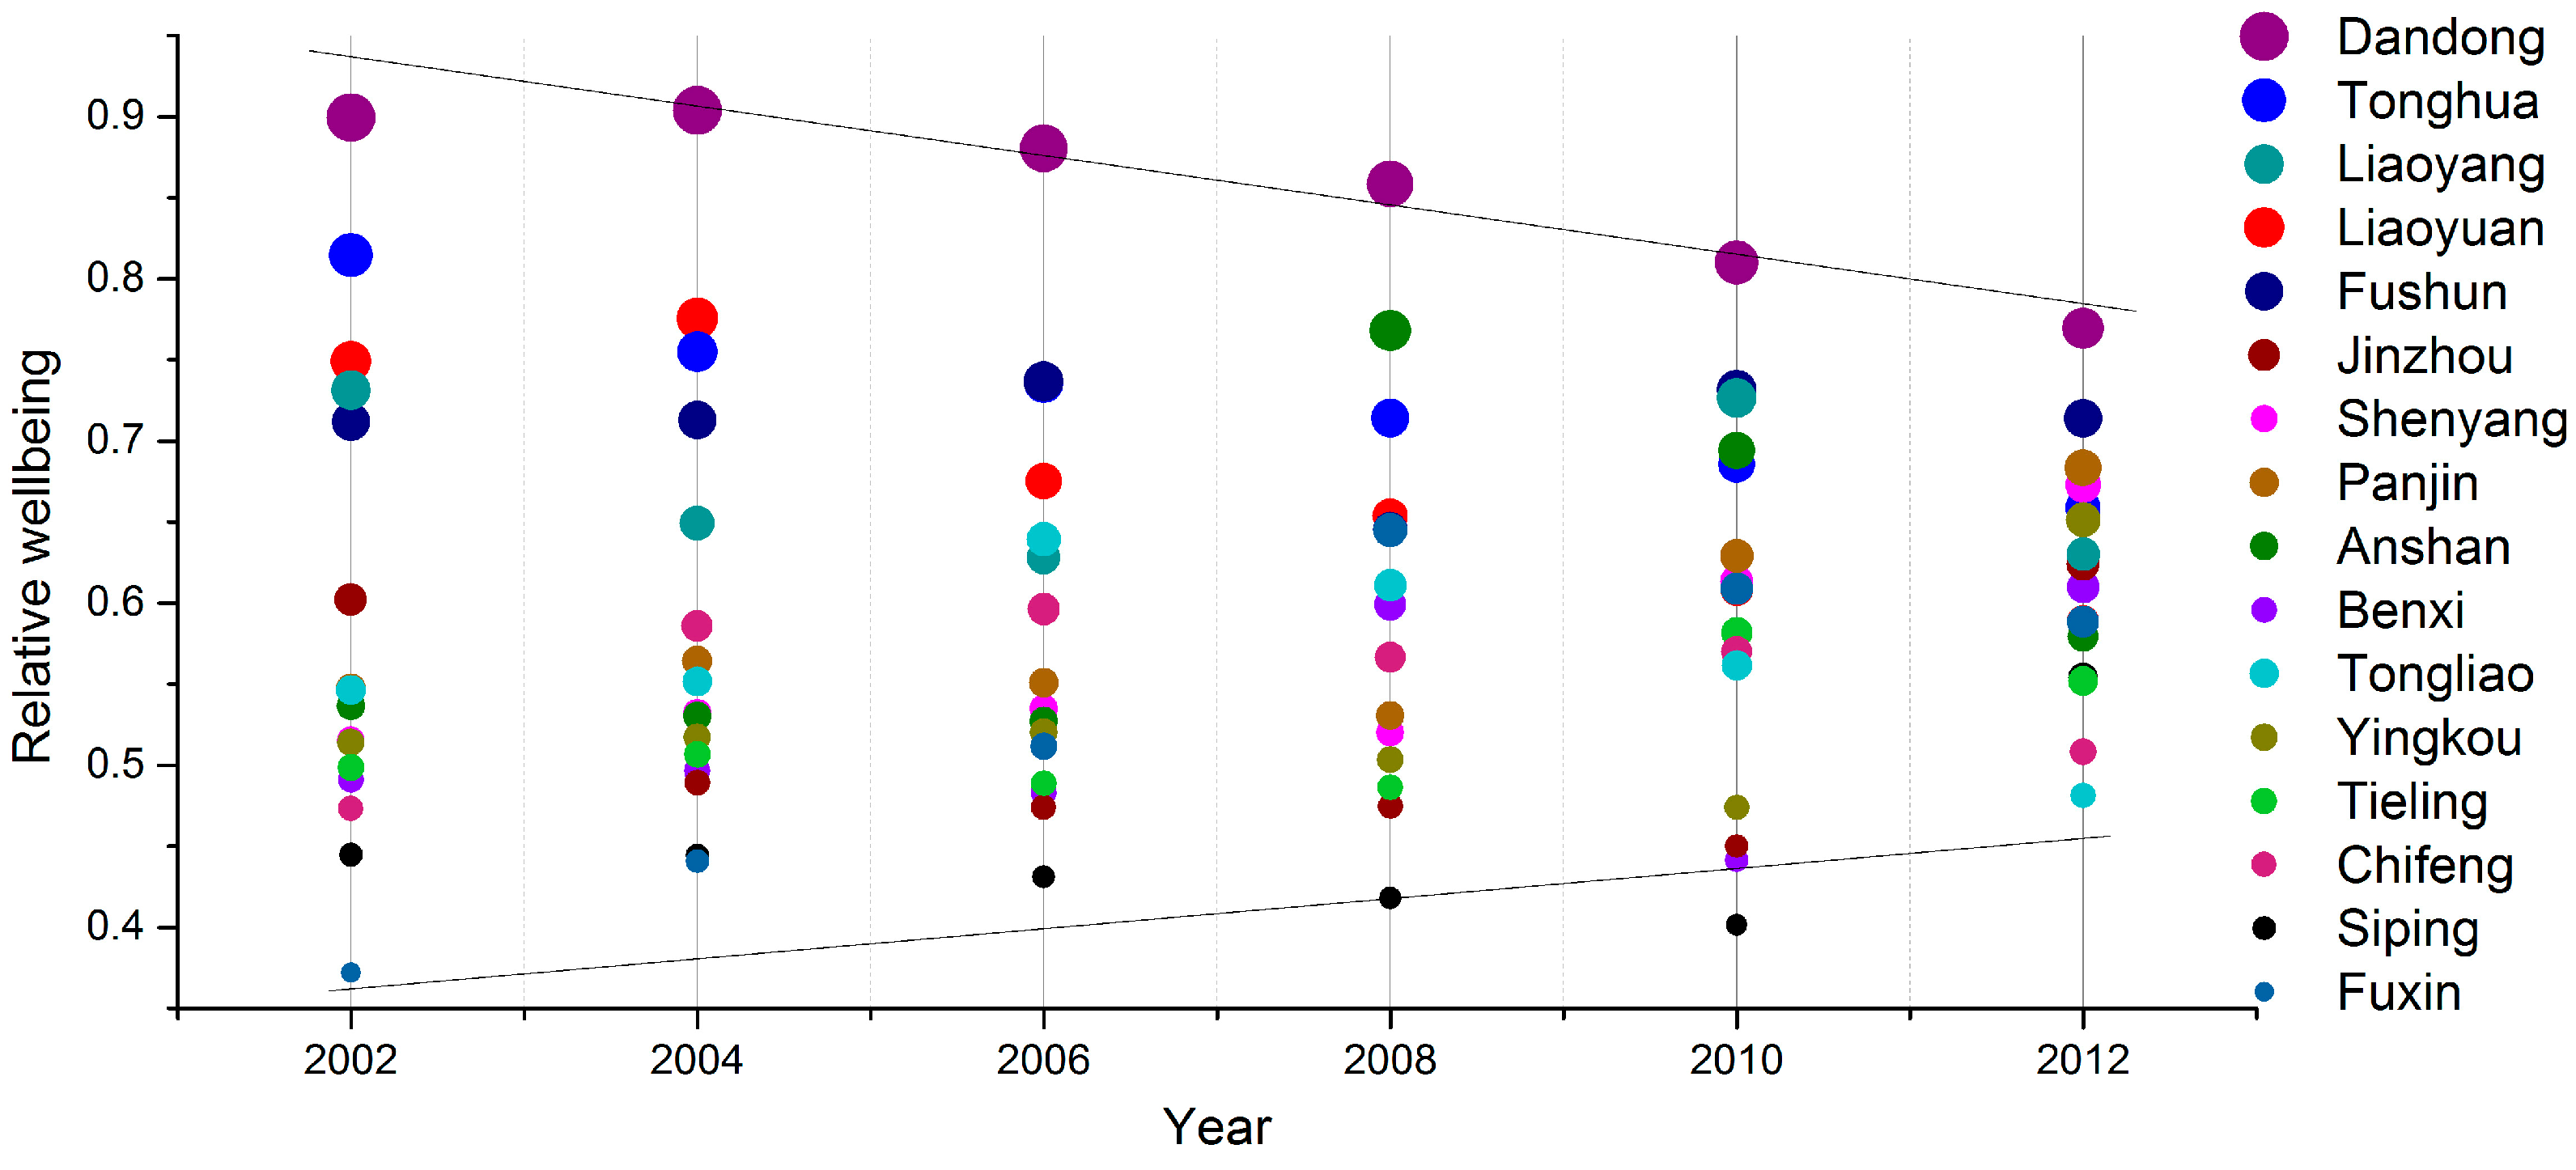
The spatial distribution was also a key factor affecting the relative change of RPWB. The normalization calculation was carried out annually and we got the relative horizontal of each region, which emphasized the importance of assessing the relative gaps between regions. Results showed that the differences in welfare levels among different areas narrowed in 2002–2012 (Figure 4).
4.2. Spatial Distribution of Ecosystem Service
The spatial distribution of ES is obvious and ecosystem composition is a fundamental and crucial factor of ES: (1) It is accompanied by the high level of sand fixation (Figure 5a) and low level of carbon fixation (Figure 5b) in the grasslands. The high binding sand quantity regions always experience severe wind erosion and desertification, and the degree of sand fixation service characterized the degree of sandy desertification, while the severe desertification has a high demand of sand fixation service; the carbon fixation service shows maximum values in the forest regions, followed by the arable lands, and the grasslands; and (2) the arable land is accompanied with inferior soil conservation and the hydrological adjustment service (Figure 5c,d), and superior food supply capacity (Figure 5e). It is observed that, along with the accommodation of high food supply, the arable lands incurs the most serious water loss and soil erosion with low ES values. The regional scale ES data is shown in Appendix A (Table A1).
4.3. Interrelations of Ecosystem Service and Rural Population Wellbeing
Overall, the distribution of RPWB was spatially heterogeneous, the EFA of upstream region was inferior to the downstream region and each ecosystem service has different spatial distribution. We conducted a Spearman correlation analysis between ES and RPWB (Table 3).
In addition to food supply, the ES indicators were closely associated with RPWB in the region. Positive correlation was presented between carbon fixation, soil conservation, hydrological adjustment services, and RPWB, indicating the increase of these services was beneficial to higher RPWB. In contrast, a negative relationship was shown between the sand fixation service and RPWB, indicating the decrease of the sand fixation value is conducive to the improvement of RPWB.
Specifically, the food supply index was closely related to the economic wellbeing, and it accorded with the common sense that a high grain production leads to high incomes.
A high correlation was found between the environmental wellbeing and carbon fixation, soil conservation, and hydrological adjustment. Carbon fixation had a positive role in promoting water quality; biomass absorbed contaminants and reduced their concentration in water. Higher soil conservation capacity controlled water and soil loss and alleviated water pollution. By regulating soil runoff, the hydrological adjustment influenced the water environment; high inflow provided better water quality.
In respect of social wellbeing, the carbon fixation, sand fixation, and hydrological adjustment were greatly correlated with the rural-urban income ratio, and food supply was more correlated with the living space. The rural-urban income ratio was positively related to the service of carbon fixation and hydrological adjustment. This is possibly because the region had a higher supply of the above-mentioned conciliation services, usually possessed a good environment, and could share some functions of urban areas, such as outings, catering, and other services. These conciliation services benefited farmers by increasing their income and narrowing the gap between the rural and urban areas. The sand fixation service was negatively related to rural-urban income ratio. The region with strong sand fixation capacity was located in the upstream region of grasslands, experiencing severe blowing sand. The rural residents of this region belonged to low-income population, and the poverty increased the income gap of the rural and urban. Conversely, the income gap was relatively narrowed in the region with slight blown sand and low sand fixation capacity.
5. Discussion
The western area of our study region is an ecotone of agriculture-animal husbandry, which is eco-environmentally fragile. Meanwhile, it is also the upstream region of the Liao River Basin, and a water conservation district of this region. In contrast, the downstream region enjoys a fairly good ecological environment with high ES capacity.
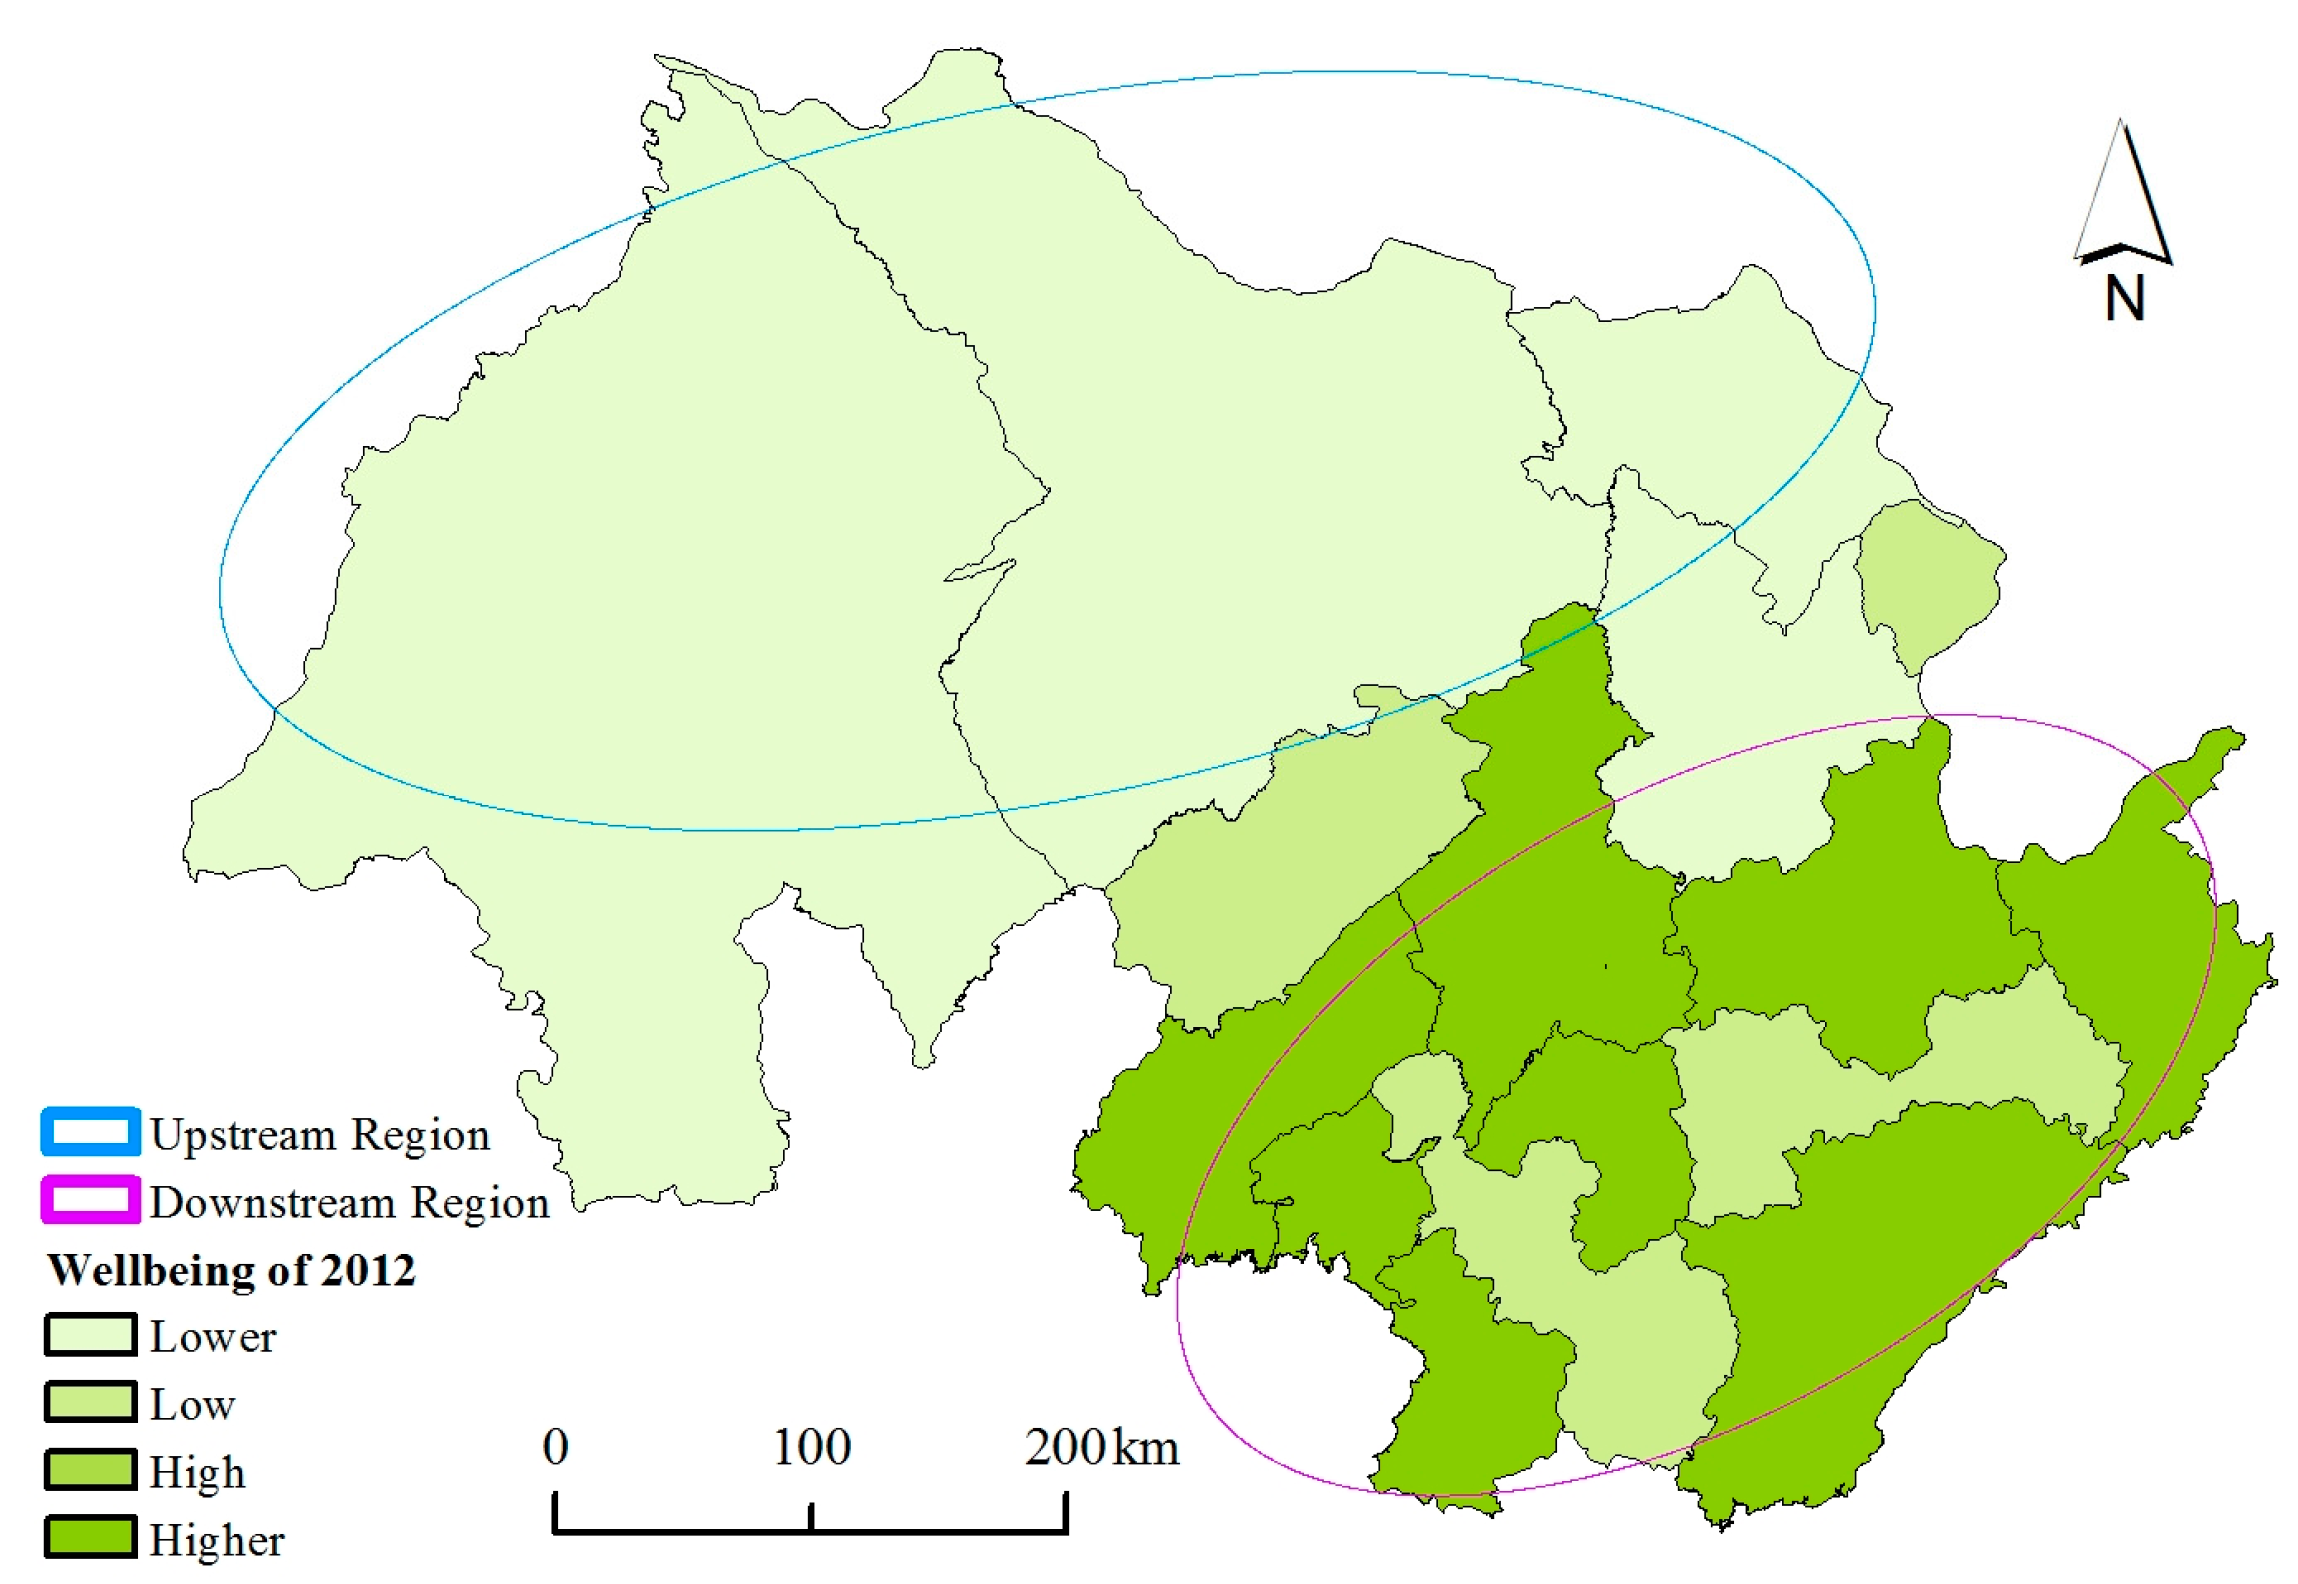
Manufacturing and living activities of farmers and herdsmen in the upstream region were constrained by natural conditions; while there is less limitation in the downstream, which has better wellbeing than the upstream region. The average rural population wellbeing in the downstream region was 1.24 times greater than that in the upstream EFA region; the highest value in Dandong was even 1.56 times more than the lowest in Tongliao; it showed significant differences in the upstream and downstream regions. The wellbeing distribution is presented in Figure 6.
As a whole, the region has a fine environment and high ES always reflects significant wellbeing, and vice versa. Previous studies showed that a distinct relationship exist between poverty and EFA, with correlation coefficients ranging from 0.78 to 0.86 [38]. The major reason behind this phenomenon is that excavating and overdrawing regional natural resources will break the thresholds of key environmental processes and aggravate ecological degradation.
The phenomenon that a harsh environment accompanies low rural population wellbeing is ultimately a development issue—the conflict between land and population. Our study results of the linkages between the upstream and the downstream regions can also be applied to all EFAs and surrounding areas. How to coordinate the upstream and the downstream is one of the key issues of EFAs and surrounding regions.
The EFA in the upstream region affects rural population wellbeing greatly. Higher-intensity production would exceed the ecological capacity and cause more severe ecological degradation and environmental destruction. Previous studies believed that the ecological degradation in this region is mainly caused by anthropogenic activities [39]. This will lead to mid-long term destruction of landscape ecology and regenerative abilities of ES, if no control measures are implemented. Moreover, it effectively eased the current conflicts between people and land in this region.
We have emphasized above that EFAs are not independent systems: they exchange and consume the substance and energy within their surroundings. The EFA in our research undertakes the function of an ecological safety barrier, effectively preventing the development of desertification. The downstream region is the beneficiary of the upstream region EFA ecosystem service.
The problem of the regional ecosystem and inhabitant wellbeing cannot be solved simply by poverty relief or increasing investment of environmental protection alone. To break the vicious circle of ecological degradation and long-time poverty of rural populations, we need to work with both poverty relief and environmental protection together, thus, to effectively ease the conflicts between local resident and land. In the EFA region, it is necessary to adopt ecological compensation measures and improve grass quality. In downstream regions, we need to control the expansion of cultivated land and improve ecosystem services.
6. Conclusions
The regional difference of RPWB has declined during the past decade. By analyzing the interrelation of ecosystem service and rural population wellbeing in EFA and the downstream region, we concluded that high-ES regions and high-wellbeing regions overlap. The improvement of wellbeing profits from socioeconomic development and its regional differences diminished in the past decade. However, the level of wellbeing in the downstream region was higher than that in the upstream EFA region. This conforms with our observation that high-ES regions have high levels of wellbeing. The priority task for the EFA in our research is to ease the conflicts between people and land, introducing poverty alleviation and environmental protection projects at the same time and, thus, to overcome poverty and environmental deterioration.
Acknowledgments
This research was supported by National Natural Science Foundation of China (No. 71673268) and the National Key Research and Development Program (No. 2016YFC0503603).
Author Contributions
C.Z. and Y.Y. conceived and designed the research; Y.Y., C.Z., Q.Y., and H.L. drafted the manuscript; Y.R. and G.W. prepared figures; C.Z. and Q.Y. analyzed the data; and Y.Y. and C.Z. discussed the results and revised the manuscript. All authors read and approved the final manuscript.
Conflicts of Interest
The authors declare no conflict of interest.
Appendix A

Table A1.
Region indicators of ES in 2002 and 2012.
| Region | Carbon Fixation | Food Supply | Soil Conservation | Sand Fixation | Hydrological Adjustment | |||||
|---|---|---|---|---|---|---|---|---|---|---|
| (Mg/hm2) | (×106 kcal/hm2) | (t/hm2) | (t/hm2) | (m3) | ||||||
| Year | 2002 | 2012 | 2002 | 2012 | 2002 | 2012 | 2002 | 2012 | 2002 | 2012 |
| Chifeng | 112.66 | 112.60 | 0.44 | 1.12 | 75.74 | 75.78 | 44.37 | 49.21 | 3174.07 | 3173.04 |
| Tongliao | 78.90 | 78.91 | 1.01 | 2.54 | 12.22 | 12.33 | 71.36 | 82.22 | 2903.80 | 2901.50 |
| Siping | 129.08 | 129.07 | 4.47 | 11.54 | 19.75 | 19.87 | 24.86 | 26.90 | 4532.35 | 4555.86 |
| Liaoyuan | 170.50 | 170.46 | 3.45 | 4.60 | 102.27 | 102.62 | 3.17 | 3.20 | 5465.34 | 5447.40 |
| Fuxin | 94.40 | 94.37 | 1.35 | 6.89 | 49.03 | 50.47 | 73.58 | 79.81 | 4110.86 | 4106.79 |
| Shenyang | 120.72 | 120.46 | 4.47 | 8.01 | 17.90 | 18.23 | 40.45 | 41.69 | 5026.69 | 4997.70 |
| Tieling | 143.62 | 143.52 | 3.67 | 7.80 | 161.43 | 161.60 | 12.91 | 13.11 | 5699.61 | 5687.85 |
| Jinzhou | 134.10 | 134.07 | 3.70 | 6.60 | 88.13 | 89.02 | 31.37 | 32.92 | 4493.54 | 4487.04 |
| Fushun | 174.84 | 174.77 | 0.93 | 1.21 | 542.93 | 542.16 | 5.64 | 5.48 | 6512.64 | 6498.23 |
| Tonghua | 223.41 | 223.42 | 0.75 | 0.80 | 861.83 | 860.97 | 0.95 | 0.95 | 6969.17 | 6968.49 |
| Benxi | 181.37 | 181.27 | 0.69 | 0.88 | 1085.79 | 1085.03 | 3.28 | 3.21 | 6933.47 | 6918.76 |
| Dandong | 169.07 | 168.93 | 1.12 | 1.49 | 1049.96 | 1047.82 | 6.99 | 6.99 | 7480.01 | 7474.94 |
| Yingkou | 157.19 | 156.94 | 2.34 | 4.10 | 425.18 | 426.01 | 10.96 | 10.86 | 5869.72 | 5857.25 |
| Anshan | 158.54 | 158.43 | 3.31 | 4.75 | 485.63 | 485.31 | 14.76 | 14.74 | 6453.68 | 6451.75 |
| Liaoyang | 149.24 | 149.13 | 3.72 | 4.24 | 365.81 | 365.94 | 7.886 | 7.79 | 6326.57 | 6307.43 |
| Panjin | 122.78 | 122.75 | 4.73 | 7.52 | 2.64 | 2.64 | 9.92 | 9.71 | 4226.01 | 4231.48 |
References
- Wang, D.S.; Zhang, H.; Ouyang, Z.Y. Ecosystem services supply and consumption and their relationships with human well-being. Chin. J. Appl. Ecol. 2013, 24, 1747–1753, (In Chinese with English Abstract). [Google Scholar]
- Summers, J.K.; Smith, L.M.; Case, J.L.; Linthurst, R.A. A review of the elements of human well-being with an emphasis on the contribution of ecosystem services. AMBIO 2012, 41, 327–340. [Google Scholar] [CrossRef] [PubMed]
- Sandhu, H.; Sandhu, S. Linking ecosystem services with the constituents of human well-being for poverty alleviation in eastern Himalayas. Ecol. Econ. 2014, 107, 65–75. [Google Scholar] [CrossRef]
- Niu, W.Y. The discriminatory index with regard to the weakness, overlapness, and breadth of Ecotone. Acta. Ecol. Sin. 1989, 9, 97–99, (In Chinese with English Abstract). [Google Scholar]
- Liu, H.J.; Zhou, C.X.; Gao, J.X. Location determination of ecologically vulnerable regions in China. Biodivers. Sci. 2015, 23, 725–732, (In Chinese with English Abstract). [Google Scholar] [CrossRef]
- Tian, Y.P.; Chang, H. Bibliometric analysis of research progress on ecological vulnerability in China. Acta. Geogr. Sin. 2012, 67, 1515–1525, (In Chinese with English Abstract). [Google Scholar]
- Zhao, H.L.; Zhao, X.Y.; Zhang, H.T. Causes, Processes and Countermeasures of Desertif ication in the Interlocked Agro-pasturing Area of North China. J. Desert Res. 2000, 20, 22–28, (In Chinese with English Abstract). [Google Scholar]
- Smith, L.; Clay, P.M. Measuring Subjective and Objective Well-being: Analyses from Five Marine Commercial Fisheries. Hum. Organ. 2010, 2, 158–168. [Google Scholar] [CrossRef]
- Jordan, S.J.; Hayes, S.E.; Yoskowitz, D.; Smith, L.M.; Summers, J.K.; Russell, M.; Benson, W.H. Accounting for natural resources and environmental sustainability: Linking ecosystem services to human well-being. Environ. Sci. Technol. 2010, 44, 1530–1536. [Google Scholar] [CrossRef] [PubMed]
- United Nations Development Programme (UNDP). Human Development Report 1990; Oxford University Press: New York, NY, USA, 1990. [Google Scholar]
- Cummins, R.A.; Eckersley, R.; Pallant, J.; Van Vugt, J.; Misajon, R. Developing a National Index of Subjective Wellbeing: The Australian Unity Wellbeing Index. Soc. Indic. Res. 2003, 2, 159–190. [Google Scholar] [CrossRef]
- Clark, D.A. Sen’s Capability Approach and the Many Spaces of Human Well-being. J. Dev. Stud. 2005, 8, 1339–1368. [Google Scholar] [CrossRef]
- Sen, A. Development as Freedom; Oxford University Press: Oxford, UK, 2001. [Google Scholar]
- Reid, W.V.; Mooney, H.A.; Cropper, A.; Capistrano, D.; Carpenter, S.R.; Chopra, K.; Dasgupta, P.; Dietz, T.; Duraiappah, A.K.; Hassan, R.; et al. Millennium Ecosystem Assessment—Ecosystems and Human Well-being: Synthesis; Island Press: Washington, DC, USA, 2005. [Google Scholar]
- Costanza, R.; Fisher, B.; Ali, S.; Beer, C.; Bond, L.; Boumans, R.; Danigelis, N.L.; Dickinson, J.; Elliott, C.; Farley, J.; et al. Quality of Life: An Approach Integrating Opportunities, Human Needs, and Subjective Well-being. Ecol. Econ. 2007, 61, 267–276. [Google Scholar] [CrossRef]
- United Nations Development Programme. Human Development Report—International Cooperation at a Crossroads: Aid, Trade and Security in an Unequal World; Oxford University Press: New York, NY, USA, 2005. [Google Scholar]
- Li, Y.; Li, S.C.; Gao, Y.; Wang, Y. Ecosystem services and hierarchic human well-being: Concepts and service classification framework. Acta. Geogr. Sin. 2013, 68, 1038–1047, (In Chinese with English Abstract). [Google Scholar]
- Maslow, A.H. The Instinctoid Nature of Basic Needs. J. Personal. 1954, 22, 326–347. [Google Scholar] [CrossRef]
- Daw, T.; Brown, K.; Rosendo, S.; Pomeroy, R. Applying the ecosystem services concept to poverty alleviation: The need to disaggregate human well-being. Environ. Conserv. 2011, 38, 370–379. [Google Scholar] [CrossRef]
- UNEP. Water Issue, 11th ed.; DFID: London, UK, 1998. [Google Scholar]
- Diener, E. A value based index for measuring national quality of life. Soc. Indic. Res. 1995, 36, 107–127. [Google Scholar] [CrossRef]
- Prescott-Allen, R. The Wellbeing of Nations; Island Press: Washington, DC, USA, 2001. [Google Scholar]
- Shah, H.; Peck, J. Well-Being and the Environment: Achieving One Planet Living and Quality of Life; New Economics Foundation: London, UK, 2005. [Google Scholar]
- Vemuri, A.W.; Costanza, R. The role of human, social, built, and natural capital in explaining life satisfaction at the country level: Toward a National Well-Being Index (NWI). Ecol. Econ. 2006, 58, 119–133. [Google Scholar] [CrossRef]
- Yang, L.; Zhen, L.; Li, F.; Wei, Y.J. Impacts of Ecosystem Services Change on Human Well-Being in the Loess Plateau. Resour. Sci. 2010, 32, 849–855, (In Chinese with English Abstract). [Google Scholar]
- Daily, G.C. Nature’s Services: Societal Dependence on Natural Ecosystem; Island Press: Washington, DC, USA, 1997. [Google Scholar]
- Ouyang, Z.Y.; Wang, R.S.; Zhao, J.Z. Ecosystem services and their economic valuation. Chin. J. Appl. Ecol. 1999, 10, 635–640. (In Chinese) [Google Scholar]
- Li, W.H.; Zhang, B.; Xie, G.D. Research on ecosystem services in China: Progress and perspectives. J. Nat. Resour. 2009, 24, 1–10. (In Chinese) [Google Scholar]
- Hains, Y.R.; Potschin, M. The Links between Biodiversity, Ecosystem Services and Human Well-Being. In Ecosystem Ecology: A New Systhsis; Raffaelli, D., Frid, C., Eds.; Cambridge University Press: Cambridge, UK, 2010. [Google Scholar]
- Costanza, R.; D’Arge, R.; De Groot, R.; Farber, S.; Grasso, M.; Hannon, B.; Limburg, K.; Naeem, S.; O’Neill, R.V.; Paruelo, J.; et al. The value of the world’s ecosystem services and natural capital. Nature 1997, 387, 253–260. [Google Scholar] [CrossRef]
- Zheng, H.; Robinson, B.E.; Liang, Y.C.; Polasky, S.; Ma, D.C.; Wang, F.C.; Ruckelshaus, M.; Ouyang, Z.Y.; Daily, G.C. Benefits, costs, and livelihood implications of a regional payment for ecosystem service program. Proc. Natl. Acad. Sci. USA 2013, 110, 16681–16686. [Google Scholar] [CrossRef] [PubMed]
- Smith, L.M.; Case, J.L.; Smith, H.M.; Harwell, L.C.; Summers, J.K. Relating ecosystem services to domains of human well-being: Foundation for a US index. Ecol. Indic. 2012, 28, 79–90. [Google Scholar] [CrossRef]
- Costanza, R.; Norton, B.G.; Haskell, B.D. Toward an Operational Definition of Health. In Ecosystem Health-New Goals for Environmental Management; Island Press: Washington, DC, USA, 1992. [Google Scholar]
- Yan, Y.; Zhao, C.; Wang, C.; Shan, P.; Zhang, Y.; Wu, G. Ecosystem health assessment of the Liao River Basin upstream region based on ecosystem services. Acta. Ecol. Sin. 2016, 36, 294–300. [Google Scholar] [CrossRef]
- Mirzabaev, A.; Ahmed, M.; Werner, J.; Pender, J.; Louhaichi, M. Rangelands of Central Asia: Challenges and opportunities. J. Arid. Land 2016, 8, 93–108. [Google Scholar] [CrossRef]
- Huang, L.; Liu, J.Y.; Shao, Q.Q.; Deng, X.Z. Temporal and spatial patterns of carbon sequestration services for primary terrestrial ecosystems in China between 1900 and 2030. Acta. Ecol. Sin. 2016, 36, 3891–3902, (In Chinese with English Abstract). [Google Scholar]
- Ouyang, Z.Y.; Zheng, H.; Xiao, Y.; Polasky, S.; Liu, J.G.; Xu, W.H.; Wang, Q.; Zhang, L.; Xiao, Y.; Rao, E.M.; et al. Improvements in ecosystem services from investments in natural capital. Science 2016, 352, 1455–1459. [Google Scholar] [CrossRef] [PubMed]
- Ran, S.H.; Zeng, S.Y.; Xue, J.Y. Assessment and Control of Moderate Economic Exploitation in Regions with Vulnerable Ecosystem. J. Arid. Land Resour. Environ. 2003, 16, 1–6, (In Chinese with English Abstract). [Google Scholar]
- Cao, X.S.; Li, P.; Yan, T.Z.; Han, G.H. The land reclamation and its influence on environment in West Liaohe Basin from 1902 to 1990. Geogr. Res. 2005, 24, 889–898, (In Chinese with English Abstract). [Google Scholar]
Figure 1.
Connotation of human wellbeing [14].
Figure 1.
Connotation of human wellbeing [14].
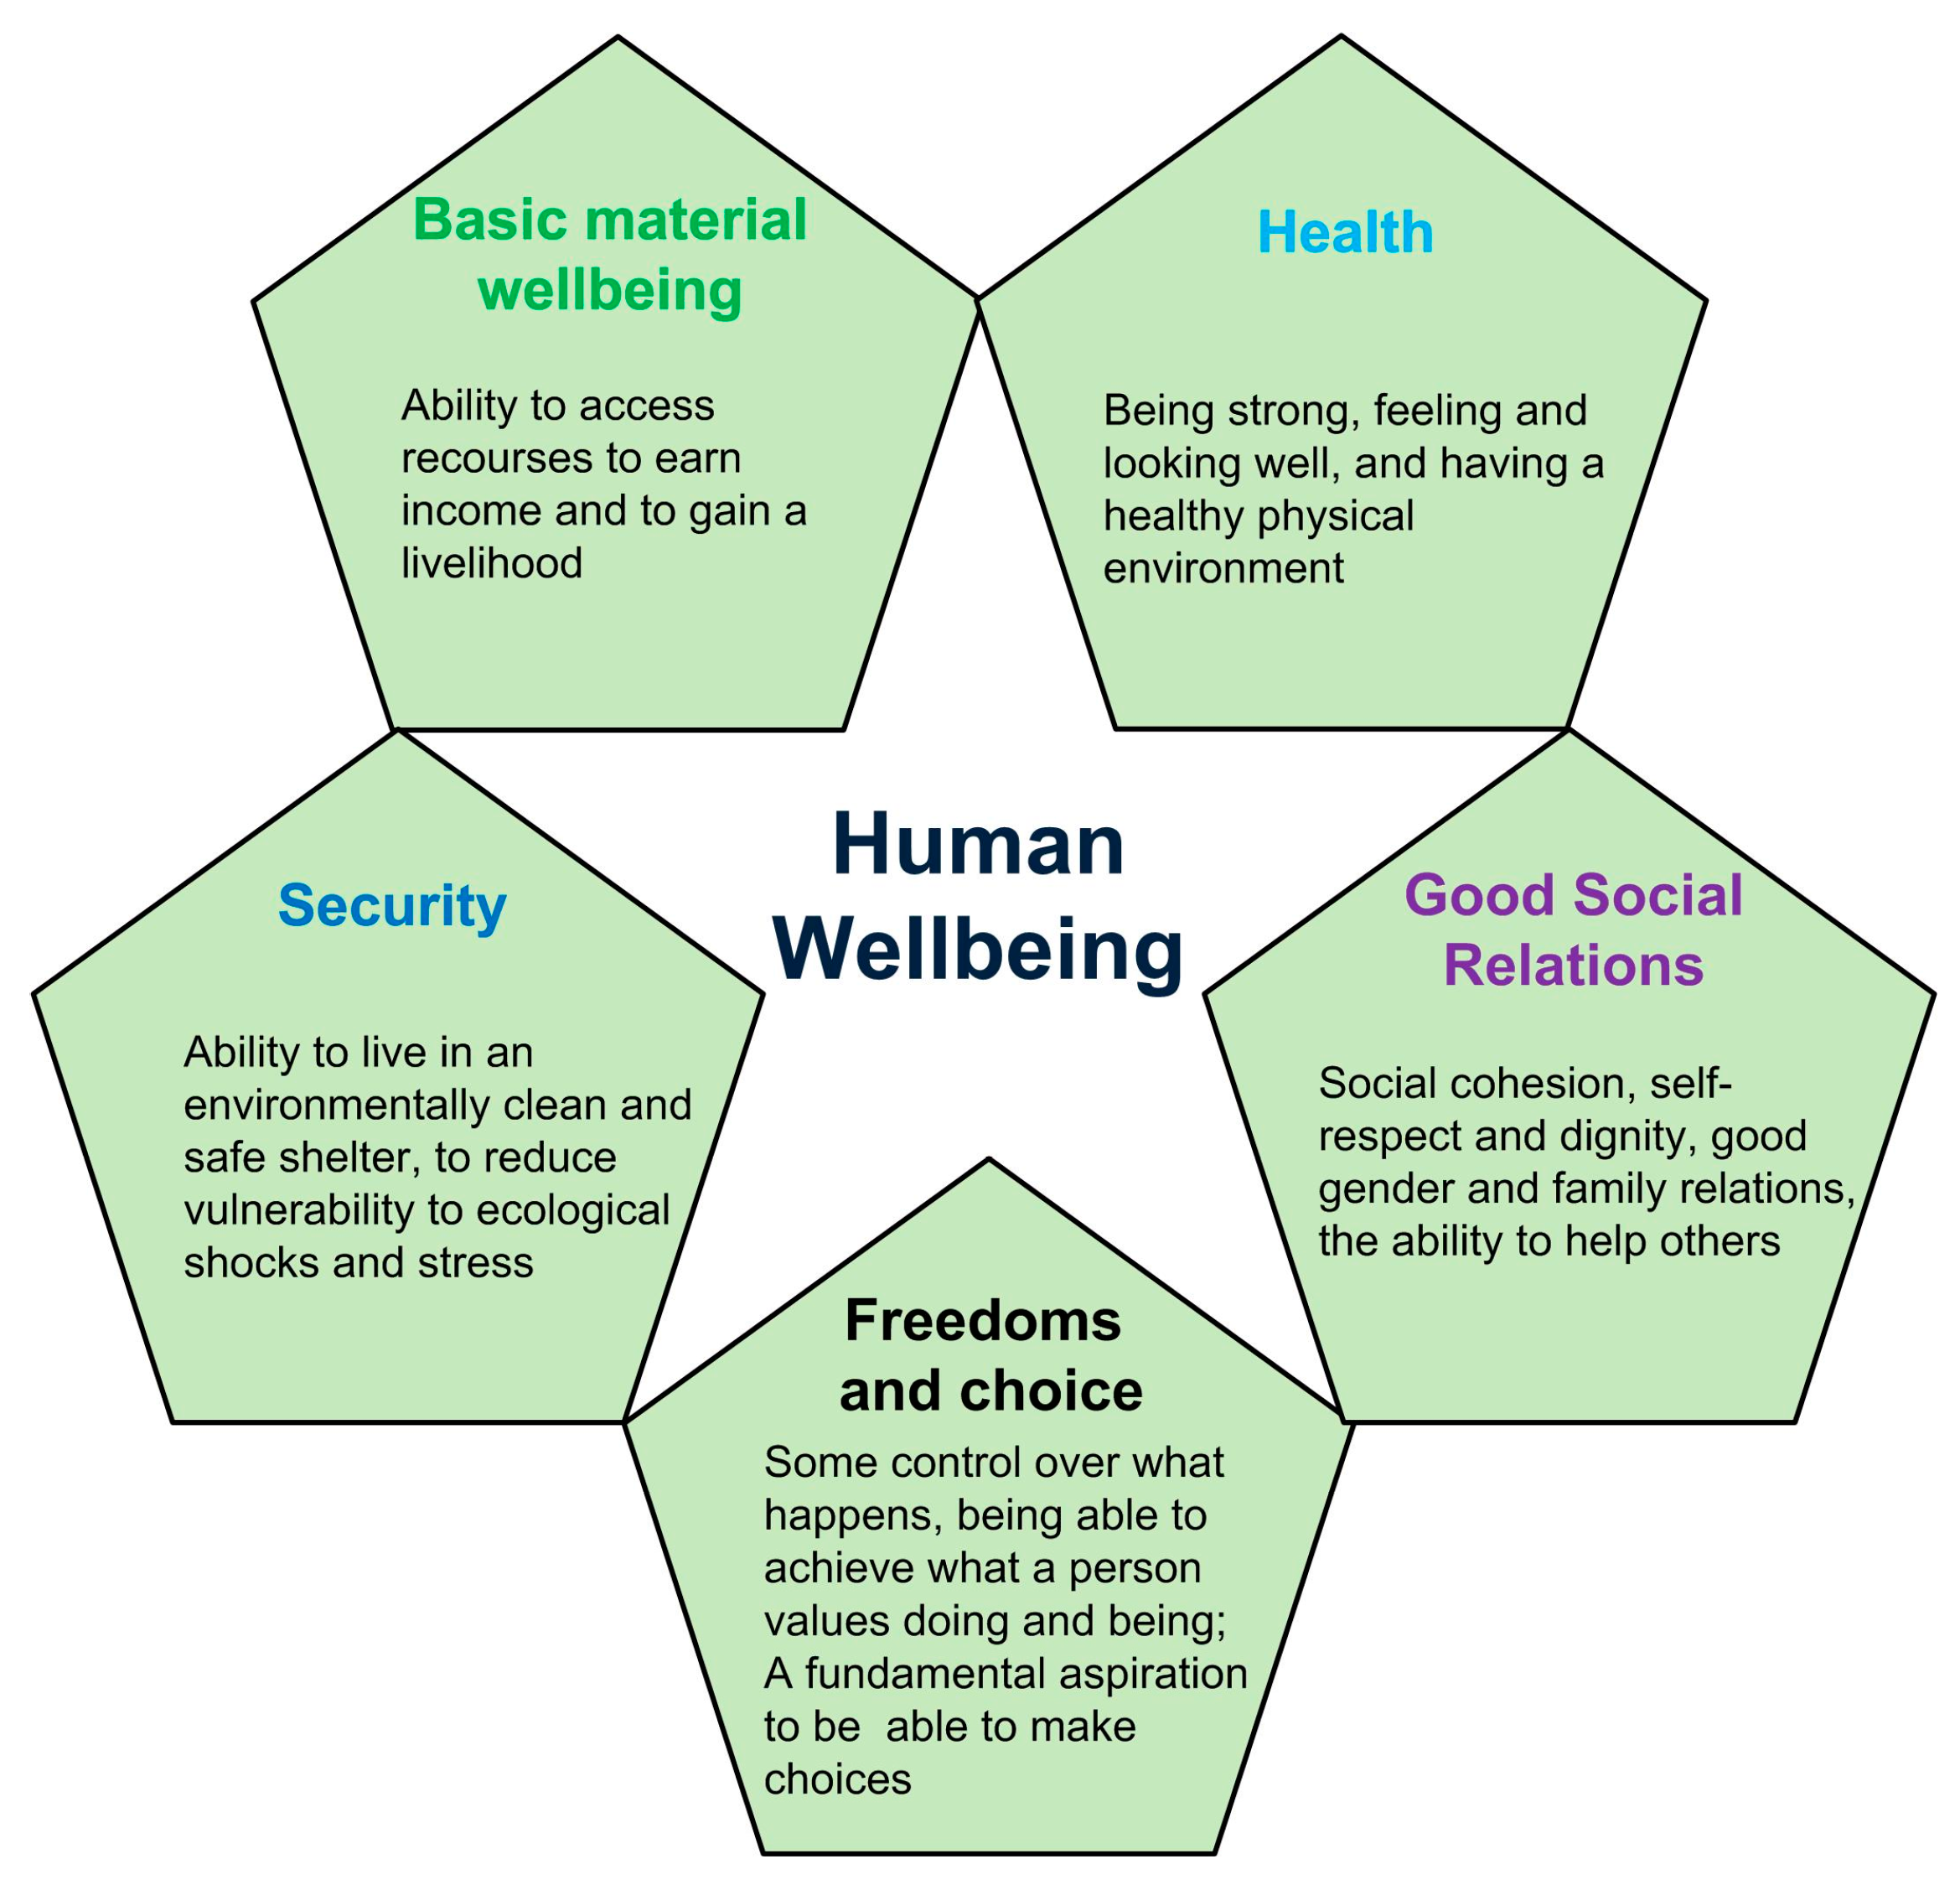
Figure 2.
Geographical location of the research area.

Figure 3.
Spatial distribution of rural population wellbeing and each indicator.
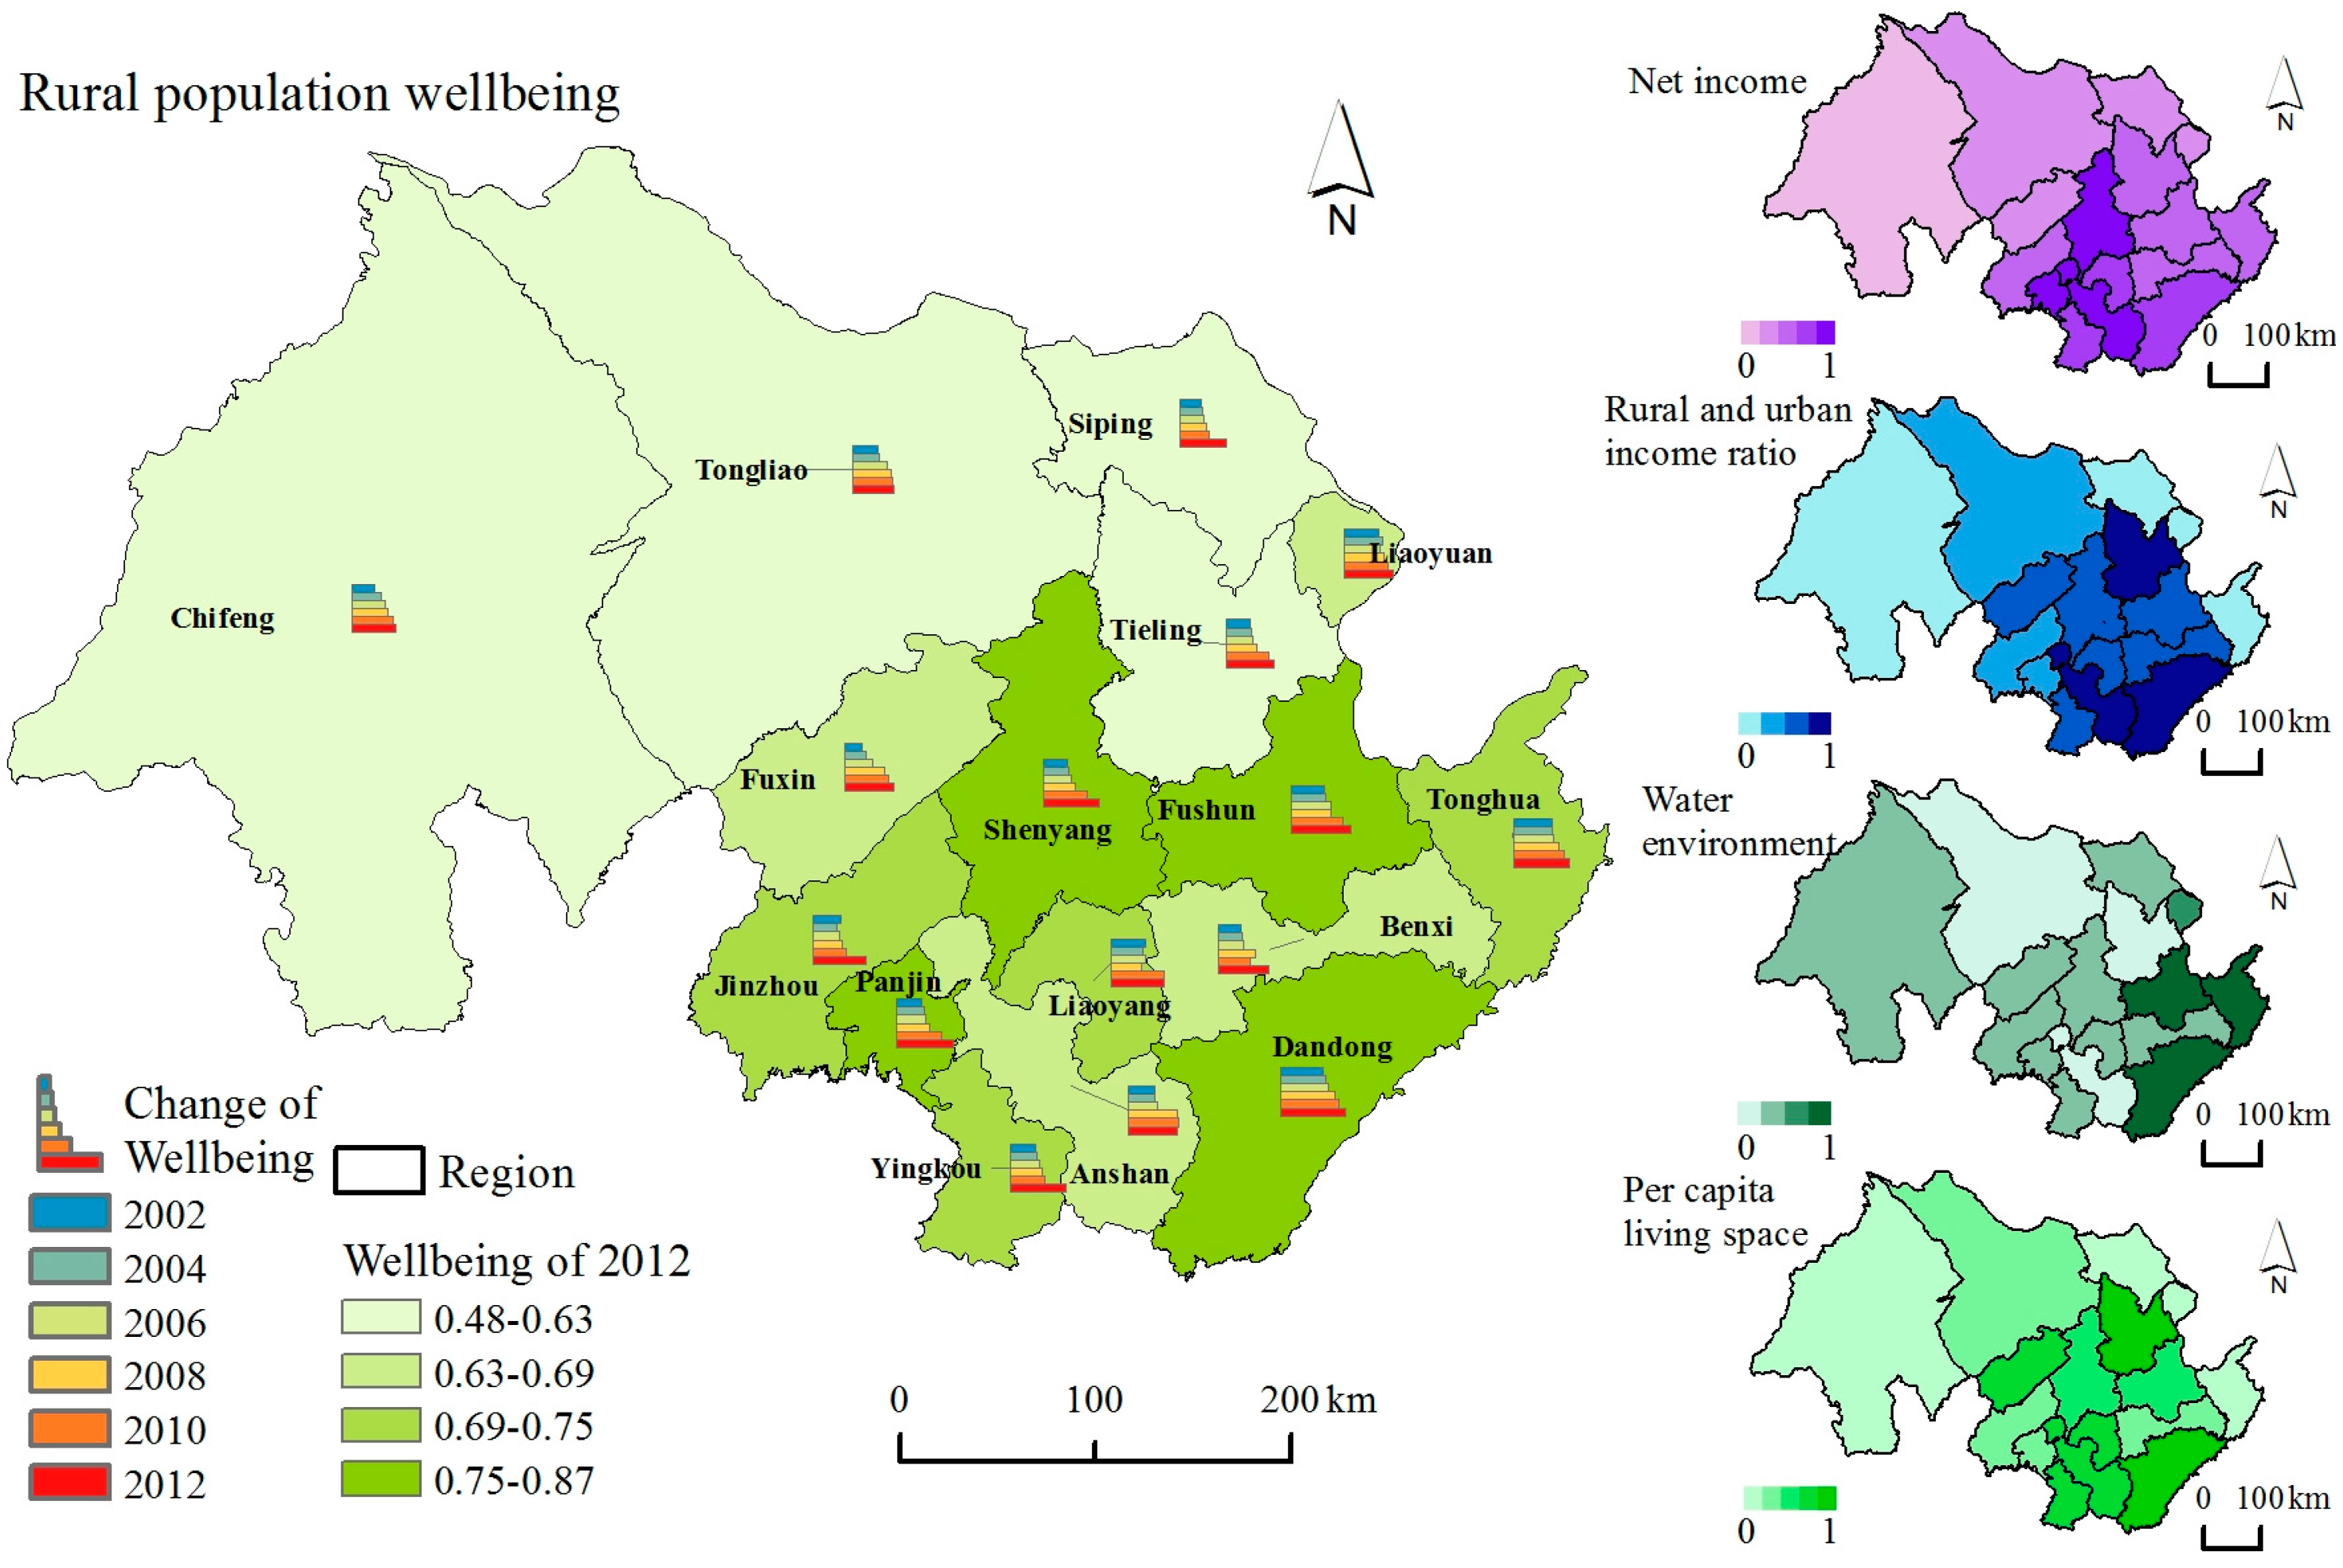
Figure 4.
Changes of RPWB.

Figure 5.
Spatial distribution of major ecosystem services in 2012; (a) sand-fixation; (b) carbon fixation; (c) soil conservation; (d) hydrological adjustment; (e) food supply.
Figure 5.
Spatial distribution of major ecosystem services in 2012; (a) sand-fixation; (b) carbon fixation; (c) soil conservation; (d) hydrological adjustment; (e) food supply.
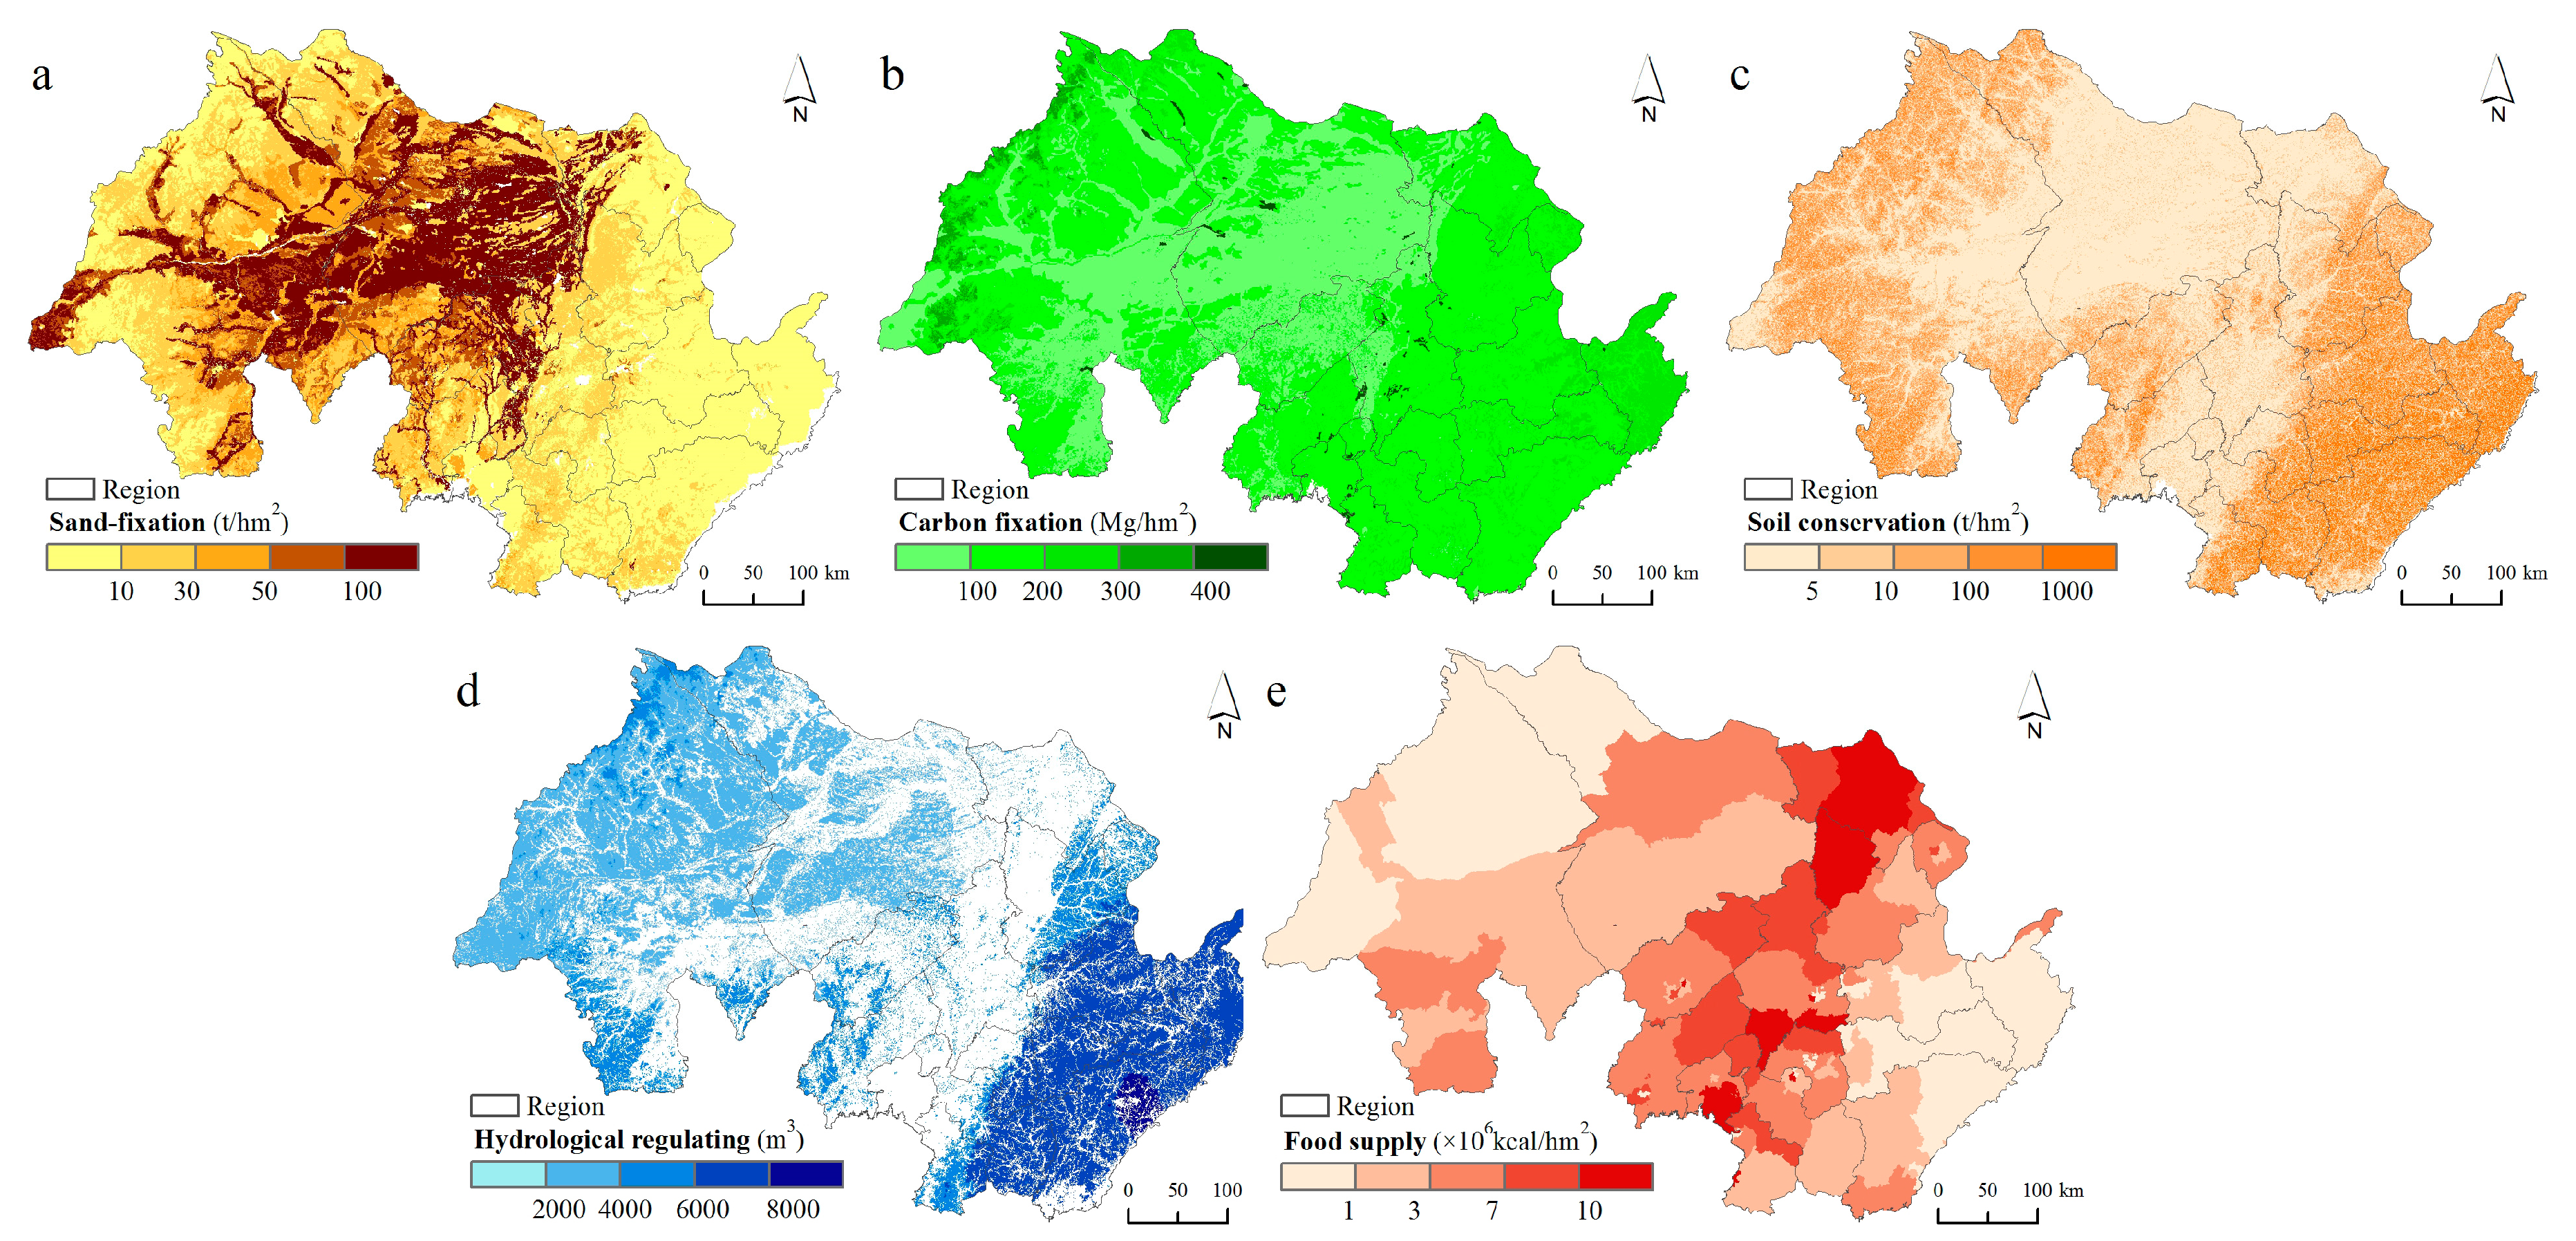
Figure 6.
Regionalization map of interrelation of ecosystem service and rural population wellbeing.

Table 1.
Rural population wellbeing assessment index.
| Layer | Indicator | Unit | |
|---|---|---|---|
| Rural population wellbeing (RPWB) | Economic wellbeing (ECWB) | Per capita net income | Yuan |
| Environmental wellbeing (ENWB) | Water environmental quality | - | |
| Social wellbeing (SWB) | Per capita living space | km2 | |
| Rural and urban income ratio | - |
Note: SWB was averaged the two indices of per capita living space and rural and urban income ratio after normalization.
Table 2.
Ecosystem service index.
| Indicator | Unit | Issue | Modeling Method | |
|---|---|---|---|---|
| ES | Carbon fixation | Mg/hm2 | climate regulation and vegetation protection | Soil organic carbon sequestration of vegetation and soil |
| Food supply | kcal/hm2 | Production capacity | Statistical yearbook | |
| Soil conservation | t/hm2 | Water erosion | Universal soil loss equation (USLE) | |
| Sand fixation | t/hm2 | Wind erosion | Revision wind erosion equation (RWEQ) | |
| Hydrological adjustment | m3 | Regulate water resource | Reserves of precipitation resources |
Table 3.
Interrelations of ecosystem services and rural population wellbeing.
| Spearman Correlation | RPWB | Net Income | Water Environment | Rural-Urban Income Ratio | Living Space |
|---|---|---|---|---|---|
| Carbon fixation | 0.529 ** | 0.096 | 0.409 * | 0.402 * | −0.221 |
| Food supply | 0.009 | 0.479 ** | 0.076 | −0.155 | 0.647 ** |
| Soil conservation | 0.422 * | 0.122 | 0.545 ** | 0.338 | −0.169 |
| Sand fixation | −0.616 ** | −0.117 | −0.306 | −0.503 ** | 0.179 |
| Hydrological adjustment | 0.560 ** | 0.195 | 0.642 ** | 0.353 * | −0.124 |
** Correlaton is significant at the 0.01 level (two-tailed). * Correlation is significant at the 0.05 level (two-tailed).
© 2017 by the authors. Licensee MDPI, Basel, Switzerland. This article is an open access article distributed under the terms and conditions of the Creative Commons Attribution (CC BY) license (http://creativecommons.org/licenses/by/4.0/).
Share and Cite
MDPI and ACS Style
Yan, Y.; Zhao, C.; Quan, Y.; Lu, H.; Rong, Y.; Wu, G. Interrelations of Ecosystem Services and Rural Population Wellbeing in an Ecologically-Fragile Area in North China. Sustainability 2017, 9, 709. https://doi.org/10.3390/su9050709
AMA Style
Yan Y, Zhao C, Quan Y, Lu H, Rong Y, Wu G. Interrelations of Ecosystem Services and Rural Population Wellbeing in an Ecologically-Fragile Area in North China. Sustainability. 2017; 9(5):709. https://doi.org/10.3390/su9050709
Chicago/Turabian StyleYan, Yan, Chunli Zhao, Yuan Quan, Huiting Lu, Yi Rong, and Gang Wu. 2017. "Interrelations of Ecosystem Services and Rural Population Wellbeing in an Ecologically-Fragile Area in North China" Sustainability 9, no. 5: 709. https://doi.org/10.3390/su9050709
Note that from the first issue of 2016, this journal uses article numbers instead of page numbers. See further details here.