Measuring the Changes of Greenhouse Gas Emissions Caused by the Trans-Pacific Partnership

1
Faculty of Bioresource Sciences, Akita Prefectural University, Akita 010-0195, Japan
2
Research Faculty of Agriculture, Hokkaido University, Sapporo 060-8589, Japan
*
Author to whom correspondence should be addressed.
Sustainability 2017, 9(5), 715; https://doi.org/10.3390/su9050715
Submission received: 10 February 2017
/
Revised: 14 April 2017
/
Accepted: 25 April 2017
/
Published: 29 April 2017
(This article belongs to the Section Economic and Business Aspects of Sustainability)
Abstract
:The Trans-Pacific Partnership (TPP) is one of the proposed mega-free trade agreements. While several previous studies have measured the economic impact of the trade liberalization resulting from the TPP, the TPP may have not only a very large economic impact, but also a significant environmental impact, such as changes in greenhouse gas (GHG) emissions. The purpose of this paper is to contribute to the debate over TPP and GHG emissions by asking the following question: Will the TPP increase or decrease GHG emissions? We estimate the potential impact on GHG emissions changes caused by the TPP using the Global Trade Analysis Project (GTAP) model, and the GTAP CO2 and non-CO2 emissions databases. Our results suggest that the TPP is likely to increase the total amount of GHG emissions in the 12 TPP member countries, as well as global emissions. The main reason for increasing TPP member and global GHG emissions is non-CO2 emissions growth in Australia and the US.
1. Introduction
The Trans-Pacific Partnership (TPP) was signed by 12 countries (Japan, Malaysia, Singapore, Vietnam, Brunei, Australia, New Zealand, the United States (US), Canada, Mexico, Peru, and Chile) on February 2016. The current TPP members account for approximately 40 percent of global GDP and one third of world trade [1]. Compared with the other Asia–Pacific mega-free trade agreements (FTAs) (Regional Comprehensive Economic Partnership (RCEP), Free Trade Area of Asia–Pacific (FTAAP), and Japan–China–Korea FTA (JCKFTA)), the TPP is characterized by not including the large Asian countries, China and India. The formation of a TPP would have both a very large economic impact and a significant environmental impact for the TPP members and the world. The environmental impact of a regional trade agreement is an empirical question [2].
The purpose of this paper is to contribute to the debate over the TPP and greenhouse gas (GHG) emissions by asking the following question: Does the TPP increase or decrease GHG emissions? To address this research question, we estimate the potential impact on GHG emissions changes of the TPP using the Global Trade Analysis Project (GTAP) model [3], the GTAP CO2 emissions database [4], and the GTAP non-CO2 emissions database [5].
2. Literature Review
Several previous studies have quantitatively analyzed the economic impact of the TPP (Table 1). Burfisher et al. [6] assessed the impact of the TPP on agriculture using the static GTAP model and GTAP 8 database, and the model was solved with macroprojections and trade policy updates to 2025. They showed that the impact on real GDP is quite small, and that total agricultural exports and imports will increase for all TPP members. Farm sector outputs decrease in Japan and increase in Australia, New Zealand, and the US. Cheong [7] used the recursive dynamic GTAP model and GTAP 8 database. The results showed that country-level changes in 2027 GDP compared with the baseline range from −0.13% (Chile) to 0.97% (New Zealand). Kawasaki [8] used the static GTAP Computable General Equilibrium (CGE) model with capital accumulation and endogenous productivity growth and the GTAP 8 database updated to 2010. They showed that changes in welfare associated with tariff removal as a percentage of real GDP range from 0.1% (US) to 9.9% (Vietnam). Itakura and Lee [9] used the recursive dynamic GTAP model and GTAP 7 database. They showed that changes in 2030 welfare compared with the baseline range from 0.8% (US) to 5.6% (Vietnam). Lee and Itakura [10] used the recursive dynamic GTAP model and GTAP 8.1 database. They showed that changes in 2030 welfare compared with the baseline range from 0.15% (US) to 2.66% (Vietnam), and that Japan’s livestock-sector output decreases by 6.1%. Petri et al. [11] used the recursive dynamic CGE model with Melitz firm heterogeneity, foreign direct investment flows, and preliminary GTAP 8 database. They showed that changes in 2025 GDP compared with the baseline range from 0.4% (US) to 13.6% (Vietnam) and that changes in 2025 exports range from 2.5% (Chile) to 37.3% (Vietnam). Areerat et al. [12] used the static GTAP model and GTAP 7 database. They showed that changes in GDP range from −0.03% (Peru) to 0.49% (Vietnam).
Several previous studies have analyzed the environmental impact of trade liberalization on GHG emissions (e.g., Thomassin and Mukhopadhyay [2]; Gumilang et al. [13]; Liu et al. [14]; Mukhopadhyay and Thomassin [15]; Saunders et al. [16]; Verburg et al. [17]; and Akahori and Yamamoto [18,19]). Akahori and Yamamoto [18,19] assessed the impact of the RCEP and the FTAAP on GHG emissions, respectively. However, no studies have examined the environmental impact on GHG emissions caused by the TPP.
3. Methods and Data
To compare our results with those of other studies of mega-FTAs, we use the same method, data, and trade liberalization scenario as Akahori and Yamamoto [18] to measure the potential impact on GHG emissions of trade liberalization under the TPP. First, the GTAP model is used to estimate the changes in the economic variables of interest, such as the levels of sectoral fuel consumption, caused by the TPP. Second, the GTAP results, the GTAP CO2 emissions database, and the GTAP non-CO2 emissions database are used to estimate the potential impact of GHG emissions caused by the TPP.
To estimate the economic impact of the TPP, we use the static version of the GTAP model with standard closure and the GTAP 8.1 database for 2007. If the model used is the dynamic version of the GTAP model and a single period involves more than two years, the results should be converted to average annual values (Tassone et al. [20]). As the model used in this study is not dynamic and does not contain an explicit time dimension, we cannot attach a time dimension to the changes. The changes are interpreted as the differences between two equilibria; the original equilibrium in 2007 and the alternative equilibrium associated with the policy change. Antweiler et al. [21] decomposed the impact of trade on pollution into a scale effect, a composition effect, and a technique effect. The scale effect captures the impact of the change in the size of each economy. If the TPP increases the real GDP in each economy, the scale effect may increase GHG emissions. The composition effect captures the impact of the change in the industrial structure of each economy. As the TPP may have both positive and negative effects on the output of each industrial sector, the composition effect may have positive or negative effects on GHG emissions. The technique effect captures the impact of introducing cleaner production methods (e.g., biofuel production and utilization as a substitute for gasoline; Le et al. [22]). Although the technique effect is likely to decrease GHG emissions, it is difficult to properly assume such technical progress. As we do not assume any technical change that has a GHG reduction effect, our results capture the scale and composition effects of the TPP and cannot capture the technique effect.
Our trade liberalization scenario assumes the complete removal of all import tariffs among the TPP members. While it is unlikely that all TPP members would simultaneously remove all import tariffs across all sectors, our scenario provides an upper bound on the possible economic impact of the TPP.
Table 2 shows the regions and sectors we use in our analysis. In order to compare our results with the results for other mega-FTAs such as the Regional Comprehensive Economic Partnership (RCEP), we combine the 129 countries and regions in GTAP 8.1 into 26 regions. We retain the original 57 industries in the database.
We measure the environmental impact of the TPP by focusing only on GHG emissions as the form of environmental load because of data-availability limitations. We use the GTAP CO2 emissions database and the GTAP non-CO2 emissions database to measure the impact of the TPP on GHG emissions.
The GTAP CO2 emissions database provides detailed emissions data from the combustion of fossil fuels only, with CO2 emissions calculated by multiplying the amount of fuel consumed by the emission coefficients [4]. We assume that these emission coefficients remain unchanged following trade liberalization, and that the levels of CO2 emissions will, therefore, change by the same proportion as the levels of sectoral fuel consumption. Thus, we calculate the post-TPP levels of CO2 emissions by multiplying the initial level of CO2 emissions for each sector by the corresponding change in sectoral fuel consumption from the GTAP model results. For example, CO2 emissions produced by coal use in the electricity sector are calculated by multiplying the initial levels of CO2 emissions resulting from coal use in the electricity sector by the change in coal use in the electricity sector derived from the GTAP results.
The GTAP non-CO2 emissions database enables us to measure methane (CH4), nitrous oxide (N2O), and fluorinated GHGs (or F-gases) (namely, tetrafluorocarbon, hydrofluorocarbons, and sulfur hexafluoride) [5]. In this database, the levels of each type of non-CO2 emission are associated with output, endowment use, and input use by industry and private households [23]. We assume that the levels of non-CO2 gases change by the same proportion as the corresponding GTAP variables. This assumption allows us to calculate the post-TPP level of non-CO2 gases by multiplying the initial level of non-CO2 emissions by the corresponding sectoral changes derived from the GTAP results. For example, the paddy rice sector emits CH4. We then calculate the post-TPP level of CH4 emissions from land use in the paddy rice sector by multiplying the initial CH4 emissions by the change in land use for paddy rice derived from the GTAP results.
Data on anthropogenic fossil fuel combustion CO2 and all non-CO2 GHG emissions are provided in Table 3. All emission figures are converted to millions of metric tons (Mt) of CO2 equivalent. Globally, about 70% of all GHG emissions are from CO2 emissions and about 30% are from non-CO2 emissions. Of the TPP members, the US is the largest GHG emitter, and Japan is the second largest GHG emitter.
To measure the environmental efficiency of the macroeconomy, we introduce the emission intensity index (see [14]). The emission intensity indices of GHGs are calculated in terms of GHG emissions per unit of GDP output. A decrease in an emission intensity index means that environmental efficiency has improved.
4. Results
Under the assumption of the complete removal of all import tariffs among the TPP members, all members are likely to experience an increase in total exports and imports. In terms of real GDP, the US and Peru are likely to experience a slight decrease. Across the countries in the TPP, on average, real GDP, total exports and imports increase by 0.06%, 1.33%, and 1.56%, respectively (Table 4). Non-TPP economies are likely to experience a decrease in real GDP. In percentage terms, the increases are the highest in Vietnam: 1.39% in GDP, 10.55% in total exports, and 15.22% in total imports.
When comparing our results with the previous studies’ results, we found the following in common. Areerat et al. [12] also showed that the real GDP of the US and Peru decrease slightly. Burfisher et al. [6], Kawasaki [8], Lee and Itakura [10], Petri et al. [11], and Areerat et al. [12] also showed that Vietnam has the highest real GDP growth rate. Petri et al. [11] also showed that the TPP increases total exports in all TPP members.
In this study, we focus only on the impact of tariff elimination. Thus, our results for real GDP are relatively small when compared with the results of other studies that include the reduction of NTMs (non-tariff measures) such as Kawasaki [8] and Petri et al. [11]. While the maximum percentage change in GDP for our study is 1.39%, the maximum percentage change in GDP by the simulations that incorporate NTMs ranges from 2.66% (Lee and Itakura [10]) to 20.6% (Kawasaki [8]).
In Table 5, Table 6 and Table 7, we focus on Japan and the US as the two largest TPP members (in terms of real GDP), Australia and New Zealand, given that they have the highest and second highest growth rates in non-CO2 emissions, and China, India, and the European Union (EU) as key non-TPP member economies throughout the following discussion.
Table 5 shows the changes in the sectoral output for a year in percentage terms. Among the TPP participants, farm output (defined as the agricultural sectors “paddy rice” to “wool, silkworm cocoons,” which correspond to sectors 1–12 in Table 2) declines in Japan, but increases in Australia, New Zealand, and the US. In percentage terms, the declines in output from the wheat sector (−77.55%) and the paddy rice sector (−37.30%) are the two largest sectoral output changes in Japan. In contrast, the rate of growth in paddy rice production is the highest or second highest of all sectors in Australia (193.46%), New Zealand (17.49%), and the US (56.41%). Livestock sector output decreases in Japan, but increases in Australia, New Zealand, and the US. Output in the electricity sector, one of the largest sources of CO2 emissions, increases in Japan, but decreases in Australia, New Zealand, and the US.
Lee and Itakura [10] showed that farm sector outputs decrease in Japan and increase in the US. Burfisher et al. [6] also showed that farm sector outputs decrease in Japan and increase in Australia, New Zealand, and the US. Compared with the results of RCEP [18] and FTAAP [19], the impact of the TPP on the paddy rice sector output is smaller than that of the RCEP and the FTAAP.
Table 6 shows the impact of the TPP on GHG emissions. The figures in the table are changes in the GHG emissions for a year in Mt of CO2 equivalent. In the following tables, the figures in parentheses are percentage deviations from the initial period, calculated as the amount of change divided by the initial amount. The TPP increases total TPP member and global GHG emissions by 17.79 Mt CO2 eq. (0.17%) and 22.79 Mt CO2 eq. (0.06%), respectively. As for our main research question, these results indicate that the TPP is likely to increase both TPP member and global GHG emissions. The main reason for increasing TPP member and global GHG emissions is non-CO2 emissions growth in Australia (7.05 Mt CO2 eq.) and the US (8.38 Mt CO2 eq.). However, the magnitude of the change is relatively small (only a 0.17% increase) when compared with the original level of emissions in Table 3. Note that because of the assumptions in our analysis these changes in the GHG emissions reflect only the composition and scale effects. If some technical change that has a GHG reducing effect is assumed and the technique effect is incorporated, GHG emissions might decline.
Total TPP member and global CO2 emissions increase by 2.99 Mt CO2 eq. (0.04%) and 6.62 Mt CO2 eq. (0.02%), respectively. Total TPP member and global non-CO2 emissions increase by 14.80 Mt CO2 eq. (0.71%) and 16.17 Mt CO2 eq. (0.16%), respectively. Among the non-TPP members, the total GHG emissions of China, India, and the EU increase by 1.01 Mt CO2 eq. (0.01%), 0.34 Mt CO2 eq. (0.02%), and 0.66 Mt CO2 eq. (0.01%), respectively.
Focusing on individual economy results, Japan experiences the largest increase in CO2 emissions (2.38 Mt CO2 eq.) among TPP members. In terms of non-CO2 emissions, Japan experiences the largest decrease (−5.97 Mt CO2 eq.), and the US and Australia experience the largest and the second largest increases (8.38 Mt CO2 eq. and 7.05 Mt CO2 eq.) among the TPP members. Among non-TPP members, China also experiences the largest change in CO2 (2.76 Mt CO2 eq.) and non-CO2 emissions (−1.75 Mt CO2 eq.). In percentage terms, Australia has the largest increase in non-CO2 emissions (4.93%) and New Zealand has the second largest increase in non-CO2 emissions (3.91%), while Japan has the largest decrease in non-CO2 emissions (−6.70%).
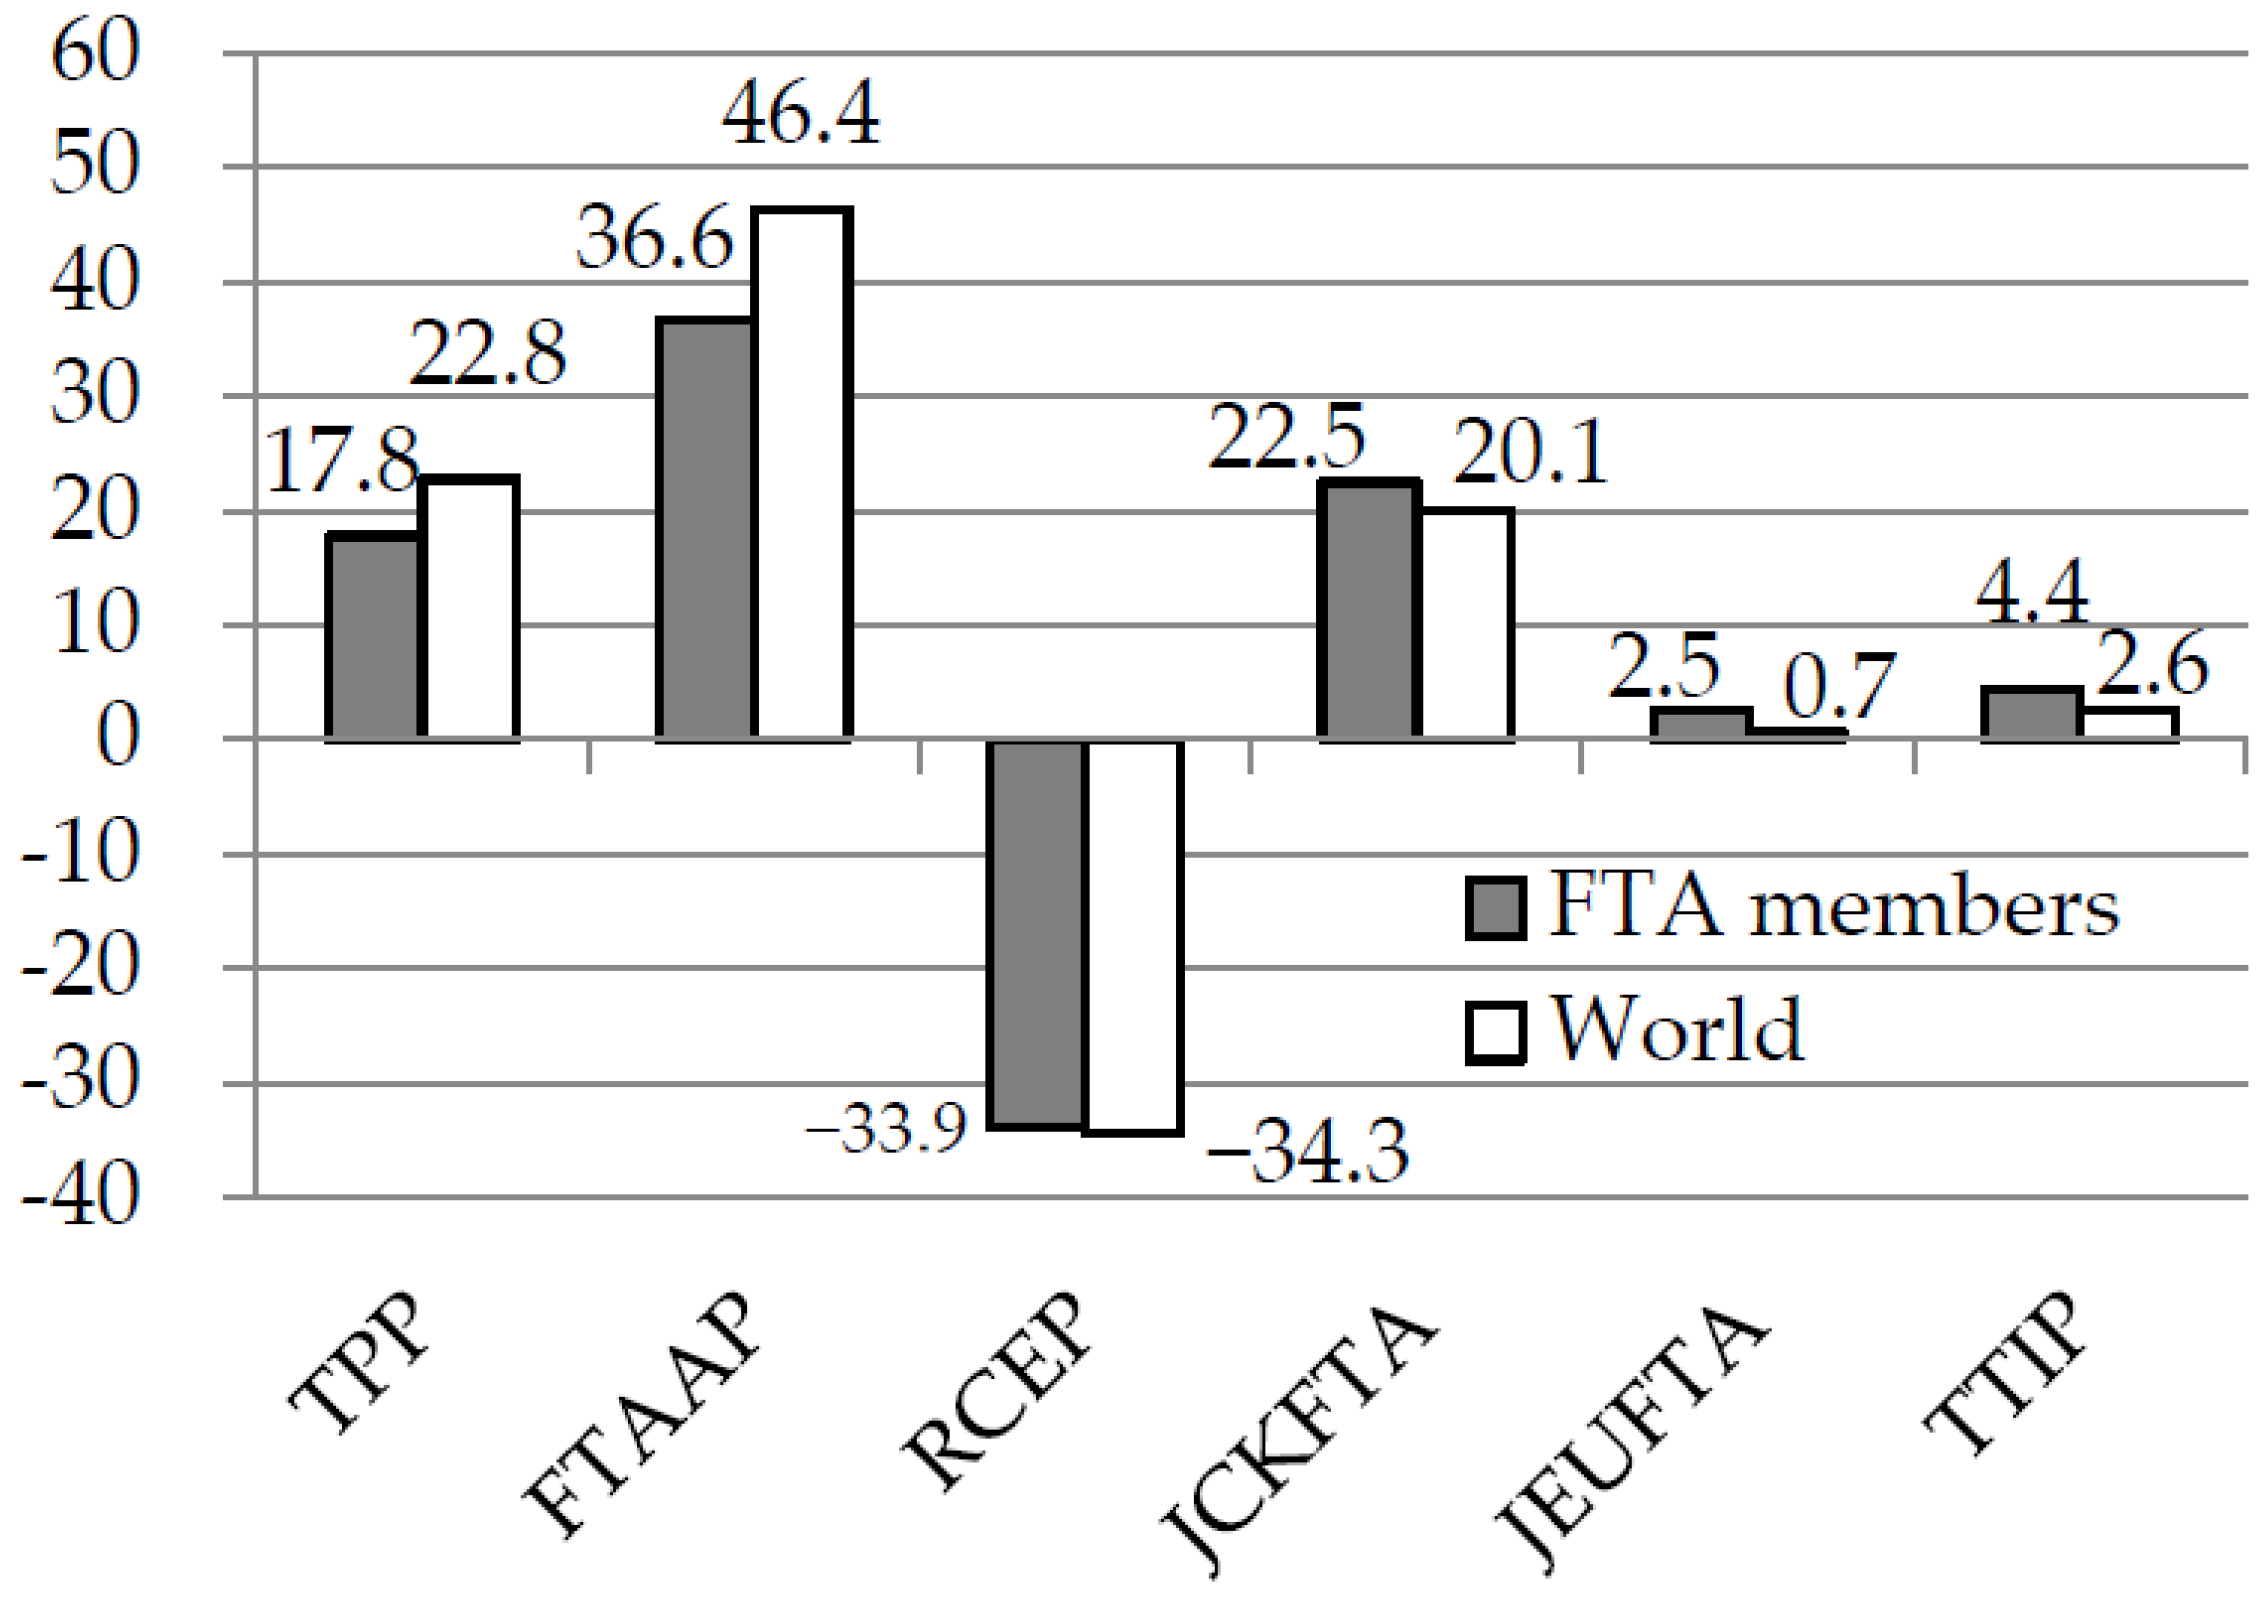
In Figure 1, we compare the environmental impact of the TPP and that of other mega-FTAs, including TPP, FTAAP, RCEP, JCKFTA, the Japan–EU FTA (JEUFTA), and the Transatlantic Trade and Investment Partnership (TTIP). We estimate the results for other mega-FTAs using the same model as used in this study. The trade liberalization scenarios for the mega-FTAs are the complete removal of all import tariffs among each FTA member. Among the four Asia–Pacific mega-FTAs (TPP, FTAAP [19], RCEP [18], and JCKFTA), only RCEP shows a decrease in GHG emissions. This is mainly because of the large decrease in CO2 emissions from the Indian electricity sector. As of the end of January 2017, India had joined the RCEP, but not the TPP. Thus, whether India chooses to participate in the Asia–Pacific mega-FTA will have a significant impact on GHG emissions in the Asia–Pacific region and the world. Among the three FTAs that increase GHG emissions (TPP, FTAAP, and JCKFTA), the TPP shows the smallest increase in FTA members’ GHG emissions and the second smallest increase in global GHG emissions.
Table 7 shows the five sectors that contribute most to the absolute changes in CO2, CH4, and N2O emissions. We omitted F-gases from the table because relatively few sectors emit these GHGs. In terms of CO2 emissions, the electricity sector is shown for all economies except the EU.
Regarding the CH4 emissions of the top five sectors, the paddy rice sector experiences the largest decrease in Japan (−1.36 Mt CO2 eq.). Australia and the US also include the paddy rice sector in their top five sectors. In percentage terms, CH4 emissions from the raw milk sector decrease the most in Japan (−25.93%). These results arise mainly because of the large decrease in output from the paddy rice sector and livestock sectors in Japan and the large increase in output from the rice sector and livestock sectors in Australia, New Zealand, and the US, as shown in Table 5. While all economies in Table 7 have a cattle, sheep, goats, and horses sector, all economies in Table 7 other than China, have a raw milk sector.
Regarding the N2O emissions of the top five sectors, in percentage terms, the paddy rice sector shows the largest change in Japan (−37.30%), Australia (193.46%), and the US (56.41%). These results are also a result of the large decrease in output from the paddy rice sector in Japan and the large increase in output from the paddy rice sector in Australia and the US, as shown in Table 5. All economies in Table 7 other than the EU include the cattle, sheep, goats, and horses sector in their top five N2O-emitting sectors.
Regarding CH4 emissions, three or more of the top five emitting sectors in each economy are farming-related sectors. Regarding N2O emissions, all of the top five emitting sectors in each economy are farming-related sectors.
To measure the environmental efficiency of the macroeconomy, the emission intensity indices of GHGs are calculated in terms of GHG emissions per unit of GDP output. The changes in the GHG emissions intensity indexes are shown in Table 8. The GHG emissions intensity index of all TPP members increases by 0.11%, suggesting that the TPP could reduce the overall environmental efficiency of TPP members’ macroeconomies in terms of GHG emissions. As shown in Table 7, this is attributable mainly to the significant increase in non-CO2 emissions from the agricultural sectors in Australia and the US.
5. Conclusions
The purpose of this paper is to contribute to the debate over the TPP and GHG emissions by asking the following question: Does the TPP increase or decrease GHG emissions? In order to answer this question, we measured the potential impact on GHG emissions caused by the TPP using the GTAP model, the GTAP CO2 emissions database, and the GTAP non-CO2 emissions database. Our scenario assumed the complete removal of all import tariffs among the TPP members.
Our results showed that the TPP is likely to increase total TPP member and global GHG emissions. They also showed that non-CO2 emissions growth in Australia and the US is the main reason for rising TPP member and global GHG emissions. Compared with other Asia–Pacific mega-FTAs, the TPP showed the smallest increase in FTA members’ GHG emissions and the second smallest increase in global GHG emissions. The magnitude of the change in GHG emissions under the TPP is also small (only a 0.17% increase) when compared with the original level of emissions. If some technical change that has a GHG reducing effect occurs concurrently with the enactment of the TPP, GHG emissions may decline.
Acknowledgments
This work was supported by JSPS KAKENHI Grant Numbers JP26252036 and JP16H06202. The research benefited from expert discussions at the Western Economic Association International 90th Annual Conference, on 28 June–2 July 2015, at Hilton Hawaiian Village, Waikiki, Honolulu, Hawaii, USA.
Author Contributions
Hirokazu Akahori and Yasutaka Yamamoto proposed and carried out the study. Hirokazu Akahori contributed to preparing the manuscript. Daisuke Sawauchi and Yasutaka Yamamoto participated in writing the manuscript and revising it critically. All authors have read and approved the final manuscript.
Conflicts of Interest
The authors declare no conflict of interest.
References
- World Economic Outlook. Available online: http://www.imf.org/external/pubs/ft/weo/2015/01/weodata/index.aspx (accessed on 1 August 2015).
- Thomassin, P.J.; Mukhopadhyay, K. Impact of East-Asian Free Trade on Regional Greenhouse Gas Emissions. J. Int. Glob. Econ. Stud. 2008, 1, 57–83. [Google Scholar]
- Hertel, T.W. (Ed.) Global Trade Analysis: Modeling and Applications; Cambridge University Press: Cambridge, UK, 1997. [Google Scholar]
- Lee, H.L. An Emissions Data Base for Integrated Assessment of Climate Change Policy Using GTAP. Available online: https://www.gtap.agecon.purdue.edu/resources/res_display.asp?RecordID=1143 (accessed on 7 February 2017).
- Ahmed, S.A.; Rose, S.K.; Hertel, T.W.; Irfanoglu, Z.B. Development of the Version 8 Non-CO2 GHG Emissions Dataset. Available online: https://www.gtap.agecon.purdue.edu/resources/res_display.asp?RecordID=4343 (accessed on 7 February 2017).
- Burfisher, M.E.; Dyck, J.; Meade, B.; Mitchell, L.; Wainio, J.; Zahniser, S.; Arita, S.; Bechman, J. Agriculture in the Trans-Pacific Partnership. Available online: https://www.ers.usda.gov/webdocs/publications/err176/49379_err176.pdf (accessed on 7 February 2017).
- Cheong, I. Negotiations for the Trans-Pacific Partnership Agreement: Evaluation and Implications for East Asian Regionalism. Available online: https://www.adb.org/sites/default/files/publication/156283/adbi-wp428.pdf (accessed on 7 February 2017).
- Kawasaki, K. The Relative Significance of EPAs in Asia-Pacific. Available online: http://www.rieti.go.jp/jp/publications/dp/14e009.pdf (accessed on 7 February 2017).
- Itakura, K.; Lee, H. Welfare Changes and Sectoral Adjustments of Asia-Pacific Countries under Alternative Sequencings of Free Trade Agreements. Available online: http://www.osipp.osaka-u.ac.jp/archives/DP/2012/DP2012E005.pdf (accessed on 7 February 2017).
- Lee, H.; Itakura, K. Applied General Equilibrium Analysis of Mega-Regional Free Trade Initiatives in the Asia-Pacific. Available online: http://econpapers.repec.org/paper/ospwpaper/15e001.htm (accessed on 7 February 2017).
- Petri, P.; Plummer, M.; Zhai, F. The Trans-Pacific Partnership and Asia-Pacific Integration: A Quantitative Assessment; Peterson Institute for International Economics and East-West Center: Washington, DC, USA, 2012. [Google Scholar]
- Areerat, T.; Kameyama, H.; Ito, S.; Yamauchi, K. Trans Pacific Strategic Economic Partnership with Japan, South Korea and China Integrate: General Equilibrium Approach. Am. J. Econ. Bus. Adm. 2012, 4, 40–46. [Google Scholar]
- Gumilang, H.; Mukhopadhyay, K.; Thomassin, P.J. Economic and Environmental Impacts of Trade Liberalization: The Case of Indonesia. Econ. Model. 2011, 28, 1030–1041. [Google Scholar] [CrossRef]
- Liu, Z.; Mao, X.; Tang, W.; Hu, T.; Song, P. An Assessment of China-Japan-Korea Free Trade Agreement’s Economic and Environmental Impacts on China. Front. Environ. Sci. Eng. 2012, 6, 849–859. [Google Scholar] [CrossRef]
- Mukhopadhyay, K.; Thomassin, P.J. Economic and Environmental Impact of Free Trade in East and South East Asia; Springer: Berlin, Germany, 2010. [Google Scholar]
- Saunders, C.; Wreford, A.; Cagatay, S. Trade Liberalisation and Greenhouse Gas Emissions: The Case of Dairying in the European Union and New Zealand. Aust. J. Agric. Resour. Econ. 2006, 50, 538–555. [Google Scholar] [CrossRef]
- Verburg, R.; Stehfest, E.; Woltjer, G.; Eickhout, B. The Effect of Agricultural Trade Liberalisation on Land-use Related Greenhouse Gas Emissions. Glob. Environ. Chang. 2009, 19, 434–446. [Google Scholar] [CrossRef]
- Akahori, H.; Yamamoto, Y. The Regional Comprehensive Economic Partnership and Its Potential Impact on Greenhouse Gas Emissions. In Proceedings of the 14th International Convention of the East Asian Economic Association, Bangkok, Thailand, 1–2 November 2014. [Google Scholar]
- Akahori, H.; Yamamoto, Y. Does a Free Trade Area of the Asia-Pacific Increase Greenhouse Gas Emissions?: Evidence from GTAP model analysis. In Proceedings of the 11th International Conference of the Western Economic Association International, Wellington, New Zealand, 8–11 January 2015. [Google Scholar]
- Tassone, V.C.; Wesseler, J.; Nesci, F.S. Diverging Incentives for Afforestation from Carbon Sequestration: an Economic Analysis of the EU Afforestation Program in the South of Italy. For. Policy Econ. 2004, 6, 567–578. [Google Scholar] [CrossRef]
- Antweiler, W.; Copeland, B.R.; Taylor, M.S. Is Free Trade Good for the Environment? Am. Econ. Rev. 2001, 91, 877–908. [Google Scholar] [CrossRef]
- Le, L.T.; van Ierland, E.C.; Zhu, X.; Wesseler, J. Energy and Greenhouse Gas Balances of Cassava-based Ethanol. Biomass Bioenergy 2013, 51, 125–135. [Google Scholar] [CrossRef]
- Rose, S.K.; Lee, H.L. Non-CO2 Greenhouse Gas Emissions Data for Climate Change Economic Analysis. In Economic Analysis of Land Use in Global Climate Change Policy; Hertel, T.W., Rose, S.K., Tol, R., Eds.; Routledge: London, UK, 2009. [Google Scholar]
Figure 1.
Environmental impact of mega-FTAs on GHG emissions (Mt CO2 equivalent). Source: Authors’ estimation.
Figure 1.
Environmental impact of mega-FTAs on GHG emissions (Mt CO2 equivalent). Source: Authors’ estimation.

Table 1.
Previous studies.
| Authors | Type of CGE Model | TPP Scenario | Results |
|---|---|---|---|
| Burfisher et al. [6] | Static GTAP model, solved with macro-projections and trade policy updates to 2025, V8 (2007) GTAP database | Tariff elimination | Changes in real 2025 GDP compared with baseline range from 0% to 0.1% (Vietnam). Total agricultural exports and imports increase for all TPP members. Farm sector outputs decrease in Japan and increase in Australia, New Zealand and the US. |
| Cheong [7] | Recursive dynamic GTAP model, solved over 2013-27 baseline, V8 (2007) GTAP database | Tariff elimination | Changes in 2027 GDP compared with baseline range from -0.13% (Chile) to 0.97% (New Zealand). |
| Kawasaki [8] | Static GTAP CGE model with capital accumulation and endogenous productivity growth, V8 (2007) GTAP database updated to 2010 | Tariff elimination and 50 percent reduction in NTBs on preferred partners and 25 percent NTB reduction on rest of world | Changes in welfare as percent of real GDP range from 0.1% (US) to 9.9% (Vietnam) with tariff removal; with tariff and NTB removal, range from 0.8% (US) to 20.6% (Malaysia). |
| Itakura and Lee [9] | Recursive dynamic GTAP, solved over 2004-30, V7 (2004) GTAP database | Tariff elimination and 25 percent reduction in NTBs, includes TPP plus an East Asian and an Asia-Pacific trade area (TPP includes South Korea) | Changes in 2030 welfare compared with baseline range from 0.8% (US) to 5.6% (Vietnam). |
| Lee and Itakura [10] | Recursive dynamic GTAP, solved over 2007-30, V8.1 (2007) GTAP database | Tariff elimination and 20 percent reduction in NTBs, rice is excluded from tariff elimination, includes RCEP, enlarged TPP, and TPP plus FTAAP scenario | Changes in 2030 welfare compared with baseline range from 0.15% (US) to 2.66% (Vietnam). Japan's farm sector outputs decrease. |
| Petri et al. [11] | Static CGE model with Melitz firm heterogeneity, and with foreign direct investment flows, solved sequentially over 2010-25, preliminary GTAP V8 (2007) database | Partial removal of tariffs and NTBs, endogenous changes in foreign direct investment (TPP includes South Korea) | Changes in 2025 GDP compared with baseline range from 0.4% (US) to 13.6% (Vietnam). Changes in 2025 exports range from 2.5% (Chile) to 37.3% (Vietnam). |
| Areerat et al. [12] | Static GTAP model, V7 (2004) GTAP database | Tariff elimination (TPP does not include Malaysia, Mexico and Canada) | Change in GDP range from −0.03% (Peru) to 0.49% (Vietnam) (TPP+J scenario). |
Table 2.
Regions and sectors.
| Region | Sector | Sector | |||
|---|---|---|---|---|---|
| 1 | Japan | 1 | Paddy rice | 30 | Wood products |
| 2 | Korea | 2 | Wheat | 31 | Paper products, publishing |
| 3 | China | 3 | Cereal grains nec | 32 | Petroleum, coal products |
| 4 | Indonesia | 4 | Vegetables, fruit, nuts | 33 | Chemical, rubber, plastic prods |
| 5 | Malaysia | 5 | Oil seeds | 34 | Mineral products nec |
| 6 | Philippines | 6 | Sugar cane, sugar beet | 35 | Ferrous metals |
| 7 | Singapore | 7 | Plant-based fibers | 36 | Metals nec |
| 8 | Thailand | 8 | Crops nec | 37 | Metal products |
| 9 | Vietnam | 9 | Cattle, sheep, goats, horses | 38 | Motor vehicles and parts |
| 10 | Cambodia | 10 | Animal products nec | 39 | Transport equipment nec |
| 11 | Laos | 11 | Raw milk | 40 | Electronic equipment |
| 12 | Other ASEAN | 12 | Wool, silkworm cocoons | 41 | Machinery and equipment nec |
| 13 | India | 13 | Forestry | 42 | Manufactures nec |
| 14 | Australia | 14 | Fishing | 43 | Electricity |
| 15 | New Zealand | 15 | Coal | 44 | Gas manufacture, distribution |
| 16 | United States | 16 | Oil | 45 | Water |
| 17 | Canada | 17 | Gas | 46 | Construction |
| 18 | Mexico | 18 | Minerals nec | 47 | Trade |
| 19 | Peru | 19 | Meat: cattle, sheep, goats, horse | 48 | Transport nec |
| 20 | Chile | 20 | Meat products nec | 49 | Sea transport |
| 21 | Hong Kong | 21 | Vegetable oils and fats | 50 | Air transport |
| 22 | Taiwan | 22 | Dairy products | 51 | Communication |
| 23 | Russia | 23 | Processed rice | 52 | Financial services nec |
| 24 | EU27 | 24 | Sugar | 53 | Insurance |
| 25 | ROW1 | 25 | Food products nec | 54 | Business services nec |
| 26 | ROW2 | 26 | Beverages and tobacco products | 55 | Recreation and other services |
| 27 | Textiles | 56 | PubAdmin/Defence/Health/Educat | ||
| 28 | Wearing apparel | 57 | Dwellings | ||
| 29 | Leather products |
Notes: Other ASEAN includes Brunei, Myanmar, and Timor-Leste. ROW1 includes the rest of Asian economies. ROW2 includes the rest of the world.
Table 3.
GHG emissions by region (Mt CO2 equivalent) in 2007.
| Region | Non-CO2 GHGs | All Non-CO2 | CO2 | All GHGs | ||
|---|---|---|---|---|---|---|
| CH4 | N2O | F-Gas | ||||
| TPP members | 1204 | 640 | 248 | 2092 | 8498 | 10,590 |
| Japan | 18 | 31 | 40 | 89 | 1071 | 1161 |
| Malaysia | 59 | 5 | 1 | 65 | 183 | 249 |
| Singapore | 11 | 10 | 0 | 21 | 64 | 85 |
| Vietnam | 69 | 12 | 0 | 81 | 92 | 173 |
| Other ASEAN | 76 | 21 | 0 | 97 | 21 | 118 |
| Australia | 112 | 25 | 6 | 143 | 381 | 524 |
| New Zealand | 27 | 12 | 1 | 40 | 35 | 75 |
| United States | 537 | 420 | 172 | 1129 | 5583 | 6712 |
| Canada | 96 | 54 | 13 | 163 | 557 | 721 |
| Mexico | 169 | 18 | 14 | 202 | 406 | 608 |
| Peru | 18 | 23 | 0 | 42 | 30 | 72 |
| Chile | 11 | 8 | 0 | 20 | 73 | 93 |
| Korea | 35 | 9 | 12 | 55 | 423 | 478 |
| China | 868 | 839 | 150 | 1857 | 5269 | 7126 |
| Indonesia | 213 | 43 | 0 | 257 | 360 | 617 |
| Philippines | 41 | 12 | 1 | 54 | 72 | 126 |
| Thailand | 90 | 26 | 1 | 117 | 226 | 343 |
| Cambodia | 23 | 18 | 0 | 41 | 5 | 46 |
| Laos | 10 | 7 | 0 | 18 | 1 | 19 |
| India | 504 | 80 | 13 | 596 | 1304 | 1900 |
| Hong Kong | 1 | 0 | 0 | 1 | 80 | 81 |
| Taiwan | 13 | 9 | 8 | 30 | 258 | 288 |
| Russia | 333 | 55 | 23 | 411 | 1424 | 1834 |
| EU27 | 434 | 375 | 64 | 873 | 4033 | 4906 |
| ROW1 | 244 | 92 | 1 | 337 | 275 | 612 |
| ROW2 | 2360 | 1045 | 62 | 3467 | 4296 | 7763 |
| World | 6373 | 3248 | 584 | 10,205 | 26,524 | 36,729 |
Notes: GTAP 8.1 CO2 emissions database and non-CO2 emissions database. Other ASEAN includes Brunei, Myanmar, and Timor-Leste. ROW1 includes the rest of Asian economies. ROW2 includes the rest of the world.
Table 4.
Economic impact of the TPP (%).
| Region | Real GDP | Total Export | Total Import |
|---|---|---|---|
| TPP members | 0.06 | 1.33 | 1.56 |
| Japan | 0.20 | 1.78 | 3.10 |
| Malaysia | 0.38 | 1.30 | 3.18 |
| Singapore | 0.01 | 0.57 | 0.79 |
| Vietnam | 1.39 | 10.55 | 15.22 |
| Other ASEAN | 0.07 | 1.23 | 2.60 |
| Australia | 0.00 | 0.76 | 1.96 |
| New Zealand | 0.06 | 0.13 | 2.70 |
| United States | −0.00 | 0.80 | 0.53 |
| Canada | 0.18 | 2.36 | 2.02 |
| Mexico | 0.04 | 0.68 | 1.05 |
| Peru | −0.00 | 2.78 | 5.52 |
| Chile | 0.02 | 0.12 | 0.38 |
| Korea | −0.02 | 0.07 | −0.19 |
| China | −0.03 | −0.12 | −0.31 |
| Indonesia | −0.01 | −0.09 | −0.45 |
| Philippines | −0.02 | 0.14 | −0.06 |
| Thailand | −0.06 | 0.01 | −0.51 |
| Cambodia | −0.09 | 0.46 | −1.15 |
| Laos | −0.00 | 0.14 | 0.12 |
| India | −0.01 | 0.07 | −0.19 |
| Hong Kong | −0.00 | 0.05 | −0.09 |
| Taiwan | −0.01 | −0.10 | −0.27 |
| Russia | 0.01 | 0.02 | 0.01 |
| EU27 | −0.00 | 0.08 | −0.07 |
| ROW1 | −0.01 | −0.01 | −0.45 |
| ROW2 | −0.00 | −0.00 | −0.12 |
Notes: Other ASEAN includes Brunei, Myanmar, and Timor-Leste. ROW1 includes the rest of Asian economies. ROW2 includes the rest of the world.
Table 5.
Impact on sectoral outputs (%).
| Sector | Japan | Australia | New Zealand | United States | China | India | EU |
|---|---|---|---|---|---|---|---|
| Paddy rice | −37.30 | 193.46 | 17.49 | 56.41 | −0.21 | 0.09 | 0.02 |
| Wheat | −77.55 | −0.95 | −0.02 | 2.19 | −0.08 | −0.11 | 0.24 |
| Cereal grains nec | −8.64 | 7.50 | 1.47 | 0.40 | −0.43 | 0.01 | −0.10 |
| Vegetables, fruit, nuts | 0.01 | −0.76 | −1.69 | −0.01 | −0.15 | 0.02 | 0.12 |
| Oil seeds | 5.42 | −2.10 | −6.40 | −0.80 | 0.40 | 0.07 | 0.15 |
| Sugar cane, sugar beet | −3.59 | 3.22 | 0.24 | −1.70 | −0.16 | −0.03 | −0.04 |
| Plant-based fibers | 23.34 | −3.07 | −2.37 | −1.15 | 0.04 | 0.07 | 0.26 |
| Crops nec | −6.30 | −2.40 | −6.23 | 2.36 | −0.83 | −0.22 | 0.02 |
| Cattle,sheep,goats,horses | −18.51 | 9.24 | −2.55 | 0.46 | −0.18 | −0.01 | 0.03 |
| Animal products nec | −6.15 | −2.37 | −3.99 | 2.66 | −0.45 | −0.04 | −0.48 |
| Raw milk | −23.86 | 1.00 | 12.66 | 0.85 | 0.25 | −0.02 | −0.18 |
| Wool, silkworm cocoons | 0.82 | −3.93 | −6.48 | 0.22 | 1.94 | 0.42 | 5.65 |
| Forestry | −0.35 | −0.22 | −1.18 | −0.01 | 0.24 | 0.14 | 0.08 |
| Fishing | 0.62 | 0.42 | 1.53 | 0.27 | −0.13 | −0.03 | −0.01 |
| Coal | −0.18 | −0.12 | −0.70 | −0.00 | 0.08 | 0.09 | 0.05 |
| Oil | −0.27 | −0.06 | −0.60 | 0.02 | 0.08 | 0.11 | 0.09 |
| Gas | −0.41 | −0.23 | −0.81 | −0.04 | 0.03 | 0.07 | 0.03 |
| Minerals nec | 0.25 | −0.51 | −0.58 | −0.01 | 0.14 | 0.18 | 0.01 |
| Meat: cattle,sheep,goats,horse | −22.73 | 11.07 | −3.36 | 0.53 | −0.24 | −0.48 | 0.32 |
| Meat products nec | −11.00 | −1.88 | −4.34 | 4.60 | −1.83 | −0.51 | −0.70 |
| Vegetable oils and fats | 1.07 | −2.30 | −0.40 | 0.47 | 0.14 | 0.07 | 0.03 |
| Dairy products | −31.39 | 0.96 | 15.05 | 0.88 | 0.25 | −0.06 | −0.20 |
| Processed rice | −23.45 | 36.58 | −0.61 | 63.81 | −0.47 | −0.01 | −0.05 |
| Sugar | −3.53 | 12.17 | 0.26 | −1.94 | −0.16 | −0.03 | −0.07 |
| Food products nec | 1.70 | 1.31 | 3.00 | 0.71 | −0.44 | −0.19 | −0.12 |
| Beverages and tobacco products | 0.80 | 0.53 | −0.12 | 0.09 | −0.02 | −0.03 | −0.03 |
| Textiles | 20.76 | −0.29 | −3.91 | −0.96 | −0.19 | −0.33 | −0.18 |
| Wearing apparel | 1.19 | 0.42 | −2.13 | −1.93 | −0.94 | −1.52 | −0.30 |
| Leather products | 5.06 | −0.70 | −4.79 | 0.39 | −0.90 | 0.12 | −0.28 |
| Wood products | −0.58 | −0.28 | −0.86 | −0.03 | 0.20 | 0.13 | 0.12 |
| Paper products, publishing | −0.08 | −0.06 | −1.66 | 0.04 | 0.12 | 0.02 | 0.02 |
| Petroleum, coal products | 0.36 | −0.29 | −0.02 | −0.00 | −0.06 | −0.02 | 0.03 |
| Chemical,rubber,plastic prods | 0.52 | −1.05 | −1.19 | −0.04 | 0.17 | 0.00 | 0.04 |
| Mineral products nec | 0.47 | 0.30 | −0.19 | −0.07 | 0.02 | −0.06 | −0.05 |
| Ferrous metals | 1.71 | −1.01 | −5.33 | −0.36 | −0.01 | −0.03 | −0.07 |
| Metals nec | 0.53 | −1.60 | −7.07 | −0.19 | 0.38 | 0.36 | 0.24 |
| Metal products | 0.54 | −0.24 | −2.78 | −0.18 | 0.08 | −0.02 | −0.02 |
| Motor vehicles and parts | 3.59 | −7.59 | −6.77 | −0.58 | −0.19 | −0.05 | −0.17 |
| Transport equipment nec | 0.08 | −0.63 | −1.32 | −0.17 | 0.13 | 0.19 | 0.13 |
| Electronic equipment | −1.09 | −1.00 | −2.95 | 0.11 | 0.69 | 0.35 | 0.50 |
| Machinery and equipment nec | −0.70 | −0.97 | −5.47 | −0.19 | 0.27 | 0.11 | 0.13 |
| Manufactures nec | 0.46 | −0.10 | −1.26 | −0.00 | 0.20 | 0.12 | −0.00 |
| Electricity | 0.20 | −0.34 | −0.85 | −0.01 | 0.05 | −0.00 | 0.00 |
| Gas manufacture, distribution | −0.32 | −0.56 | −0.86 | −0.01 | 0.06 | 0.02 | 0.10 |
| Water | 0.03 | −0.04 | 0.26 | 0.00 | 0.03 | 0.01 | −0.00 |
| Construction | 0.35 | 0.71 | 1.07 | −0.01 | −0.09 | −0.10 | −0.14 |
| Trade | 0.19 | −0.08 | −0.05 | −0.00 | 0.05 | −0.03 | 0.01 |
| Transport nec | −0.11 | 0.06 | −1.11 | 0.01 | 0.03 | −0.02 | 0.05 |
| Sea transport | −0.04 | −0.17 | −1.13 | 0.24 | 0.31 | 0.57 | 0.52 |
| Air transport | −0.62 | −0.58 | −1.07 | 0.00 | 0.25 | 0.13 | 0.12 |
| Communication | 0.08 | −0.12 | −0.38 | −0.01 | 0.02 | 0.09 | 0.04 |
| Financial services nec | 0.05 | −0.09 | 0.14 | −0.01 | 0.05 | 0.02 | 0.06 |
| Insurance | −0.18 | −0.19 | −0.44 | −0.02 | 0.07 | 0.07 | 0.05 |
| Business services nec | 0.06 | −0.14 | −0.33 | −0.00 | 0.03 | 0.24 | 0.01 |
| Recreation and other services | 0.06 | −0.23 | −0.52 | −0.01 | 0.00 | 0.13 | 0.02 |
| PubAdmin/Defence/Health/Educat | 0.08 | −0.13 | 0.16 | −0.01 | −0.06 | −0.02 | −0.00 |
| Dwellings | 0.07 | −0.09 | 0.34 | −0.02 | −0.06 | −0.04 | −0.01 |
Table 6.
Environmental impact of TPP (Mt CO2 equivalent, %).
| Region | CO2 | Non-CO2 | GHG | |||
|---|---|---|---|---|---|---|
| TPP members | 2.99 | (0.04) | 14.80 | (0.71) | 17.79 | (0.17) |
| Japan | 2.38 | (0.22) | −5.97 | (−6.70) | −3.59 | (−0.31) |
| Malaysia | 0.14 | (0.07) | 0.30 | (0.45) | 0.43 | (0.17) |
| Singapore | 0.41 | (0.64) | 0.09 | (0.45) | 0.51 | (0.60) |
| Vietnam | 1.04 | (1.13) | 0.64 | (0.79) | 1.68 | (0.97) |
| Other ASEAN | −0.05 | (−0.26) | 0.65 | (0.67) | 0.60 | (0.51) |
| Australia | −0.98 | (−0.26) | 7.05 | (4.93) | 6.08 | (1.16) |
| New Zealand | −0.18 | (−0.51) | 1.55 | (3.91) | 1.37 | (1.83) |
| United States | 0.64 | (0.01) | 8.38 | (0.74) | 9.03 | (0.13) |
| Canada | 0.19 | (0.03) | −0.13 | (−0.08) | 0.06 | (0.01) |
| Mexico | −0.45 | (−0.11) | 2.09 | (1.04) | 1.64 | (0.27) |
| Peru | −0.17 | (−0.56) | 0.02 | (0.04) | −0.15 | (−0.21) |
| Chile | 0.02 | (0.02) | 0.12 | (0.62) | 0.14 | (0.15) |
| Korea | −0.04 | (−0.01) | 0.10 | (0.18) | 0.06 | (0.01) |
| China | 2.76 | (0.05) | −1.75 | (−0.09) | 1.01 | (0.01) |
| Indonesia | −0.06 | (−0.02) | 1.13 | (0.44) | 1.07 | (0.17) |
| Philippines | −0.03 | (−0.04) | 0.19 | (0.35) | 0.16 | (0.12) |
| Thailand | 0.19 | (0.09) | −0.07 | (−0.06) | 0.12 | (0.03) |
| Cambodia | −0.00 | (−0.05) | 0.01 | (0.03) | 0.01 | (0.02) |
| Laos | 0.00 | (0.11) | −0.01 | (−0.03) | −0.00 | (−0.02) |
| India | 0.37 | (0.03) | −0.04 | (−0.01) | 0.34 | (0.02) |
| Hong Kong | 0.07 | (0.08) | 0.00 | (0.06) | 0.07 | (0.08) |
| Taiwan | −0.40 | (−0.16) | 0.03 | (0.11) | −0.37 | (−0.13) |
| Russia | −0.29 | (−0.02) | 0.07 | (0.02) | −0.22 | (−0.01) |
| EU27 | 0.71 | (0.02) | −0.05 | (−0.01) | 0.66 | (0.01) |
| ROW1 | 0.24 | (0.09) | 0.18 | (0.05) | 0.42 | (0.07) |
| ROW2 | 0.10 | (0.00) | 1.58 | (0.05) | 1.68 | (0.02) |
| World | 6.62 | (0.02) | 16.17 | (0.16) | 22.79 | (0.06) |
Notes: Figures in parentheses are percentage deviations from the initial period. Other ASEAN includes Brunei, Myanmar, and Timor-Leste. ROW1 includes the rest of Asian economies. ROW2 includes the rest of the world.
Table 7.
Most affected sectors by country for GHG emissions (Mt CO2 equivalent, %).
| Japan | CO2 | CH4 | N2O | |||||
| Electricity | 0.90 | (0.20) | Paddy rice | −1.36 | (−23.38) | Paddy rice | −0.91 | (−37.30) |
| Ferrous metals | 0.87 | (1.72) | Raw milk | −0.83 | (−25.93) | Animal products nec | −0.61 | (−8.14) |
| CRP | 0.29 | (0.55) | Cattle, sheep, goats, horses | −0.70 | (−20.60) | Cattle, sheep, goats, horses | −0.50 | (−20.52) |
| Dairy products | −0.25 | (−31.39) | Animal products nec | −0.05 | (−8.24) | Raw milk | −0.45 | (−25.81) |
| Paddy rice | −0.23 | (−37.30) | PADHE | 0.00 | (0.08) | Crops nec | −0.12 | (−6.30) |
| Australia | CO2 | CH4 | N2O | |||||
| Electricity | −0.71 | (−0.34) | Cattle, sheep, goats, horses | 6.24 | (9.76) | Cattle, sheep, goats, horses | 0.62 | (8.67) |
| Metals nec | −0.22 | (−1.59) | Raw milk | 0.13 | (1.87) | Cereal grains nec | 0.09 | (7.50) |
| Air transport | −0.11 | (−0.57) | Paddy rice | 0.12 | (142.98) | Paddy rice | 0.09 | (193.46) |
| CRP | −0.05 | (−1.06) | Coal | −0.03 | (−0.12) | Raw milk | 0.03 | (1.26) |
| Minerals nec | −0.04 | (−0.50) | Animal products nec | −0.02 | (−1.69) | Crops nec | −0.03 | (−2.40) |
| New Zealand | CO2 | CH4 | N2O | |||||
| Air transport | −0.11 | (−1.06) | Raw milk | 1.35 | (14.07) | Raw milk | 0.65 | (13.44) |
| Electricity | −0.06 | (−0.85) | Cattle, sheep, goats, horses | −0.27 | (−1.81) | Cattle,sheep,goats,horses | −0.11 | (−1.92) |
| Transport nec | −0.05 | (−1.10) | Animal products nec | −0.01 | (−3.32) | Vegetables, fruit, nuts | −0.01 | (−1.69) |
| Dairy products | 0.04 | (15.05) | Coal | −0.00 | (−0.70) | Animal products nec | −0.01 | (−3.84) |
| Raw milk | 0.02 | (12.66) | Gas manufacture, distribution | −0.00 | (−0.86) | Crops nec | −0.00 | (−6.23) |
| United States | CO2 | CH4 | N2O | |||||
| Paddy rice | 0.52 | (56.41) | Paddy rice | 2.85 | (44.89) | Paddy rice | 1.61 | (56.41) |
| Electricity | −0.26 | (−0.01) | Cattle, sheep, goats, horses | 0.82 | (0.90) | Animal products nec | 0.71 | (2.84) |
| Food products nec | 0.21 | (0.71) | Animal products nec | 0.75 | (3.26) | Cereal grains nec | 0.47 | (0.40) |
| Meat products nec | 0.18 | (4.60) | Raw milk | 0.55 | (1.32) | Cattle,sheep,goats,horses | 0.39 | (0.82) |
| Processed rice | 0.15 | (63.81) | PADHE | −0.01 | (−0.01) | Wheat | 0.34 | (2.19) |
| China | CO2 | CH4 | N2O | |||||
| Electricity | 2.20 | (0.07) | Cattle, sheep, goats, horses | −0.49 | (−0.27) | Animal products nec | −0.63 | (−0.55) |
| CRP | 0.32 | (0.18) | Coal | 0.18 | (0.08) | Vegetables, fruit, nuts | −0.56 | (−0.15) |
| Sea transport | 0.30 | (0.31) | Animal products nec | −0.15 | (−0.56) | Cereal grains nec | −0.16 | (−0.43) |
| Metals nec | 0.16 | (0.39) | PADHE | −0.10 | (−0.06) | Cattle, sheep, goats, horses | −0.14 | (−0.26) |
| Mineral products nec | 0.15 | (0.04) | Paddy rice | −0.04 | (−0.02) | Paddy rice | −0.13 | (−0.21) |
| India | CO2 | CH4 | N2O | |||||
| Electricity | 0.45 | (0.06) | Paddy rice | 0.09 | (0.10) | Crops nec | −0.03 | (−0.22) |
| Transport nec | −0.02 | (−0.02) | Cattle, sheep, goats, horses | −0.07 | (−0.03) | Wheat | −0.01 | (−0.11) |
| Metals nec | 0.01 | (0.40) | PADHE | −0.02 | (−0.02) | Raw milk | −0.00 | (−0.04) |
| Textiles | −0.01 | (−0.30) | Coal | 0.02 | (0.09) | Oil seeds | 0.00 | (0.07) |
| Trade | 0.01 | (0.03) | Raw milk | −0.01 | (−0.04) | Cattle, sheep, goats, horses | −0.00 | (−0.03) |
| EU27 | CO2 | CH4 | N2O | |||||
| Sea transport | 0.75 | (0.52) | Animal products nec | −0.21 | (−0.50) | Animal products nec | −0.09 | (−0.49) |
| Transport nec | 0.38 | (0.05) | Raw milk | −0.13 | (−0.19) | Wheat | 0.07 | (0.24) |
| Air transport | 0.24 | (0.12) | Cattle, sheep, goats, horses | 0.03 | (0.03) | Raw milk | −0.04 | (−0.19) |
| Mineral products nec | −0.06 | (−0.06) | Gas manufacture, distribution | 0.02 | (0.10) | Cereal grains nec | −0.03 | (−0.10) |
| Ferrous metals | −0.05 | (−0.07) | Coal | 0.02 | (0.05) | Vegetables, fruit, nuts | 0.03 | (0.12) |
Notes: Figures in parentheses are percentage deviations from the initial period. CRP stands for Chemical, rubber, plastic products. PADHE stands for PubAdmin/Defence/Health/Educat.
Table 8.
Changes in emission intensity indices (emissions per unit of GDP) of GHG emissions (%).
| Region | CO2 | Non-CO2 | GHG |
|---|---|---|---|
| TPP members | −0.02 | 0.65 | 0.11 |
| Japan | 0.03 | −6.88 | −0.50 |
| Malaysia | −0.30 | 0.08 | −0.20 |
| Singapore | 0.63 | 0.44 | 0.58 |
| Vietnam | −0.25 | −0.59 | −0.41 |
| Other ASEAN | −0.32 | 0.60 | 0.44 |
| Australia | −0.26 | 4.92 | 1.16 |
| New Zealand | −0.58 | 3.85 | 1.77 |
| United States | 0.01 | 0.74 | 0.13 |
| Canada | −0.14 | −0.25 | −0.17 |
| Mexico | −0.16 | 0.99 | 0.23 |
| Peru | −0.56 | 0.05 | −0.21 |
| Chile | 0.01 | 0.60 | 0.13 |
Note: Other ASEAN includes Brunei, Myanmar, and Timor-Leste.
© 2017 by the authors. Licensee MDPI, Basel, Switzerland. This article is an open access article distributed under the terms and conditions of the Creative Commons Attribution (CC BY) license (http://creativecommons.org/licenses/by/4.0/).
Share and Cite
MDPI and ACS Style
Akahori, H.; Sawauchi, D.; Yamamoto, Y. Measuring the Changes of Greenhouse Gas Emissions Caused by the Trans-Pacific Partnership. Sustainability 2017, 9, 715. https://doi.org/10.3390/su9050715
AMA Style
Akahori H, Sawauchi D, Yamamoto Y. Measuring the Changes of Greenhouse Gas Emissions Caused by the Trans-Pacific Partnership. Sustainability. 2017; 9(5):715. https://doi.org/10.3390/su9050715
Chicago/Turabian StyleAkahori, Hirokazu, Daisuke Sawauchi, and Yasutaka Yamamoto. 2017. "Measuring the Changes of Greenhouse Gas Emissions Caused by the Trans-Pacific Partnership" Sustainability 9, no. 5: 715. https://doi.org/10.3390/su9050715
Note that from the first issue of 2016, this journal uses article numbers instead of page numbers. See further details here.