
Regional Disparities in Emissions of Rural Household Energy Consumption: A Case Study of Northwest China

College of Urban and Environmental Science, Northwest University, Xi’an 710127, China
*
Author to whom correspondence should be addressed.
Sustainability 2017, 9(5), 726; https://doi.org/10.3390/su9050726
Submission received: 16 March 2017
/
Revised: 13 April 2017
/
Accepted: 27 April 2017
/
Published: 3 May 2017
(This article belongs to the Special Issue Sustainable Energy Policy and Policy Implications—Good Examples and Critical Reflections)
Abstract
:The purpose of this paper is to present the emissions status of multiple rural areas from the perspective of a field survey and make up for the defects of the traditional emission cognition of single type of area. The basic data in the lower reaches of the Weihe River of Northwest China were collected through household questionnaire surveys, and emissions from rural household energy consumption were calculated in the paper. In addition, the grey relational analysis method was used to identify influential factors of emission disparities. The results show that the total emissions of the plain, loess tableland, and Qinling piedmont areas are 1863.20, 1850.43, and 2556.68 kg, respectively. Regional disparities in emissions of rural household energy consumption vary greatly. CO2 emissions are highest in the Qinling piedmont area, followed by the loess tableland area. For other emissions, there is no fixed order of the three areas, which suggests that disparities in emissions are connected with the dominant type of energy consumption. Diversification of energy use might not necessarily produce higher emissions, but the traditional biomass energy pattern does generate more emissions. The regional supply capacity of household energy is the original influence factor of disparities in emissions, and factors that influence these disparities are directly related to differences among farmers, followed by the age structure, educational background, income level, occupation, and so on.
1. Introduction
As one of the countries with the greatest energy consumption and emissions, it is important to study the emissions from rural household energy consumption to achieve sustainable development in China. Along with improvements in living standards, the rural population, accounting for a proportion of 43.90% of the country in 2015, has shown an increasing demand for and consumption of household energy in China, which is becoming an important component of national energy consumption [1,2]. Due to the vast territory and the differences among regional environmental conditions, economic development, production methods and lifestyles, rural households have quite different energy use habits, supply capacity, availability, and choice preferences. Thus it is difficult to determine a unified energy use pattern. Diverse household energy structures and emissions naturally form under different man-land relationships. By fully realizing and understanding the emissions disparities of energy consumption among different types of rural areas and by discussing the influential factors, the relationships between rural economic development, energy consumption, and environmental protection can be addressed better, and a reference might be further provided for a regional policy design for rational energy use, energy conservation, emissions reductions, and environmental management.
It has been found that carbon emissions from the energy use of urban and rural residents in China have been increasing every year [3,4,5]. The total CO2 emissions from rural residential energy consumption showed a significant increase from 152.2 million tons in 2001 to 283.6 million tons in 2008, and the annual growth rate of per capita CO2 emissions was nearly two times faster than that of urban areas [6]. In the future, total rural CO2 emissions will gradually increase [2], and commercial fuel use is estimated to rise to 220 Mtce (181 Mtce of biomass), with a total energy demand of 401 Mtce, which will emit 137.5 Mt-C (i.e., 504 Mt CO2) by 2030, triple the amount of the 1990 base year [7]. Of course, it should be recognized that the contribution of rural households to the overall primary energy and greenhouse gas (GHG) emissions accounts for a small percent of the total. For example, the CO2 emissions of China varied from about 1000 million tons in 2001 to more than 2000 million tons in 2008 [8], the amount and growth of which were much larger than those of rural household energy consumption during the same period, but this contribution still plays an important role in the effects on the environment [9]. As for the influence factors of rural emission characteristics, empirical analysis or some specific explanatory variables and an econometric model are often presented according to different purposes and needs. Growth in income and changes in lifestyle are considered to be the two key factors affecting rural household energy consumption and CO2 emissions [10,11]. The energy ecological footprint and indirect carbon emissions in rural household consumption are positively influenced by the Engel coefficient, energy intensity, and tertiary industry proportion, while negatively influenced by urbanization level and per capita income in which the improved STIRPAT (Stochastic Impacts by Regression on Population, Affluence and Technology) model was used to empirically study their influences [12]. Furthermore, household carbon emissions are positively correlated with the average age of household members, the average number of years of education of household members, household income level, household size, and the ownership of an air conditioner; a total of 165 valid rural questionnaires and a double-logarithmic regression analyses were used to investigate the potential factors affecting the aggregate CO2 emissions of rural households [13]. Wood consumption is considered to be the main source of CO2 and NOx emissions [14] and is coincident with the research results showing that carbon emissions are mainly from traditional biomass energy combustion, such as straw stalks and firewood, rather than from commercial energy consumption [15,16]. However, along with increasing commercial energy consumption, both in the absolute amount and the relative proportion, CO2 emissions from rural households also rose rapidly [17]. The use of clean energy such as biogas, solar energy, and hydrokinetic energy in rural areas might replace and thus reduce the quantity of self-produced biomass and coal, which greatly reduce the amount of solid and gaseous emissions [16,18,19]. In addition, regional disparities in emissions in energy consumption are very significant, and both total and per capita CO2 emissions are obviously higher in North China, which is largely due to the colder climate and the relatively high economic development levels for multi-demands of energy utilization [9].
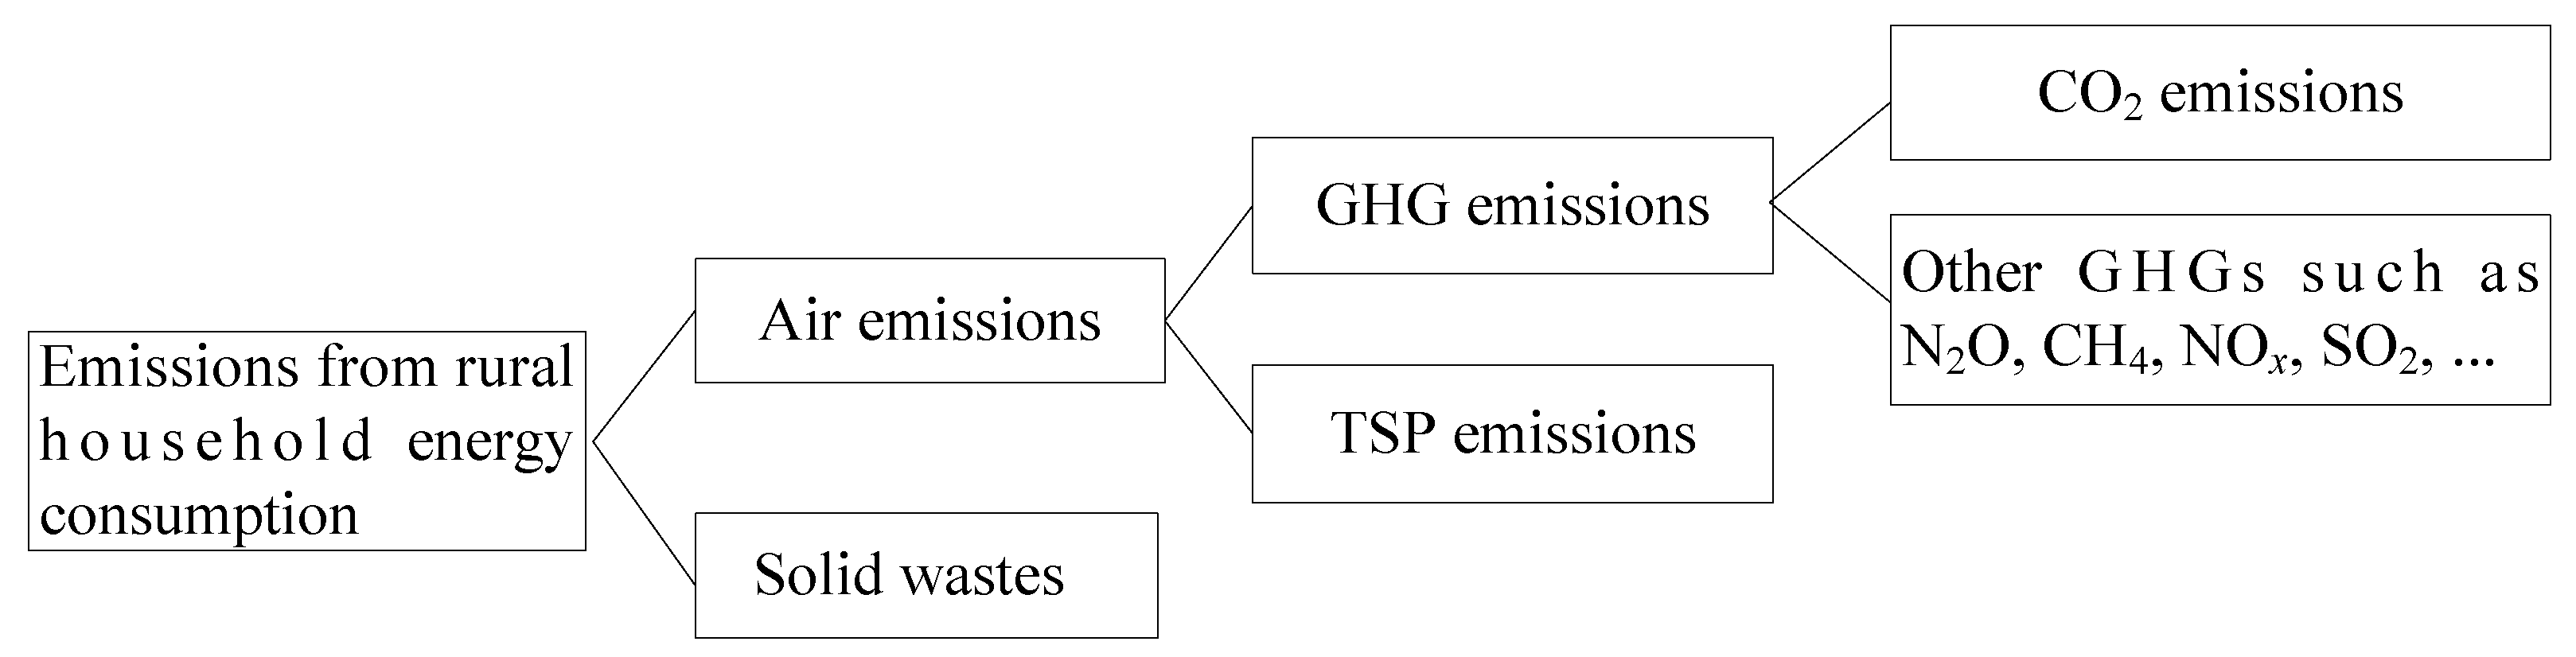
As a whole, the emissions from rural household energy consumption include air emissions and solid wastes. Solid wastes, which mainly derive from the combustion of coal and honeycomb briquettes, are often dumped due to the lack of proper garbage disposal sites, negatively impacting the environment. Air emissions consist of GHG and total suspended particulates (TSP), which are smaller than 100 μm in diameter. Additionally, inhalable particles can cause serious indoor air pollution and do harm to the health of residents such as housewives, elderly people, and children who stay indoors for long periods of time [20]. Other than CO2, methane (CH4), nitrogen oxide (NOx), nitrous oxide (N2O), and sulfur dioxide (SO2) are also influential GHGs (Figure 1). In China, energy-related CH4 emissions are estimated to have risen from 6586.9 Gg in 1980 to 21,943.1 Gg in 2007, with an average annual increase of 4.7% [21]; CO2, SO2, and NOx emissions from household energy consumption indicate that there are two peaks, occurring in winter and summer, due to energy demands for heating and cooling, respectively [22]. Energy consumption is dominated by fossil energy, especially heating by coal-fired stoves, which causes heavy air pollution in winter [23]. In fact, the emissions characteristics also depend on the type of stove used, and the emission ratios of CO-to-CO2 and NOx-to-CO2 are higher for cookstoves than for kangs, implying that kangs have higher combustion efficiency [24]. A kang is a traditional rural Chinese bed made of earth bricks and can be heated by biomass fuels, coal, and electric stoves [25].
Above all, scholars have mainly focused on the temporal scale and trends of rural household energy emissions, but little attention has been paid to investigating variations in energy emissions in different types of areas from a spatial perspective, making it difficult to provide reasonable regional guidance for the low-emission mode and a scientific basis for national and local governments to make further management policies for rural household energy consumption. Studies of regional disparities in air pollutants and GHG emissions were considerably conducted on the economic and industrial energy consumption of province-level units and paid little attention to the rural energy consumption [26,27,28,29,30]. Meanwhile, data from previous studies are mainly derived from macroscopic statistics and not enough from detailed field investigation. Based on these findings, the authors intend to select the Linwei District, located in the lower reaches of the Weihe River, as the study area to discuss the spatial disparities in emissions from a microscopic survey data of rural household energy consumption in different regions and to fill such a research gap. It is fairly typical to choose this area for studying energy disparities in emissions because there are remarkably different natural conditions, economic levels, and production and living conditions within it. The goal of this paper is to highlight the disparities in emissions of rural household energy consumption in different types of areas and to provide a scientific basis to strengthen the construction of rural energy and improve the living standards of farmers. The results will contribute to an examination of the details of the actual state of fuel consumption in rural households as a background to the macro-level analysis and also help us better develop policies to save energy and reduce emissions in rural areas.
2. Materials
The basic situation of the study area is introduced. Surveys and the data collection on the household consumption of straw, firewood, coal, and so on are conducted in the regions, and different types of rural household energy consumption in one year are counted. Moreover, the energy consumption is converted into a unified unit, standard coal equivalent.
2.1. Study Area
The lower reaches of the Weihe River originate in Xianyang City, flow through Xi’an City and Weinan City, and eventually flow into the Yellow River in Tongguan County and are the core belt of Shaanxi Province of northwest China, playing a supporting and leading role in the economic development of the whole province and even all of Western China. However, it is also a fragile area in terms of its ecology and the environment. Linwei District (34°14′18″ N~34°47′54″ N, 109°22′54″ E~109°45′52″ E) is part of Weinan City and covers a total area of 1221 km2. The southern terrain is higher than the northern terrain, and the Weihe River flows across the central part from west to east. The plain area lies to the north of the Weihe River, and the loess tableland and Qinling piedmont areas are located to the south. The district belongs to the warm temperate zone with a semi-humid continental monsoon climate, in which winter is cold and dry and summer is hot with frequent droughts. The annual mean temperature is 13.6 °C, the annual average precipitation is 555.8 mm, and the annual average sunshine hours are 2276.4 h. The land resources are abundant in the district, and the forest area reaches 26.32 × 10⁴ hm2 with a coverage rate of 15.9%; the natural grassland covers 14.8 × 10⁴ hm2; and the cultivated land covers 54.61 × 10⁴ hm2, with an effective irrigation area of 34.4 × 10⁴ hm2. Sixteen towns and 484 administrative villages are governed in the whole district. In 2012, the district had a population of 88.78 × 10⁴, the gross domestic product (GDP) was 180.52 × 10⁸ Yuan (1 Yuan RMB = 0.1451 US dollars), the per capita GDP was 22820 Yuan, the per capita disposable income of urban residents was 23,280 Yuan, and the per capita net income of farmers was 6887 Yuan [31,32]. The plain area accounts for 69.9% of the total area. Due to the flat terrain, lower elevation (~330 m), convenient transportation, and abundant per capita farmland, it has superior irrigation and agricultural production conditions. The loess tableland area, which has a relatively high altitude (~600 m), accounts for 22% of the total area. The traffic there is inconvenient, and although the per capita cultivated land is adequate and dry farming is fully developed, it is difficult to irrigate. The Qinling piedmont area accounts for 8.1% of the total area in which mechanized farming is difficult on account of the high altitude (900~2400 m), poor traffic conditions, and shortage of per capita farmland. The physical and human geography status of those three areas are listed and compared in Table 1.
2.2. Data Collection and Analysis
Basic data were collected through household questionnaire surveys as well as interviews with farmers who could supply more information through better communication (Supplementary Materials). The surveys were conducted in three terrains, six towns and 11 villages, including the villages of Beiqi, Dali, and Lixin in the plain area; Sanlian and Duan in the loess tableland area; and Qiaonan, Zaoshu’an, Siyukou, Bojiwang, Miaohou, and Tianliu in the Qinling piedmont area. The villages investigated were dispersed throughout the three types of areas, and the rural households were randomly selected in each village. The investigator communicated with the villager face to face and filled out the questionnaire. The survey included basic information regarding the family members, agricultural production, household livelihoods, family income levels, energy use types, quantities, and appliances.
The status of energy consumption of one year was inquired and counted. Specifically, the consumption of honeycomb briquettes and coal for the whole year was directly recorded, and the consumption of liquefied petroleum gas (LPG) was converted into kilograms according to the net weight of each gas tank and the number of tanks consumed. An electronic spring balance or steelyard was used to weigh and calculate the consumption of straw, corncobs, and firewood by the farmers for a day or several days and used a power rate to calculate the consumption of electricity. In the meantime, the seasonal change in energy consumption was also fully considered; for instance, biogas could generally be used from March to November. In general, the daily air pressure of a biogas barometer might reach 2~4 kilopascal (KPa) from March to May; the daily pressure increases to 6~8 KPa during the period of June to August; and, from September through November, it decreases to 3~5 KPa. Furthermore, in view of the valid time of household energy consumption, statistics of some types of energy such as firewood and biogas are conducted according to 25 days per month.
The questionnaires were distributed to 240 families, and 232 valid questionnaires were received, including 80 questionnaires from the plain area, 59 questionnaires from the loess tableland area, and 93 questionnaires from the Qinling piedmont area. As a result, 12.31 percent of total households and 12.36 percent of the total population were chosen in the sample villages, and the detailed characteristics of the household survey samples for different types of areas are presented in Table 2, in which some of the survey data have higher degrees of agreement with the statistical data, supporting the reliability of the questionnaire. In addition, it was found in our survey that rural households in each type of area have similar living habits and styles because of the same conditions in accessing energy resources, which is consistent with Niu et al. [33]. Namely, there is an evident cluster effect for the regional energy consumption [26]. Furthermore, according to the survey experience, the rough status of energy consumption for the whole village can be obtained as long as approximately 20~30 families are investigated in that village. Rural households also think that the status of energy consumption differs little throughout the whole village. Accordingly, the sample may reflect the basic situation of regional energy consumption to a certain extent.
In order to compare one category to another, the energy consumption was converted into a unified unit, standard coal equivalent (kgce). The detailed coefficient of energy conversion is shown in Table 3 [34]. Based on those coefficients, the results of the statistical analyses of household energy consumption per capita in different types of areas are shown in Table 4. It can be seen clearly that firewood is the main source of household energy in the whole region. Of course, in the Qinling piedmont area, the farmers use firewood as the only major type of household energy because of its abundance. In the loess tableland area, in addition to firewood, biogas is utilized more because of the higher popularization of rural household biogas projects supported by the central and local governments. In addition, electricity is consumed the most due to the tradition of feeding pigs. Due to insufficient recognition and management, a lack of fermentation raw material, terrain limitations, and so on, biogas use is not sufficient in the other two areas. In the plain area, more commercial energy sources such as honeycomb briquettes, coal, and LPG are used because of the convenient transportation and sufficient energy supply. According to the coefficient of variation, it can be seen that the value of honeycomb briquettes, coal, and LPG in the plain area is the lowest among the three areas, which is the reason that commercial energy is widely used instead. The usage of straw, electricity, and biogas is stable in the loess tableland area. Traditional biomass energy, such as firewood and corncobs, is dominant in the Qinling piedmont area. Overall, different types of household energy consumption are represented by the three types of areas; the plain area shows greater commercial energy use due to the market orientation, whereas the loess tableland shows a new type of clean energy as a result of the orientation of energy policy, and the mountainous area uses traditional household energy under the influence of natural resources as the dominant type.
3. Methodology
The emission estimation method used is from the IPCC (Intergovernmental Panel on Climate Change) Guidelines for National Greenhouse Gas Inventories, which is based on the total amount of fuel combusted and default emission factors of different energy types [35]. The influential factors of emission disparities are analyzed and the GRA (Grey Relational Analysis) method is used to determine the degree of correlation between emissions of rural household energy consumption and the factors.
3.1. Emission Calculation
Due to lack of direct monitoring data, the calculation of emissions is mostly based on energy consumption [28,36]. This paper is designed to take account of the calculation method provided by the IPCC greenhouse gas emission inventory guidebook in 2006, as shown in the following equation:
where Eqj refers to the emissions of household q from emission j; cqi represents the consumption of energy i of household q; eij is the emission coefficient of emission j from energy i; and i and j are the types of energy and emissions, respectively. Thus, the total emissions of household q (EqT) can be presented as follows:
Please note that biomass fuels are usually recognized as carbon neutral [37], which is based on the argument that the biomass has removed as much CO2 from the atmosphere as is emitted during its combustion [38]. However, this is a controversial issue [39] because it may be argued that the CO2 emitted during the whole lifecycle of biomass may not simply equal the amount that it removed [13]. Furthermore, energy emissions and biomass absorption are both closely related to and independent of each other. Thus, the cross sectional data of energy consumption, including biomass energy, are adopted in the paper to compare the emission status in different types of areas by consulting the references [10,15]. According to the types of emissions from household energy consumption (Figure 1), seven types of emissions were be determined by referring to the relevant literature [40,41,42,43,44,45]. The emission factors were collected, as Table 5 shows.
3.2. Choice of Influence Factors of Emission Disparities
The disparities in emissions from energy consumption in the various areas result from different energy structures, which are affected by the regional energy supply capacity and household characteristics. The plain area acquires advanced energy such as electricity and LPG more readily, while using less biomass energy. Due to the poor infrastructure of the energy supply, the Qinling piedmont area uses more biomass energy. Therefore, the regional energy supply capacity affected by the natural topographic conditions should be the original influence factors of structural disparities in energy use. The characteristics of households under the influence of different regional development conditions present a diverse overall situation and have direct effects on energy emissions. At the same time, there is little difference about the weather of the three areas on account of the limited research scope, so referring to the influence factors of rural emission characteristics mentioned above [10,13] and based on the availability of survey data combined with the practical situation, we chose income level, occupation, educational background, and age structure to discern the effects of differences in rural household characteristics between the areas on emissions from energy consumption. The characteristic differences of rural households were the main focus of this work, whereas certain other factors that impact household energy consumption were not included in the questionnaire and were neglected.
3.3. Grey Relational Analysis
A grey relational analysis is a powerful tool for solving problems with complex interrelationships among multiple objectives. In other words, for a given reference sequence and a given set of comparative sequences, a GRA can be used to determine the degree of correlation between the reference and each element in the given set [48]. In this study, emissions of rural household energy consumption in different types of areas are considered as the reference sequence, and the income level, occupation, educational background, and age structure are adopted as the comparative sequences, so it is applicable for the method to analyze the effect of specific factors on the regional disparities in emissions. The steps of a GRA are as follows.
First, a reference sequence and comparative sequences are determined according to the following formulas:
where Formula (3) is the reference sequence; Formula (4) is the comparative sequence; i is the number of comparative sequences, i = 1, 2,…, m; and K is the observed value, K = 1, 2, …, n.
X0(K) = {X0(1), X0(2),…, X0(n)},
Xi(K) = {Xi(1), Xi(2),…, Xi(n)},
Second, data normalization is processed. Furthermore, after normalizing the original sequence, the new reference sequence X0′(K) and comparative sequences Xi′(K) are obtained (i = 1, 2,…,m; K = 1, 2,…,n):
Finally, the Grey correlation degree (R0i) is calculated. The calculation formula is shown as follows:
where ρ is a parameter called the distinguishing coefficient, which is generally set as 0.5 [49]. The higher the value of R0i, the stronger the influence of the comparative sequences Xi(K) on the reference sequence X0(K).
4. Results and Discussion
According to Formulas (1) and (2), per capita emissions of GHG, per capita TSP emission, per capita emission of solid waste, and overall mission of per capita energy consumption in the three types of areas are calculated. The results of the calculations and the influence factors of emission disparities discerned by the GRA are discussed in this section as follows.
4.1. Emissions from Energy Consumption
4.1.1. Per Capita Emissions of GHG
CO2 Emissions
The per capita CO2 emissions in different types of areas show substantial differences (Table 6). Total per capita CO2 emissions are highest in the Qinling piedmont area, followed by the loess tableland area, then the plain area. Practically speaking, given single energy-use structures dominated by inefficient biomass energy, an extremely extensive way of energy utilization and inefficient traditional stoves, farmers in the Qinling piedmont area have to consume more biomass energy to satisfy their need for indispensable effective thermal energy. Hence, the per capita energy consumption and CO2 emissions there are the highest of the three areas. For the other two areas, there are greater firewood and straw CO2 emissions and less coal and honeycomb briquette CO2 emissions in the loess tableland than in the plain area. Furthermore, the loess tableland area uses more sanitary biogas, which makes the total CO2 emissions of the former area slightly higher than those of the latter.
Regarding emissions from all types of energy, those from firewood CO2 are the highest because they are from the primary household energy of the entire region. In particular, farmers in the Qinling piedmont area rely heavily on firewood, which leads to CO2 emissions that are 2.09 times and 1.78 times greater than those in the plain and loess tableland areas, respectively. Additionally, electricity is the second-largest emitter in the loess tableland and in the Qinling piedmont areas. However, biogas and LPG CO2 emissions are the lowest, indicating that they are comparatively clean sources of household energy. In addition, CO2 emissions from fossil energy are the highest in the plain area because of the greater use of coal and honeycomb briquettes.
Other GHG Emissions
As indicated in Figure 2, the per capita emission of other GHGs increases from the loess tableland (7.00 kg) to the Qinling piedmont (8.20 kg) and plain (9.32 kg) areas. For all types of emissions, CH4 and SO2 are markedly higher than those of N2O and NOx because of their larger emission coefficients. For instance, the SO2 emission coefficient of coal reaches 26.331 g/kgce, whereas that of N2O is only 0.044 g/kgce. Farmers in the plain area have the highest SO2 emission because coal is the most frequent form of energy. The Qinling piedmont area has the highest CH4 emission because biomass energy such as firewood and straw is the most common. There is little difference between CH4 and SO2 emissions in the loess tableland area because of its moderate levels of coal and biomass energy consumption. N2O and NOx emissions are generally highest in the Qinling piedmont area, followed by the plain and loess tableland areas.
4.1.2. Per Capita TSP Emission
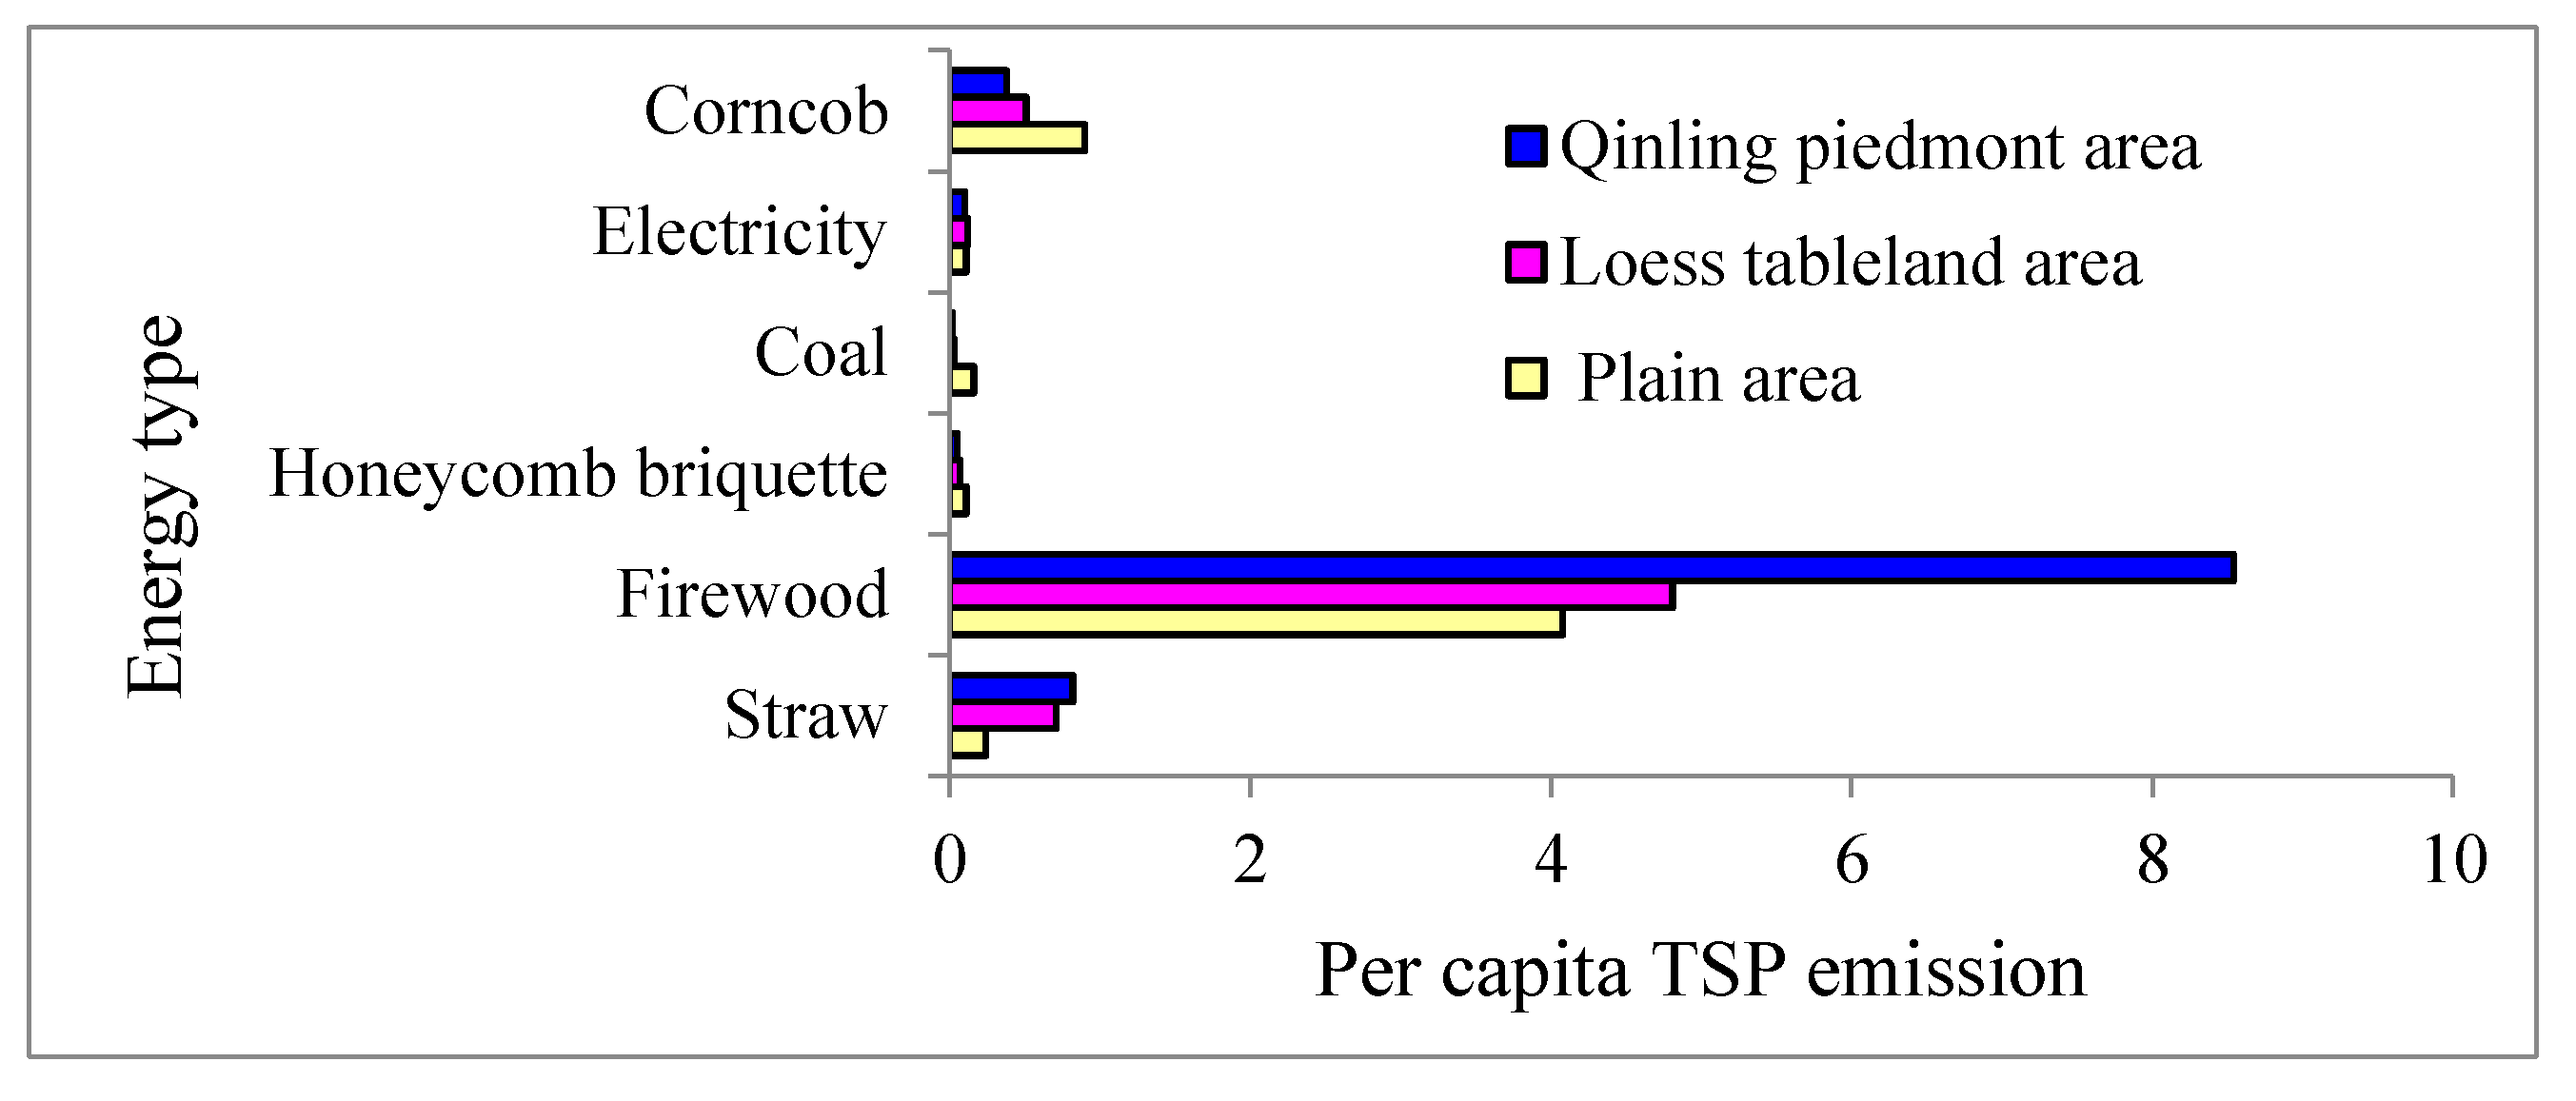
As shown in Figure 3, firewood is the major source of TSP emission in the entire region, accounting for 78.64% of total TSP emissions. The Qinling piedmont area, with the greatest firewood use, has the highest TSP emissions. The per capita emissions of the plain, loess tableland, and Qinling piedmont areas are 5.61 kg, 6.25 kg and 9.90 kg, respectively.
4.1.3. Per Capita Emission of Solid Waste
The per capita annual solid waste emissions from the consumption of coal and honeycomb briquettes are 70.74, 22.92, and 15.03 kg in the plain, loess tableland, and Qinling piedmont areas, respectively. Thus, the plain area has 3.09 times greater emissions than the loess tableland area and 4.71 times greater than the Qinling piedmont area.
4.1.4. Overall Emission of Per Capita Energy Consumption
The overall emissions from energy consumption in the three areas, represented here by ‘total emissions of per capita energy consumption’, refer to the sum of atmospheric emissions and solid waste (see Table 7).Though the gaseous and solid properties are different, the units are both kg; therefore, the figures are added to represent the overall emissions of per capita energy consumption.
As indicated in Table 7, farmers in the Qinling piedmont area have the highest GHG and TSP emissions but the lowest solid waste emissions. Thus, it is possible that the emissions of household energy in that area have the greatest impact on the environment. For the other two types of areas, the plain area has slightly higher total emissions than the loess tableland as a result of higher solid waste emissions. In summary, these results demonstrate that the disparity in emissions from rural household energy consumption in different areas is closely related to the dominant energy types.
4.2. Analysis of Influence Factors of Emission Disparities
Using total emissions from per capita energy consumption in the three areas as the reference sequence, per capita income (Yuan/year), per capita cultivated land (hm2), the proportion of the migrant population near homes (%), the proportion of the population that completed junior high school or above (%), and the proportion of elderly people (%) of the corresponding areas as comparative sequences, we calculated the grey correlation in accord with Equations (3) to (6). The regional emission disparities of household energy are positively correlated with the five explanatory variables, and their order was then ranked, as shown in Table 8.
- (1)
- Age structure. The age structure of the household survey samples was the strongest influence factor on the disparity of energy emissions (correlation 0.7964). Further, as shown in Table 9, differences in the elderly proportion of permanent residents is the most important influence. This finding is consistent with a previous study that got similar result [13]. Specifically, the plain area has the smallest proportion of elderly residents and the Qinling piedmont area the largest. It was found that there are many empty-nesters and left-behind children in rural areas. This is especially so in the Qinling piedmont area, where, because of the poor infrastructure, underdeveloped agriculture, and lower living standards, young people typically have to leave their homes for work (i.e., migrant workers). With traditional habits and thinking modes, elderly residents have maintained inherent energy consumption habits for decades based on the local interviews. The lower income levels and thrifty habits also cause them to limit their expenditures for energy consumption. In addition, their place of residence is at the foot of the Qinling Mountains, where firewood is readily obtained. Consequently, less commercial energy, which requires cash purchase, is used. As is known, the biomass emission coefficient for firewood is large, so substantial emissions are inevitable [14,15]. Moreover, the home-heating duration of elderly residents is longer than that of younger residents during winter, and the Qinling piedmont area, which is 2~3 °C lower than the plain area on average according to the local residents and has a little higher humidity due to the tree shading, requires more energy consumption. In the meantime, the heating time of the Qinling area (more than four months) is longer than that of the plain (about three months) in general, which might be the main cause of its higher energy consumption, as compared to other factors such as education level, etc. Therefore, that area has the greatest emissions from energy consumption.
- (2)
- Educational background. The correlation (0.7526) between educational background and emissions from energy consumption is the second highest. Figure 4 shows that the largest proportion of the population in the loess tableland and plain area is composed of people with a junior high school education, whereas, in the Qinling piedmont area, most have only a primary school level of education. For educational degrees above junior high school level, the proportion is smallest in the Qinling piedmont area (43.98%) and highest in the plain area (68.16%), with the loess tableland area being intermediate (60.25%). Studies have shown that people with little education use more biomass energy than those who are more highly educated [50,51,52]. Using a large amount of biomass energy with larger emission coefficients and lower thermal efficiency generates more emissions. Hence, with the least education, the Qinling piedmont area has the highest emissions from energy consumption.
- (3)
- Household income level. The influence of household income level on emissions from energy consumption is mainly reflected by per capita income and per capita cultivated land, for which the correlation is 0.7359 and 0.7314, respectively. With abundant cultivated land and advanced agricultural production, people have higher per capita income levels, and the demand for improving their quality of life is accordingly greater. Thus, commercial energy that is sanitary and convenient tends to be chosen. The plain area, with lower elevation, flat terrain, abundant per capita farmland, developed agriculture, and convenient transportation, has the highest per capita income and energy expenditure; therefore, more commercial energy is used. The loess tableland has developed dryland farming and adequate cultivated land, but its quality is ordinary and difficult to irrigate. Under the circumstances, the per capita income and energy expenditure are at moderate levels. The Qinling piedmont has deficient farmland with inferior quality because of the undulating terrain and the Grain for Green policy, which is a national ecological project in central and western China. In 1999, the Chinese government initiated this program (also known as the Sloping Land Conversion Program and later named the Conversion of Cropland to Forest and Grassland Program) [53], which is intended to prevent further soil erosion, control desertification, and improve land quality [54]. As a result, production and living conditions are poor, and therefore the per capita income and energy expenditure are the lowest. In addition, there are better housing conditions and modern cookstoves in households with higher incomes, in which the preference is to use clean energy rather than biomass energy. Owing to higher thermal efficiency, farmers in the plain area who use more commercial energy have the lowest total energy consumption; emissions thus decrease accordingly.
- (4)
- Occupation. The effect of occupation on emissions from energy consumption is shown by the correlation (0.6488) between the proportion of the migrant population near their home and emissions. The survey found that many people take part-time jobs near their homes and only work on the farm during busy farming seasons. They can return home every day and belong to the rural resident population. However, the number of migrant workers in the three areas is clearly different. The proportions of workers in the plain, loess tableland, and Qinling piedmont areas are 25.71%, 16.77%, and 7.52%, respectively. The plain area is relatively flat, and transportation is very convenient because of free national and provincial highways plus county and country roads. Farmers thus have close contact with the outside world and enjoy better job opportunities, so the proportion of the migrant population near home is the largest. In the Qinling piedmont area, migrant workers are very common, owing to the insufficient natural conditions for agricultural development. However, unlike the plain area, most farmers work far from home because of poor traffic conditions, less contact with the outside world and a lack of job opportunities; the aforementioned proportion is thus the smallest. In the loess tableland area, traffic conditions are inconvenient and there is less contact with the outside world and fewer job opportunities than in the plain area; thus there is a natural decline in people who work near home. Furthermore, as the tradition of dry farming leads to many farmers raising livestock, biogas is preferably used. Both jobs are time consuming and need constant attention and management. Consequently, some people are hindered from leaving home for work, and the proportion is smaller than that of the plain area. It is also clear that migrant workers near home use more convenient energy such as electricity and LPG because of their reduced spare time. Owing to the higher thermal efficiency, greater commercial energy use can reduce total energy consumption and emissions.
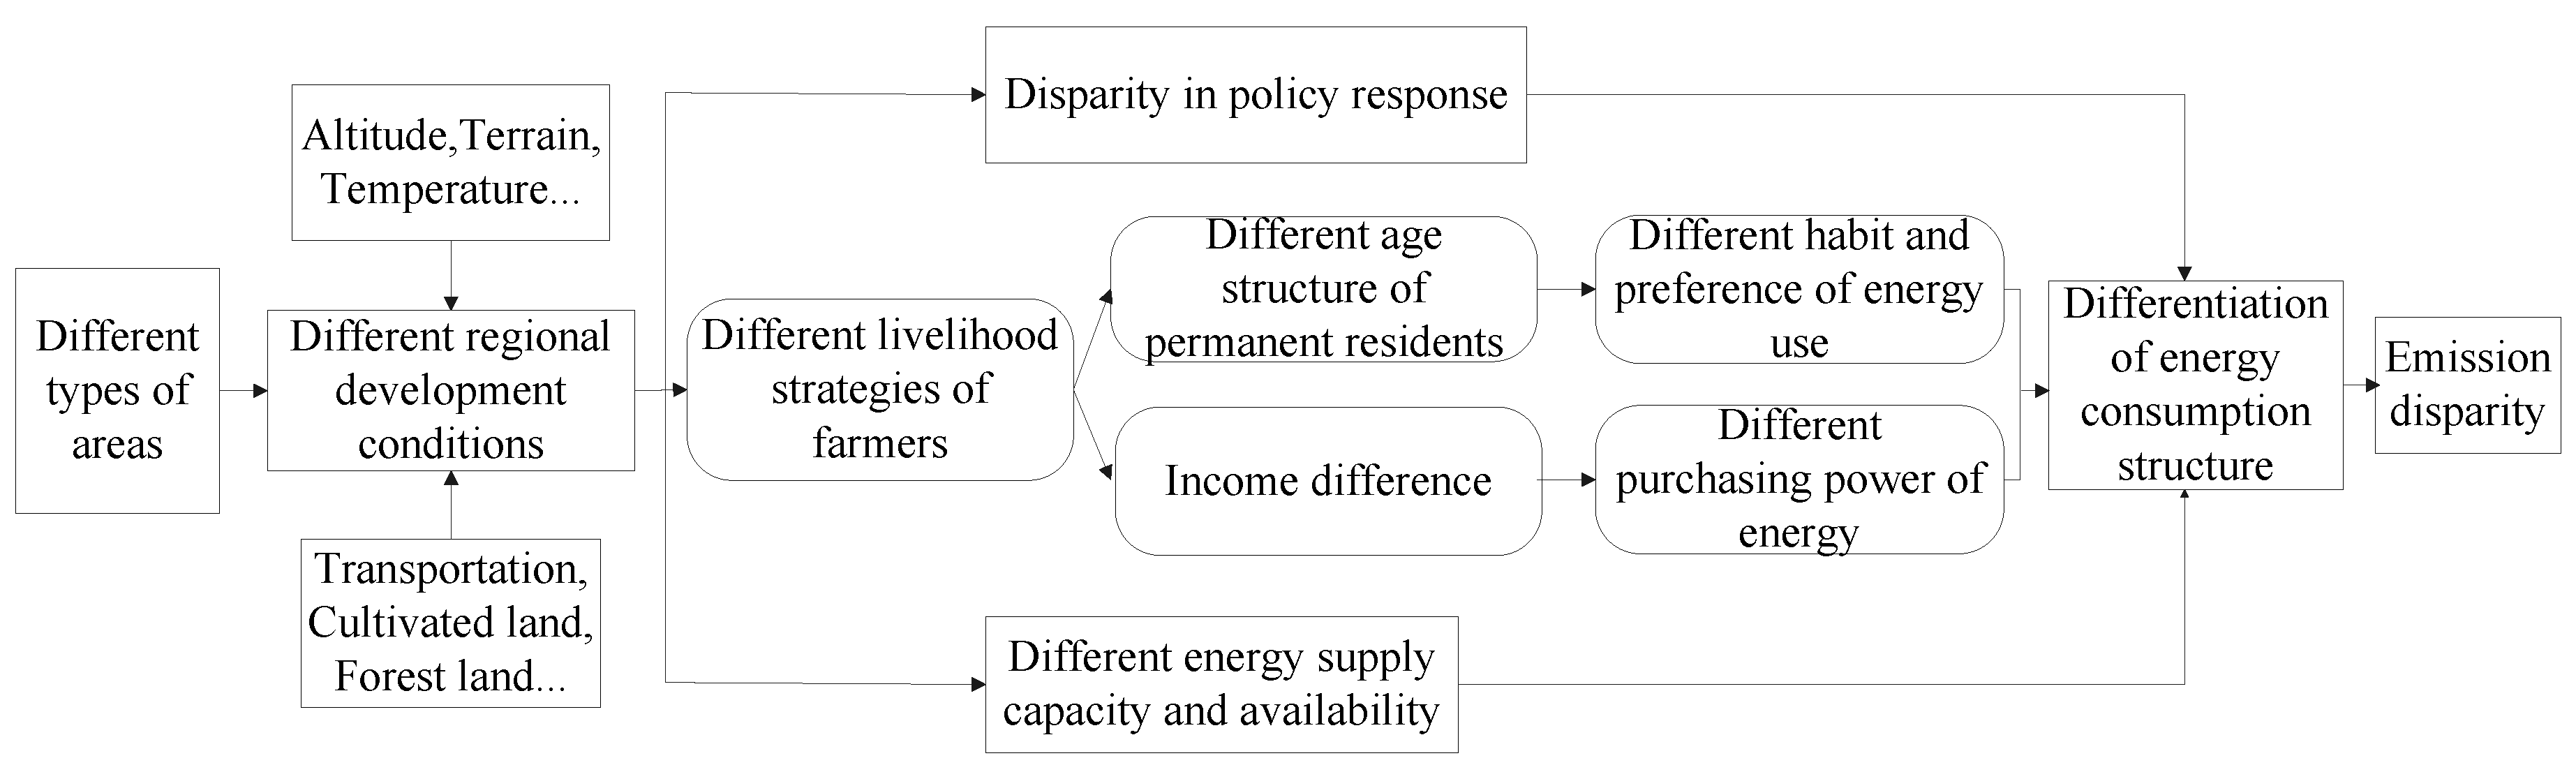
Generally, regional development conditions are fundamental in affecting regional emission disparities, of which energy supply capacity and availability are the primary causes. The direct influences are household age structure, educational background, income level, occupation, and so on, which are shaped by the regional environment. Therefore, as indicated in Figure 5, emissions from energy consumption are comprehensively impacted by regional-level factors combined with household-level factors.
5. Conclusions and Policy Implications
In this article, a case study on the emission disparities of rural household energy consumption in northwest China was presented. The differences in the emission characteristics of the three areas and their influential factors were analyzed. Some more specific conclusions and recommendations can be drawn.
5.1. Conclusions
Emissions from rural household energy consumption differ greatly across diverse types of areas. The loess tableland area shows the lowest emissions because of a larger proportion of biogas consumption, indicating that clean energy reduces emissions. In the Qinling piedmont area, emissions are the highest as a result of firewood combustion, indicating that more attention should be paid to farmers with low living standards and a traditional biomass energy orientation. Among the three areas, emissions in the plain area are moderate, reflecting the fact that the utilization of commercial energy does not necessarily produce more emissions.
CO2 is the main form of GHG emission from rural household energy consumption, and gradually increases from the plain and loess tableland areas to the Qinling piedmont area. For other emissions, there is no fixed order among the three areas. For example, the Qinling piedmont has the highest TSP emissions, whereas solid waste emissions mostly come from the plain area. This finding suggests that disparities in emissions across the areas are related to the dominant energy types. The original influence factor of emission disparities is the regional energy supply capacity. Of course, there is also the direct impact of differences in household characteristics under the influence of the regional environment, followed by household age structure, educational background, household income level, occupation, and so on.
It should be pointed out that the valid questionnaires are not enough in the field of statistics and the influential factors of emission disparities are not integrated in this study, which affects the precision of analysis and integrity of understanding indeed. The results and conclusions still need to be verified through more data and indicators in the future.
5.2. Policy Implications
In view of the research findings, the derived policy implications are discussed as follows:
- (1)
- In this paper, using the Linwei district of the lower reaches of the Weihe River as a case study area, we investigated the disparities in emissions of rural household energy consumption in three types of areas. In fact, the status of disparities in emissions also exists across the entire country because there are complex terrains and diverse economic development levels in China. The emissions from household energy consumption remarkably increase in the remote rural mountain areas because firewood is largely used, showing that traditional biomass combustion is one of the main sources of rural household energy emissions, which is consistent with the results of previous studies [14,15,16]. Some other studies consider that the obvious transition from non-commercial energy to commercial energy leads to more emissions [6,17,55], but, in fact, the traditional energy pattern causes greater emissions, which can be seen by comparing different types of areas. The diversification of energy use patterns might not necessarily generate higher emissions.
- (2)
- Although the contents that are strongly locally valuable can be an example which is difficult to translate into other locations for the same conclusions, the disparities in emissions from rural household energy consumption are analyzed from the angle of different types of areas, which helps us further understand the emissions status of multiple areas and make up for the defects of the traditional emission cognition of single type areas. It might not be quite clear that the disparities in emissions in different types of areas are presented from a medium- or small-scale perspective, which has some limitations. However, the internal difference might be neglected if the study area is too large. Therefore, it is more valuable for policy makers to investigate disparities in emissions of rural energy consumption at a moderate scale.
- (3)
- China has a vast territory and a large rural population. The energy security of rural households is the basic condition of improving farmers’ quality of life, but the relationships between rural development, energy consumption, and environmental protection must be better managed. Especially in remote rural areas with underdeveloped economies, high total energy consumption, low effective utilization rates, and serious energy waste will persist if energy consumption cannot be improved. In the long run, farmers will depend excessively on biomass energy with low thermal efficiency. This type of energy structure will produce more emissions, which might have serious effects on the local ecological environments. To solve these problems, it is helpful to improve farmers’ income levels, enhance their purchasing power for commercial energy, and encourage the use of clean or renewable energies. Simultaneously, scientific planning, the design of rural energy development strategies, and altering the traditional structure of household energy consumption based on actual regional situations should also be beneficial for reducing emissions.
Supplementary Materials
Supplementary materials can be found at www.mdpi.com/2071-1050/9/5/726/s1.
Acknowledgments
This work was supported by the National Natural Science Foundation of China (Grant No. 41101555), the Social Science Foundation of Shaanxi Province, China (Grant No. 2016D022), and the Natural Science Basic Research Plan Project in Shaanxi Province of China (Grant No. 2015JM4139). The authors would like to thank participating members (Master WentingHou, Jingsa Zhang, Jinjin Sun, Yajiao Wu, Yinping Jiang, Shujuan Liu, Nannan Li, and Hui Zeng, undergraduate student Long Wang, Kai Zeng, Hao Li, Chunkai Fu, Yuan He, and Yan Hu) and farmers for their assistance and cooperation during the household surveys.
Author Contributions
Wenheng Wu conceived and designed the study; Hongying Zhu, Yinghao Qu and Kaiying Xu analyzed the data; Wenheng Wu and Hongying Zhu wrote the paper.
Conflicts of Interest
The authors declare no conflict of interest.
References
- Li, Z.; Pan, L.Y.; Fu, F.; Liu, P.; Ma, L.W.; Amorelli, A. China’s regional disparities in energy consumption: An input-output analysis. Energy 2014, 78, 426–438. [Google Scholar] [CrossRef]
- Yuan, J.H.; Xu, Y.; Hu, Z.; Zhao, C.H.; Xiong, M.P.; Guo, J.S. Peak energy consumption and CO2 emissions in China. Energy Policy 2014, 68, 508–523. [Google Scholar] [CrossRef]
- Zha, D.L.; Zhou, D.Q.; Zhou, P. Driving forces of residential CO2 emissions in urban and rural China: An index decomposition analysis. Energy Policy 2010, 38, 3377–3383. [Google Scholar]
- Fan, J.; Wang, Q.; Sun, W. The failure of China’s energy development strategy 2050 and its impact on carbon emissions. Renew. Sustain. Energy Rev. 2015, 49, 1160–1170. [Google Scholar] [CrossRef]
- Fan, J.L.; Yu, H.; Wei, Y.M. Residential energy-related carbon emissions in urban and rural China during 1996–2012: From the perspective of five end-use activities. Energy Build. 2015, 96, 201–209. [Google Scholar] [CrossRef]
- Yao, C.S.; Chen, C.Y.; Li, M. Analysis of rural residential energy consumption and corresponding carbon emissions in China. Energy Policy 2012, 41, 445–450. [Google Scholar] [CrossRef]
- Tonooka, Y.; Liu, J.P.; Kondou, Y.; Ning, Y.D.; Fukasawa, O. A survey on energy consumption in rural households in the fringes of Xian city. Energy Build. 2006, 38, 1335–1342. [Google Scholar] [CrossRef]
- Zhou, Y.; Liu, Y.S.; Wu, W.X.; Li, Y.R. Effects of rural-urban development transformation on energy consumption and CO2 emissions: A regional analysis in China. Renew. Sustain. Energy Rev. 2015, 52, 863–875. [Google Scholar] [CrossRef]
- Zhang, L.X.; Wang, C.B.; Bahaj, A.S. Carbon emissions by rural energy in China. Renew. Energy 2014, 66, 641–649. [Google Scholar] [CrossRef]
- Liang, L.; Wu, W.L.; Lal, R.; Guo, Y.B. Structural change and carbon emission of rural household energy consumption in Huantai, northern China. Renew. Sustain. Energy Rev. 2013, 28, 767–776. [Google Scholar] [CrossRef]
- Ding, Y.X.; Qu, W.; Niu, S.W.; Liang, M.; Qiang, W.L.; Hong, Z.G. Factors influencing the spatial difference in household energy consumption in China. Sustainability 2016, 8, 1285. [Google Scholar] [CrossRef]
- Wang, Z.H.; Yang, L. Indirect carbon emissions in household consumption: Evidence from the urban and rural area in China. J. Clean. Prod. 2014, 78, 94–103. [Google Scholar] [CrossRef]
- Liu, W.L.; Spaargaren, G.; Heerink, N.; Mol, A.P.J.; Wang, C. Energy consumption practices of rural households in north China: Basic characteristics and potential for low carbon development. Energy Policy 2013, 55, 128–138. [Google Scholar] [CrossRef]
- Abu-Madi, M.; Rayyan, M.A. Estimation of main greenhouse gases emission from household energy consumption in the West Bank, Palestine. Environ. Pollut. 2013, 179, 250–257. [Google Scholar] [CrossRef] [PubMed]
- Chen, Y.; Zhu, Y.L. Analysis on the environmental effect of renewable energy consumption by rural residents in daily life in China—from the perspectives of carbon emissions. Energy Procedia 2011, 5, 1642–1646. [Google Scholar]
- Niu, H.W.; He, Y.Q.; Desideri, U.; Zhang, P.D.; Qin, H.Y.; Wang, S.J. Rural household energy consumption and its implications for eco-environments in NW China: A case study. Renew. Energy 2014, 65, 137–145. [Google Scholar] [CrossRef]
- Zhou, Z.R.; Wu, W.L.; Wang, X.H.; Chen, Q.; Wang, O. Analysis of changes in the structure of rural household energy consumption in northern China: A case study. Renew. Sustain. Energy Rev. 2009, 13, 187–193. [Google Scholar] [CrossRef]
- Xie, G.L.; Li, B.C.; Chen, B.M. The heating system with solar energy and heat pump in the purification of Shanxi’s rural environment. J. Renew. Sustain. Energy 2014, 6, 385–388. [Google Scholar] [CrossRef]
- Diab, F.; Ali, S. An economic and environment friendly solution for the rural households’ energy crisis in Egypt. J. Renew. Sustain. Energy 2016, 8, 45904–53111. [Google Scholar] [CrossRef]
- Fatmi, Z.; Coggon, D.; Kazi, A.; Naeem, I.; Kadir, M.M.; Sathiakumar, N. Solid fuel use is a major risk factor for acute coronary syndromes among rural women: A matched case control study. Public Health 2014, 128, 77–82. [Google Scholar] [CrossRef] [PubMed]
- Zhang, B.; Chen, G.Q.; Li, J.S.; Tao, L. Methane emissions of energy activities in China 1980–2007. Renew. Sustain. Energy Rev. 2014, 29, 11–21. [Google Scholar] [CrossRef]
- Zhu, D.; Tao, S.; Wang, R.; Shen, H.Z.; Huang, Y.; Shen, G.; Wang, B.; Li, W.; Zhang, Y.; Chen, H.; et al. Temporal and spatial trends of residential energy consumption and air pollutant emissions in China. Appl. Energy 2013, 106, 17–24. [Google Scholar] [CrossRef]
- Niu, S.W.; Zhang, X.; Zhao, C.S.; Ding, Y.X.; Niu, Y.Z.; Christensen, T.H. Household energy use and emission reduction effects of energy conversion in Lanzhou city, China. Renew. Energy 2011, 36, 1431–1436. [Google Scholar] [CrossRef]
- Wang, S.X.; Wei, W.; Du, L.; Li, G.H.; Hao, J.M. Characteristics of gaseous pollutants from biofuel-stoves in rural China. Atmos. Environ. 2009, 43, 4148–4154. [Google Scholar] [CrossRef]
- Ding, W.G.; Wang, L.J.; Chen, B.Y.; Chen, B.Y.; Xu, L.; Li, H.X. Impacts of renewable energy on gender in rural communities of north-west China. Renew. Energy 2014, 69, 180–189. [Google Scholar] [CrossRef]
- Dong, L.; Liang, H.W. Spatial analysis on China’s regional air pollutants and CO2 emissions: Emission pattern and regional disparity. Atmos. Environ. 2014, 92, 280–291. [Google Scholar] [CrossRef]
- Hao, H.; Geng, Y.; Wang, H.W.; Ouyang, M.G. Regional disparity of urban passenger transport associated GHG (greenhouse gas) emissions in China: A review. Energy 2014, 68, 783–793. [Google Scholar] [CrossRef]
- Li, C.B.; He, L.N.; Cao, Y.J.; Xiao, G.X.; Zhang, W.; Liu, X.; Yu, Z.; Tan, Y.; Zhou, J. Carbon emission reduction potential of rural energy in China. Renew. Sustain. Energy Rev. 2014, 29, 254–262. [Google Scholar] [CrossRef]
- Wen, L.; Cao, Y. Factor decomposition analysis of sub-national CO2 emissions in China: A dynamic panel approach. J. Renew. Sustain. Energy 2015, 7, 367–376. [Google Scholar] [CrossRef]
- Hao, H.; Geng, Y.; Hang, W. GHG emissions from primary aluminum production in China: Regional disparities and policy implications. Appl. Energy 2016, 166, 264–272. [Google Scholar] [CrossRef]
- Shaanxi Provincial Bureau of Statistics and National Bureau of Statistics Shaanxi Survey Corps. Shaanxi Statistical Yearbook; China Statistics Press: Beijing, China, 2013. (In Chinese)
- People’s Government of Weinan City. Weinan Yearbook; Xi’an Press: Xi’an, China, 2013. (In Chinese)
- Niu, S.W.; Zhang, X.; Zhao, C.S.; Niu, Y.Z. Variations in energy consumption and survival status between rural and urban households: A case study of the Western Loess Plateau, China. Energy Policy 2012, 49, 515–527. [Google Scholar] [CrossRef]
- National Bureau of Statistics of the People’s Republic of China. China Energy Statistical Yearbook; China Statistics Press: Beijing, China, 2011. (In Chinese)
- Intergovernmental Panel on Climate Change (IPCC). 2006 IPCC Guidelines for National Greenhouse Gas Inventories; National Greenhouse Gas Inventories Programme, IGES: Kanagawa Prefecture, Japan, 2006. [Google Scholar]
- Liu, L.C.; Wu, G.; Wang, J.N.; Wei, Y.M. China’s carbon emissions from urban and rural households during 1992–2007. J. Clean. Prod. 2011, 19, 1754–1762. [Google Scholar] [CrossRef]
- Torres, C.M.M.E.; Kohmann, M.M.; Fraisse, C.W. Quantification of greenhouse gas emissions for carbon neutral farming in the Southeastern USA. Agric. Syst. 2015, 137, 64–75. [Google Scholar] [CrossRef]
- Rabl, A.; Benoist, A.; Dron, D.; Peuportier, B.; Spadaro, J.V.; Zoughaib, A. How to account for CO2 emissions from biomass in an LCA. Int. J. Life Cycle Assess. 2007, 12, 281. [Google Scholar] [CrossRef]
- Johnson, E. Goodbye to carbon neutral: Getting biomass footprints right. Environ. Impact Assess. Rev. 2009, 29, 165–168. [Google Scholar] [CrossRef]
- Lin, E.D.; Li, Y.E. Preparation Method of Global Climate Change and Greenhouse Gas Inventories; China Meteorological Press: Beijing, China, 1998. (In Chinese) [Google Scholar]
- Zhang, J.; Ge, S.; Bai, Z.P. The boiler briquette coal versus raw coal: Part II-Energy, greenhouse gas, and air quality implications. J. Air Waste Manag. Assoc. 2001, 51, 534–541. [Google Scholar] [CrossRef] [PubMed]
- Bond, T.C.; Streets, D.G.; Yarber, K.F.; Nelson, S.M.; Woo, J.H.; Klimont, Z. A technology-based global inventory of black and organic carbon emissions from combustion. J. Geophys. Res. 2004, 109, 1–43. [Google Scholar] [CrossRef]
- Yu, J.P.; Cui, P.; Wang, W.Y. Estimation on SO2, NOx and TSP emissions from energy consumption for non-production purpose in rural areas of China. Geogr. Res. 2008, 27, 547–555. (In Chinese) [Google Scholar]
- San, V.; Sriv, T.; Spoann, V.; Var, S.; Seak, S. Economic and environmental costs of rural household energy consumption structures in Sameakki Meanchey district, Kampong Chhnang Province, Cambodia. Energy 2012, 48, 484–491. [Google Scholar] [CrossRef]
- Niu, Y.Z.; Niu, S.W.; Zhang, X.; Zhao, C.S. Policy options on fuel use, energy conservation and emission reduction in household sector. China Soft Sci. 2013, 86, 1115–1123. (In Chinese) [Google Scholar]
- Lin, E.D.; Daniel, J.D.; Sun, F. Rural Development and Its Energy, Environment and Climate Change Adaptation Policy in China; Science Press: Beijing, China, 2011; (In Chinese and English). [Google Scholar]
- Cao, G.L.; Zhang, X.Y.; Wang, D.; Zheng, F.C. Inventory of atmospheric pollutants discharged from biomass burning in China continent. China Environ. Sci. 2005, 25, 389–393, (In Chinese with English Abstract). [Google Scholar]
- Liu, S.F.; Dang, Y.G.; Fang, Z.G. Grey System Theory and Its Application; Science Press: Beijing, China, 2004. (In Chinese) [Google Scholar]
- Deng, J.L. Relational space for grey systems. Fuzzy Math. 1985, 2, 1–10. (In Chinese) [Google Scholar]
- Ravindranath, N.H.; Somashekar, H.I.; Nagaraja, M.S.; Sudha, P.; Sangeetha, G.; Bhattacharya, S.C.; Abdul Salam, P. Assessment of sustainable non-plantation biomass resources potential for energy in India. Biomass Bioenergy 2005, 29, 178–190. [Google Scholar] [CrossRef]
- Behera, B.; Rahut, D.B.; Jeetendra, A.; Ali, A. Household collection and use of biomass energy sources in South Asia. Energy 2015, 85, 468–480. [Google Scholar] [CrossRef]
- González-Eguino, M. Energy poverty: An overview. Renew. Sustain. Energy Rev. 2015, 47, 377–385. [Google Scholar] [CrossRef]
- Ostwald, M.; Simelton, E.; Chen, D.; Liu, A. Relation between vegetation changes, climate variables and land-use policy in Shaanxi province, China. Geogr. Ann. Ser. A Phys. Geogr. 2007, 89, 223–236. [Google Scholar] [CrossRef]
- Cheng, J.Z.; Lee, X.Q.; Theng, B.K.G.; Zhang, L.; Fang, B. Biomass accumulation and carbon sequestration in an age-sequence of Zanthoxylum bungeanum plantations under the Grain for Green Program in Karst regions, Guizhou province. Agric. For. Meteorol. 2015, 203, 88–95. [Google Scholar] [CrossRef]
- Zhang, L.X.; Wang, C.B.; Yang, Z.F.; Chen, B. Carbon emissions from energy combustion in rural China. Procedia Environ. Sci. 2010, 2, 980–989. [Google Scholar] [CrossRef]
Figure 1.
Types of emissions from household energy consumption. Note: GHG means greenhouse gas and TSP is the abbreviation of total suspended particulate.
Figure 1.
Types of emissions from household energy consumption. Note: GHG means greenhouse gas and TSP is the abbreviation of total suspended particulate.

Figure 2.
Per capita emission of other greenhouse gases (GHGs) in different types of areas (unit: kg).
Figure 2.
Per capita emission of other greenhouse gases (GHGs) in different types of areas (unit: kg).
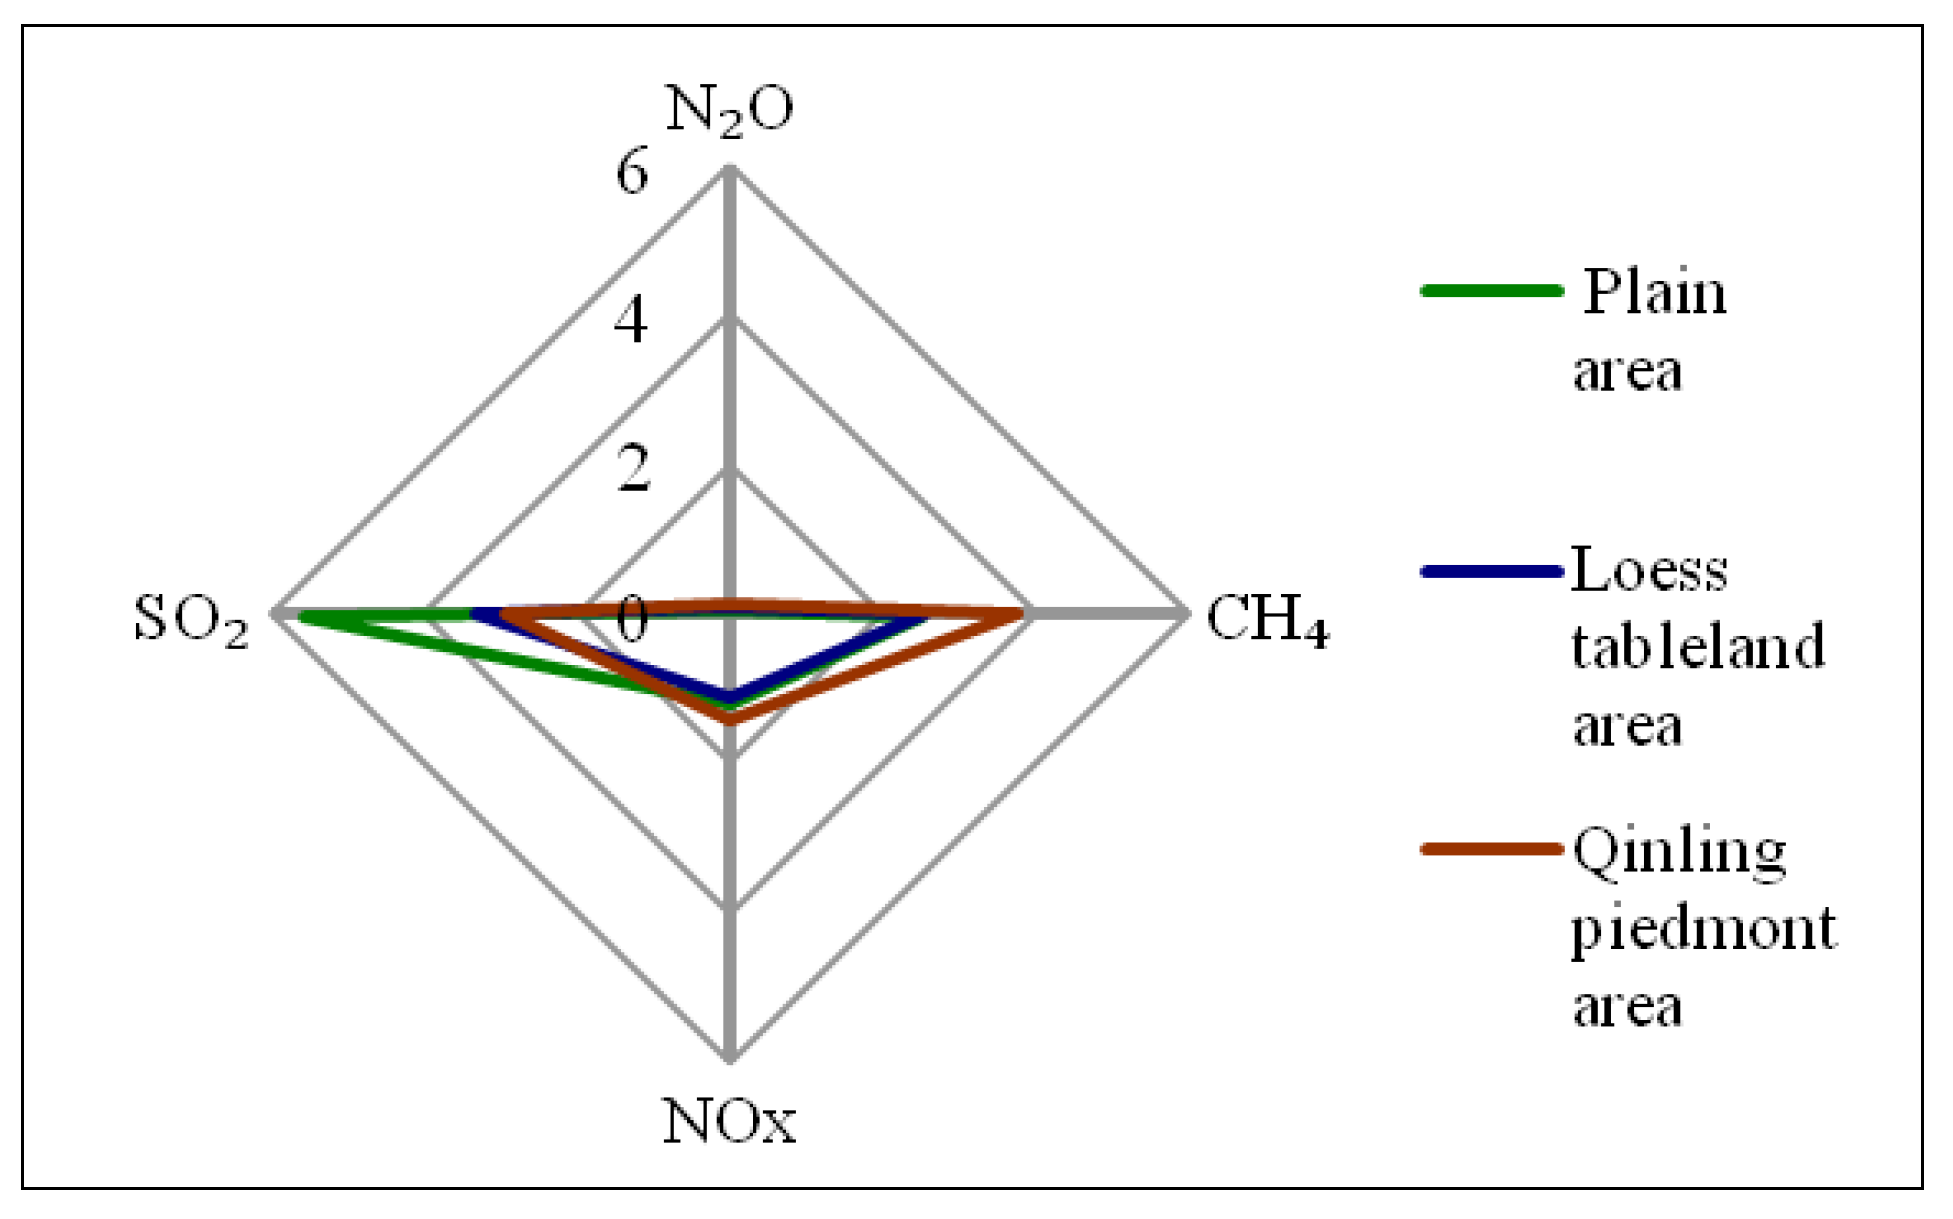
Figure 3.
Per capita total suspended particulates (TSP) emission in different types of areas (unit: kg).
Figure 3.
Per capita total suspended particulates (TSP) emission in different types of areas (unit: kg).

Figure 4.
Educational background of permanent residents in three types of areas.
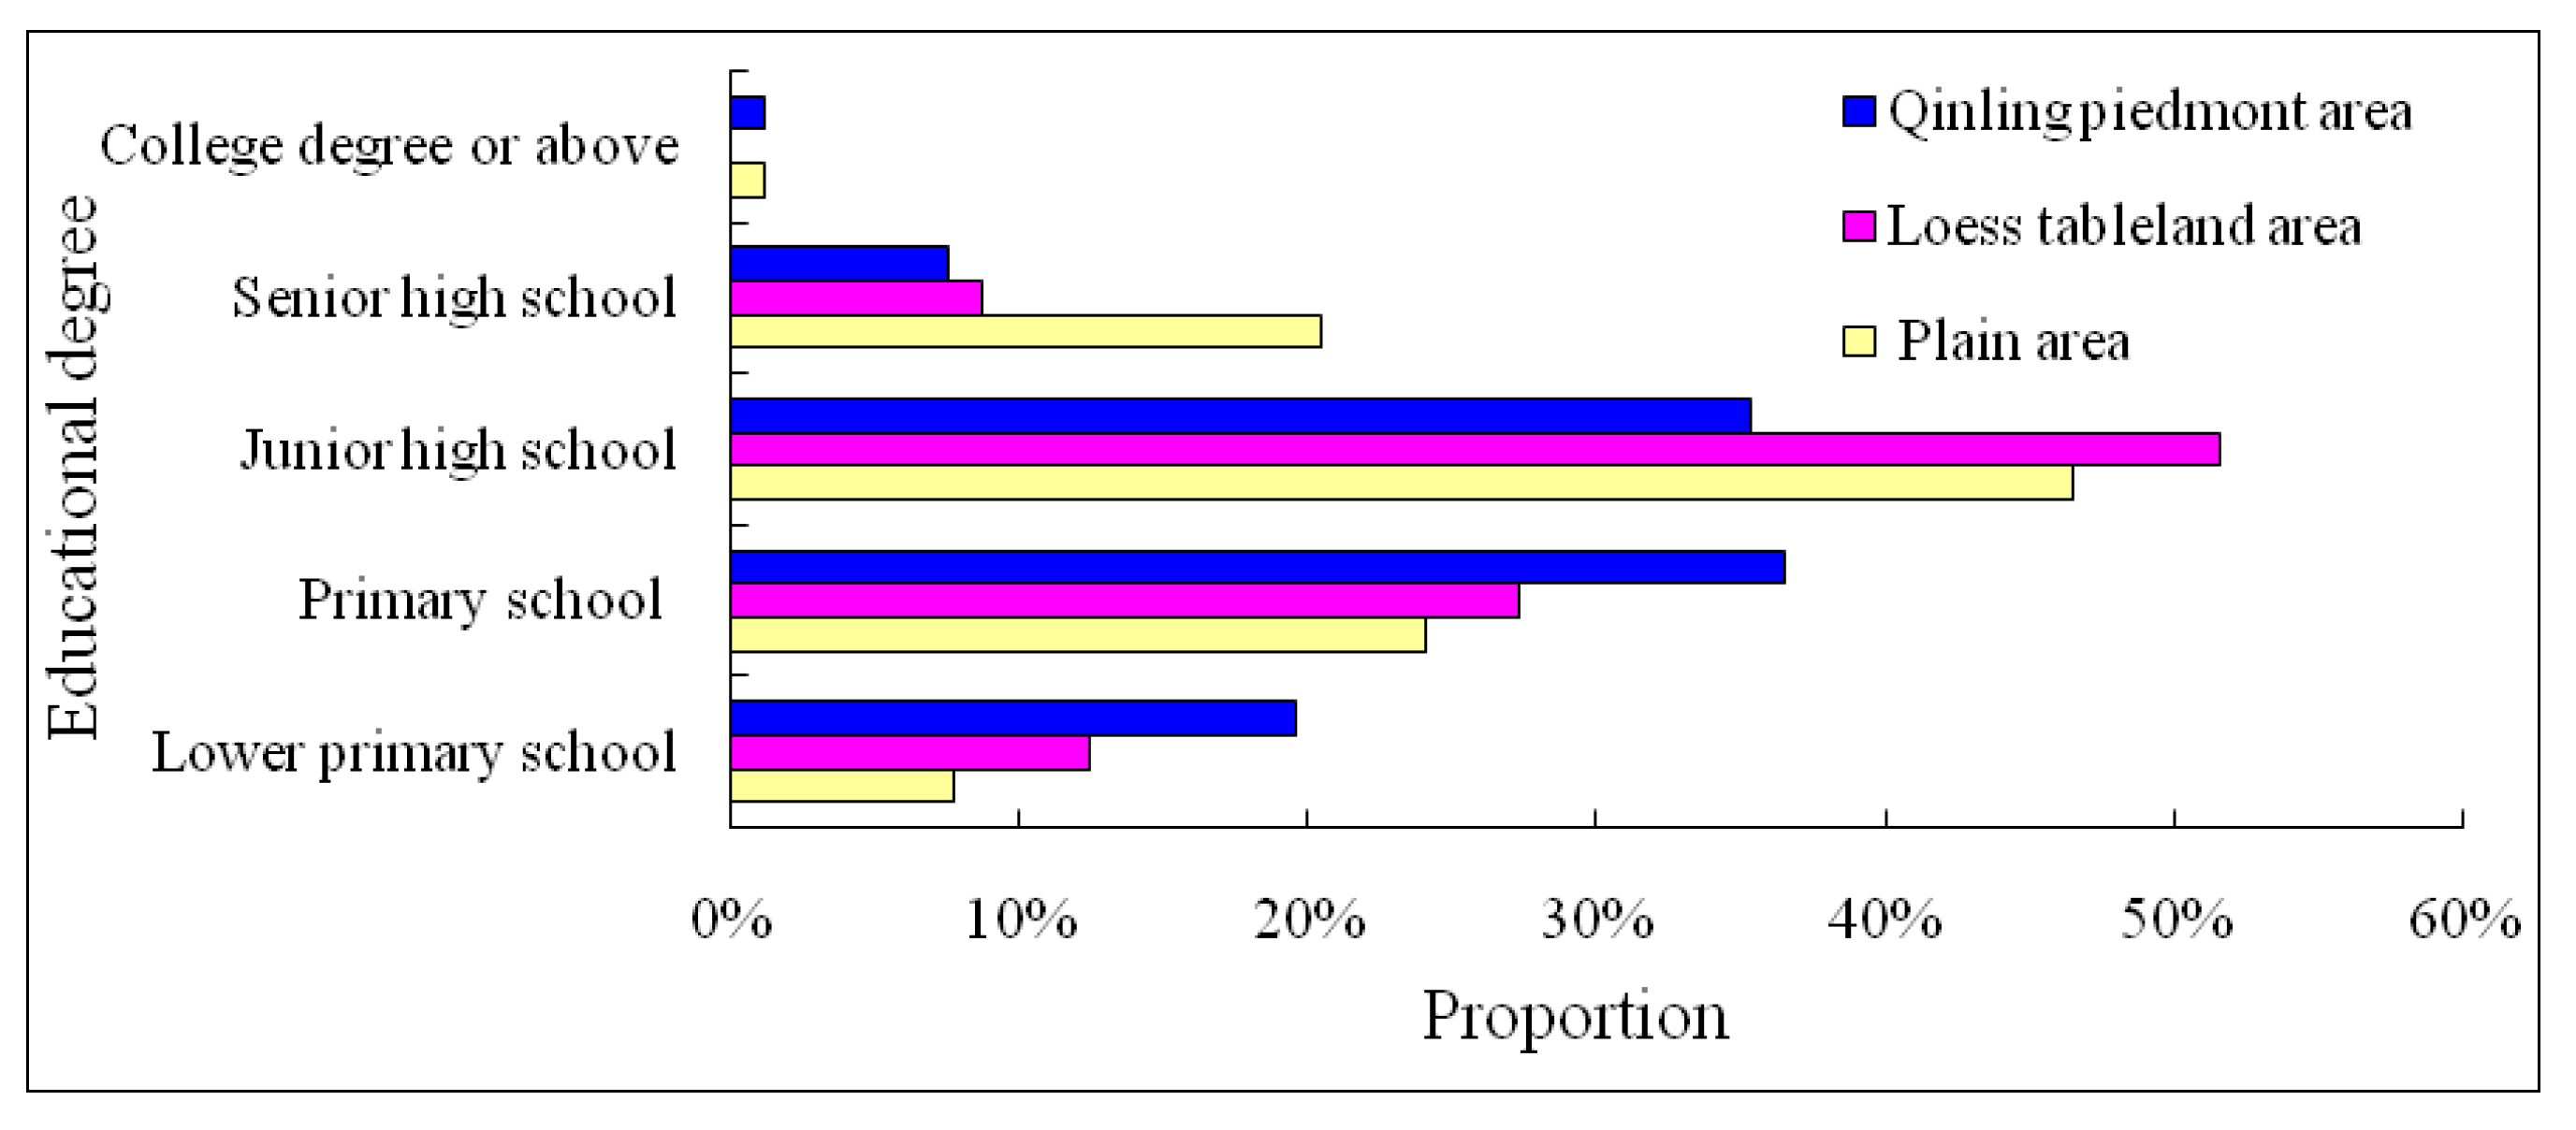
Figure 5.
Influence mechanism of disparity in emission from rural household energy consumption in different types of areas.
Figure 5.
Influence mechanism of disparity in emission from rural household energy consumption in different types of areas.

Table 1.
Physical and human geography status of the study area.
| Item | Plain Area | Loess Tableland | Qinling Piedmont Area |
|---|---|---|---|
| Terrain | flat | flat | fluctuant |
| Elevation (m) | 330 | 600 | 900~2400 |
| Irrigation conditions | superior | difficult | average |
| Traffic conditions | convenient | inconvenient | poor |
| Means of livelihood | farming and taking part-time jobs near home | farming and raising livestock | farming and working far away from home |
Table 2.
Characteristics of the household survey samples in different types of areas.
| Item | Plain Area | Loess Tableland | Qinling Piedmont Area |
|---|---|---|---|
| Sample numbers (household) | 80 | 59 | 93 |
| The percentage of sample numbers compared to total households of surveyed villages in each area (%) | 12.50 | 9.01 | 15.76 |
| Sample population (person) | 328 | 241 | 394 |
| The percentage of sample population compared to total population of surveyed villages in each area (%) | 12.15 | 8.46 | 17.59 |
| Average age | 44.24 | 44.83 | 45.96 |
| Educational degree ‘1’,‘2’,‘3’,‘4’,‘5’ | 2.83 | 2.57 | 2.34 |
| Average population for each household (person) | 4.10 | 4.08 | 4.24 |
| Per capita income (Yuan) | 7608.23 | 6075.52 | 5856.80 |
| Per capita cultivated land (hm2) | 0.107 | 0.093 | 0.053 |
| Per capita energy expenditure (Yuan) | 393.10 | 280.21 | 215.39 |
| Energy consumption per capita (kgce) | 675.22 | 720.75 | 988.57 |
| Commercial energy consumption per capita (kgce) | 202.77 | 108.65 | 78.97 |
Note: Educational degree is evaluated by the five value method: ‘1’ represents lower primary education, ‘2’ means primary education, ‘3’ is junior high education, ‘4’ is senior high education, and ‘5’ is college degree or above. Other data are the mean value of survey data.
Table 3.
Coefficient of energy conversion of standard coal equivalent.
| Item | Straw | Firewood | Corncob | Honeycomb Briquette | Coal | Electricity | Biogas | LPG |
|---|---|---|---|---|---|---|---|---|
| Conversion coefficients | 0.529 | 0.571 | 0.500 | 0.680 | 0.714 | 0.123 | 0.714 | 1.714 |
| Unit | kgce/kg | kgce/kg | kgce/kg | kgce/piece | kgce/kg | kgce/kw·h | kgce/m3 | kgce/kg |
Table 4.
Results of the statistical analysis of household energy consumption per capita in different types of areas.
Table 4.
Results of the statistical analysis of household energy consumption per capita in different types of areas.
| Item | Straw | Firewood | Corncob | Honeycomb Briquette | Coal | Electricity | Biogas | LPG | |
|---|---|---|---|---|---|---|---|---|---|
| Minimum value (kgce) | Plain | 0.00 | 0.00 | 0.00 | 0.00 | 0.00 | 7.40 | 0.00 | 0.00 |
| Tableland | 0.00 | 0.00 | 0.00 | 0.00 | 0.00 | 7.76 | 0.00 | 0.00 | |
| Mountain | 0.00 | 214.13 | 0.00 | 0.00 | 0.00 | 7.38 | 0.00 | 0.00 | |
| Maximal value (kgce) | Plain | 595.13 | 1713.00 | 255.00 | 272.00 | 952.00 | 177.10 | 83.80 | 68.56 |
| Tableland | 529.00 | 1713.00 | 153.00 | 204.00 | 357.00 | 110.70 | 301.60 | 51.40 | |
| Mountain | 1428.30 | 2569.50 | 89.30 | 226.67 | 178.50 | 147.60 | 209.50 | 43.40 | |
| Standard deviation (kgce) | Plain | 88.95 | 438.39 | 61.79 | 65.14 | 153.75 | 29.71 | 14.03 | 9.08 |
| Tableland | 120.62 | 336.81 | 30.11 | 55.50 | 42.99 | 23.38 | 95.60 | 14.09 | |
| Mountain | 209.05 | 489.62 | 19.59 | 53.92 | 54.87 | 43.85 | 38.36 | 9.88 | |
| Mean value (kgce) | Plain | 16.95 | 388.19 | 63.82 | 62.81 | 87.87 | 41.90 | 3.49 | 10.19 |
| Tableland | 50.03 | 457.33 | 36.23 | 39.00 | 15.08 | 47.31 | 68.51 | 7.26 | |
| Mountain | 58.07 | 812.60 | 26.52 | 25.32 | 10.07 | 38.91 | 12.41 | 4.67 | |
| Coefficient of variation (CV) | Plain | 5.25 | 1.13 | 0.97 | 1.04 | 1.75 | 0.71 | 4.02 | 0.89 |
| Tableland | 2.41 | 0.74 | 0.83 | 1.42 | 2.85 | 0.49 | 1.40 | 1.94 | |
| Mountain | 3.60 | 0.60 | 0.74 | 2.13 | 5.45 | 1.13 | 3.09 | 2.12 | |
Table 5.
Emission coefficients of different types of household energy.
| Item | CO2(kg/kgce) | N2O(g/kgce) | CH4(g/kgce) | NOx(g/kgce) | SO2(g/kgce) | TSP(g/kgce) | Solid Waste (kg/kgce) |
|---|---|---|---|---|---|---|---|
| Straw | 2.357 a | 0.136 b | 6.200 c | 2.439 d | 1.002 d | 14.178 e | * i |
| Firewood | 2.515 a | 0.141 b | 3.625 f | 1.226 d | 1.103 d | 10.508 e | * |
| Corncob | 2.357 a | 0.136 b | 6.200 c | 2.439 d | 1.002 d | 14.178 e | * |
| Honeycomb briquette | 2.857 g | 0.044 g | 0.029 g | 2.633 d | 26.331 d | 1.821 h | 0.382 j |
| Coal | 2.772 g | 0.044 g | 4.008 b | 2.633 d | 26.331 d | 1.821 h | 0.532 k |
| Electricity | 3.900 b | 0.057 b | 5.723 b | 2.116 b | 25.793 b | 2.548 b | * |
| LPG | 1.849 g | 0.003 g | 0.029 g | 1.371 b | 0.0004 b | * | * |
| Biogas | 1.600 g | 0.003 g | 0.029 g | 0.941 b | 0.882 b | * | * |
Note: a Emission coefficient is from Lin and Li [40]; b The coefficient is from Niu et al. [45]; c The coefficient is from Lin et al. [46]; d The coefficient is converted from Yu et al. [43]; e The coefficient is from Bond et al. [42]; f The coefficient is from Cao et al. [47]; g The coefficient is from the Intergovernmental Panel on Climate Change (IPCC) [35]; h The coefficient is from Zhang et al. [41]; i * represents that it is neglected; j It is obtained that a honeycomb briquette produces 0.26 kg solid waste by weighing practically; k Solid waste from coal consumption is calculated through the formula: solid waste total emissions = Coal consumption × average ash + Mean carbon content × the rate of being not oxidized.
Table 6.
Per capita CO2 emissions in different types of areas (unit: kg).
| Item | Straw | Firewood | Corncob | Honeycomb Briquette | Coal | Electricity | Biogas | LPG | Summation |
|---|---|---|---|---|---|---|---|---|---|
| Plain area | 39.95 | 976.30 | 150.42 | 179.45 | 243.58 | 163.41 | 5.58 | 18.85 | 1777.54 |
| Loess tableland | 117.91 | 1150.19 | 85.40 | 111.44 | 41.80 | 184.50 | 109.62 | 13.41 | 1814.27 |
| Qinling piedmont | 136.87 | 2043.69 | 62.51 | 72.34 | 27.90 | 151.76 | 19.86 | 8.63 | 2523.56 |
| Linwei District | 96.99 | 1440.47 | 100.04 | 120.76 | 109.86 | 163.85 | 36.16 | 13.50 | 2081.64 |
Table 7.
Total emissions of household energy consumption per capita in the three areas (unit: kg).
| Item | Air Emissions | Solid Waste Emission | The Total Amount of Emissions | |
|---|---|---|---|---|
| Greenhouse Gases Emission | TSP Emission | |||
| Plain area | 1786.85 | 5.61 | 70.74 | 1863.20 |
| Loess tableland | 1821.26 | 6.25 | 22.92 | 1850.43 |
| Qinling piedmont area | 2531.75 | 9.90 | 15.03 | 2556.68 |
Table 8.
Correlation between emissions from household energy consumption and household characteristics in the three areas.
Table 8.
Correlation between emissions from household energy consumption and household characteristics in the three areas.
| First Class Index | Second Class Index | Correlation | Order |
|---|---|---|---|
| Household income level | The per capita income | 0.7359 | 3 |
| The per capita cultivated land | 0.7314 | 4 | |
| Occupation | The proportion of migrant population near homes | 0.6488 | 5 |
| Educational background | The proportion of the population that completed junior high school or above | 0.7526 | 2 |
| Age structure | The proportion of elderly people | 0.7964 | 1 |
Table 9.
Age structure of permanent residents in three types of areas (unit: percent).
| Age Group | Plain Area | Loess Tableland | Qinling Piedmont Area |
|---|---|---|---|
| The young people (≤39 years old) | 33.06 | 28.57 | 30.45 |
| Middle-aged people (40~59 years old) | 44.08 | 40.37 | 34.96 |
| The elderly people (≥60 years old) | 22.86 | 31.06 | 34.59 |
© 2017 by the authors. Licensee MDPI, Basel, Switzerland. This article is an open access article distributed under the terms and conditions of the Creative Commons Attribution (CC BY) license (http://creativecommons.org/licenses/by/4.0/).
Share and Cite
MDPI and ACS Style
Wu, W.; Zhu, H.; Qu, Y.; Xu, K. Regional Disparities in Emissions of Rural Household Energy Consumption: A Case Study of Northwest China. Sustainability 2017, 9, 726. https://doi.org/10.3390/su9050726
AMA Style
Wu W, Zhu H, Qu Y, Xu K. Regional Disparities in Emissions of Rural Household Energy Consumption: A Case Study of Northwest China. Sustainability. 2017; 9(5):726. https://doi.org/10.3390/su9050726
Chicago/Turabian StyleWu, Wenheng, Hongying Zhu, Yinghao Qu, and Kaiying Xu. 2017. "Regional Disparities in Emissions of Rural Household Energy Consumption: A Case Study of Northwest China" Sustainability 9, no. 5: 726. https://doi.org/10.3390/su9050726
Note that from the first issue of 2016, this journal uses article numbers instead of page numbers. See further details here.