Article

Ground Deposition and Airborne Spray Drift Assessment in Vineyard and Orchard: The Influence of Environmental Variables and Sprayer Settings

1
Department of Agricultural, Forest and Food Sciences (DiSAFA), University of Turin (UNITO), Largo Paolo Braccini, 2, 10095 Grugliasco (TO), Italy
2
Department of Agrifood Engineering and Biotechnology (DEAB), Polytechnic University of Catalonia (UPC), Esteve Terradas, 8, 08860 Castelldefels, Spain
*
Author to whom correspondence should be addressed.
Sustainability 2017, 9(5), 728; https://doi.org/10.3390/su9050728
Submission received: 8 March 2017 / Revised: 27 April 2017 / Accepted: 28 April 2017 / Published: 3 May 2017

Abstract

:
Spray drift assessment encompasses classification of the capacity of each sprayer/technology/setting combination to reduce or avoid the spray drift risk, as well as drift measurement to define buffer zones mandated during pesticide application. Compounding the challenge of these tasks is the great variability of field evaluation results from environmental conditions, spray application technology, canopy structure, and measurement procedures. This study, performed in Spanish context, evaluates the effects of different parameters on comparative measurements of ground and airborne spray drift employing the ISO22866:2005 protocol. Four configurations of air blast sprayers, derived from two fan airflow rates and two nozzle types (conventional and air-induction), were tested in orchard and vineyard at late growth stage. Spray drift curves were obtained, from which corresponding Drift Values (DVs) were calculated using an approximation of definite integral. Both sprayer settings and environmental variables statistically affect spray drift total amounts and result variability. PCA analysis showed that nozzle type and wind speed characteristics explained 51% and 24% of the variance, respectively. In particular, mean wind direction influence ground sediments (Pr < 0.01) and maximum wind speed strongly influence airborne drift value (Pr < 0.0001). The wind characteristics concealed the influence of adopted fan airflow rates on final spray drift assessment results. The effect of uncontrollable environmental conditions makes objective and comparative tests difficult.

1. Introduction

An important goal in pesticide application is adequate deposition on the entire canopy according to treatment specifications. Highly efficacious and efficient spray application could simultaneously increase the benefits of plant protection products (PPP), reduce the risk of environmental contamination, and produce higher quality food in a more sustainable agriculture. Spray drift continues to be a major challenge when applying agrochemicals because pesticides deposited in undesirable areas may pose risks to both the environment and bystander [1].
Agriculture is already a major contributor to water pollution from nitrates, phosphates and pesticides [2]. The 2009/128/EC European Directive for Sustainable Use of Pesticide [3] represents bedrock EU legislation for all improvements pertaining to drift reduction and efficiency of pesticide application, including an overall definition and requirement for dedicated buffer zones [4]. Each EU Member State (MS) specifies the characteristics of these zones in its National Action Plan (NAP). Among the technical information contained in the NAP, minimum buffer zone widths and their relationship to different spray application techniques must also be delineated (in terms of drift reduction or avoidance capacity). These requirements clearly indicate that drift measurement methodologies and classification schemes unique to each sprayer/technology, based on potential contamination risk, are essential tools.
According to ISO22866:2005 [5], drift is defined as “the quantity of plant protection product that is carried out of the sprayed area (treated) by the action of air currents during the application process”. In an orchard, this includes droplets that move horizontally through the orchard canopy and beyond the orchard, as well as those above the canopy (via direct spraying into the air or upward diffusion from the sprayed canopy) that move vertically into the atmosphere. Some authors quantify that, during one spray application, 30 up to 50% of the amount of PPP spray mixture applied can be lost to the air from targeted site to non-target receptor site [6]. In addition to the more localized movement of agrochemical residues in turbulent air masses downwind of application, they can also become concentrated in inversions or stable air masses and be transported at long distances [7]. Thus, during and immediately after spray application non-target receptors including water [8], plants [9] and animals [10,11,12,13] can be exposed acutely and may therefore face the risk of adverse effects. Thus, drift may cause damage to non-target plants, contaminate water courses, result in illegal residues in food and feed commodities [14] and cause adverse animals and humans exposure [7,15].
Spray drift is strongly influenced by many factors that fall into four categories [16]: equipment and application techniques, PPP and spray characteristics, operator care and skills [17] and environmental and meteorological conditions. In recent years, several studies have evaluated and quantified the effect of different factors involved in spray drift [1,17,18,19,20,21,22]. Some countries have invested considerable effort into classifying particular sprayers and techniques as spray drift reduction solutions [23]. Such work is complicated by the great variability of results achieved from spray drift measurements undertaken in field conditions, due to the influence of weather conditions [21,24,25,26,27]. While the influence of environmental factors has long been studied, the relative importance of factors is not yet definitively understood, as demonstrated by the different factors named at one time or another as most important in drift process studies: droplet size distribution [28], air temperature and humidity [29], horizontal wind speed [22,30], and atmospheric stability [20,31,32]. Nonetheless, since 1959, droplet size distribution and wind behavior have been consistently recognized as important drift process factors [33], with higher wind speeds resulting in higher spray drift amounts.
Spray drift assessments are typically mandated in PPP regulatory evaluations at the level of European country and zone, in which field trial results commonly serve as the source for PPP registration purposes [34]. Spray drift field measurement should follow the standardized protocol established by ISO22866:2005 [5], which employs a complicated and time-consuming set of experiments [35,36,37,38,39] that depend highly on external factors. On the other hand, field drift studies can also be conducted using a range of reference conditions, such as wind characteristics, humidity, temperature, sprayer adjustment, and so on. As expected, assessment outcomes vary with the standard reference conditions chosen for testing [40]. Moreover, field experiments using different spray systems cannot be performed under identical and perfectly repeatable conditions [5] due to the nature of environmental conditions. While it is reasonable to obtain information on the driftability of a specific sprayer configuration, the wide variation in test results makes them unsuitable for establishing any ranking or classification [41]. Therefore, differences in drift reduction capability of spray technology are generally determined only through many test replicates made under similar conditions and pair-wise comparison. The fall-out drift can, in some cases, differ by as much as a factor of 10 for the same nozzle size and working pressure [17], a difference that may be attributed to weather conditions, spray application technology, and/or different measurement procedures [1]. Whereas it is commonly agreed that crop type and canopy growth stage is primarily related to the spray drift amount [42]. Likewise, it is clear that spray drift amount also depends on the complex of architecture (e.g., pruning and training technique) and geometry of cultivation [43,44,45].
Until now, various studies have proposed alternative drift measurement methods that target easy, repeatable, and precise procedures. Among these has been a focus on drift measurements and drift classification of field crop sprayers [1,46,47,48,49]. Studies have also investigated a wide range of variables: droplet characteristic and drift value relationships [50], horizontal and vertical boom movement relative importance, boom length effects on drift value [51], fall-out drift measurement variability due to weather conditions, spray technology differences, and measurement procedure differences [17]. Researchers have proposed the following as the main easy, repeatable, and precise methods as alternatives for drift measurement based on spray drift potential: Phase Doppler Particle Analyzer (PDPA) laser measurement [52,53,54,55,56,57,58], wind tunnel measurement [59,60,61,62,63,64,65], and ad hoc test bench measurement [25,50,66,67,68,69].
Concurrently, many authors turned to computer models and mathematical simulations to complement field tests and to consider the constant change in environmental variables and technical conditions over time and in space. Indeed, plume models [70,71,72] and droplet trajectory models were developed to predict drift from boom sprayers [73,74,75,76] or from turbulent flow (orchard sprayers) [44,77,78,79,80]. Alternative drift measurement methods and mathematical/computational models to determine pesticide droplet transport certainly simplifies test and field evaluation; however, detailed characterization of the agricultural environment, with temporal and spatial variations, is still necessary. Drift values under realistic conditions can only be obtained by means of field drift experiments [81].
The difficulties that arise during application of the standardized test protocol [5] for field drift measurement are magnified in the case of field evaluation trials in arboreal crops. High heterogeneity of cultures (olive trees, vineyard, fruit orchards, citrus, and others) amongst wide variation in canopy structure and dimension during crop season [19] demand wide flexibility in spray technology and operative sprayer parameter selection during the application process (such as, nozzle type, working pressure, forward speed, and air assistance), and make it difficult to establish an objective and broadly applicable drift measurement method for these crops [82,83,84,85], as described by Llorens et al. [86] and Ravier et al. [38] in their work to obtain objective and reproducible results during application under the stringent requirements of ISO22866:2005. Similarly, drifting spray is a complex problem in which equipment design and application parameters, spray physical properties and formulation, and meteorological conditions interact and influence pesticide losses [87].
Irrespective of the large list of variables affecting spray drift during spray application, it is necessary to evaluate and clarify the objectiveness, effectiveness, and repeatability of the actual ISO 22866:2005 standard [5] to evaluate the performance of Spray Drift Reducing Technologies (SDRTs) in terms of spray drift reduction benefit achievable. The adoption of SDRTs (e.g., low drift nozzles, reduction of fan air volume, etc.) could benefits farmers to reduce the mandatory buffer zones [3,4] width as a function of spray drift reduction performance obtained by a given SDRT [88]. Thus, the use of proven effective SDRTs in reducing spray drift could minimize the amplitude of no-spray buffer zone areas to be adopted, highly improving the crop profitability [89] but at the same time satisfying the balance between farmer profit and sustainability, both for environment, animal and human health.
Within this context, this study aimed to evaluate and quantify the effect of different parameters involved in ground and airborne spray drift generation in vineyard and orchard spray application. The evaluation used field trials in vineyard and apple tree orchard under the standardized test methodology of ISO22866:2005. In particular, the study focused on quantifying the influence from controllable variables (sprayer setting parameters) and from external non-controllable variables (environmental conditions).

2. Materials and Methods

2.1. Tests Location and Crop Characterization

Tests were performed in two crops: (a) vineyard located in Penelles, Lleida, NE Spain (41°43′05″ N 0°57′46″ E); and (b) apple tree orchard located in La Fuliola, Lleida, NE Spain (41°43′32″ N 0°59′23″ E).
The vineyard tests were carried out in an espalier-trained vineyard (cv: Tempranillo) at growth stage BBCH 83 “Berries developing colors” [90,91]. Planting distances were 2.8 m between rows and 1.2 m in rows to result in a density of 2976 vines ha−1. The average vine height was about 1.6 m, with the leaves and grape band occupying the zone above ground between 0.8 and 1.6 m.
Apple orchard tests were conducted in an espalier-trained apple tree orchard (cv: Golden Delicius) at growth stage BBCH 81 “Beginning of ripening: first appearance of cultivar-specific color” [90,92]. In this case, the between row and in row distances were 4 m and 1.2 m, respectively, for a density of 2083 trees ha−1. The average apple tree height was about 3.4 m.

2.2. Experimental Plot Design

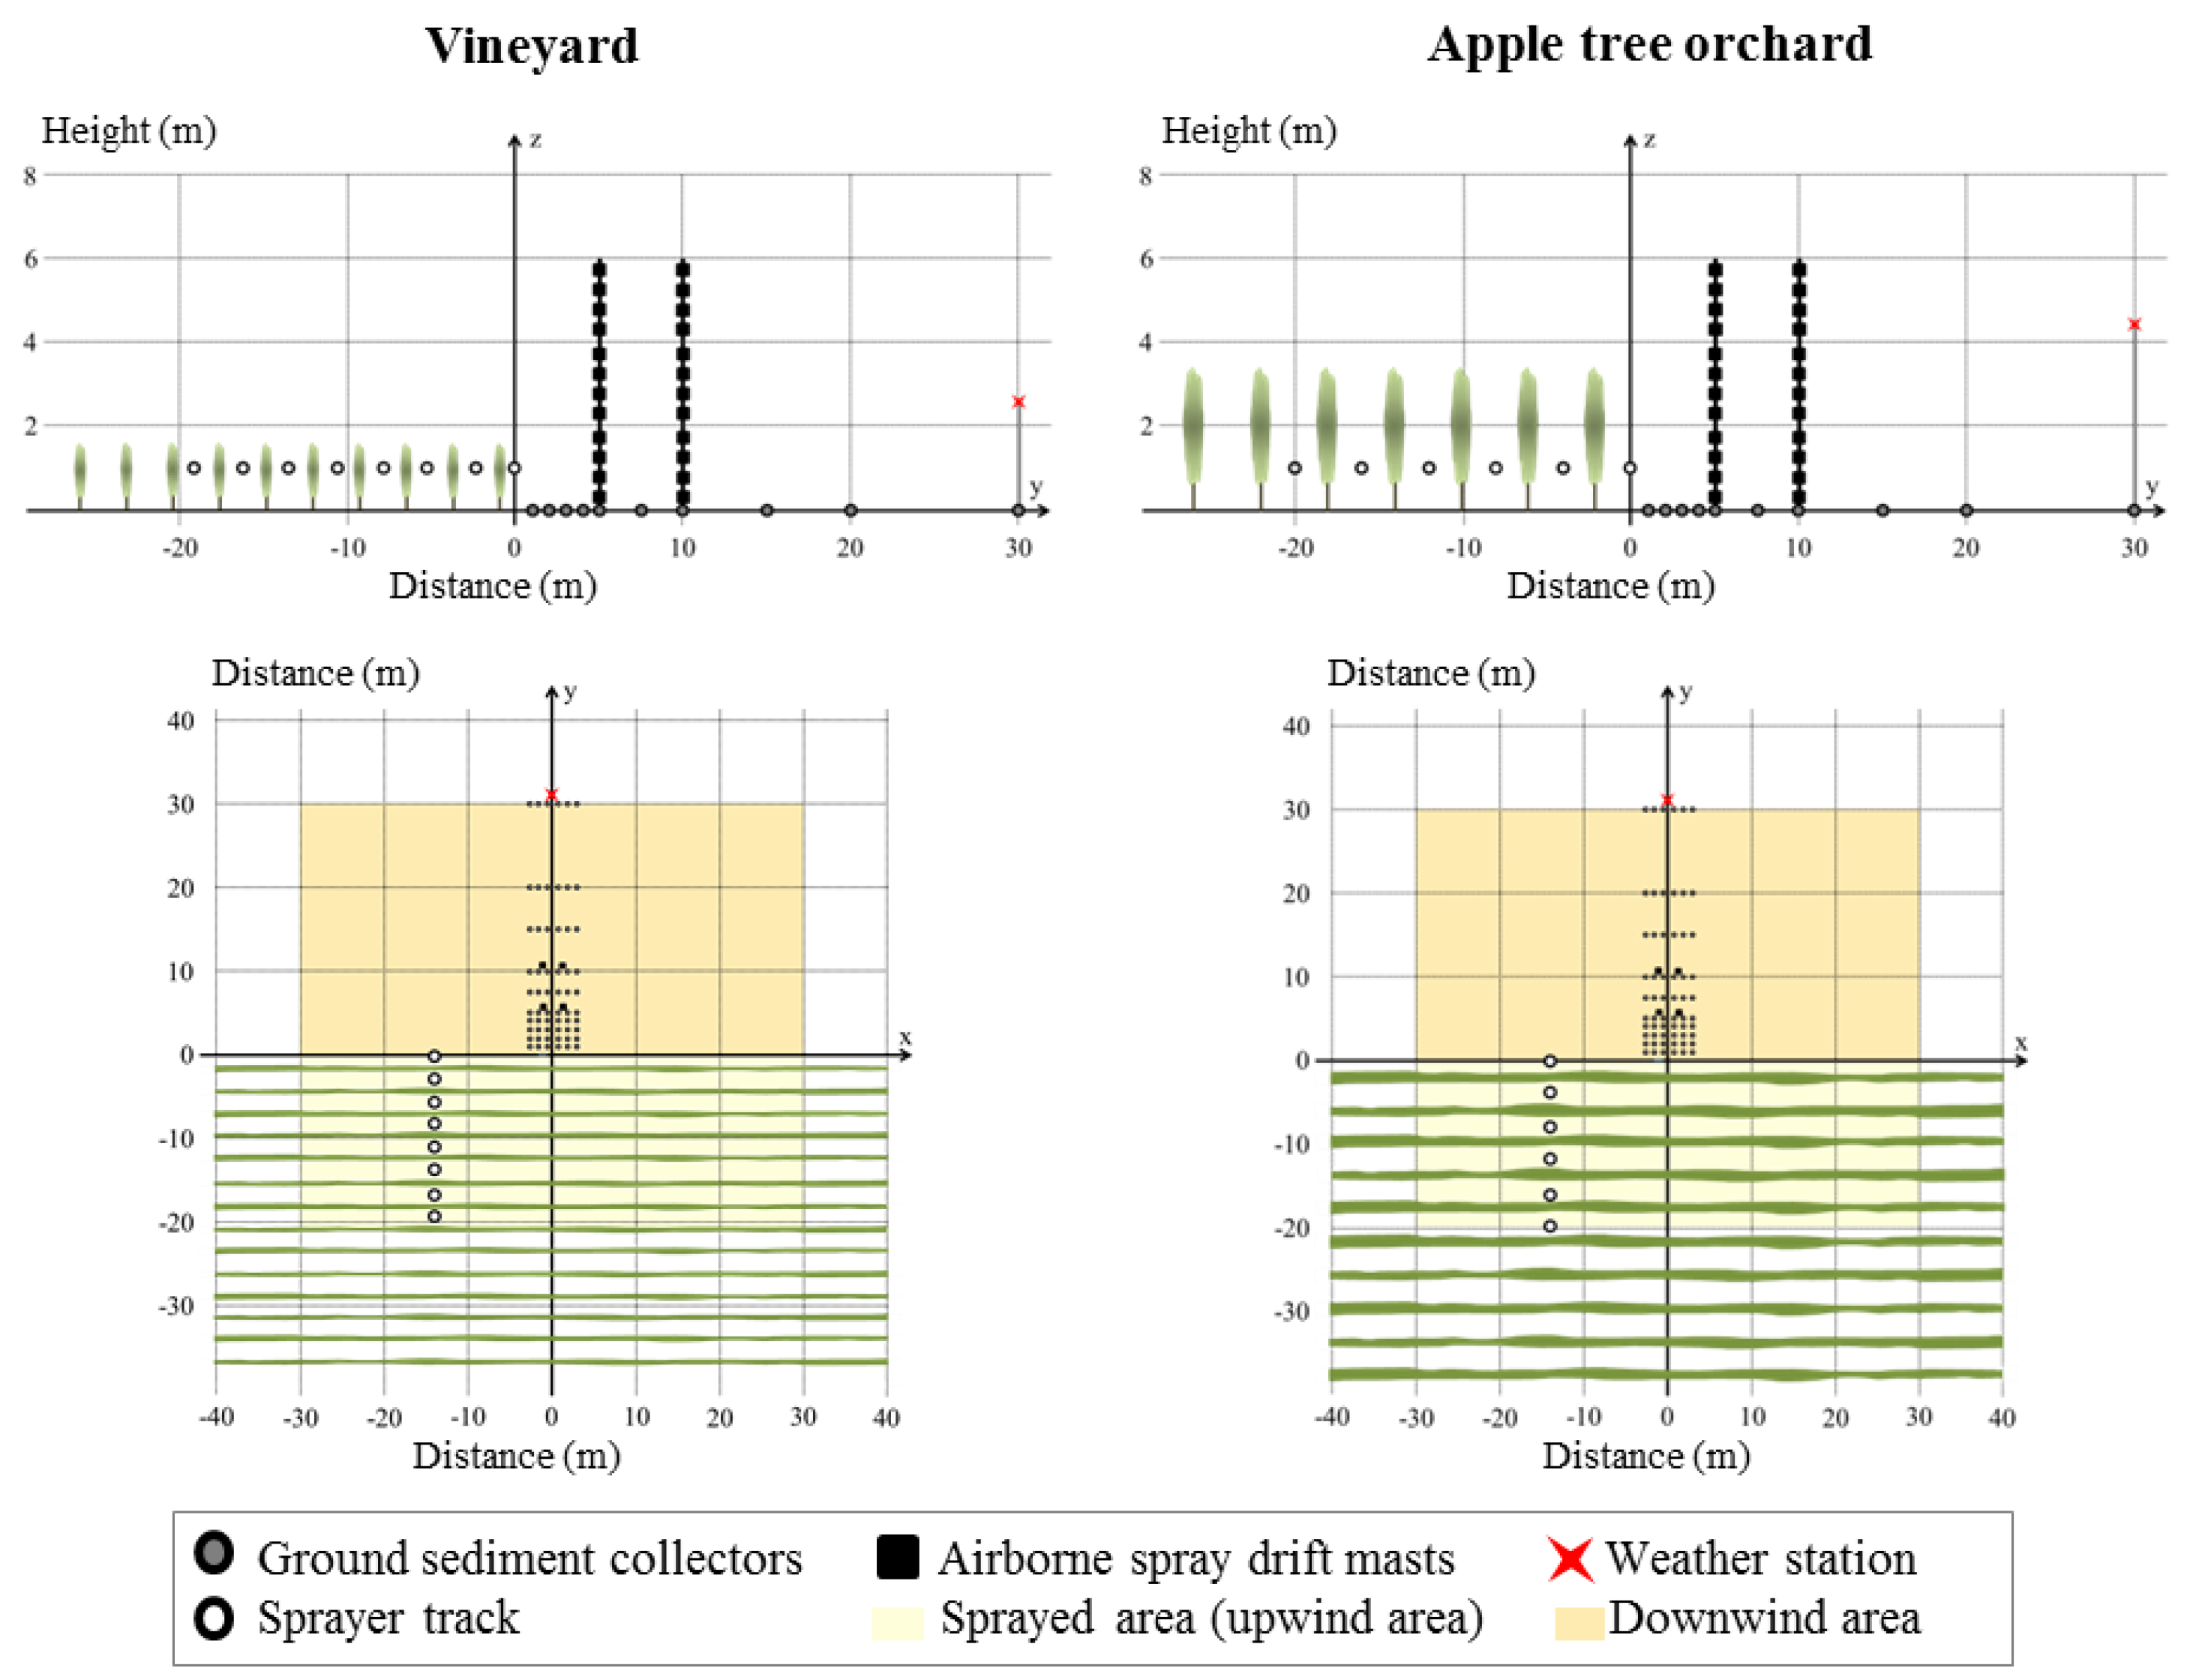
To assess the amount of spray drift generated during spray application in both crops, the test methodology described in ISO22866:2005 [5] for field measurements of spray drift was followed. The methodology prescribes that the directly-sprayed area has to be a minimum of 20 m wide and located immediately upwind of the edge of the cropped area and 60 m spray track (twice the largest downwind sampling distance). Accordingly, vineyard tests were performed by spraying the eight outer downwind rows (two sides of the first seven rows starting from the edge of the upwind area and only a single side of the eighth row) equal to a surface of 1260 m2 (60 × 21 m) and apple orchard tests were made by spraying the five outer downwind rows equaling a surface of 1200 m2 (60 × 20 m) (Figure 1).
Each replicate involved sampling both ground and airborne spray drift downwind to the directly sprayed area. For the ground sediment spray drift assessment, ten bare-soil sampling locations at distances of 1, 2, 3, 4, 5, 7.5, 10, 15, 20, and 30 m downwind from the directly sprayed area were identified. At each location, six discrete ground level horizontal samplers (Petri dishes, 14 cm diameter and placed at distance of 1 m from each other) were employed to yield a total collection area of 924 cm2 at each downwind location (
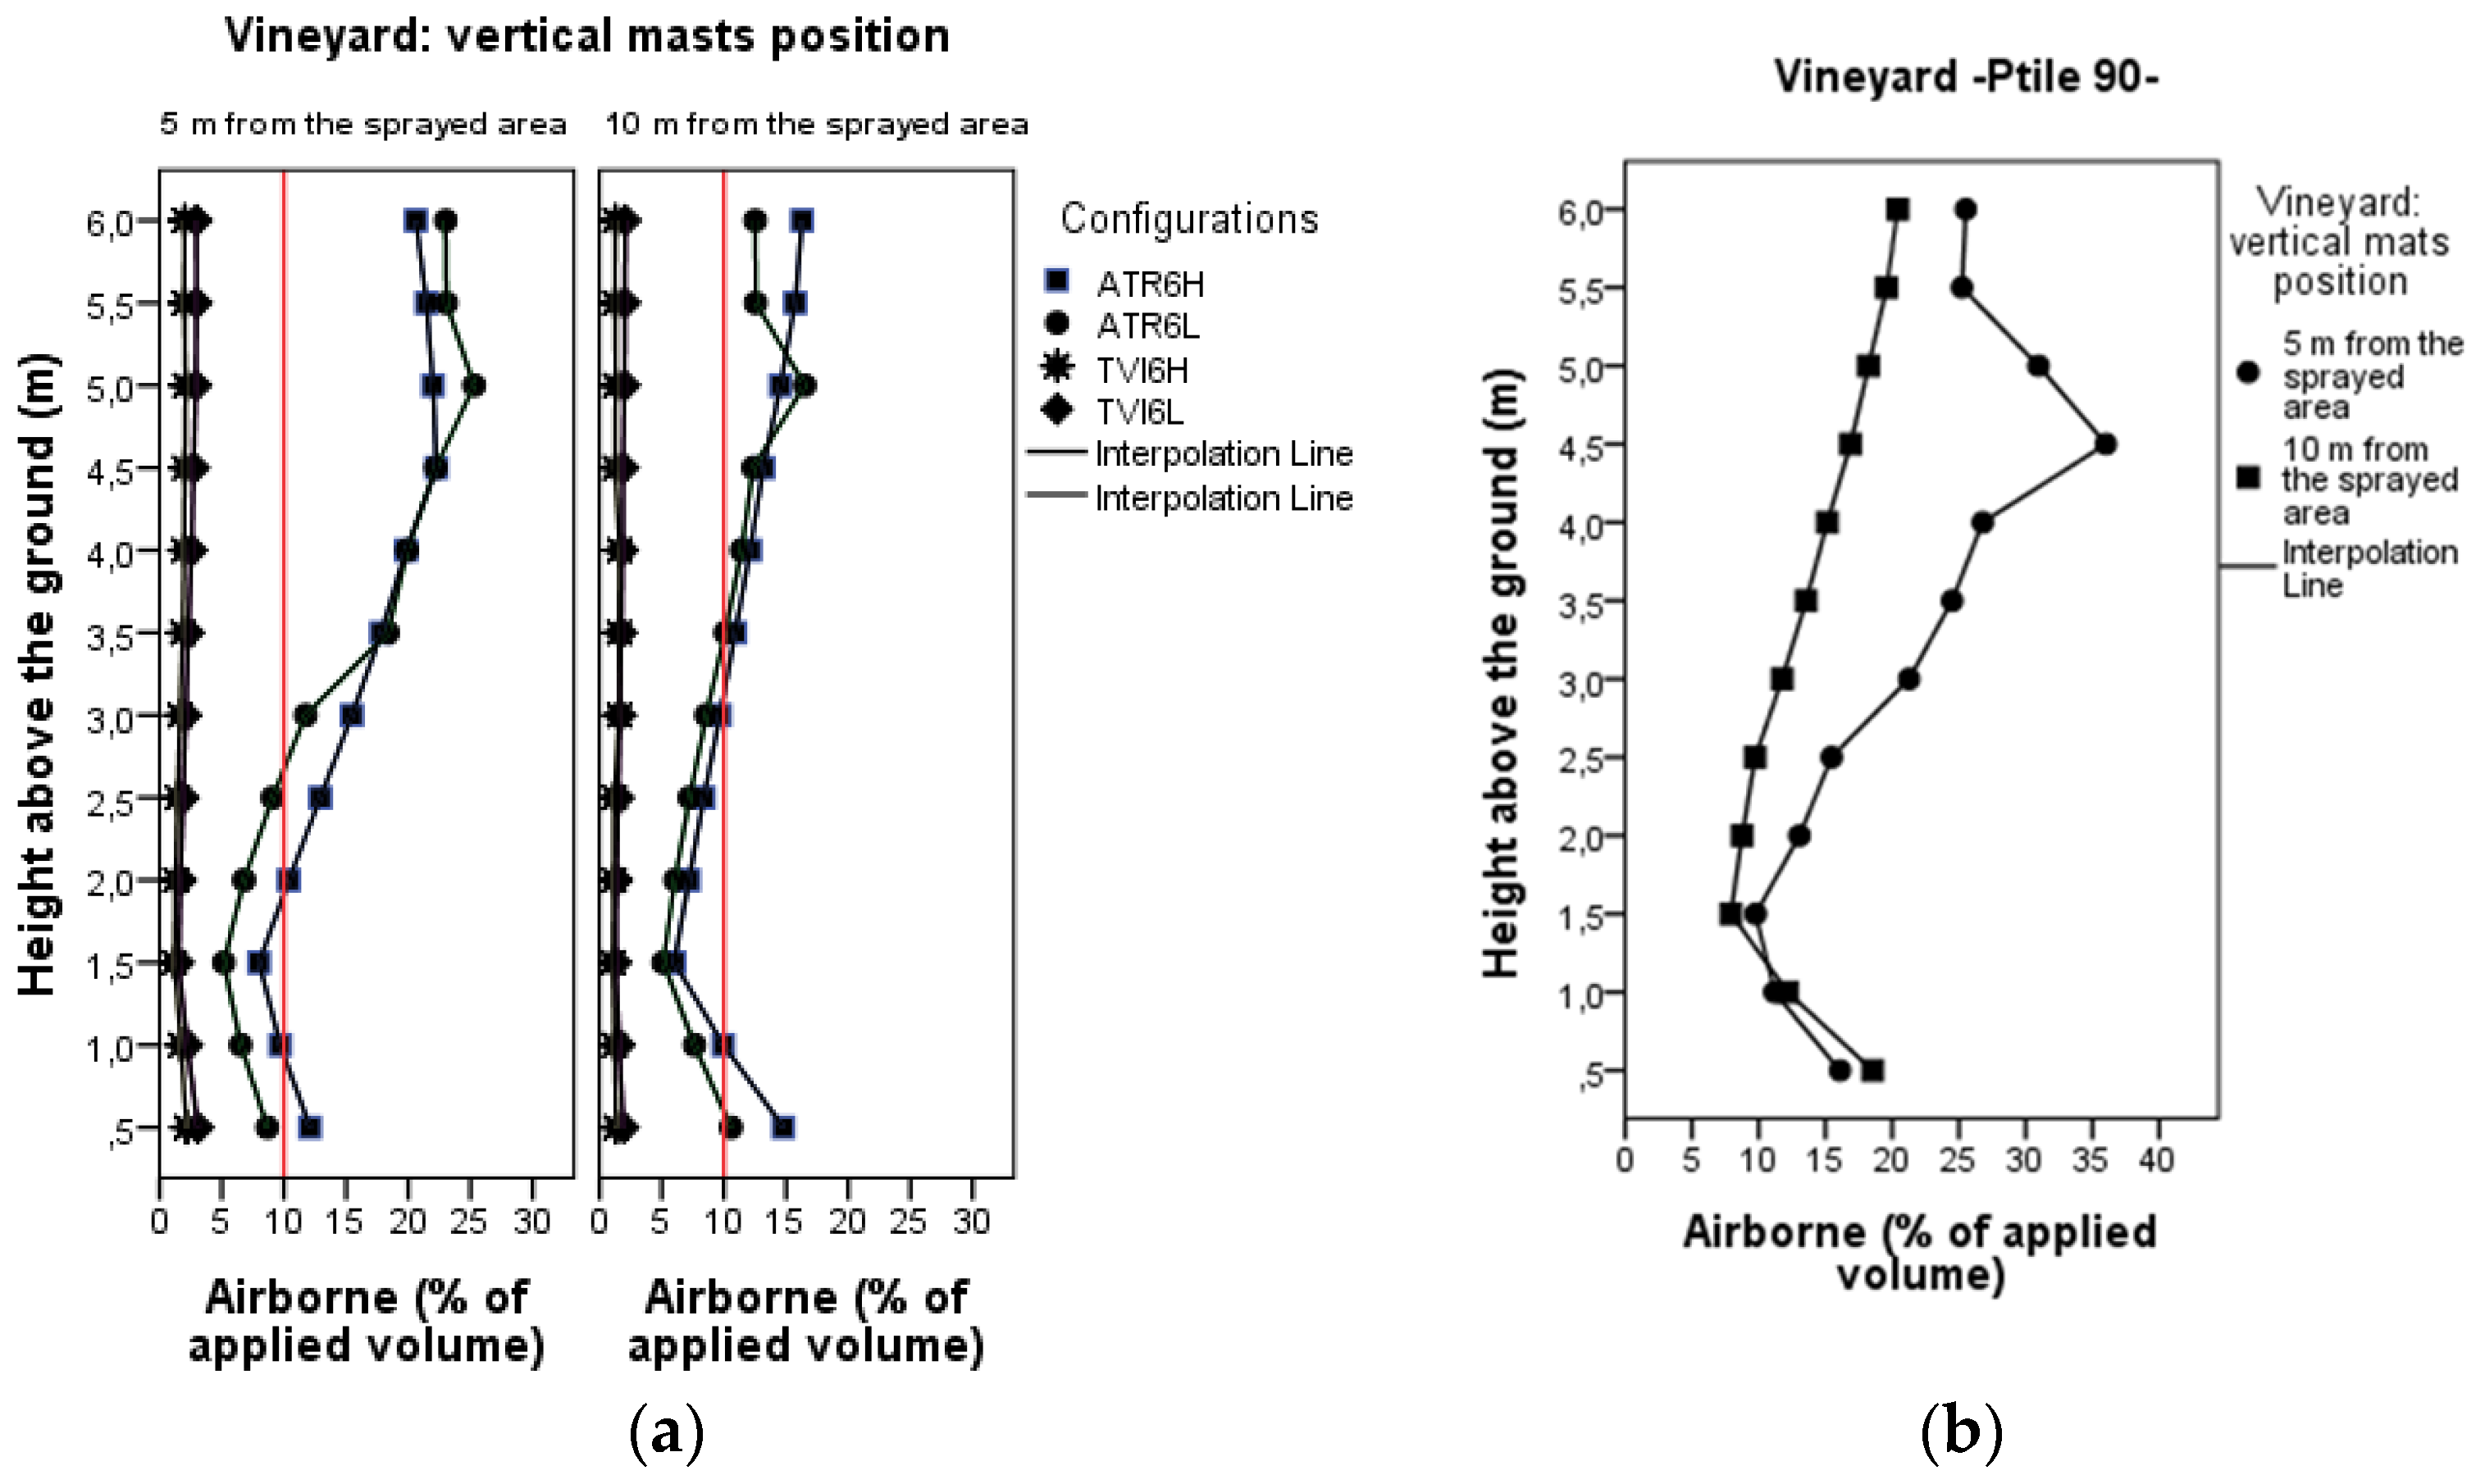
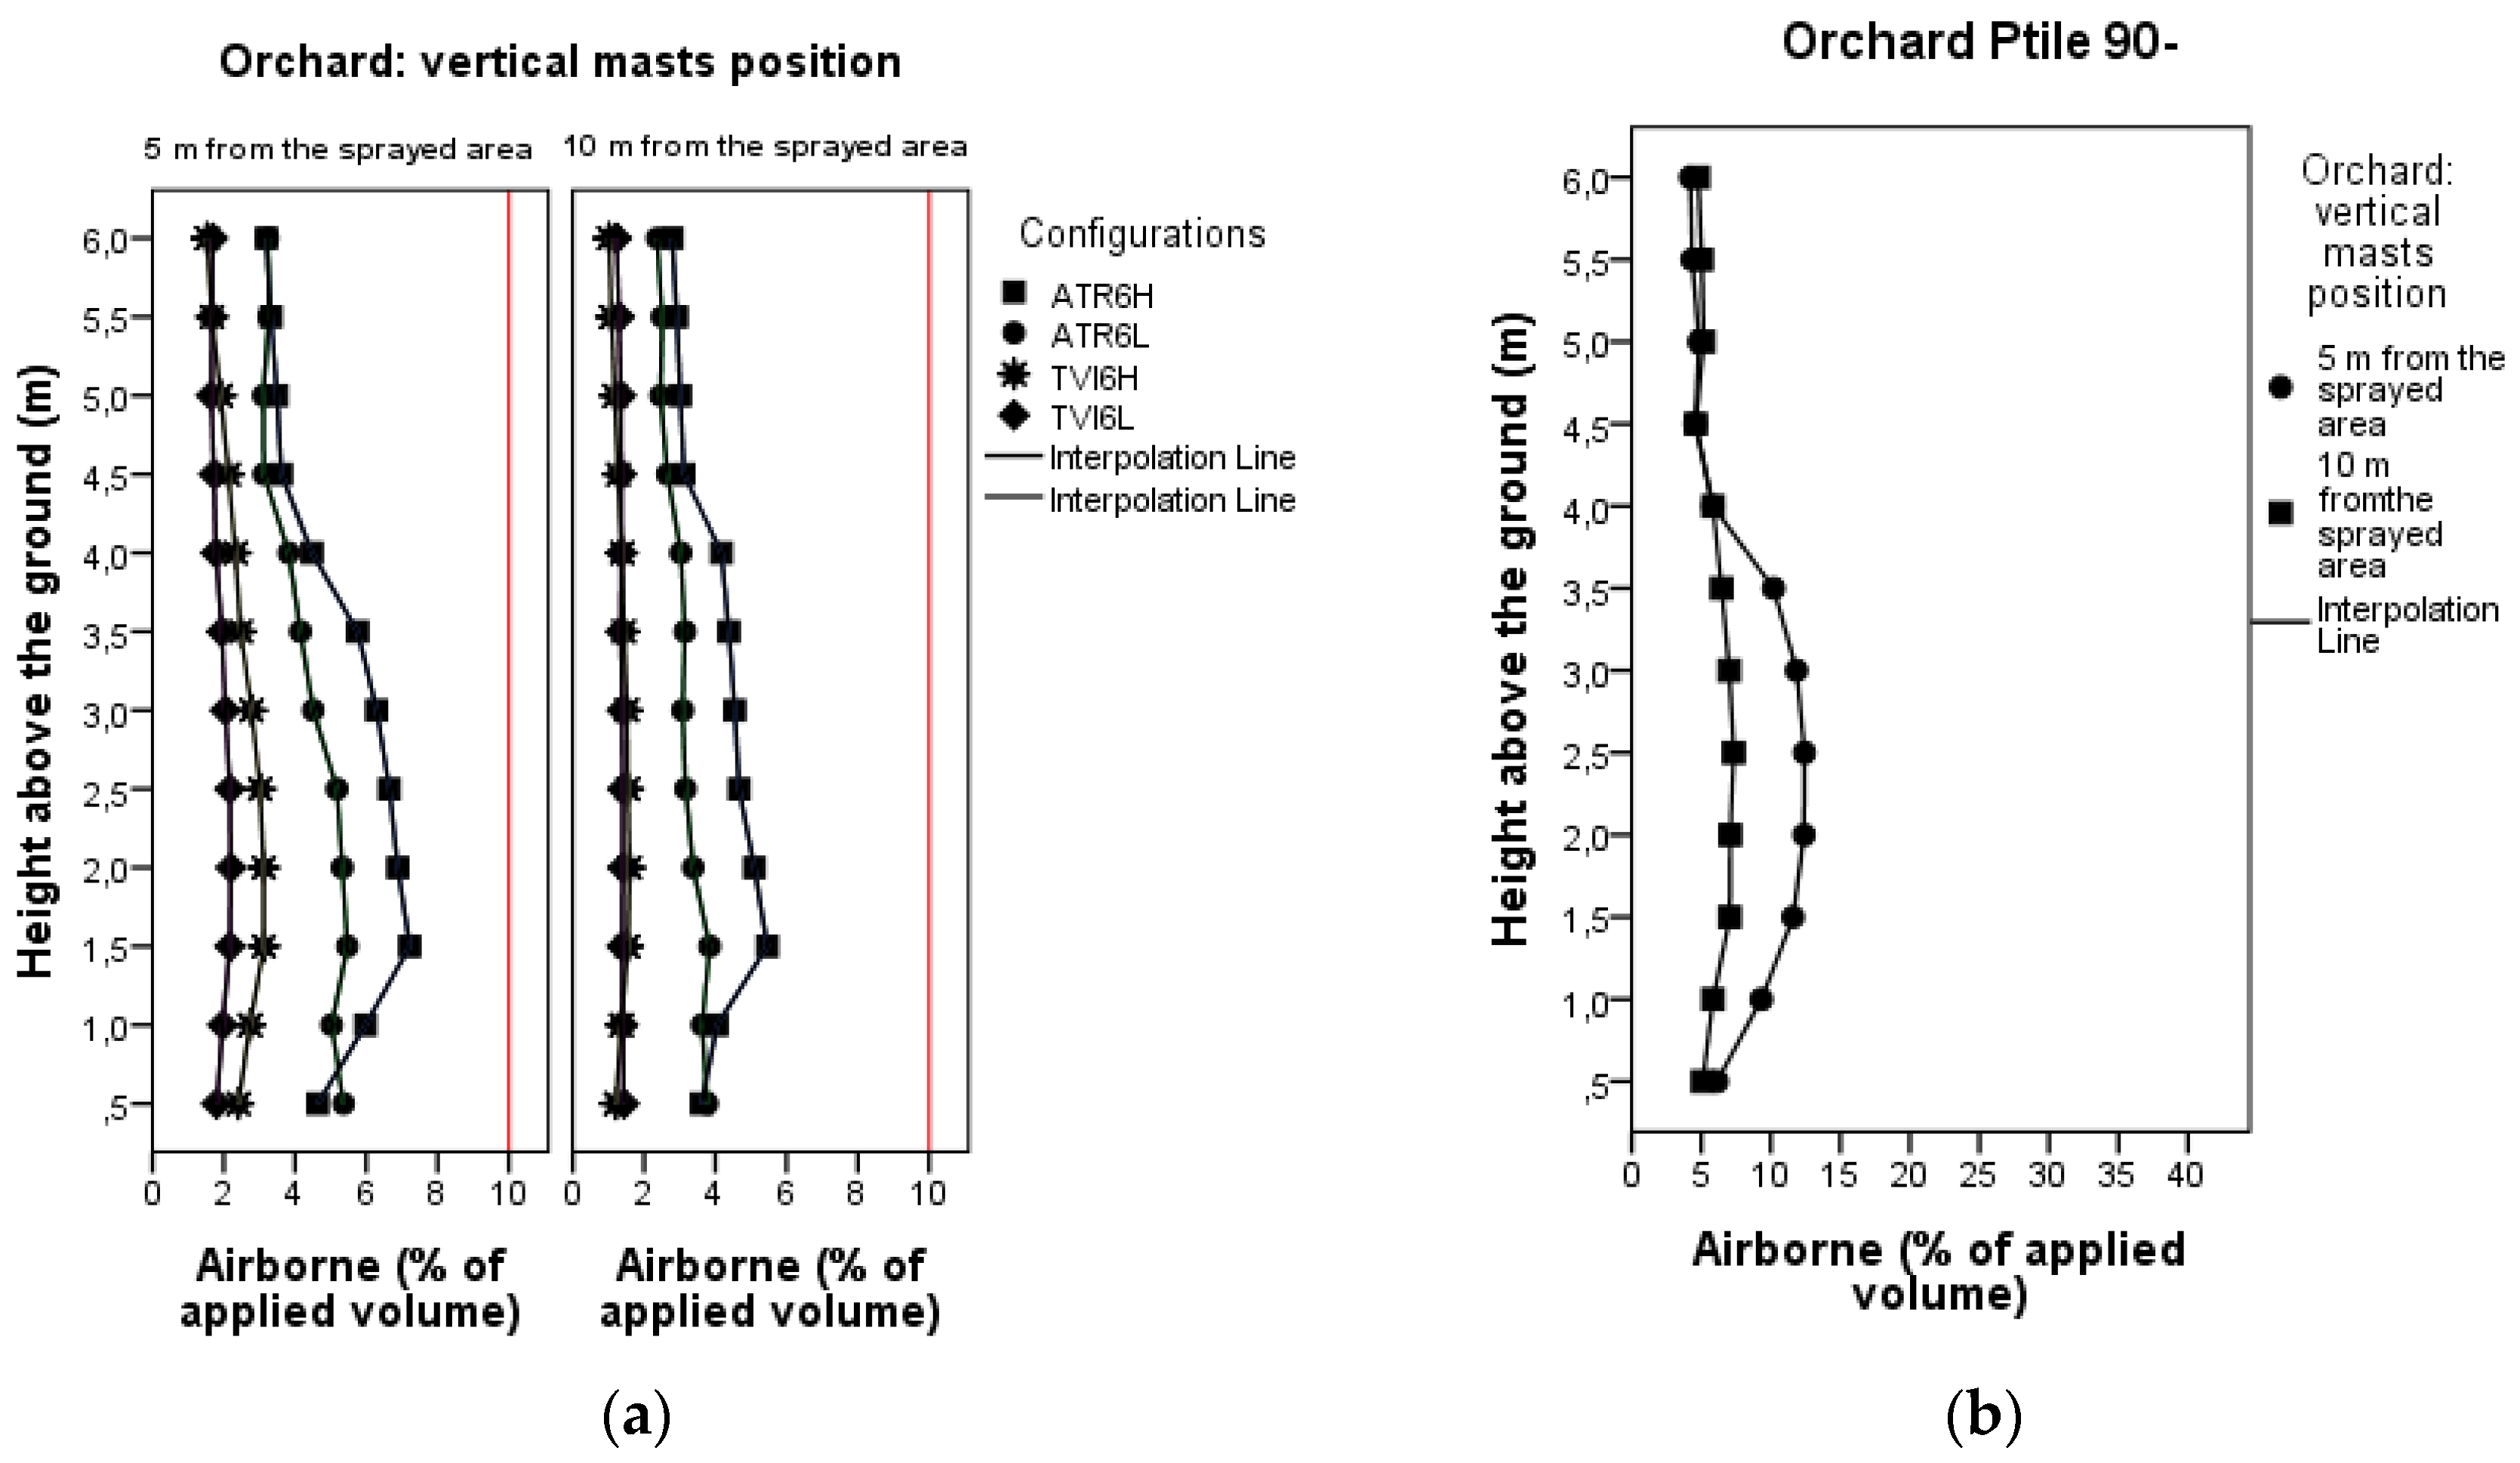
Figure 1). Airborne spray drift measurements were taken at two distances (5 and 10 m) downwind from the edge of the directly sprayed area, with two continuous vertical samplers (Polyethene lines 6 m high and 2 mm in diameter) at each distance. Each continuous vertical sampler was utilized like an array of twelve sampling collectors (sampled discretely), considering each collector as a Polyethene line 0.5 m long and 2 mm in diameter (Figure 1). Therefore, each collector was characterized by 31.4 cm2 of collection area.
After a 60 s test, the sprayed Petri dishes were covered and each 6 m Polyethene line was cut into sections of 0.5 m, each considered as a single sample, and then collected. Each sample was stored individually in a sealed plastic bag. Finally, all samples were collected in closed dark boxes to prevent light degradation.

2.3. Weather Conditions during Trials

Following ISO22866:2005 [5], a weather station was mounted close to the test area. A mast supporting sensors was placed at least 1 m above the canopy to ensure a distance more than 2 m above the ground. The mast was placed at the edge of the downwind area in the center of the drift sampling area (30 m from the sprayed area) (
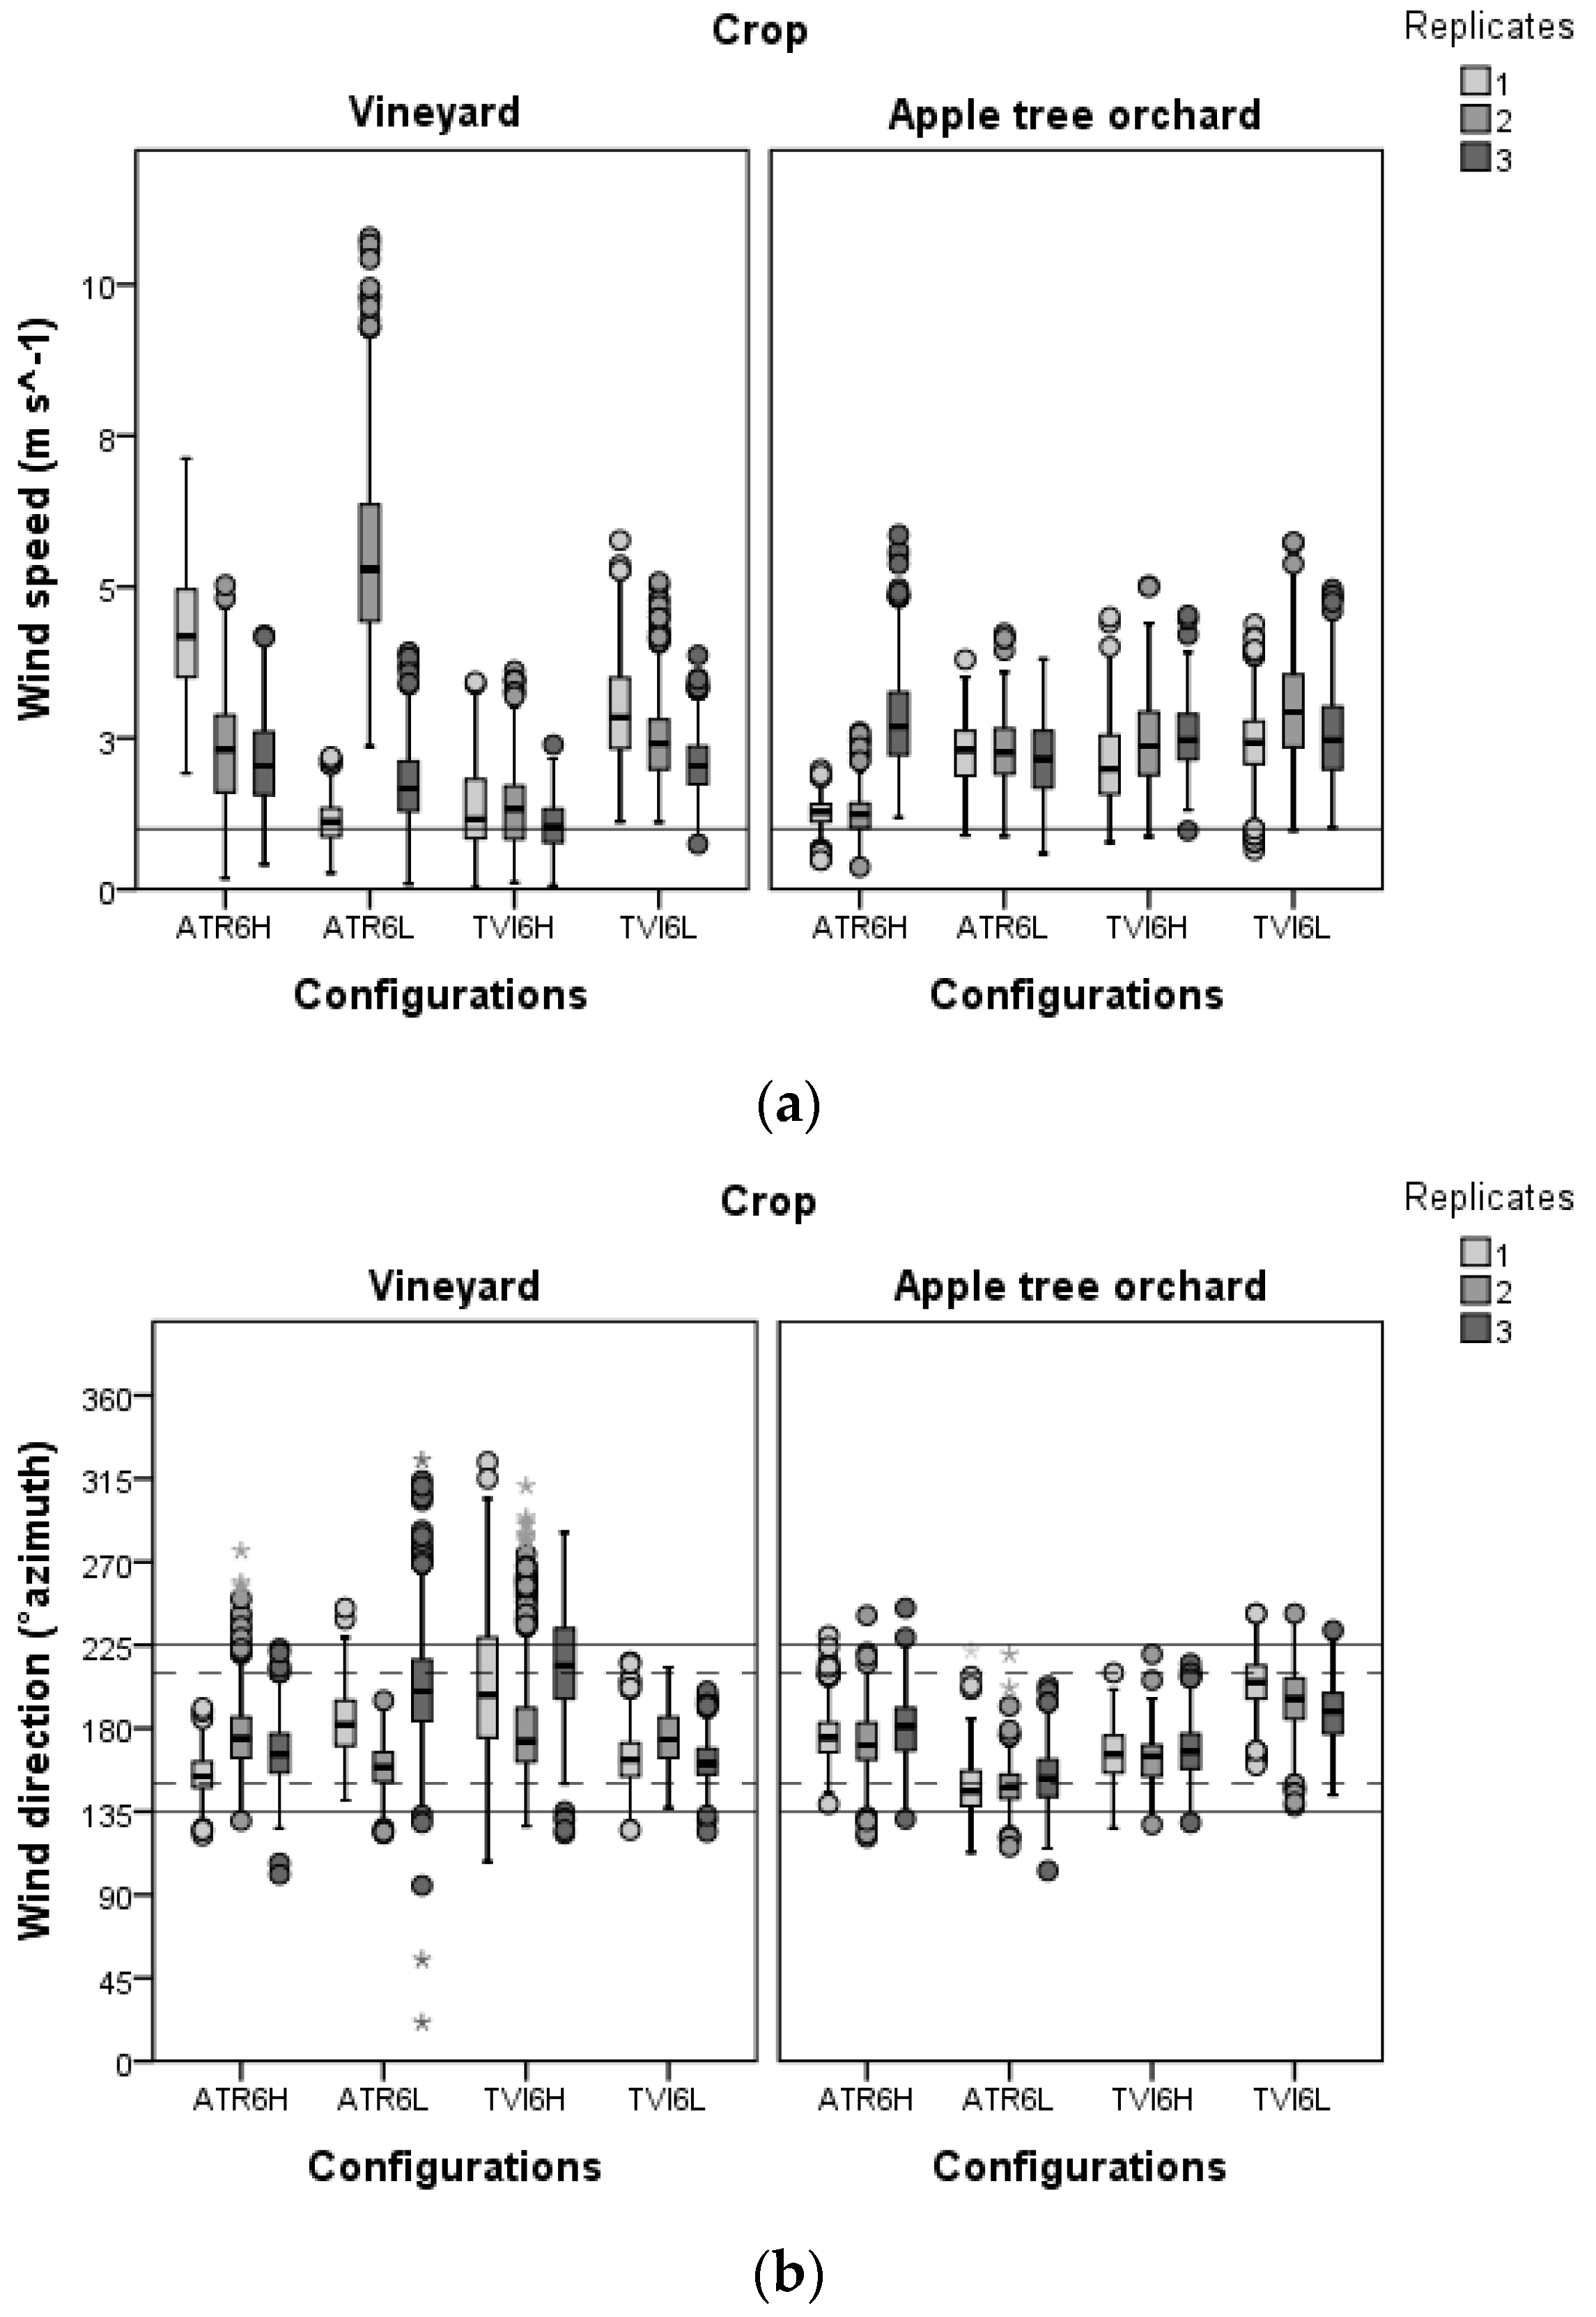
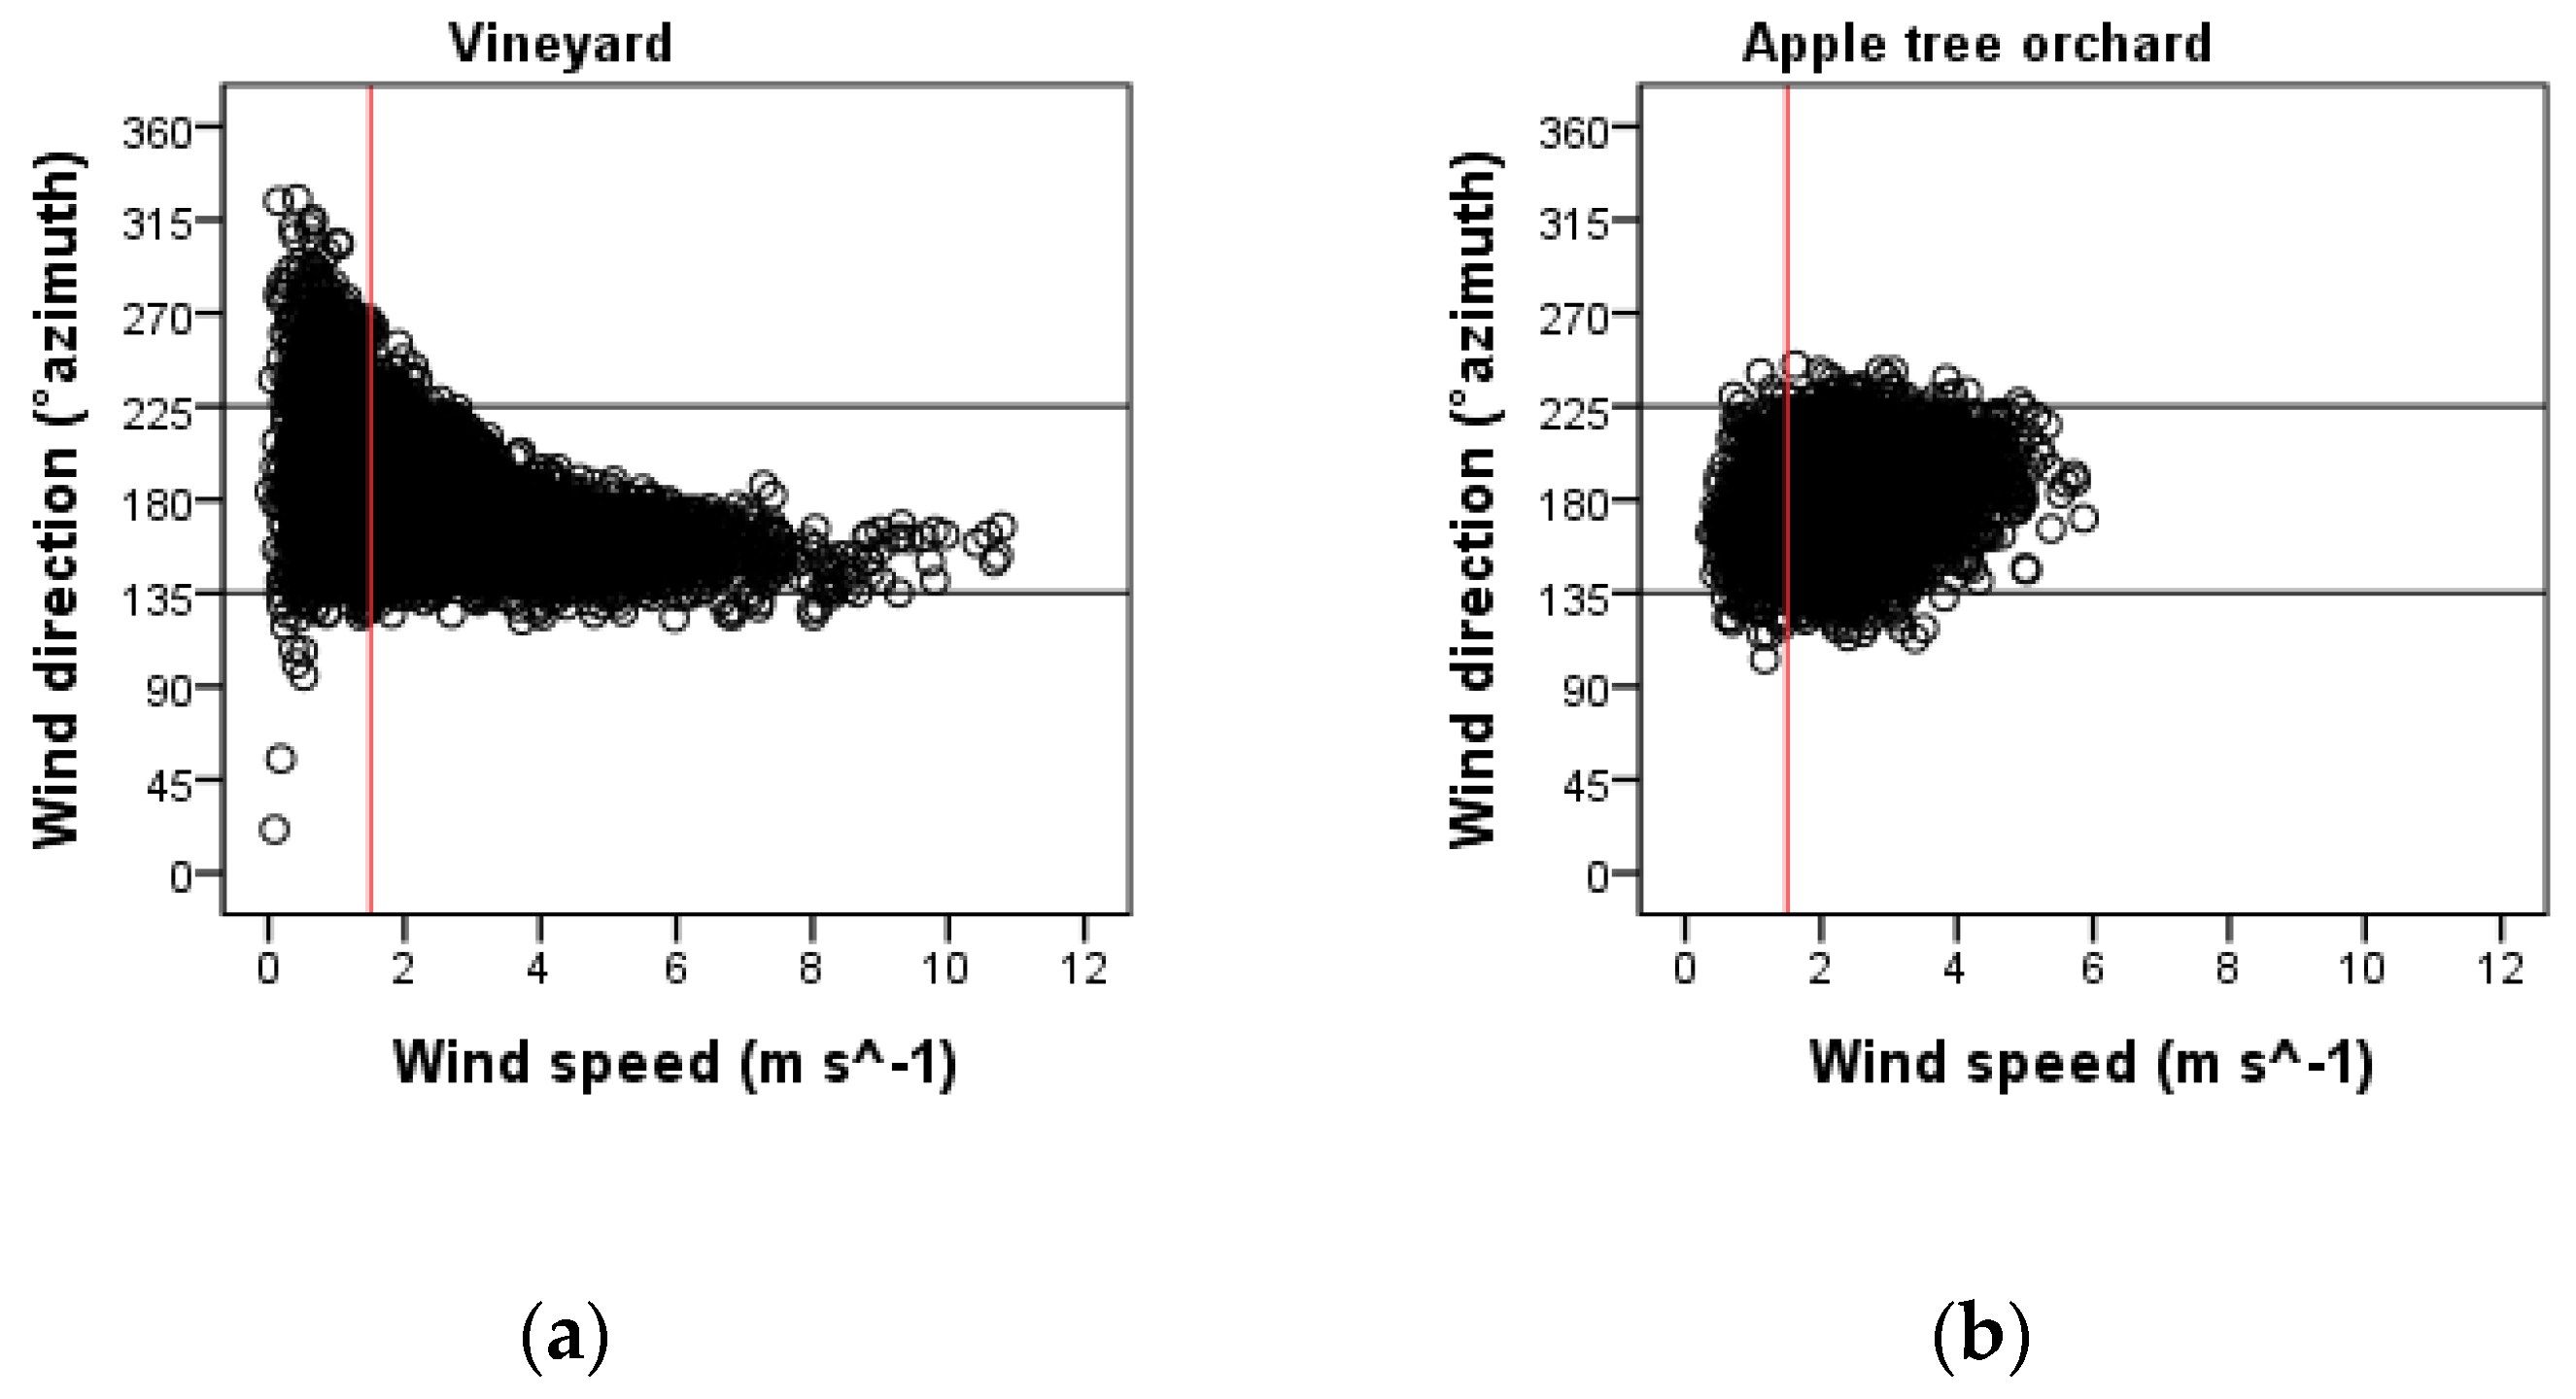
Figure 1). To monitor environmental conditions during the trials, the weather station was equipped with a sonic anemometer 232 (Campbell Scientific, Logan, UT, USA) to measure wind speed and wind direction relative to the spray track, and two thermo-hygrometer HC2S3 probes (Campbell Scientific) placed at two different heights (1 m between sensors) to measure air temperature and humidity changes. All measurements were taken at a frequency of 0.1 Hz sampling rate and all data were recorded automatically by datalogger CR800 (Campbell Scientific). The environmental conditions were monitored for the entire duration of each test replicate: it derived that in vineyard trials the environmental parameters were measured for 5′24″ plus 60″ after the end of spray distribution and in apple orchard trials were measured for 3′36″ plus 60″ after the end of spray distribution.
To check that environmental conditions during the field trials met ISO22866:2005 [5] requirements, the following were calculated for each replicate: (a) number of wind measurements less than 1 m s−1 (outliers) must not exceed 10%; (b) mean wind direction must be 90° ± 30° to the spray track; (c) frequency of wind direction > 45° to the spray track (not centered) must not exceed 30%; and (d) mean temperature must be between 5 °C and 35 °C.

2.4. Characteristics and Configurations of Airblast Sprayers

Two different airblast sprayers were tested. The one in vineyard was a mounted sprayer Dragone k2 500 (Dragone S.n.c., Castagnole Asti, AT, Italy) with a 200 L polyethylene tank, an axial fan (600 mm of diameter) with a two-speed gearbox that generated two airflow rates 11,000 m3 h−1 or 20,000 m3 h−1 (PTO revolution speed 540 rev min−1 equal to 56.52 rad s−1), a tower-shaped air conveyor, and six nozzles on each side of the sprayer. In apple orchard, the sprayer tested was a trailed sprayer Fede Qi 90 Futur 2000 (Pulverizadores Fede S.L., Cheste, Valencia, Spain) equipped with a 2000 L polyethylene tank, an axial fan (900 mm of diameter) with a two-speed gearbox that produced airflow rates of either 29,000 m3 h−1 or 46,000 m3 h−1 (PTO revolution speed 540 rev min−1 equal to 56.52 rad s−1), and 13 nozzles for each side of the sprayer positioned in two lines (six in the first line and seven in the second one).
The vineyard sprayer was tested in four configurations resulting from combinations of two different fan airflow rates (11,000 m3 h−1 and 20,000 m3 h−1) and two different nozzle types, one conventional hollow cone (Albuz® ATR 80 orange) and one air induction hollow cone (Albuz® TVI 8002 yellow) (CoorsTek, Evereux, France) (Table 1). All tests were performed operating at 1.67 m s−1 (6 km h−1) forward speed, adopting a working pressure of 1.0 MPa, producing nominal nozzle flow rates of 1.39 L min−1 and 1.46 L min−1, respectively. During testing, all nozzles were activated (6 + 6 nozzles) and the applied volume rates resulted as 596 L ha−1 for ATR nozzles and 626 L ha−1 for TVI nozzles.
The orchard sprayer was tested in four configurations resulting from combinations of two different fan airflow rates (29,000 m3 h−1 and 46,000 m3 h−1) and two different nozzle types, one conventional (Albuz® ATR 80 red) and one air induction (Albuz® TVI 80025 lilac) (Table 1). All orchard tests were conducted operating at a single forward speed (1.67 m s−1 equal to 6 km h−1), but used a higher (compared to the vineyard) working pressure (1.5 MPa), with nominal nozzle flow rates of 2.33 L min−1 (ATR) and 2.24 L min−1 (TVI). During the tests, the eight nozzles in the central positions of the two lines (8 + 8 nozzles) were activated. These configurations resulted in volume rates of 932 L ha−1 when employing ATR nozzles and 896 L ha−1 using TVI nozzles.
Three test replicates were conducted for each configuration; the results are summarized in Table 1.

2.5. Characterization of Nozzle Droplet Size Spectra

The droplet size spectrum for each nozzle type used during field trials was determined. Laboratory measurements of droplet sizes were performed using a Malvern Spraytec laser diffraction system STP5342 (Malvern Instruments Ltd., Worcestershire, UK). All tests were made with the nozzle positioned orthogonally, at 30 cm height with respect to the laser beam emitted by the instrument; measurements were taken at five different positions within the spray cone. At each measuring point droplet size data were acquired for 60 s. For each nozzle type, three nozzles were randomly chosen from a 100-nozzle batch; each was then measured three times. The pressures adopted were identical to those utilized in the field trials: 1.0 MPa for ATR 80 orange and TVI 8002 yellow coupled with Dragone k2 500 in vineyard, and 1.5 MPa for ATR80 and TVI 80025 lilac coupled with Fede Qi 90 Futur 2000 in apple tree orchard. The 10th percentile (D[v,0.1]), 50th percentile or Volume Median Diameter (D[v,0.5]), and 90th-percentile (D[v,0.9]) values were determined for each nozzle. Table 2 shows the main characteristics of the trial nozzles.

2.6. Spray Liquid and Tracer Concentration

E-102 Tartrazine yellow dye tracer −85% (w/w)-(Fiorio Colori S.r.l., Milano, Italy) was added to the sprayer’s tank at a concentration of about 10 g L−1 [93]. The tracer concentration was quantified on artificial collectors by using a spectrophotometer FLUOstar Omega (BMG LABTECH GmbH, Otenberg, Germany) set at a wavelength of 427 nm, corresponding to peak absorption of the Tartrazine dye.
Prior to each test, a blank sample was processed with a Petri dish placed in the middle of the sprayed area that was collected 30 s before spraying started. Three samples of the sprayed liquid were also collected from the spray tank (sampled directly from a nozzle) before and after the spraying process to determine the precise tracer concentration at the nozzle outlet at each test.

2.7. Spray Drift Assessment

The deposit on each artificial collector (Di), expressed in µL cm−2, was calculated according to ISO 22401:2015 [94], as follows:
D i = ( p s m p l p b l k ) × V d i l p s p r a y × A c o l
where Di is the spray deposit on a single deposit collector, expressed in µL cm−2; psmpl is the absorbance value of the sample (adim.); pblk is the absorbance of the blanks (adim.); Vdil is the volume of the dilution liquid (deionized water) used to dissolve the tracer deposit from the collector in µL; pspray is the absorbance value of the spray mix concentration applied during the tests and sampled at the nozzle outlet (adim.); and Acol is the projected area of the collector detecting the spray drift (Petri dish and Polyethene line) in cm2.
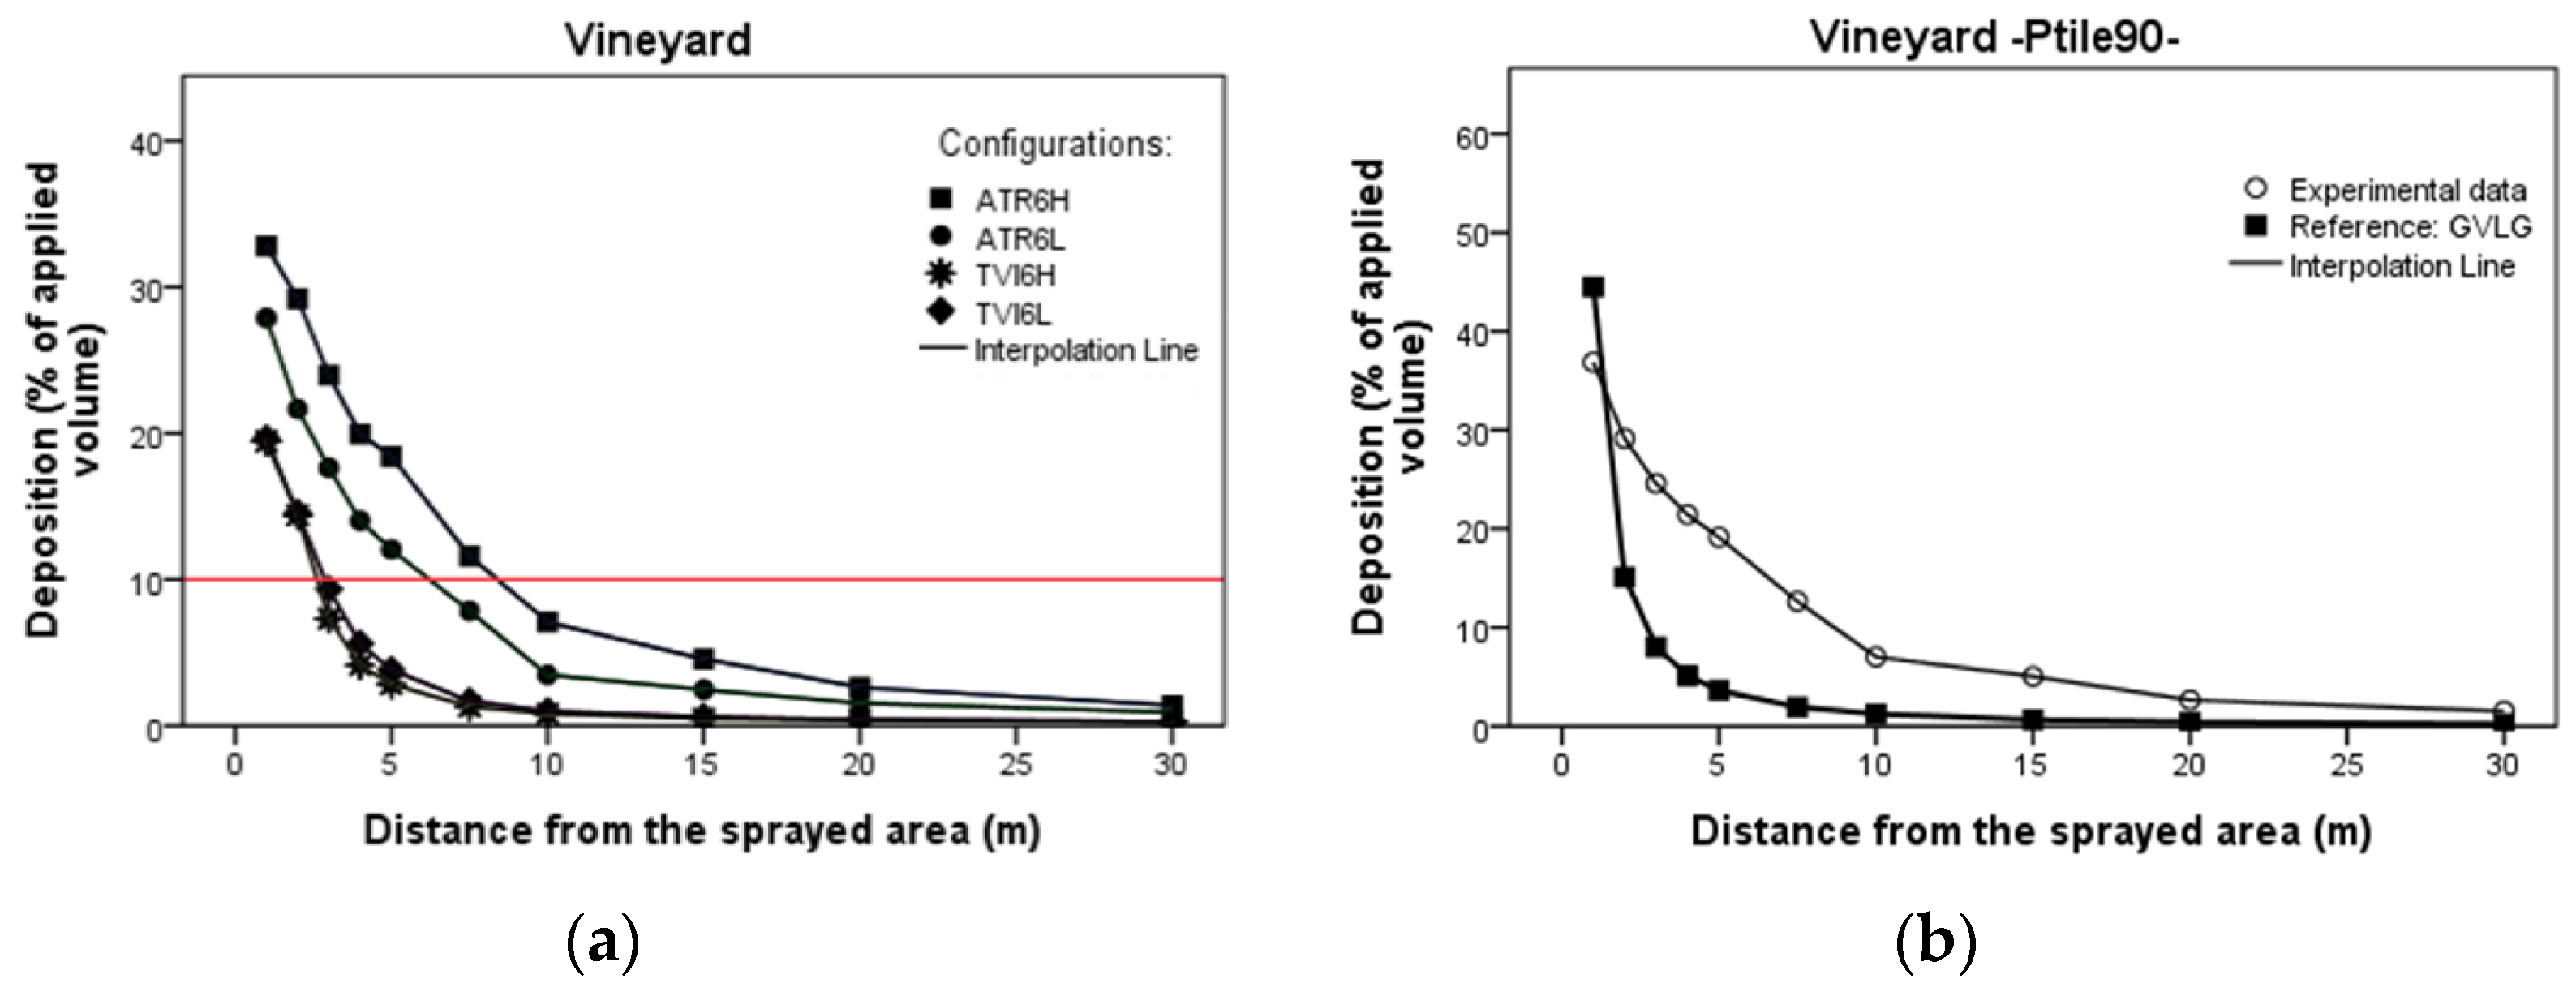
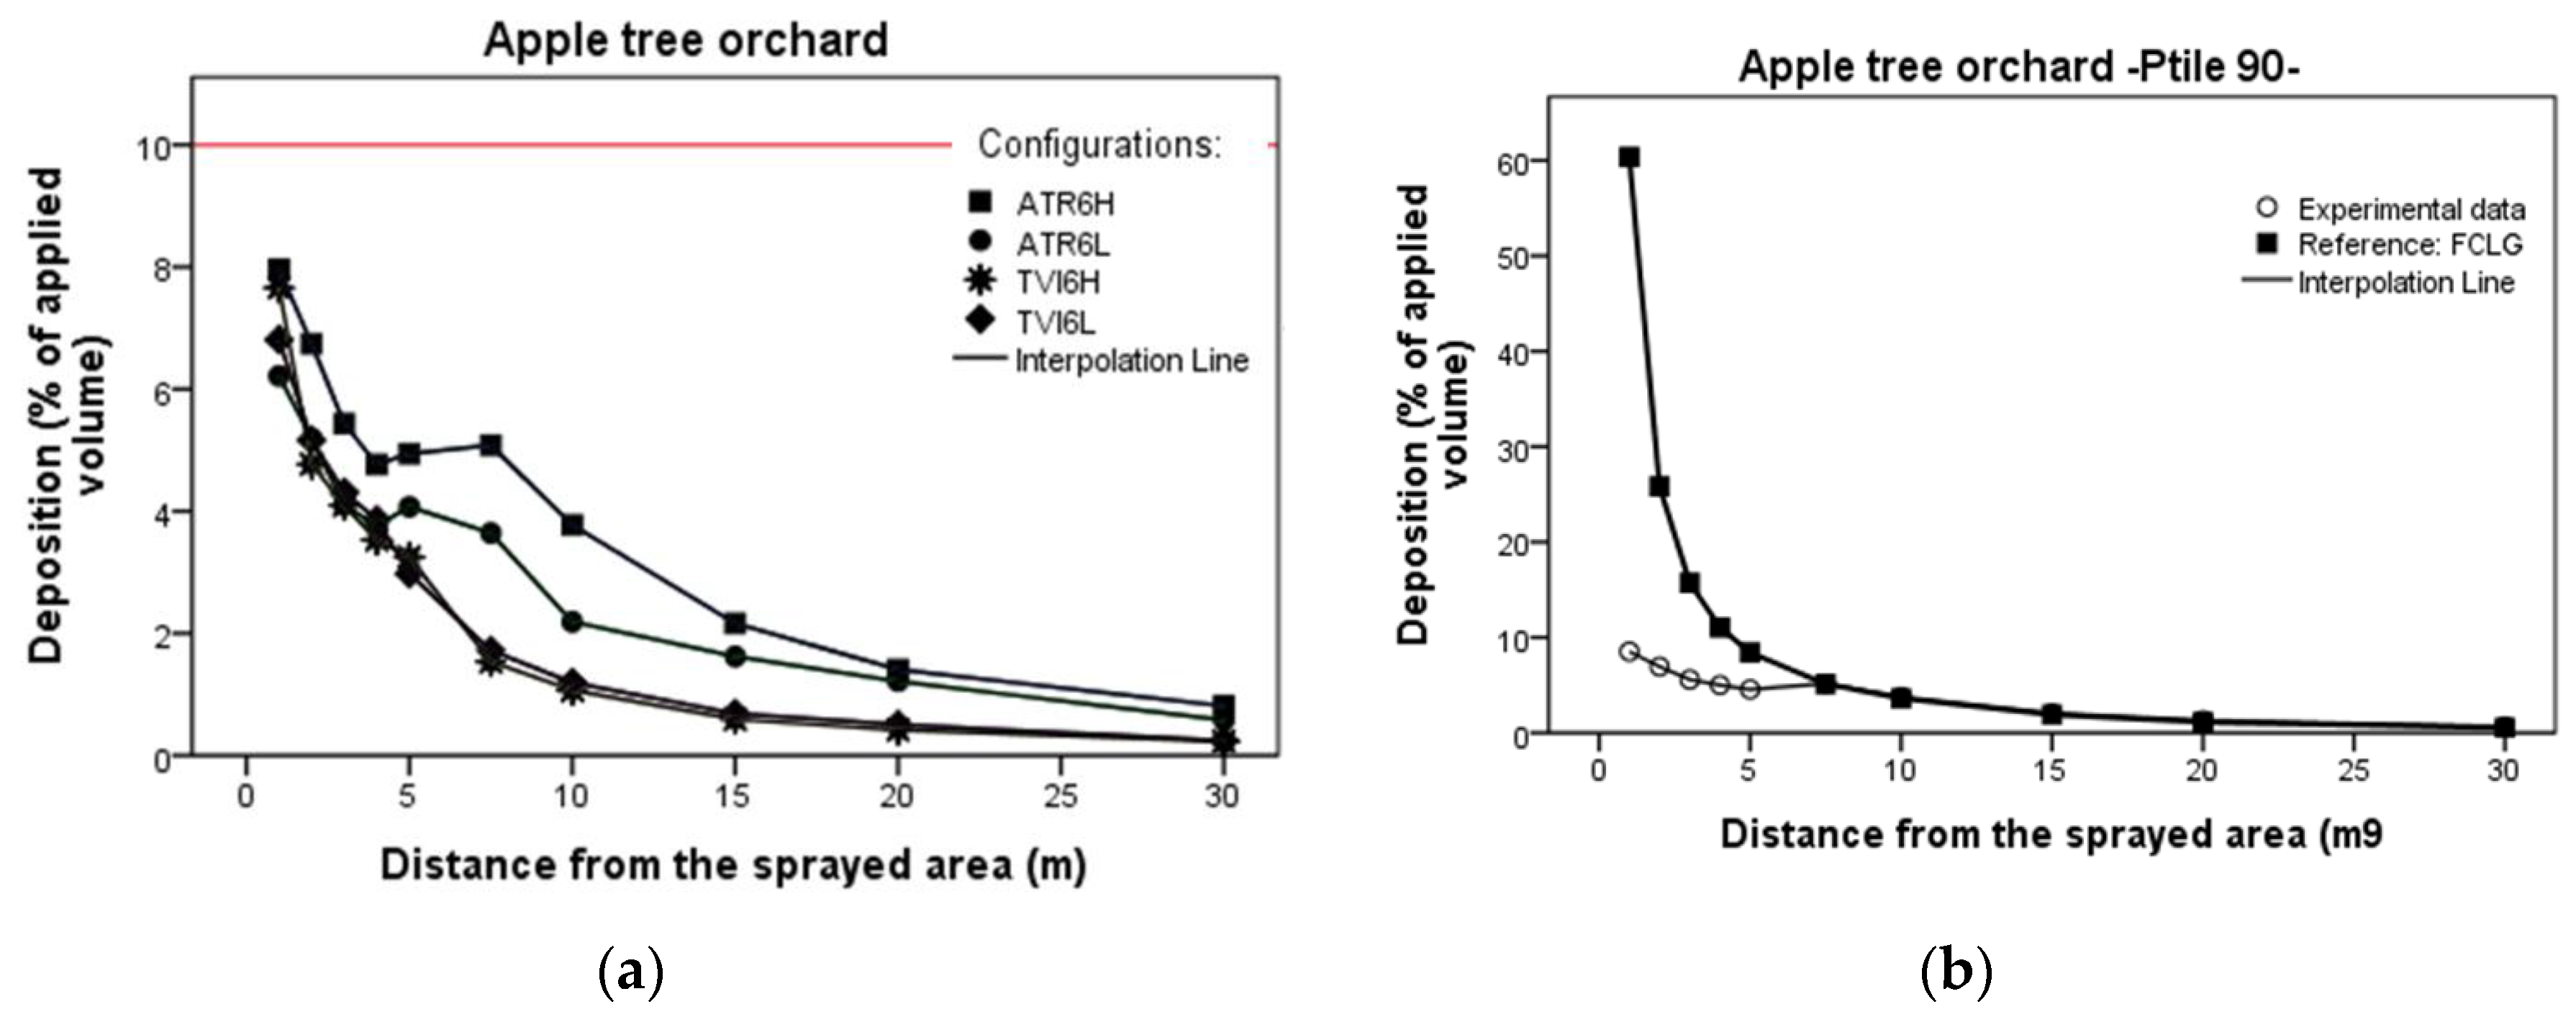
For drift ground sediment, once the tracer amount on each collector was measured, the mean of values derived from the six samples placed at each downwind distance was calculated. The amount (µL cm−2) obtained from each replicate was then transformed using a proportion to express ground sediments as percentage of application rate (%) following ISO22866:2005 protocol [5].
For airborne drift, the mean tracer amount derived from the two samples placed at each sampling height above the ground was calculated separately for each of the two sampled downwind distances (5 and 10 m from the sprayed area). In this case, the amount (µL cm−2) obtained from each replicate was transformed to express airborne spray drift as percentage of application rate (%).

2.8. Drift Value Calculation

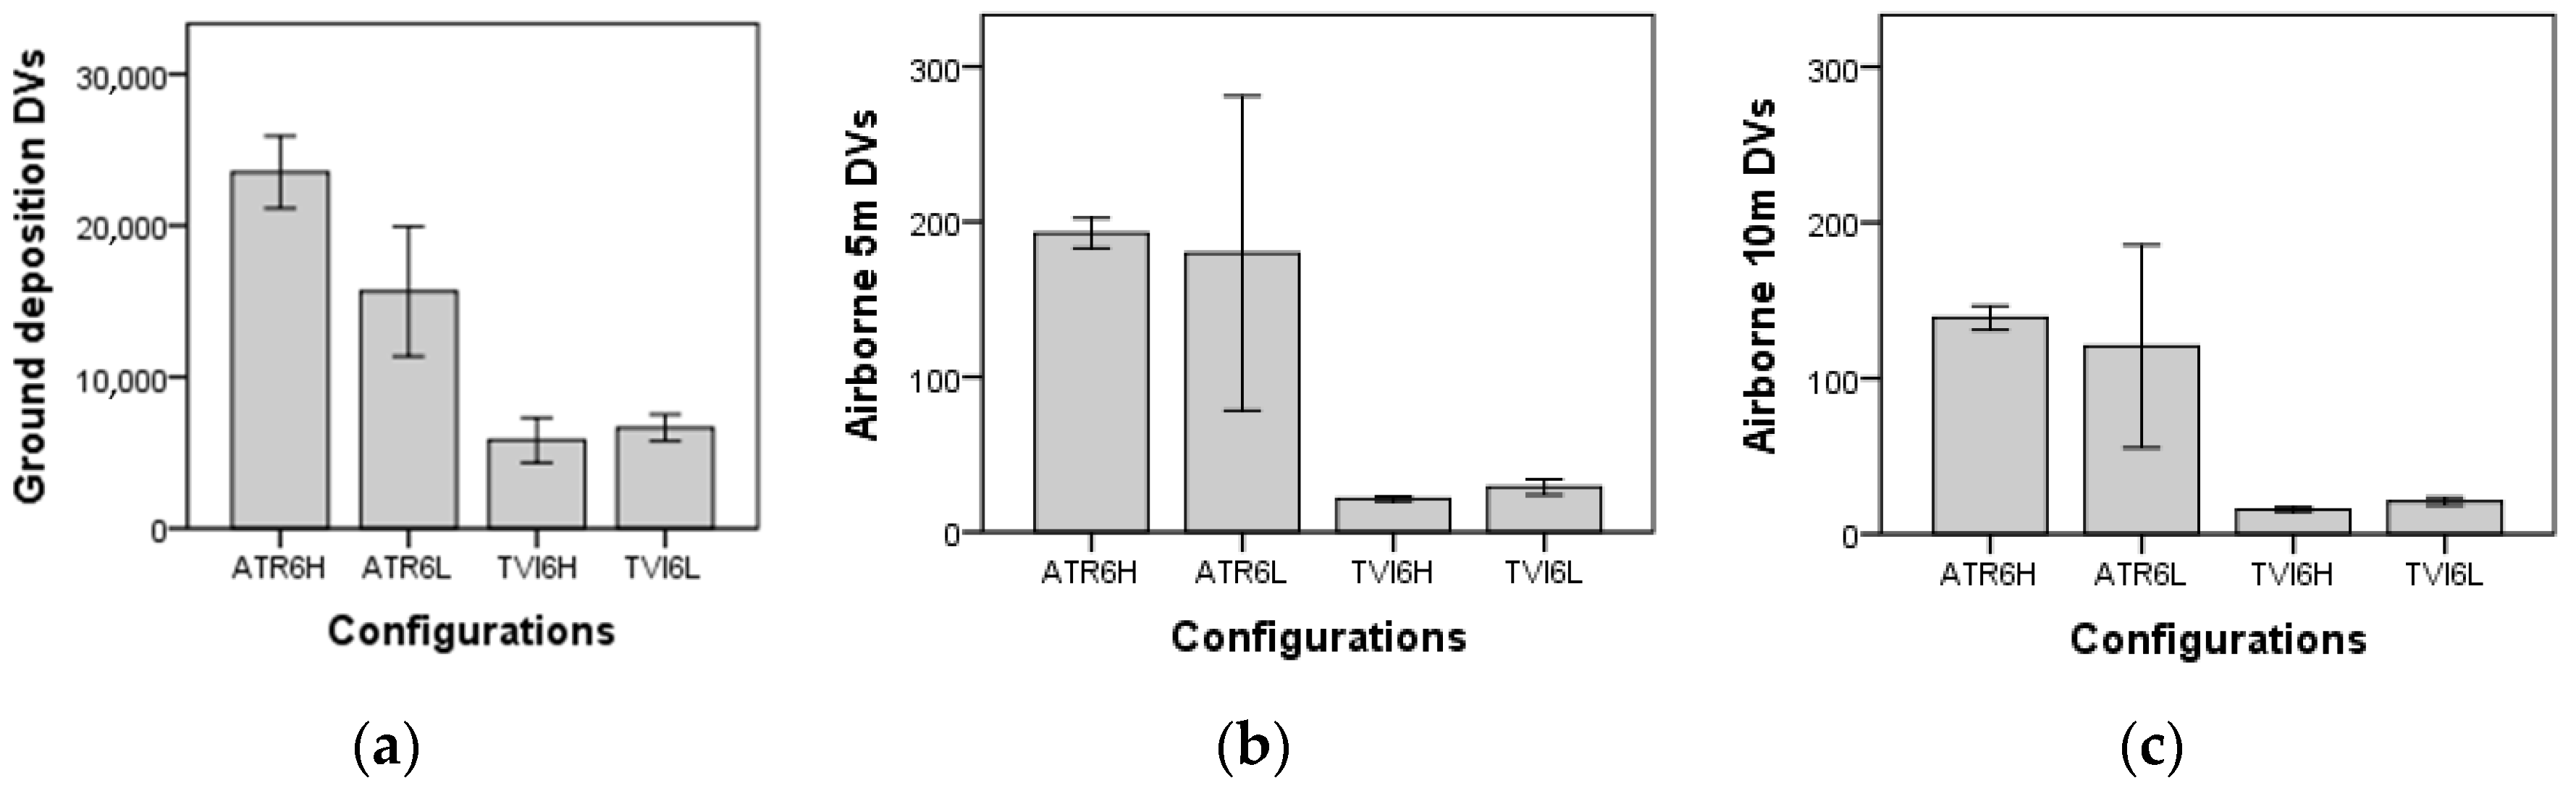
For each replicate, the numerical integral of spray drift curves obtained was calculated to achieve its corresponding Drift Value (DV). The DVs for ground spray drift curves were obtained following the methodology proposed by Grella et al. [95]; the DVs for airborne spray drift curves were calculated adapting the same methodology. The methodology allowed calculation of an approximation of definite integral using the mid-ordinate rule.
The calculation performed was: division of the interval [a,b], into n equal intervals of width
h =   b a n
where h is equal to 0.5 m; for the calculation of DV for ground and airborne drift curves a correspond, respectively, to 0.75 m distance from the sprayed area and to 0 m height above the ground, in both vineyard and apple tree orchard crops; for the calculation of DV for ground and airborne drift curves, b correspond, respectively, to 30.25 m distance from the sprayed area and to 6 m height above the ground, in both vineyard and apple tree orchard crops.
The intervals’ midpoint was performed as follows:
x 1 = a + h 2   x 2 = a + 3 2 h   x 3 = a + 5 2 h     x n = a + ( 2 n 1 ) 2 h
where x1, x2, x3, …, xn are the midpoint values of the equal intervals of h width, included into [a,b] interval.
The calculation of the sum of the rectangles’ areas followed
S n = h × [ f ( x 1 ) + f ( x 2 ) + f ( x 3 ) +   f ( x n ) ]
where Sn is the sum of rectangles’ areas; h is the rectangles’ base; and f(x1) f(x2) f(x3) … f(xn) are the rectangles’ heights.
The decision to use h equal to 0.5 m arise from the definition of integral:
a b f ( x ) d x = lim h 0 h × [ f ( x 1 ) + f ( x 2 ) + f ( x 3 ) +   f ( x n ) ]
To obtain a good approximation, an h equal to 0.5 m was used, where the higher the number (n) of intervals to divide the interval [a,b], the better the approximation.

2.9. Statistical Analysis

All statistical analyses were performed using IBM SPSS Statistics (Statistical Package for the Social Sciences) for Windows [96]. A p-value < 0.05 was considered to be statistically significant. For each sprayer, the statistical differences among Drift Values (DVs) for each tested configuration was evaluated using two-way Analysis of Variance (ANOVA) considering the nozzle type and fan airflow rate as sources of variation. Residuals analyses were also performed.
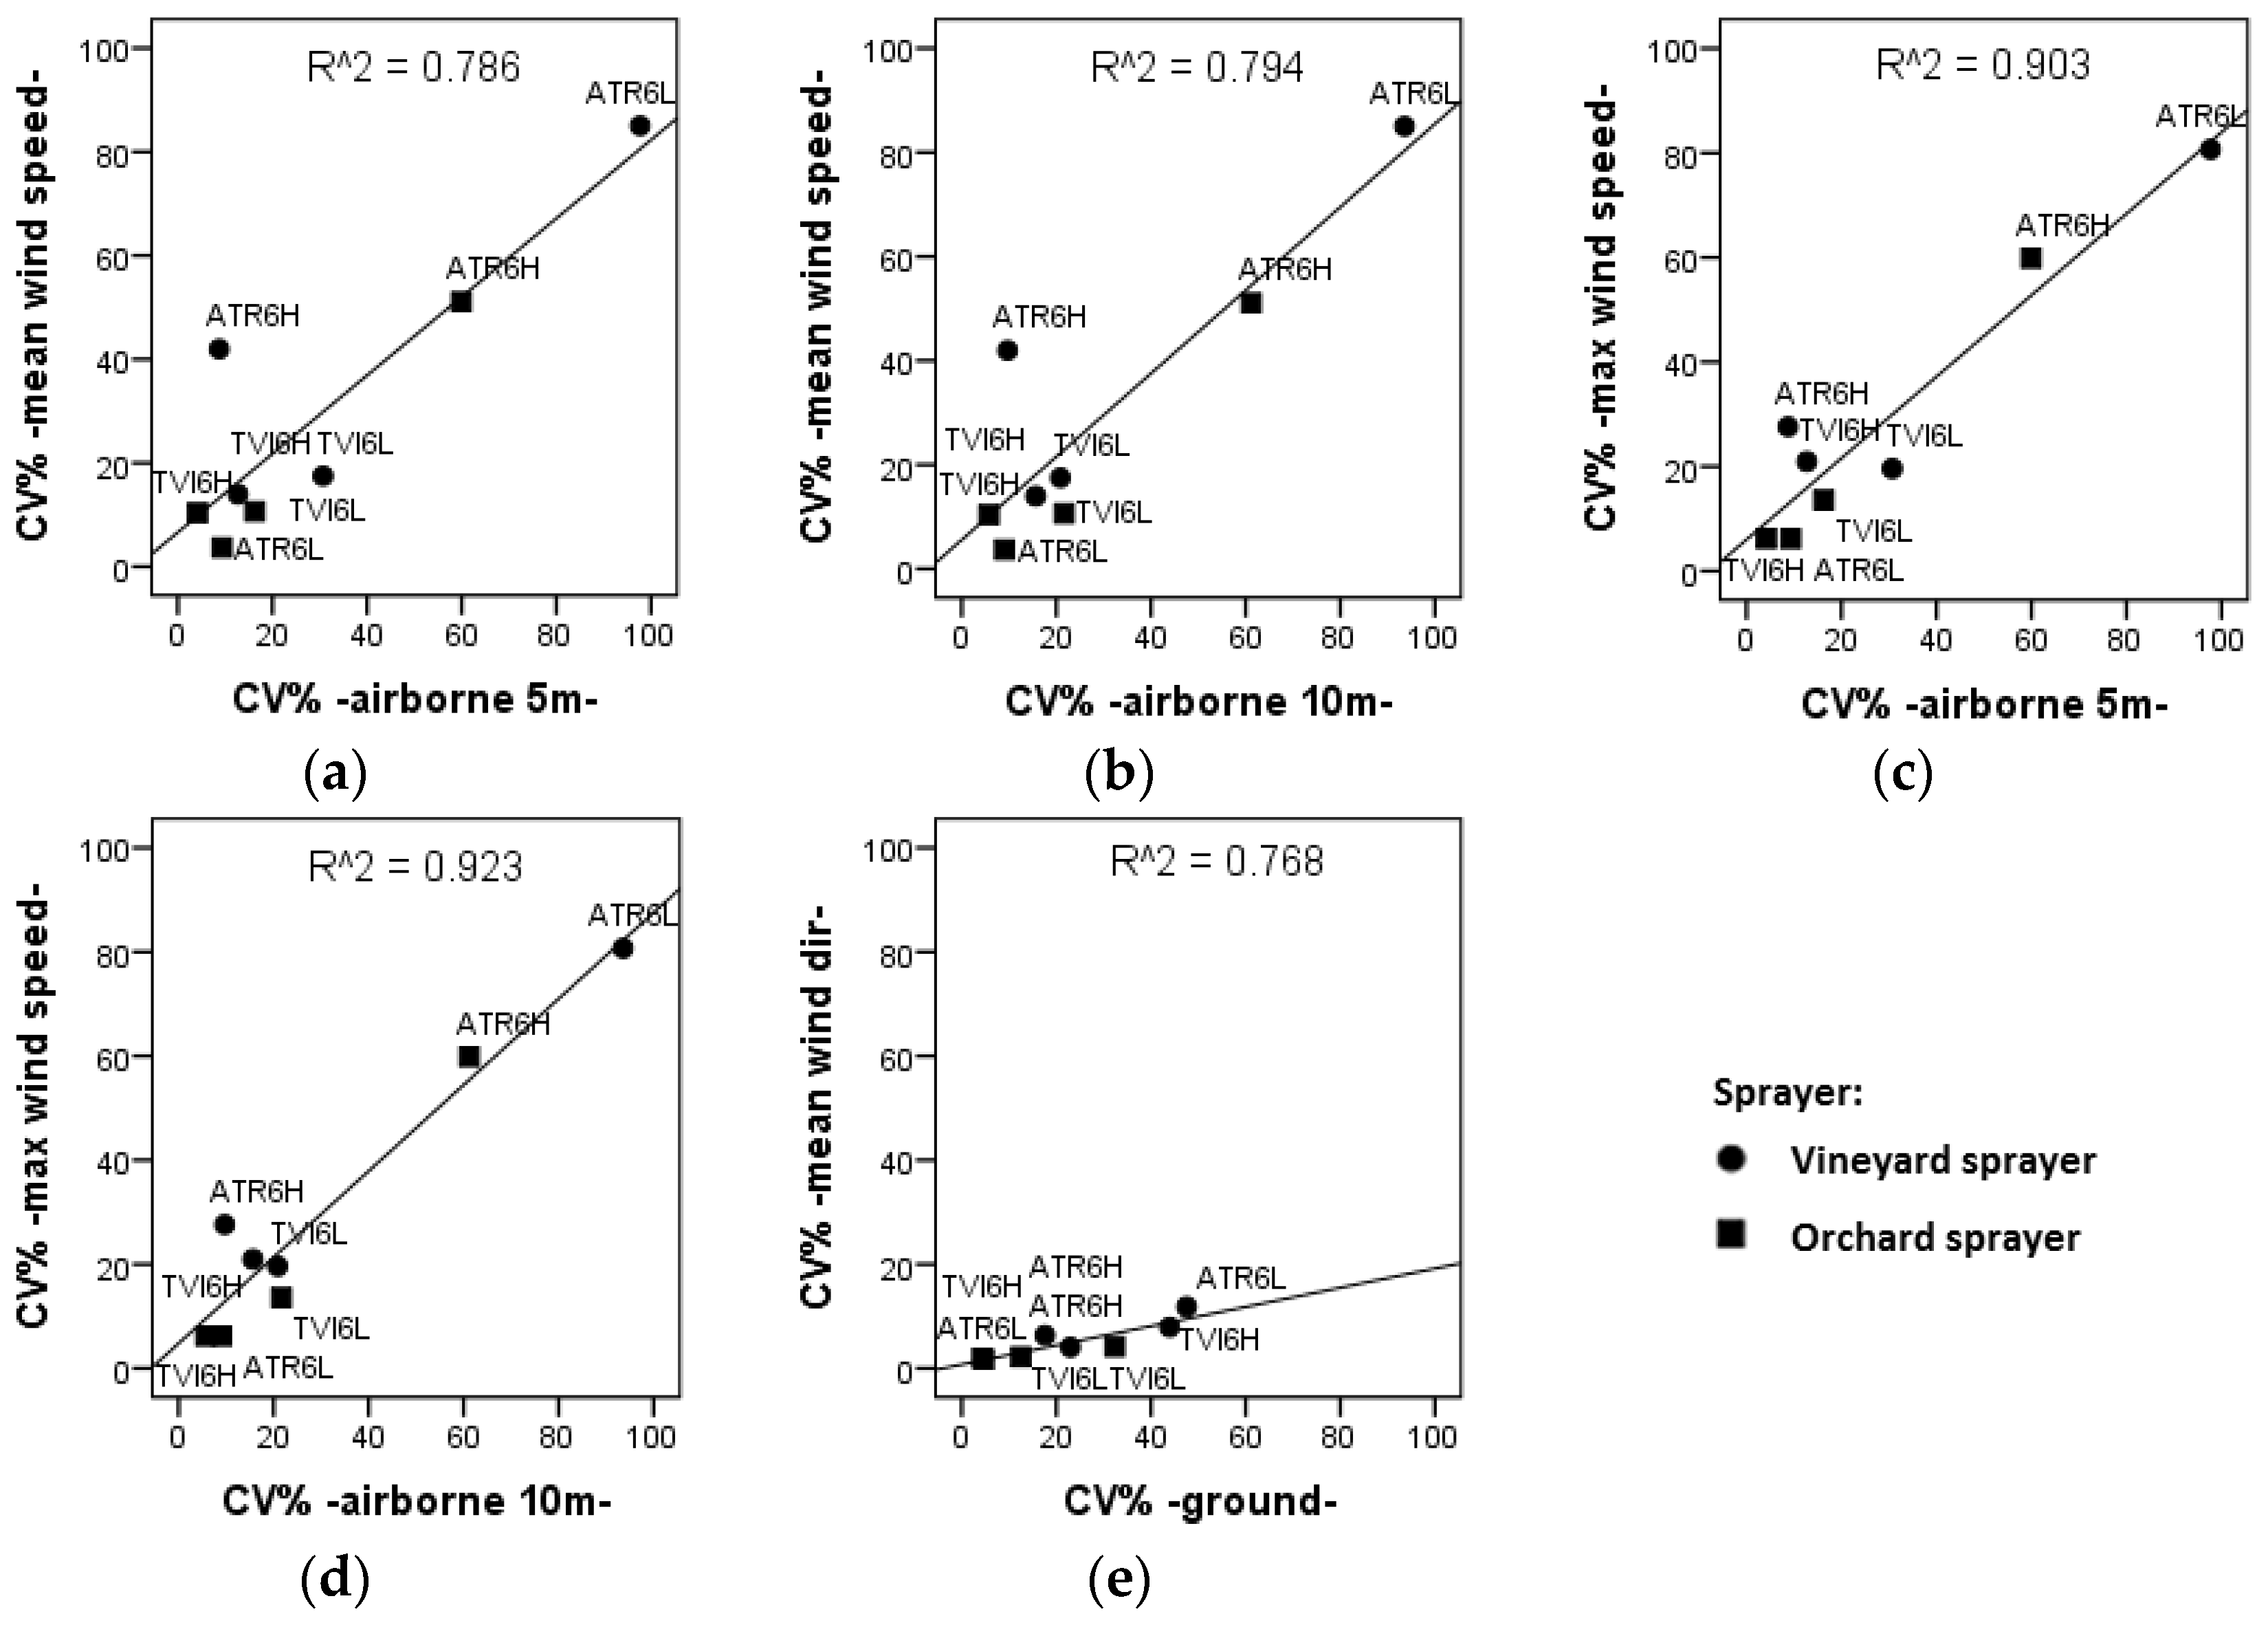
The correlations between wind speed parameters (minimum, maximum, mean, and outliers) and wind direction parameters (mean, range, and center directions) were evaluated. The relationship between wind characteristics and the DVs of ground and airborne spray drift (airborne measured at 5 and 10 m from the sprayed area) were analyzed to assess the influence of wind characteristics on the DV obtained in each test. To assess the influence of wind characteristics within each tested configuration when wind variation was detected by DV variation, the relationship between the CV% of wind characteristics and the CV% of DVs were analyzed.
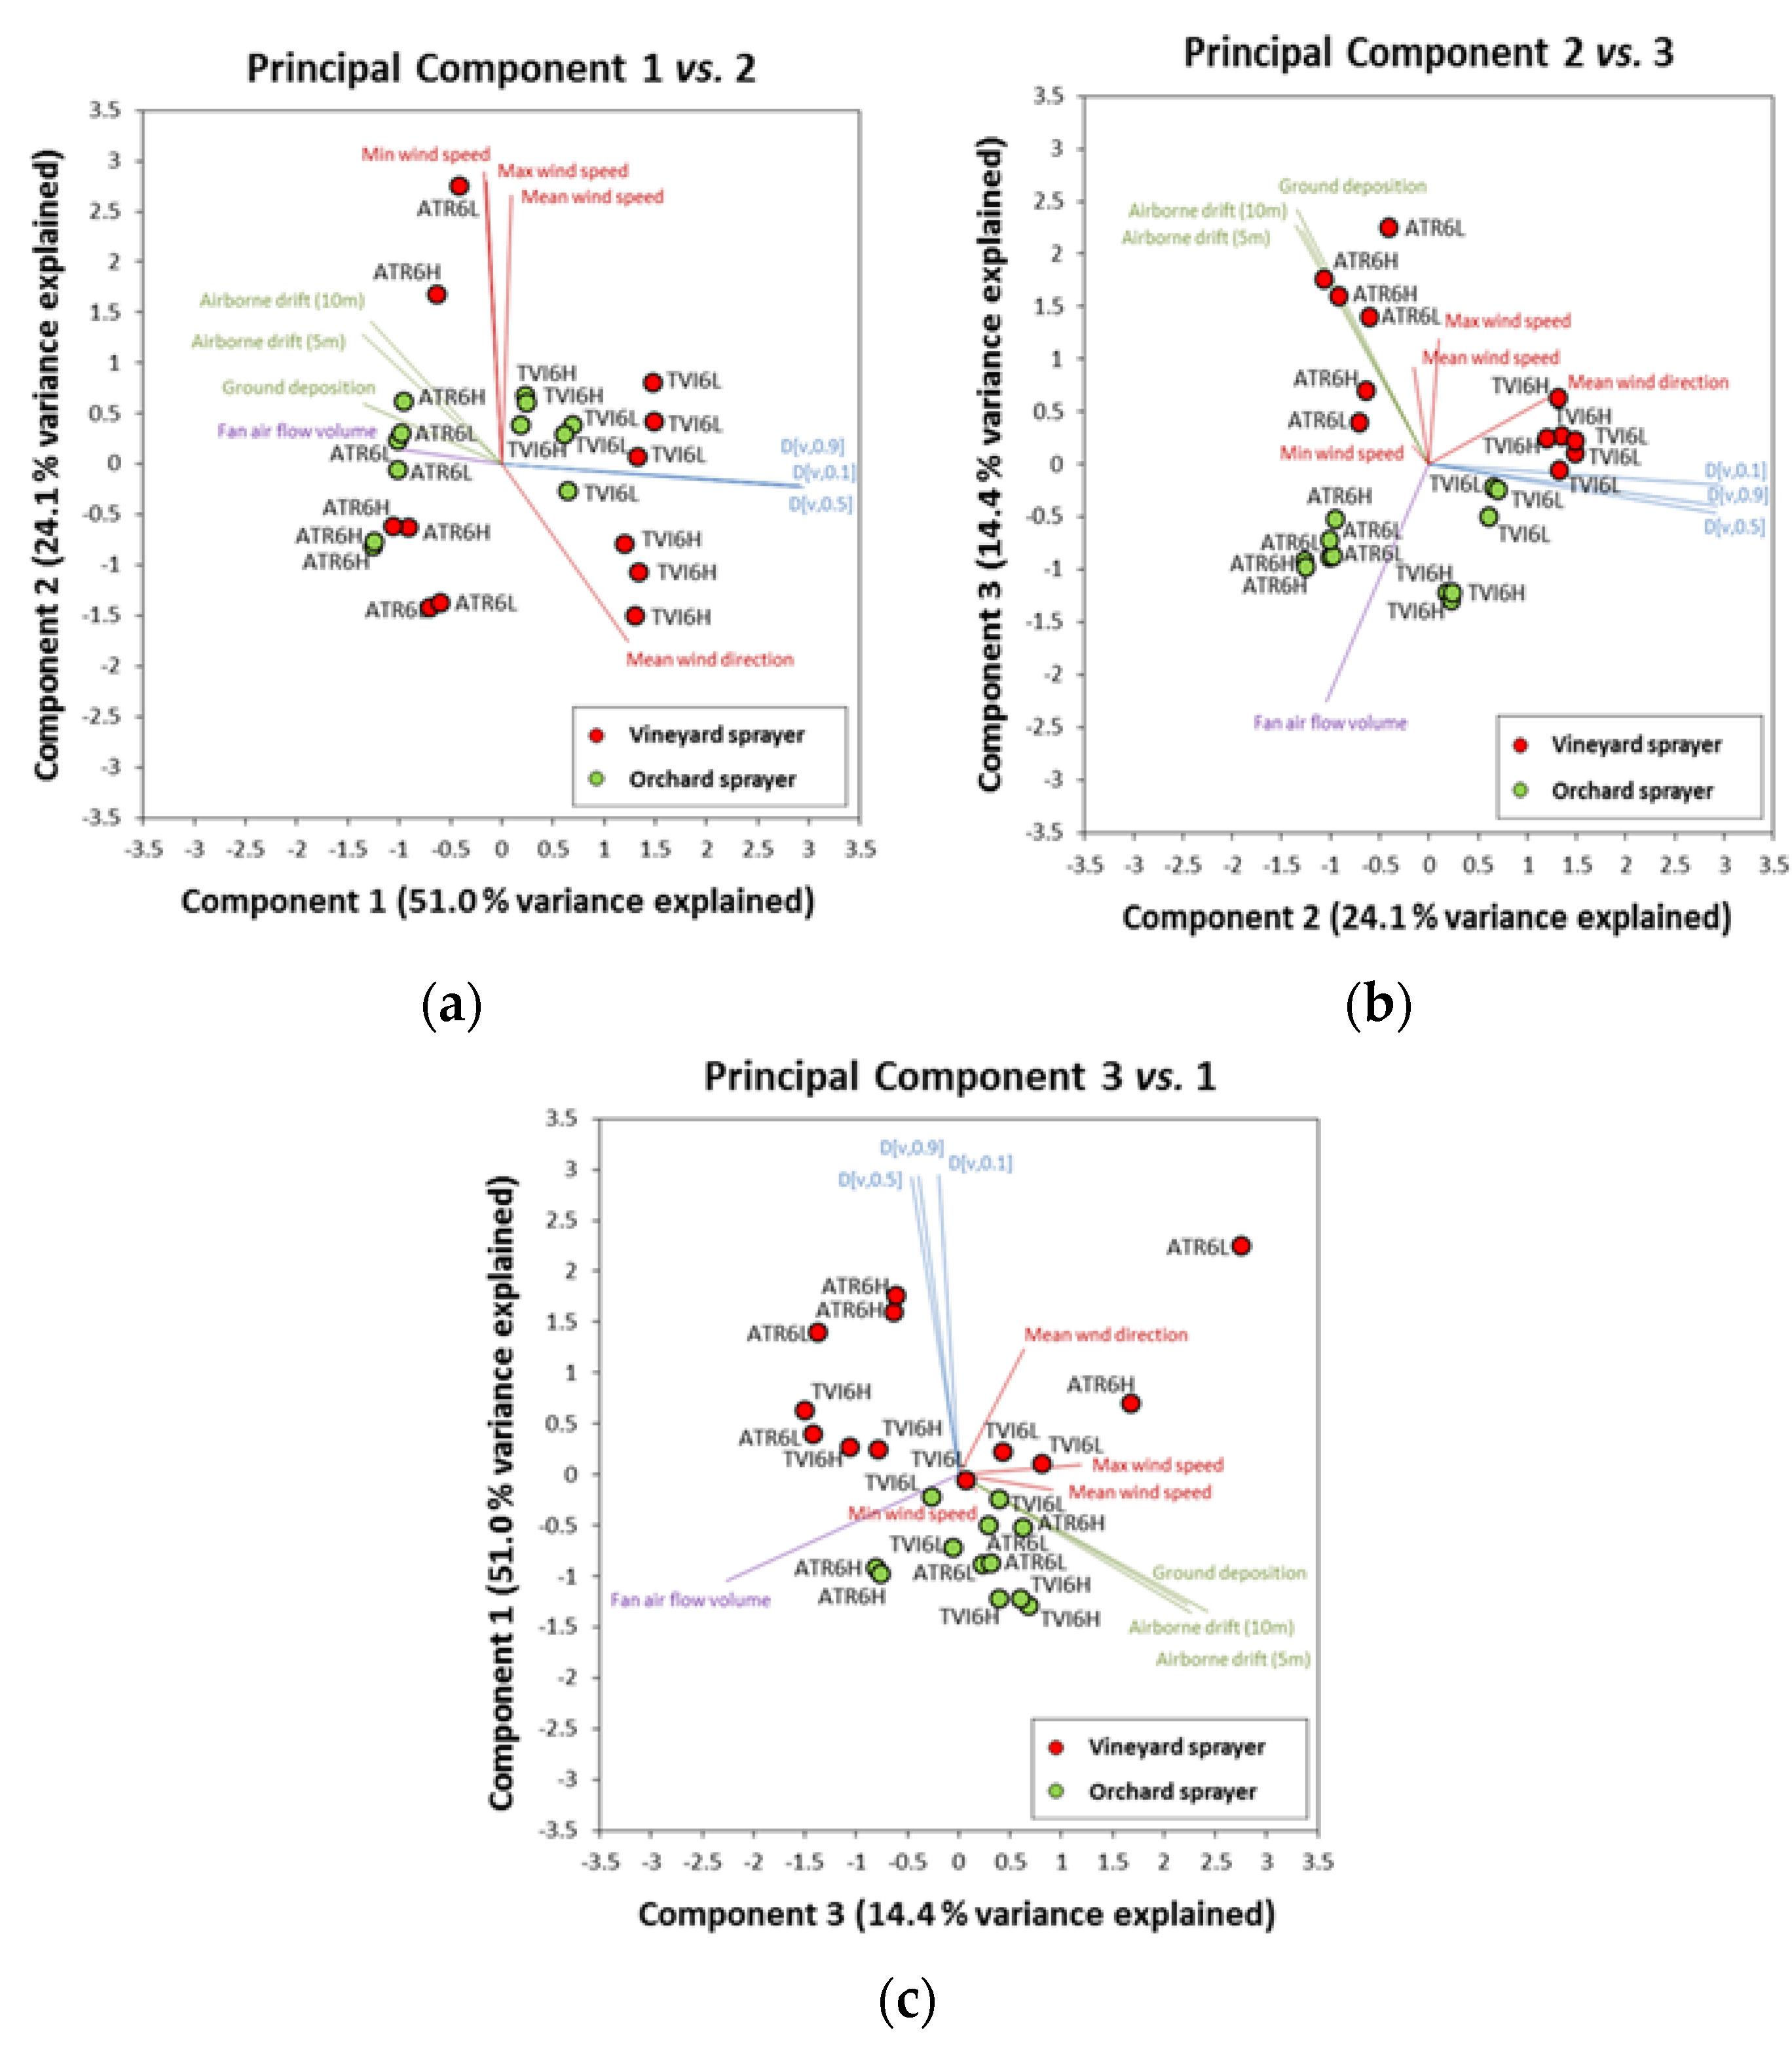
Moreover, a Principal Component Analysis (PCA) on standardized values (Z scores) was carried out to evaluate and quantify the effect of different variables (sprayer settings parameters, main wind characteristics, and the DVs of spray drift deposition) during the spray drift process in vineyard and apple tree orchard.

3. Results and Discussion

3.1. Weather Conditions during Trials

During the tests the mean temperature ranged from 22.3 °C to 28.5 °C; relative humidity (RH) values were between 50.5 and 81.6%. The maximum change (∆) in air temperature and RH, measured for the two heights was 0.19 °C and 0.58%, respectively.
All tests were conducted with a mean wind speed above 1.0 m s−1 (range from 1.1 m s−1 to 5.5 m s−1, maximum 10.8 m s−1) as indicated in the standard protocol. During the field trials, the most frequent wind directions were SSE, S, and SSW in both crops, and all winds moved in a prevailing perpendicular direction relative to the crop rows and spray track, as dictated by ISO22866:2005 [5]. Figure 2 shows the distribution of all wind directions during the trials in relation to the spray track direction.
Although ISO22866:2005 specifies that the measurements be replicated three times in wind conditions that are as similar as it is practicable, this provision requires efforts hardly rewarded. In fact analyzing Table 3, which shows the detailed values of all parameters recorded during the field trials, it emerges that in replicates 1 and 3 of configuration TVI6H testing vineyard sprayer the centered wind directions were deviated respect ISO requirements. Replicates 1 and 2 were respectively, 0.6% and 5.3% over the limit prescribed, corresponding to 2 and 20 records of 384 (5′24ʺ plus 60ʺ after the end of spray distribution) recorded during each trial duration. Due to the slightly deviation all the data were anyway considered in all statistical analysis performed.
Further analysis of wind speed (Figure 3a) and direction (Figure 3b) indicated that higher wind speeds generally corresponded to lower wind direction variation. Despite graphical evidence of a relationship between wind speed and wind direction (Figure 3), the statistical analysis of correlations between wind speed variables (Min, Max, Mean, and Outliers in Table 3) and wind direction variables (mean, range, and centered observations in Table 3) bore a different result (Table 4). No relationships were found between maximum wind speed and wind direction variables. Only a weak relationship (p = 0.045) was found between mean wind speed and mean wind direction, although other authors have deemed this correlation the most important [30]. Surprisingly, good correlations were found among minimum wind speeds and all wind direction variables: p = 0.010 for the mean, p = 0.001 for the range, and p = 0.028 for centered observations.
Focus on the relationship between minimum wind speed and range of wind directions recorded during each trial (Figure 4) highlighted that during trials characterized by minimum wind speed (below 0.5 m s−1), the range of wind directions was always greater than 90°. At the same time, when the minimum wind speed was greater than 1.2 m s−1, wind direction was more uniform with a reduced range in wind direction values to about 70°. Finally, during assessment of minimum wind speeds between 0.5 and 1.2 m s−1, the values for the range of wind directions were about 90°; however, the fit line function revealed that minimum wind speeds of 1 m s−1 could be considered a threshold value at which more uniform wind directions corresponded to higher wind speeds and more variable wind directions corresponded to lower wind velocities.
This tendency was confirmed by a scatterplot analysis (Figure 5) of all wind direction values in relation to wind speed values recorded in all trials in vineyard (Figure 5a) and orchard (Figure 5b). In fact, the more wind direction values are dispersed in the wind speed zone below 1.5 m s−1, the more increasing wind speeds aggregate wind direction observations (percentage of records between 180° ± 45°). For this same reason, a positive relationship was found between minimum wind speeds and centered observations recorded in each field trial (Table 4). Further confirmation of the relationship between minimum wind speed and wind direction was shown by the significant correlations among wind speed outliers and wind direction variables because wind speed outliers represent the percentage of records below 1 m s−1, which is linked to the minimum wind speed variable.
Therefore, low wind speed could be linked to high variability of wind direction. Although ISO 22866 does not establish limit for the highest wind speed admitted, a good balance must be struck between wind velocity and wind direction variation for the protocol to be effective.

3.2. Drift Evaluation in Vineyard

The mean ground spray drift deposits measured at different distances downwind of the sprayed area are plotted in Figure 6a. They represent the plume generated during the spray process in a vineyard crop using a Dragone k2 500 sprayer.
The mean data curves indicate a considerable amount of ground sediment at all sampled distances; in fact, more than 1% of the applied volume is still assessed at 30 m from the sprayed area (with configuration ATR6H). However, in all cases, the greatest deposition was located in the first few meters of the downwind area. Specifically, when ATR6H and ATR6L nozzle configurations were used, a spray drift deposit corresponding to about 10% of the applied volume was measured at 7.5 m from the sprayed area, while when TVI nozzles were used, the same amount of drift deposit (10% of applied) was measured at 3 m distance. Furthermore, all curves showed continued decreases in ground sediments quantities as distances increased from 1 m to 30 m, although the rate of decrease varied with nozzle configuration. As expected, the rate of decrease was lower with conventional nozzles than with air induction nozzles. Conventional nozzles operated at the high fan flow rate result in slower decreases in collector deposition compared to tests conducted at the low fan flow rate. However the effect of fan flow rate (High and Low) on ground drift values (DVs) (Figure 8a) was found not to be significant (Table 5), although the effect of fan air flow rate reduction in reducing spray drift was demonstrated [97]. Given this, it follows that ATR6H configurations showed the highest deposition values at sampling locations in the sprayed area, and that the other configurations producing decreasing depositions, as well as DV values (Figure 8a), in the following rank order: ATR6L, TVI6L, and TVI6H. Noteworthy is the finding that the two TVI configurations produced very similar ground sediment drift values at each sampling location. Spray drift measured amounts in the Spanish vineyard were also compared to Grape Vine Late Growth (GVLG) reference drift curves as proposed by Rautmann et al. [42] and are plotted in Figure 6b. The experimental data for vineyards in Spain generally registered larger spray drift deposit amounts, as compared to the reference drift curves found at all distances from the sprayed area, except at the 1 m distance. This trend is in line with results obtained in Italy [98]. In the present study, canopy structure likely played an important role, where vines acted like a continuous, high porous, vegetative barrier and allowed only a small amount of air (combination of environmental wind and fan sprayer air) to pass through their structure (leaf and grape band), and simultaneously deflected a great amount of airflow over the canopy top and behind the plant (trunk zone).
This high permeability was evidenced by the high total ground deposition and a slow decrease in the amount at all distances from the sprayed area. Although the influence of crop type [42] and its growth stage [99] is that primarily studied and related to the spray drift amount, nowadays it is likewise clear that the spray drift amount also depends on the complex of architecture and geometry of cultivation [44,100,101,102]. The architecture varies with the training systems (pruning and training technique) affecting both deposition and off-target losses [43]. The probable effect of canopy structure is confirmed by the shape of the airborne spray drift profile observed at 5 and 10 m from the sprayed area and plotted in Figure 7: (a) mean values and (b) 90th percentile. Indeed, irrespective of sprayer configuration tested, the lower airborne spray drift deposition value is situated at 1.5 m above the ground, which corresponds to the continue band of canopies (leaves and grapes). At more than 1.5 m above the ground, the spray drift deposition increased at all sampled heights, irrespective of the configuration tested. The vertical collectors below 1.5 m showed increased airborne spray drift amounts, likely linked to absence of canopy (trunk zone). Alternatively, air induction nozzles use (TVI type) significantly reduced airborne spray drift (DVs) at both 5 and 10 m from the sprayed area (Figure 8b,c and Table 5), in which maximum deposits values registered below 5% of applied volume at 6 m above the ground. Using the conventional nozzle (ATR) at 6 m above the ground, more than 20% of applied volume was recovered.
The effect of fan flow rate (High and Low) on airborne spray drift was also considered and found not to be significant based on the total drift amounts measured at collectors placed at 5 and 10 m from the sprayed area (Table 5). In parallel to ground deposition DVs, airborne DVs decreased in the following sprayer configuration rank order: ATR6H, ATR6L, TVI6L, and TVI6H (Figure 8b,c).

3.3. Drift Evaluation in Apple Tree Orchard

The mean spray drift deposition measured at different distances from the sprayed area are plotted in Figure 9a and represent the plume generated during the spray process in apple tree orchard using a Fede Qi 90 Futur 2000 sprayer. A small amount of ground sediment was measured when the applied volume was approximately 900 L ha−1, where no more than 8% of applied volume was assessed at any of the distances from the sprayed area when testing configuration ATR6H (worst case configuration). However, at a distance of 30 m, values lower by ten-fold were detected. Even though all cases resulted in the greatest portion of deposition located in the first few meters of the downwind area, the curves showed an unusual tendency. In contrast to the curves in vineyard crop that demonstrated a continuous and constant rate of decrease in ground sediment amount from 1 m to 30 m, the ground drift deposition curves in the apple tree orchard crop showed a continuous decrease, consistent with the configuration tested between 7.5 m and 30 m from the sprayed area only. In the downwind area closest to the sprayed area (1 m to 5 m), the conventional ATR and air induction TVI nozzles in combination with different fan airflow rates (High and Low) failed to show an effect. Configurations ATR6H and ATR6L showed a gradual decrease in ground sediment deposition from 1 m to 3 m; thereafter (From 4 m to 7.5 m), a gradual and moderate increase of drift deposition was found. Different trends were observed for configurations featured by air induction nozzles combined with high and low fan airflow rates (TVI6H and TVI6L) at distances between 1 m and 7.5 m. While a continued decrease of ground sediment was assessed, the rate of decrease did not differ between the two configurations, where punctual values were, at times, higher for TVI6H and at other times for TVI6L. However, regardless of curve tendency, the highest ground DVs were recorded for the ATR6H configuration, with the following configurations in decreasing order: ATR6L, TVI6L, and TVI6H (Figure 11a). The effect of conventional (ATR) and air induction (TVI) nozzle type on ground DVs was significant (Table 6). On the other hand, although authors proved the efficacy of reduced fan airflow rate in spray drift reduction [103], no statistical differences were detected for the effect of fan airflow rate (High and Low) (Table 6).
Figure 9b compares obtained ground spray drift curves with reference ones [42]. Contrary to that found in vineyard crop, the experimental data in apple tree orchard underlines the lower deposition amounts found at all distances from the sprayed area, especially at distances close to the sprayed area (from 1 to 5 m), which align with results obtained in the Italian context [98] and once again show an influence of canopy characteristics. As others have demonstrated, the apple tree canopy structure is important because it acts like a wall (low porosity barrier) that ineffectively traps spray drift, except in the region immediately behind the barrier [104,105]. The airborne spray drift profile measured at 5 and 10 m to the sprayed area seems to confirm this phenomenon, as plotted in Figure 10a (mean values) and Figure 10b (90th percentile). Here, the shape of the airborne drift profile is very similar to the profile described by Raupach et al. [106] when studying droplet deposition downwind of a spray area affected by a vegetative barrier. Similar to the vineyard, the apple tree canopy is also characterized by own shape, dependent on tree training, and consequently own porosity. These characteristics affect the fate of pesticide droplets inside the plant micro-environment which directly determines the efficacy of treatment and indirectly it also determines the off-target losses [43].
The airborne spray drift deposition (Figure 10a) shows the effect of configurations tested at 5 and 10 m to the sprayed area. As expected, the ATR6H configuration achieved the highest airborne DVs, and the other sprayer configurations decreased in DVs in the following rank order: ATR6L, TVI6H, and TVI6L (Figure 11a,b). The effect of fan airflow rate (High and Low) on ground deposition and airborne DVs (Figure 11a–c), regardless of nozzle type, were not statistically significant (Table 6). In fact, only the conventional (ATR) and air induction (TVI) nozzles showed significance on airborne DVs (Table 6).

3.4. Correlation between Drift Values (DVs) and Wind Parameters

As reported in ISO22866:2005 [5] the measurement shall be replicated at least three times in environmental conditions that are as similar as is practicable. Achieving these requirements is easier for the temperature and relative humidity (RH) than for wind. Temperature and RH parameters can vary much during the year and day but their variation, in stable weather conditions, is not so rapid in a short time. Therefore, the maximum difference registered among all trials (24 trials in total) for the mean temperature was 6.2 °C and 4.6 °C among replicates testing the same configuration (Table 3). Considering the RH the maximum difference registered among all trials was 31.2% and 28.3% among replicates testing the same configuration (Table 3). Thus, preliminary correlation among DVs (ground and airborne at 5 and 10 m), temperature and RH parameters were performed and no significant relationships (p > 0.05) were found.
Of greater interest is the behavior of wind and its influence on final results of spray drift measurements. Wind varies continuously in a short time both for speed (Figure 3a) and direction (Figure 3b); it derives that achieve the ISO22866 requirements for wind parameters, during field trials, is very difficult. Variation in wind speed correspond to variations in wind directions (Table 4) and can lead to high variation in final results [30]; so the data analyses were focused on the influence of wind parameters.
Table 7 and Table 8 show the correlation between the DVs (ground and airborne at 5 and 10 m) obtained in each field trial (24 trials in total) and wind speed and wind direction parameters to assess whether spray drift amounts (DVs) are directly influenced by these weathers parameters most considered by the ISO22866 test protocol. No relationships (p > 0.05) were found between wind direction variables (mean, range, and number of centered observations) and ground and airborne (5 and 10 m) DVs (Table 8). A good significant relationship was found between airborne DVs (5 and 10 m) and wind speed variables, especially for the maximum (Max) and mean wind speed recorded during field trials (p < 0.001) (Table 7). A low significant relationship was detected between minimum (Min) wind speed and airborne DVs (p < 0.05). The DVs based on ground deposition were slightly correlated to maximum and mean wind speeds. These results are consistent with previous research trials [28,39,67,107,108,109], in which higher wind speeds corresponded to higher spray drift amounts.
As expected, the direct relationship between the DVs and wind characteristics was affected by the sprayer settings tested, and in particular, nozzle type. In addition, some evidence of the influence of canopy structure emerged. To separate the combined effect of all variables (tested and random) and to assess if DV variability directly corresponds to wind speed and direction variability, a detailed analysis of the relationships between CV% of DVs and CV% of wind speed parameters (Table 9), as well as CV% of wind direction parameters (Table 10), were performed. The correlation analysis shows significant relationships among variability (CV%) of airborne (5 and 10 m) DVs and wind speed variability, in which the maximum wind speed variable is significantly correlated (p < 0.001 and R2 values of 0.903 and 0.923, respectively) for CV% of DVs assessed airborne at 5 and 10 m from the sprayed area (Table 9, Figure 12c,d). A significant correlation was also found (p < 0.01 and R2 values of 0.786 and 0.794, respectively) between the CV% of mean wind speed variable and CV% of DVs assessed airborne at 5 and 10 m from the sprayed area (Table 9, Figure 12a,b). No relationships were found between the variability (CV%) of ground DVs and the variability of all wind speed parameter considered (min, max, mean, and outliers). Ground DV variability (CV%) could be linked to the variation of mean wind direction (CV%), which is suggested by the significant correlation (p < 0.01 and R2 value of 0.768) found (Table 10 and Figure 12e). Small mean wind direction variability was linked to large ground DV variability. A significant relationships between CV% of airborne (5 and 10 m) DVs and CV% of centered wind direction (percent of records within 180° ± 45° azimuth) were also found (Table 10), however, the level of significance was low (p < 0.05).
The wind parameters that have influence on airborne spray drift have no influence on ground spray drift and vice versa. In general, wind speed was demonstrated to influence airborne spray drift directly. Conversely, wind direction had more of an influence on drift ground sediment.

3.5. Overview Results

The effect of sprayer settings (Table 5 and Table 6) and the influence of environmental variables, both on spray drift total amounts (Table 7 and Table 8) and on variability of results (Table 9 and Table 10) were statistically proven. However, the shape of the curves for ground deposition (Figure 6 and Figure 9) and airborne spray drift measured at 5 and 10 m (Figure 7 and Figure 10) indicated that crop canopy structure influenced spray drift amount at different sampling distances, and consequently, total drift amount based on observed DVs (Figure 8 and Figure 11). The difference among the DV results of tested sprayer configurations was affected by both controlled variables (sprayers type and sprayer configuration) and external variables (wind characteristics and crop canopy structure).
PCA was employed to evaluate and quantify the effect of the most relevant variables (sprayer setting parameters, main wind characteristics, and spray drift deposition) involved in the spray drift process in vineyard and apple tree orchard field trials. A bi-plot display was produced and presented in Figure 13. The first three principal components explained 89.5% of the variation and revealed the factors that significantly determined differences among tested configurations. The first two components (PC1 and PC2 explained 51.0 and 24.1% of the, respectively) clearly separated the conventional (ATR) and air induction nozzle (TVI) groups on the x-axis (Figure 13a). In fact, PC1 count was robust for the nozzle parameters (D[v,0.1], D[v,0.5], and D[v,0.9]) that characterize droplet size spectra (Table 2). PC2 count was robust for wind characteristics, especially on the minimum, maximum, and mean wind speeds registered during field trials. Noteworthy is the higher dispersion displayed on the y-axis of the graph for conventional nozzles (ATR). It shows that when conventional nozzles were used, wind speed parameters had a far greater impact than when air induction nozzles (TVI) were used (Figure 13a). This confirms that the size of the particles has a large impact on the off-target drift and is more important than the wind speed during spray drift generation process [110,111,112].
Component three (PC3), which explained 14.4% of the variance, clearly separated the sprayer groups (vineyard sprayer Dragone k2 500 and orchard sprayer Fede Qi 90 Futur 2000) on the y-axis. Although there is a sprayer type influence, group subdivisions could be linked to the influence of crop type (vineyard and apple tree orchard characterized by different canopy structures). In particular, in spite of higher volume applied in apple tree orchard, about 900 L ha−1 opposed to about 600 L ha−1 applied in vineyard, the DVs obtained using conventional nozzle ATR were three times lower than those obtained in vineyard. When air induction nozzles (TVI) were employed, the DVs obtained when testing the orchard sprayer were only a few less than half those obtained when testing vineyard sprayer. The PC3 count on total spray drift amount (ground and airborne DVs at 5 and 10 m from the sprayed area) revealed it is more influenced by crop type than sprayer type and relative applied volume.
From the analysis of the communalities, low levels of correlation were found for both fan airflow volume and mean wind direction with other variable considered in PCA analysis. Nonetheless, fan airflow volume seems to have an influence, as PC2 and PC3 (Figure 13b) when considering air induction nozzle TVI separated the fan air volume groups (L: low, H: high) according to sprayer type (vineyard and orchard). Wind characteristics registered a high influence during field trials, but concealed the influence of adopted fan airflow rate, especially when conventional nozzles (ATR) were employed, which might arise from the production of finer droplets that are more prone to drift [107,113,114].

4. Conclusions

ISO22866:2005 [
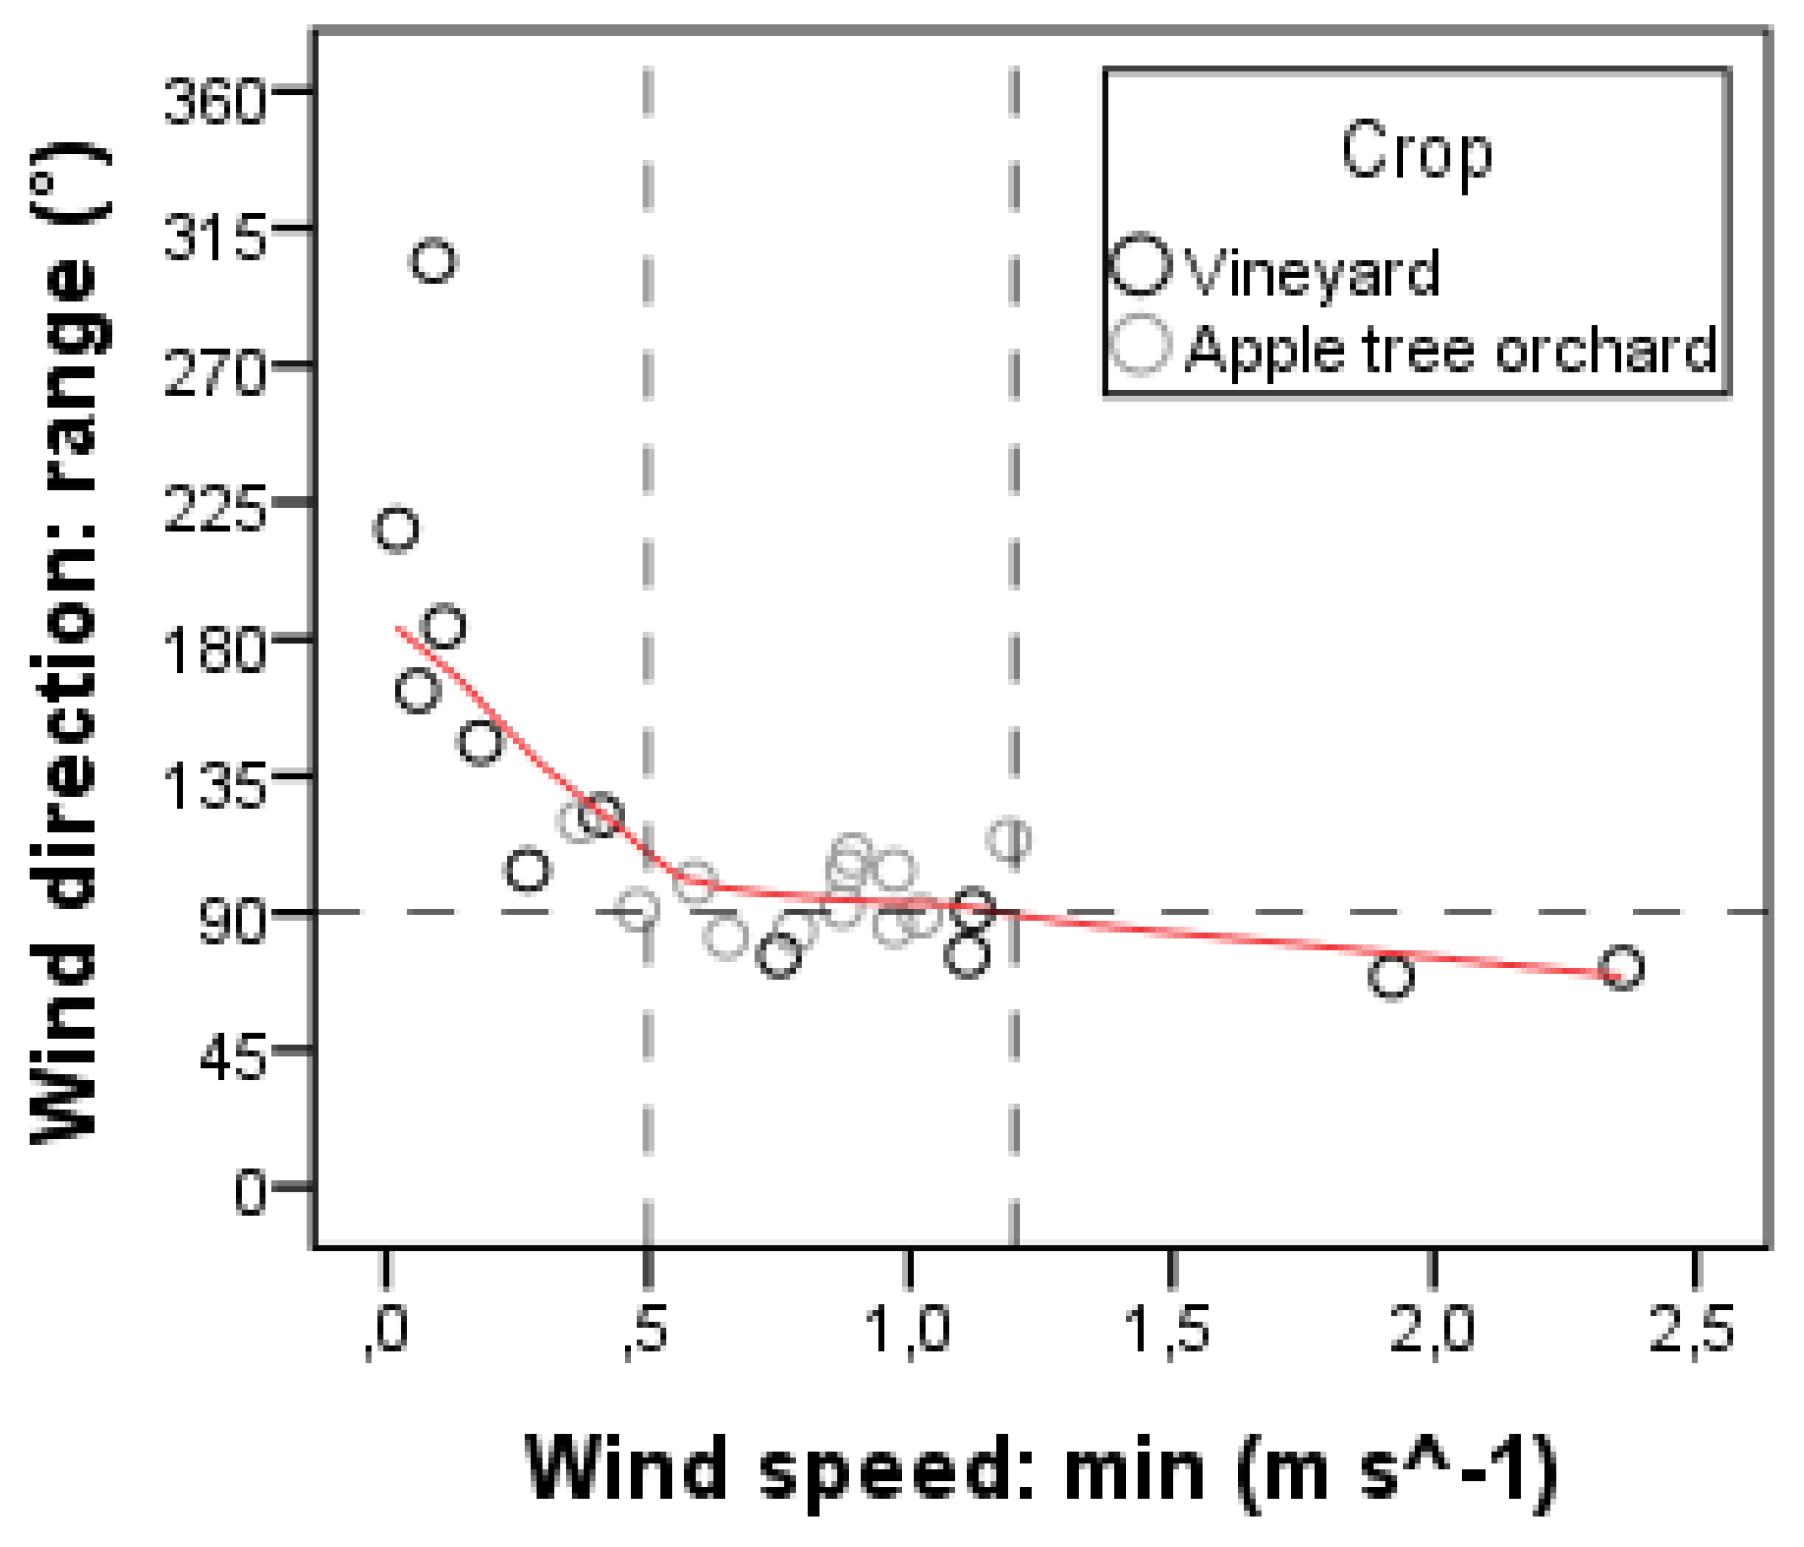
5] standard protocol is effective for determining realistic drift values, both ground and airborne, under actual conditions, by means of field drift experiments. However, when the test objective is to make a comparative assessment of drift risk from different sprayer settings, application of ISO standard protocol is problematic. In fact, when the evaluation of contamination risk to surface water (ground deposition onto horizontal surface) was performed, small variations in mean wind direction were shown to strongly influence drift value (DV) variability. At the same time, when the risk assessment was undertaken for bystander exposure (airborne profile), wind direction failed to affect the results; airborne DV variability was instead strongly influenced by high wind speed (maximum wind speed parameter). Furthermore, high wind speed always affected total spray drift amounts (DVs), be they ground or airborne profiles.
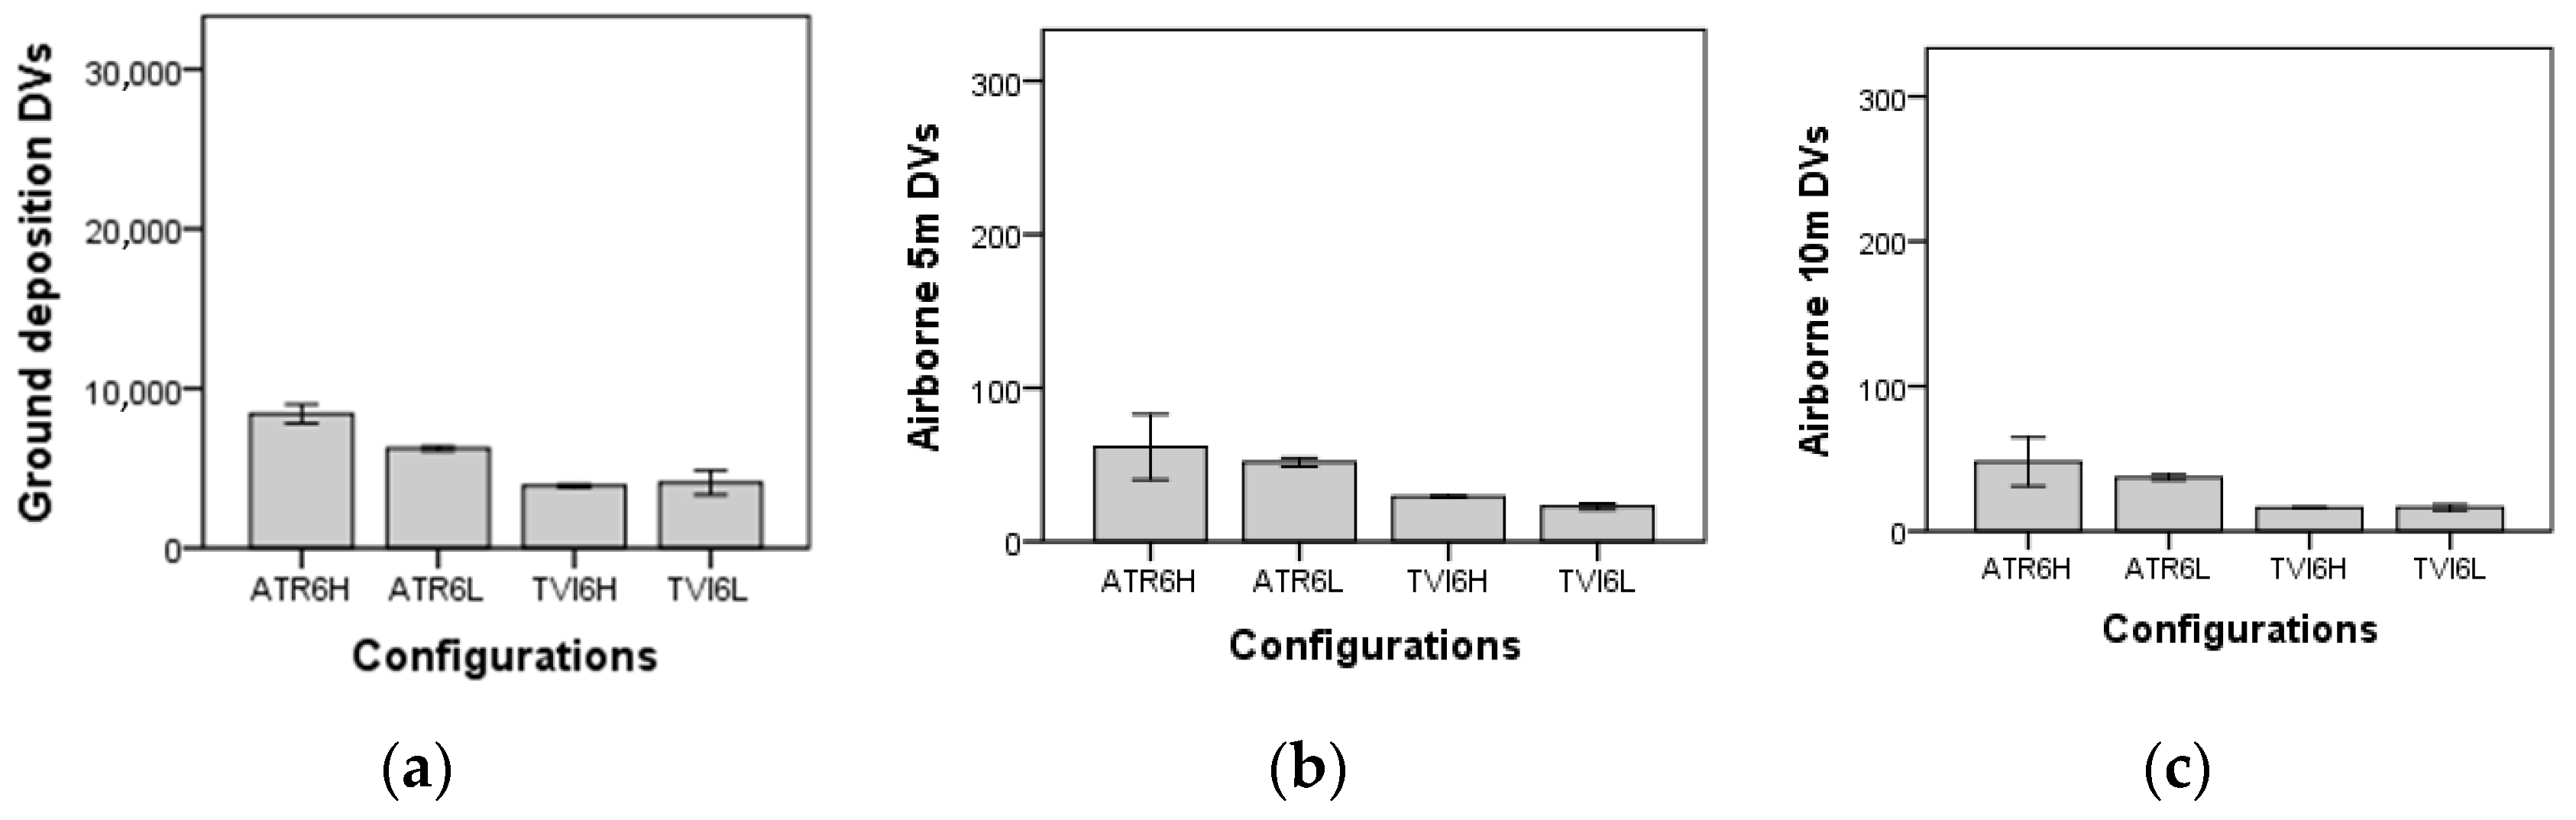
The experimental results from the application of ISO22866:2005, both in vineyard and in apple tree orchard, made evident that reduced spray drift can be achieved by the air induction nozzle configuration; the choose of nozzles types is resulted the variable most relevant in the spray drift process generation explaining 51% of spray drift variability. On the contrary, the effect of reduced fan airflow rates do not shows effect in terms of drift reduction. The wind characteristics (speed and direction), at the time of field trials, concealed the influence of adopted fan airflow rates on final spray drift assessment results. In fact, the wind characteristics explain about 24% of spray drift variability.
In addition, some evidence suggests crop canopy structure also played a role in DV generation, which requires an ad hoc experiment to tease out the effects of crop type, training system, and growth stage from the influence of canopy in the spray drift process.
This finding shows the difficulties in apply ISO standard, meeting its atmospheric conditions requirements, and to quantify the influence of each parameter involved in spray drift process during field spray application. The proved influence of wind characteristics confirmed the unfitness of the ISO22866 protocol for comparative evaluations of drift risk from different sprayer settings or Spray Drift Reducing Technologies (SDRT) to be tested, because it is not possible to directly replicate a given measurement.

Acknowledgments

This research was partially funded by AgVANCE project (AGL2013-48297-C2-1-R) under the Spanish Ministry of Economy and Competitiveness (MINECO).

Author Contributions

Marco Grella, Paolo Marucco, Paolo Balsari and Emilio Gil conceived and designed the experiments; Marco Grella, Montserrat Gallart and Emilio Gil performed the experiments; Marco Grella and Montserrat Gallart analyzed the data; Emilio Gil contributed reagents/materials/analysis tools; and Marco Grella wrote the paper.

Conflicts of Interest

The authors declare no conflict of interest.

References

  1. Nuyttens, D.; de Schampheleire, M.; Baetens, K.; Sonck, B. The influence of operator controlled variables on spray drift from field crop sprayers. Trans. ASABE 2007, 50, 1129–1140. [Google Scholar] [CrossRef]
  2. Doruchowski, G.; Balsari, P.; Gil, E.; Marucco, P.; Roettle, M.; Wehmann, H.J. Environmentally Optimised Sprayer (EOS)—A software application for comprehensive assessment of environmental safety features of sprayers. Sci. Total Environ. 2014, 482–483, 201–207. [Google Scholar] [CrossRef] [PubMed]
  3. European Parliament. Directive 2009/128/EC of the European parliament and the council of 21 October 2009 establishing a framework for community action to achieve the sustainable use of pesticides. Off. J. Eur. Union 2009, 309, 71–86. [Google Scholar]
  4. Muscutt, A.D.; Harris, G.L.; Bailey, S.W.; Davies, B.D. Buffer zones to improve water quality: A review of their potential use in UK agriculture. Agric. Ecosyst. Environ. 1993, 45, 59–77. [Google Scholar] [CrossRef]
  5. International Organization for Standardization. ISO 22866:2005: Equipment for Crop Protection—Methods for Field Measurements of Spray Drift; International Organization for Standardization: Geneva, Switzerland, 2005; pp. 1–17. [Google Scholar]
  6. Van den Berg, F.; Kubiak, R.; Benjey, W.G.; Majewski, M.S.; Yates, S.R.; Reeves, G.L.; Smelt, J.H.; Linden, A.M.A.V.D. Emission of pesticides into the air. Water Air Soil Pollut. 1999, 115, 195–218. [Google Scholar] [CrossRef]
  7. Felsot, A.S.; Unsworth, J.B.; Linders, J.B.H.J.; Roberts, G. Agrochemical spray drift; assessment and mitigation—A review. J. Environ. Sci. Health B 2011, 46, 1–23. [Google Scholar] [CrossRef] [PubMed]
  8. Dabrowski, J.M.; Schulz, R. Predicted and measured levels of azinphosmethyl in the Lourens River, South Africa. Comparison of runoff and spray drift. Environ. Toxicol. Chem. 2003, 22, 494–500. [Google Scholar] [CrossRef] [PubMed]
  9. Marrs, R.H.; Frost, A.J.; Plant, R.A.; Lunnis, P. Determination of buffer zones to protect seedlings of non-target plants from the effects of glyphosate spray drift. Agric. Ecosyst. Environ. 1993, 45, 283–293. [Google Scholar] [CrossRef]
  10. Ernst, W.R.; Jonah, P.; Doe, K.; Julien, G.; Hennigar, P. Toxicity to aquatic organisms of off-target deposition of endosulfan applied by aircraft. Environ. Toxicol. Chem. 1991, 10, 103–114. [Google Scholar] [CrossRef]
  11. Lahr, J.; Gadji, B.; Dia, D. Predicted buffer zones to protect temporary pond invertebrates from groundbased insecticide applications against desert locusts. Crop Prot. 2000, 19, 489–500. [Google Scholar] [CrossRef]
  12. Davis, B.N.K.; Williams, C.T. Buffer zone widths for honeybees from ground and aerial spraying of insecticides. Environ. Pollut. 1990, 63, 247–259. [Google Scholar] [CrossRef]
  13. Çilgi, T.; Jepson, P.C. The risks posed by Deltamethrin drift to hedgerow butterflies. Environ. Pollut. 1995, 87, 1–9. [Google Scholar] [CrossRef]
  14. Benbrook, C.M.; Baker, B.P. Perspective on dietary risk assessment of pesticide residues in organic food. Sustainability 2014, 6, 3552–3570. [Google Scholar] [CrossRef]
  15. Butler ellis, M.C.; Lane, A.G.; O’Sullivan, C.M.; Miller, P.C.H.; Glass, C.R. Bystander exposure to pesticide spray drift: New data for model development and validation. Biosyst. Eng. 2010, 107, 162–168. [Google Scholar] [CrossRef]
  16. Hofman, V.; Solseng, E. Reducing Spray Drift; North Dakota State University NDSU Extension Service AE-1210: Fargo, ND, USA, 2001. [Google Scholar]
  17. Arvidsson, T.; Bergström, L.; Kreuger, J. Spray drift as influenced by meteorological and technical factors. Pest Manag. Sci. 2011, 67, 586–598. [Google Scholar] [CrossRef] [PubMed]
  18. Nuyttens, D.; de Shampheleire, M.; Steurbaut, W.; Baetens, K.; Verboven, P.; Nicolaï, B.; Ramon, H.; Sonck, B. Experimental study of factors influencing the risk of drift from field sprayers. Part 2: Spray application technique. Asp. Appl. Biol. Int. Adv. Pestic. Appl. 2006, 77, 1–8. [Google Scholar]
  19. Praat, J.-P.; Maber, J.F.; Manktelow, D.W.L. The effect of canopy development and sprayer position on spray drift from a pipfruit orchard. N. Z. Plant Prot. 2000, 53, 241–247. [Google Scholar]
  20. Thistle, H. The role of stability in fine pesticide droplet dispersion in the atmosphere: A review of physical concepts. Trans. ASABE 2000, 46, 1409–1413. [Google Scholar] [CrossRef]
  21. Ozkan, H.E.; Zhu, H. Effect of Major Variables on Drift Distances of Spray Droplets; Extension FactSheet AEX 525-98; Food Agricultural and Biological Engineering: Columbus, OH, USA, 1998. [Google Scholar]
  22. Smith, D.B.; Harris, F.D.; Butler, B.J. Variables affecting drift from ground boom sprayers. Trans. ASABE 1982, 25, 1499–1503. [Google Scholar] [CrossRef]
  23. International Organization for Standardization. ISO 22369-1:2006: Crop Protection Equipment—Drift Classification of Spraying Equipment—Part 1: Classes; International Organization for Standardization: Geneva, Switzerland, 2006; p. 1. [Google Scholar]
  24. Van de Zande, J.C.; Stallinga, H.; Michielsen, J.M.G.P.; Velde, P.V. Effect of width of spray-free buffer zones, nozzle type and air assistance on spray drift. Asp. Appl. Biol. Int. Adv. Pestic. Appl. 2010, 99, 255–263. [Google Scholar]
  25. Balsari, P.; Marucco, P.; Tamagnone, M. A test bench for the classification of boom sprayers according to drift risk. Crop Prot. 2007, 26, 1482–1489. [Google Scholar] [CrossRef]
  26. Salyani, M.; Farooq, M. Drift potential of citrus air-carrier sprayers. Proc. Fla. State Hortic. Soc. 2004, 117, 130–135. [Google Scholar]
  27. Van de Zande, J.C.; Porskamp, H.A.J.; Michielsen, J.M.G.P.; Holterman, H.J.; Huijsman, J.F.M. Classification of spray applications for driftability, to protect surface water. Asp. Appl. Biol. Int. Adv. Pestic. Appl. 2000, 66, 57–65. [Google Scholar]
  28. Threadgill, E.D.; Smith, D.B. Effect of physical and meteorological parameters on drift of controlled size droplets. Trans. ASAE 1975, 18, 51–56. [Google Scholar]
  29. Goering, C.E.; Butler, B. Paired field studies of herbicide drift. Trans. ASAE 1975, 18, 27–34. [Google Scholar] [CrossRef]
  30. Bode, L.E.; Butler, B.J.; Goering, C.E. Spray drift and recovery as affected by spray thickener, nozzle type, and nozzle pressure. Trans. ASAE 1976, 19, 213–218. [Google Scholar] [CrossRef]
  31. Fritz, B.K. Meteorological effects on deposition and drift of aerially applied sprays. Trans. ASAE 2006, 49, 1295–1301. [Google Scholar] [CrossRef]
  32. Miller, D.R.; Stoughton, T.E.; Steinke, W.E.; Huddleston, E.W.; Ross, J.B. Atmospheric stability effects on pesticide drift from an irrigated orchard. Trans. ASAE 2000, 43, 1057–1066. [Google Scholar] [CrossRef]
  33. Courshee, R. Investigations on spray drift. Part II: The occurrence of drift. J. Agric. Eng. Res. 1959, 4, 229–241. [Google Scholar]
  34. Van de Zande, J.C.; Michielsen, J.M.G.P.; Stallinga, H. Spray Drift and Off-Field Evaluation of Agrochemicals in the Netherlands; WUR-PRI Report 149; Wageningen UR Plant Research International: Wageningen, The Netherlands, 2007. [Google Scholar]
  35. Rimmer, D.A.; Johnson, P.D.; Kelsey, A.; Warren, N.D. Field experiments to assess approaches for spray drift incident investigation. Pest Manag. Sci. 2009, 65, 665–671. [Google Scholar] [CrossRef] [PubMed]
  36. De Schampheleire, M.; Baetens, K.; Nuyttens, D.; Spanoghe, P. Spray drift measurements to evaluate the Belgian drift mitigation measures in field crops. Crop Prot. 2008, 27, 577–589. [Google Scholar] [CrossRef]
  37. Carlsen, S.C.K.; Spliid, N.H.; Svensmark, B. Drift of 10 herbicides after tractor spray application. 2. Primary drift (droplet drift). Chemosphere 2006, 64, 778–786. [Google Scholar] [CrossRef] [PubMed]
  38. Ravier, I.; Haouisee, E.; Clément, M.; Seux, R.; Briand, O. Field experiments for the evaluation of pesticide spray-drift on arable crops. Pest Manag. Sci. 2005, 61, 728–736. [Google Scholar] [CrossRef] [PubMed]
  39. Phillips, J.; Miller, P.C.H. Field and wind tunnel measurements of the airborne spray volume downwind of single flat-fan nozzle. J. Agric. Eng. Res. 1999, 72, 161–170. [Google Scholar] [CrossRef]
  40. Huijsmans, J.F.M.; van de Zande, J.C. Workshop Harmonisation of Drift and Drift Reducing Methodologies for Evaluation and Authorization of Plant Protection Products; WUR-PRI Report 390; Wageningen UR Plant Research International: Wageningen, The Netherlands, 2011. [Google Scholar]
  41. Gil, E.; Gallart, M.; Balsari, P.; Marucco, P.; Almajano, M.P.; Llop, J. Influence of wind velocity and wind direction on measurements of spray drift potential of boom sprayers using drift test bench. Agric. For. Meteorol. 2015, 202, 94–101. [Google Scholar] [CrossRef]
  42. Rautmann, D.; Streloke, M.; Winkler, R. New basic drift values in the authorization procedure for plant protection products. Mitt. Biol. Bundesanst. Land Forstwirtsch. 2001, 383, 133–141. [Google Scholar]
  43. Duga, A.T.; Ruysen, K.; Dekeyser, D.; Nuyttens, D.; Bylemans, D.; Nicolai, B.M.; Verboven, P. Spray deposition profiles in pome fruit trees: Effects of sprayer design, training system and tree canopy characteristics. Crop Prot. 2015, 67, 200–213. [Google Scholar] [CrossRef]
  44. Farooq, M.; Salyani, M. Modelling of spray penetration and deposition on citrus tree canopies. Trans. ASABE 2004, 47, 619–627. [Google Scholar] [CrossRef]
  45. Pascuzzi, S. Outcomes on the spray profiles produced by the feasible adjustments of commonly used sprayers in “Tendone” vineyards of Apulis (Southern Italy). Sustainability 2016, 8, 1307. [Google Scholar] [CrossRef]
  46. Sehsah, E.M.E.; Herbst, A. Drift potential for low pressure external mixing twin fluid nozzles based on wind tunnel measurements. Misr J. Agric. Eng. 2010, 27, 438–464. [Google Scholar]
  47. Baetens, K.; Ho, Q.T.; Nuyttens, D.; de Schampheleire, M.; Endalew, A.; Hertog, M.; Nicolai, B.; Ramon, H.; Verboven, P. Development of a 2-D-diffusion advection model for fast prediction of field drift. Atmos. Environ. 2008, 43, 1674–1682. [Google Scholar] [CrossRef]
  48. Van de Zande, J.C.; Stallinga, H.; Michielsen, J.M.G.P.; Velde, P.V. Effect of Sprayer Speed on Spray Drift. 2005. Available online: http://www.researchgate.net/publication/237430147_Effect_of_Sprayer_Speed_on_Spray_Drift (accessed on 6 September 2016).
  49. Hewitt, A.J.; Miller, P.C.H.; Bagley, W.E. Interaction of Tank Mix and Nozzle Design on Spray Performance and Drift Potential; Paper 01-011081; ASAE: St. Joseph, MI, USA, 2001. [Google Scholar]
  50. Gil, E.; Balsari, P.; Gallart, M.; Llorens, J.; Marucco, P.; Gummer Andersen, P.; Fàbregas, X.; Llop, J. Determination of drift potential of different flat fan nozzles on a boom sprayer using a test bench. Crop Prot. 2014, 56, 58–68. [Google Scholar] [CrossRef]
  51. De Jong, E.; van de Zande, J.C.; Stallinga, H. The Effects of Vertical and horIzontal Boom Movements on the Uniformity of Spray Distribution; Paper 00-PM-015; AgEng: Warwick, UK, 2000. [Google Scholar]
  52. Nuyttens, D.; de Schampheleire, M.; Verboven, P.; Brusselman, E.; Dekeyser, D. Droplet size-velocity characteristics of agricultural sprays. Trans. ASABE 2009, 52, 1471–1480. [Google Scholar] [CrossRef]
  53. Van de Zande, J.C.; Holterman, H.J.; Wenneker, M. Nozzle classification for drift reduction in orchard spraying: Identification of drift reduction class threshold nozzles. Agric. Eng. Int. CIGR J. 2008, 10, 080013. [Google Scholar]
  54. Nuyttens, D.; Baetens, K.; de Schampheleire, M.; Sonck, B. Effect of nozzle type, size and pressure on spray droplet characteristics. Biosyst. Eng. 2007, 97, 333–345. [Google Scholar] [CrossRef]
  55. Nuyttens, D.; de Schampheleire, M.; Baetens, K.; Sonck, B. PDPA Laser-based characterisation of agricultural spray nozzles. Agric. Eng. Int. CIGR J. 2006, 8, 06024. [Google Scholar]
  56. Van de Zande, J.C.; Porskamp, H.A.J.; Holterman, H.J. Influence of reference nozzle choice on spray drift classification. Asp. Appl. Biol. Int. Adv. Pestic. Appl. 2002, 66, 49–56. [Google Scholar]
  57. Wolf, T.M.; Stumborg, M.; Caldwell, B.C.; Grover, R. A chamber for scanning spray from agricultural nozzles using an Aerometrics Phase Doppler particle analyzer. Can. Agric. Eng. 1995, 37, 305–310. [Google Scholar]
  58. Bachalo, W.D.; Houser, M.J. Phase/Doppler analyzer for simultaneous measurements of drop size and velocity distributions. Opt. Eng. 1984, 23, 583–590. [Google Scholar] [CrossRef]
  59. Nuyttens, D.; Taylor, W.A.; de Schampheleire, M.; Verboven, P.; Dekeyser, D. Influence of nozzle type and size on drift potential by means of different wind tunnel evaluation methods. Biosyst. Eng. 2009, 103, 271–280. [Google Scholar] [CrossRef]
  60. Qi, L.J.; Miller, P.C.H.; Fu, Z.T. The classification of the drift risk of sprays produced by spinning discs based on wind tunnel measurements. Biosyst. Eng. 2008, 100, 38–43. [Google Scholar] [CrossRef]
  61. Guler, H.; Zhu, H.; Ozkan, H.E.; Derksen, R.C.; Yu, Y.; Krause, C.R. Spray characteristics and drift reduction potential with air induction and conventional flat fan nozzles. Trans. ASABE 2007, 50, 745–754. [Google Scholar] [CrossRef]
  62. Bayat, A.; Bozdogan, N.Y. An air-assisted spinning disc nozzle and its performance on spray deposition and reduction of drift potential. Crop Prot. 2005, 24, 951–960. [Google Scholar] [CrossRef]
  63. Fietsam, J.F.W.; Young, B.G.; Steffen, R.W. Differential response of herbicide drift reduction nozzles to drift control agents with glyphosate. Trans. ASABE 2004, 47, 1405–1411. [Google Scholar] [CrossRef]
  64. Herbst, A. A Method to Determine Spray Drift Potential from Nozzles and Its Link to Buffer Zone Restriction; Paper 011047; ASAE: St. Joseph, MI, USA, 2001. [Google Scholar]
  65. Southcombe, E.S.E.; Miller, P.C.H.; Ganzelmeier, H.; van de Zande, J.C.; Miralles, A.; Hewitt, A.J. The international (BCPC) spray classification system including a drift potential factor. In Proceedings of the Brighton Crop Protection Conference-Weeds, Brighton, UK, 17–20 November 1997; pp. 371–380. [Google Scholar]
  66. Balsari, P.; Gil, E.; Marucco, P.; Gallart, M.; Bozzer, C.; Llop, J.; Tamagnone, M. Study and development of a test methodology to assess potential drift generated by air-assisted sprayers. Asp. Appl. Biol. Int. Adv. Pestic. Appl. 2014, 122, 339–346. [Google Scholar]
  67. Nuyttens, D.; Zwertvaegher, I.; Dekeyser, D. Comparison between drift test bench results and other drift assessment techniques. Asp. Appl. Biol. Int. Adv. Pestic. Appl. 2014, 122, 293–302. [Google Scholar]
  68. Balsari, P.; Marucco, P.; Tamagnone, M. Study of a test methodology to assess potential spray drift generated by air-assisted sprayers for arboreal crops. In Proceedings of the AgEng Conference 2012, Valencia, Spain, 8–12 July 2012. [Google Scholar]
  69. Vanella, G.; Salyani, M.; Balsari, P.; Futch, S.H.; Sweeb, R.D. A method for assessing drift potential of a citrus herbicide applicator. HortTechnology 2011, 21, 745–751. [Google Scholar]
  70. Craig, I.P. The GDS model—A rapid computational technique for the calculation of aircraft spray drift buffer distances. Comput. Electron. Agric. 2004, 43, 235–250. [Google Scholar] [CrossRef]
  71. Raupach, M.R.; Briggs, P.R.; Ahmad, N.; Edge, V.E. Endosulfan transport: II. Modelling airborne dispersal and deposition by spray and vapour. J. Environ. Qual. 2001, 30, 729–740. [Google Scholar] [CrossRef] [PubMed]
  72. De-Leeuw, F.A.A.M.; Van Pul, W.; Van den Berg, F.; Gilbert, A.J. The use of atmospheric dispersion models in risk assessment decision support systems for pesticides. Environ. Monit. Assess. 2000, 62, 133–145. [Google Scholar] [CrossRef]
  73. Cox, S.J.; Salt, D.W.; Lee, B.E.; Ford, M.G. A model for the capture of aerially sprayed pesticide by barley. J. Wind Eng. Ind. Aerodyn. 2000, 87, 217–230. [Google Scholar] [CrossRef]
  74. Holterman, H.J.; van de Zande, J.C.; Porskamp, H.A.J.; Huijsmans, J.F.M. Modelling spray drift from boom sprayer. Comput. Electron. Agric. 1997, 19, 1–22. [Google Scholar] [CrossRef]
  75. Smith, R.W.; Miller, P.C.H. Drift predictions in the near nozzle region of a flat fan spray. J. Agric. Eng. Res. 1994, 59, 111–120. [Google Scholar] [CrossRef]
  76. Miller, P.C.H.; Hadfield, D. A simulation model of the spray drift from hydraulic nozzles. J. Agric. Eng. Res. 1989, 42, 135–147. [Google Scholar] [CrossRef]
  77. Sidahmed, M.; Brown, R. Computer simulation of factors affecting drift from a forestry airblast sprayer. Can. Biosyst. Eng. 2002, 44, 227–235. [Google Scholar]
  78. Tsay, J.; Fox, R.D.; Ozkan, H.E.; Brazee, R.D.; Derksen, R.C. Evaluation of a pneumatic-shielded spraying system by CFD simulation. Trans. ASABE 2002, 45, 47–54. [Google Scholar] [CrossRef]
  79. Da Silva, A.; Sinfort, C.; Vanhiesbecq, S.; Polveche, V.; Huberson, S.; Silva, F.; Bonicelli, B. Simulation of sprayed pesticide deposit within a vineyard. Parasitica 2001, 57, 195–204. [Google Scholar]
  80. Weiner, K.L.; Parkin, C.S. The use of computational fluid dynamic code for modelling spray from a mistblower. J. Agric. Eng. Res. 1993, 55, 313–324. [Google Scholar] [CrossRef]
  81. Nuyttens, D.; de Schampheleire, M.; Verboven, P.; Sonck, B. Comparison between indirect and direct spray drift assessment methods. Biosyst. Eng. 2010, 105, 2–12. [Google Scholar] [CrossRef]
  82. Gil, E.; Llorens, J.; Llop, J.; Fàbregas, X.; Gallart, M. Use of terrestrial LIDAR sensor for drift detection on vineyard spraying. Sensors 2013, 13, 516–534. [Google Scholar] [CrossRef] [PubMed]
  83. Salyani, M.; Miller, D.R.; Farooq, M.; Sweeb, R.D. Effects of sprayer operating parameters on airborne drift from citrus air-carrier sprayers. Agric. Eng. Int. CIGR Ej. 2013, 15, 27. [Google Scholar]
  84. Cunha, J.P.; Chueca, P.; Garcerá, C.; Moltó, E. Risk assessment of pesticide spray drift from citrus applications with air-blast sprayers in Spain. Crop Prot. 2012, 42, 116–123. [Google Scholar] [CrossRef]
  85. Garcia-Ramos, F.; Vidal, M.; Bone, A. Field evaluation of an air-assisted sprayer equipped with two reversed rotation fans. Appl. Eng. Agric. 2009, 25, 481–494. [Google Scholar] [CrossRef]
  86. Llorens, J.; Gallart, M.; Llop, J.; Miranda-Fuentes, A.; Gil, E. Difficulties to apply ISO 22866 requirements for drift measurements. A particular case of traditional olive tree plantations. Asp. Appl. Biol. Int. Adv. Pestic. Appl. 2016, 132, 31–37. [Google Scholar]
  87. Gil, Y.; Sinfort, C. Emission of pesticides to the air during sprayer application: A bibliographic review. Atmos. Environ. 2005, 39, 5183–5193. [Google Scholar] [CrossRef]
  88. Balsari, P.; Marucco, P.; Doruchowski, G.; Ophoff, H.; Roettele, M. Best Management Practice to Reduce Spray Drift; TOPPS Prowadis Projects Sponsored by European Crop Protection Association ECPA: Brussels Belgium, 2011; Available online: http://www.topps-life.org/uploads/8/0/0/3/8003583/ansicht_drift_book_englisch.pdf (accessed on 26 April 2017).
  89. Cook, R.J. The potential impact of buffer zones in agricultural practice. In Buffer Zones: Their Processes and Potential in Water Protection; Haycock, N., Burt, T., Goulding, K.W.T., Pinay, G., Eds.; QUEST Environmental: Harpenden, UK, 1997; pp. 265–274. [Google Scholar]
  90. Meier, U. Growth Stages of Mono- and Dicotylodonous Plants: BBCH Monograph, 2nd ed.; Uwe Meier Federal Biological Research Centre for Agriculture and Forestry: Braunschweigh, Germany, 2001; pp. 1–158. [Google Scholar]
  91. Lorenz, D.; Eichorn, D.; Bleiholder, H.; Klose, R.; Meier, U.; Weber, E. Phänologische Entwicklungsstadien der Weinrebe (Vitis vinifera L. ssp. vinifera). Codierung und Beschreibung nach der erweiterten BBCH-Skala. Vitic. Enol. Sci. 1994, 49, 66–70. [Google Scholar]
  92. Meier, U.; Garf, H.; Hack, H.; Hess, M.; Kennel, W.; Klose, R.; Mappes, D.; Seipp, D.; Stauss, R.; Streif, D.; van den Boom, T. Phänologische Entwicklungsstadien der Kernobstes (Malus domestica Borkh. und Pyrus communis L.), des Steinobstes (Prunus-Arten), der Johannisbeere (Ribes-Arten) und der Erdbeere (Fragaria x ananassa Duch.). Codierung und Beschreibung nach der Erweiterten BBCH-Skala, mit Abbildungen. Nachrichtenbl. Deut. Pflanzenschutzd. 1994, 46, 141–153. [Google Scholar]
  93. Pergher, G. Recovery rate and tracers dye used for spray deposit assessment. Trans. ASABE 2001, 44, 787–794. [Google Scholar] [CrossRef]
  94. International Organization for Standardization. ISO 22401:2015: Equipment for Crop Protection—Method for Measurement of Potential Drift from Horizontal Boom Sprayer Systems by the Use of a Test Bench; International Organization for Standardization: Geneva, Switzerland, 2015; p. 12. [Google Scholar]
  95. Grella, M.; Marucco, P.; Manzone, M.; Gallart, M.; Balsari, P. Effect of sprayer settings on spray drift during pesticide application in poplar plantations (Populus spp.). Sci. Total Environ. 2017, 578, 427–439. [Google Scholar] [CrossRef] [PubMed]
  96. IBM Corp. IBM SPSS Statistics for Windows, Version 22.0; IBM Corp.: Armonk, NY, USA, 2013. [Google Scholar]
  97. Pergher, G.; Petris, R. The effect of air flow rate on spray deposition in a Guyot trained vineyard. Agric. Eng. Int. CIGR Ej. 2008, 10, 08010. [Google Scholar]
  98. Balsari, P.; Marucco, P.; Grella, M.; Savoia, S. Spray drift measurements in Italian vineyards and orchards. In Proceedings of the 13th Workshop on Spray Application in Fruit Growing (SuproFruit 2015), Lindau/Lake Costance, Germany, 15–18 July 2015; pp. 30–31. [Google Scholar]
  99. Van de Zande, J.C.; Butler Ellis, M.C.; Wenneker, M.; Walklate, P.J.; Kennedy, M. Spray drift and bystander risk from fruit crop spraying. Asp. Appl. Biol. Int. Adv. Pestic. 2014, 122, 177–185. [Google Scholar]
  100. Belcher, S.E.; Jerram, N.; Hunt, J.C.R. Adjustment of a turbulent boundary layer to a canopy of roughness elements. J. Fluid Mech. 2003, 488, 369–398. [Google Scholar] [CrossRef]
  101. Da Silva, A.; Sinfort, C.; Tinet, C.; Pierrot, D.; Huberson, S. A lagrangian model for spray behaviour within vine canopies. J. Aerosol Sci. 2006, 37, 658–674. [Google Scholar] [CrossRef]
  102. Yi, C. Momentum transfer within canopies. J. Appl. Meteorol. Clim. 2008, 47, 262–275. [Google Scholar] [CrossRef]
  103. Cross, J.V.; Walklate, P.J.; Murray, R.A.; Richardson, G.M. Spray deposits and losses in different sized apple trees from an axial fan orchard sprayer: 3. Effects of air volumetric flow rate. Crop Prot. 2003, 22, 381–394. [Google Scholar] [CrossRef]
  104. De Schampheleire, M.; Nuyttens, D.; Dekeyser, D.; Verboven, P.; Spanoghe, P.; Cornelis, W.; Gabrielis, D.; Steurbaut, W. Deposition of spray drift behind border structures. Crop Prot. 2009, 28, 1061–1075. [Google Scholar] [CrossRef]
  105. Cleugh, H.A. Effects of windbreaks on airflow, microclimates and crop yields. Agrof. Syst. 1998, 41, 55–84. [Google Scholar] [CrossRef]
  106. Raupach, M.R.; Woods, N.; Dorr, G.; Leys, J.F.; Cleugh, H.A. The entrapment of particles by windbreaks. Atmos. Environ. 2001, 35, 3373–3383. [Google Scholar] [CrossRef]
  107. Combellack, J.H.; Western, N.M.; Richardson, R.G. A comparison of the drift potential of a novel twin fluid nozzle with conventional low-volume flat-fan nozzles when using a range of adjuvants. Crop Prot. 1996, 15, 147–152. [Google Scholar] [CrossRef]
  108. Maybank, J.; Yoshida, K.; Grover, R. Spray drift from agriculture pesticide applications. J. Air Pollut. Control Assoc. 1978, 28, 1009–1014. [Google Scholar] [CrossRef]
  109. Yates, W.E.; Akesson, N.B.; Couts, H.H. Drift hazards related to ultra-low-volume and dilute sprays by agricultural aircraft. Trans. ASABE 1967, 10, 628–638. [Google Scholar] [CrossRef]
  110. Bird, S.L.; Esterly, D.M.; Perry, S.G. Atmospheric pollutants and trace gases. Off-target deposition of pesticides from agricultural aerial spray applications. J. Environ. Qual. 1996, 25, 1095–1104. [Google Scholar] [CrossRef]
  111. Combellack, J.H. Loss of herbicides from ground sprayers. Weed Res. 1982, 22, 193–204. [Google Scholar] [CrossRef]
  112. Frost, K.R.; Ware, G.W. Pesticide drift from aerial and ground applications. Agric. Eng. 1970, 51, 460–464. [Google Scholar]
  113. Bode, L.E. Downwind drift deposits by ground applications. Proceedings of Pesticide Drift Management Symposium; South Dakota University: Brookings, SD, USA, 1984; p. 50. [Google Scholar]
  114. Bouse, L.F.; Kirk, I.W.; Bode, L.E. Effect of spray mixture on droplet size. Trans. ASAE 1990, 33, 783–788. [Google Scholar] [CrossRef]
Figure 1. Trial layout according to the ISO22866:2005 [5].
Sustainability 09 00728 g001
Figure 2. Compass rose representing all wind directions during trials and relative scheme of spray track direction in vineyard and apple tree orchard.
Sustainability 09 00728 g002
Figure 3. Boxplots of (a) all wind speed and (b) all wind direction measurements for 24 trials, 12 in vineyard and 12 in apple tree orchard.
Sustainability 09 00728 g003
Figure 4. Scatterplot and red LOESS curve (Kernel Epanechnikov function that fit 90% of points) to explore relationship between minimum wind speed and wind direction range for all field trials (n = 24).
Sustainability 09 00728 g004
Figure 5. Scatterplots of wind direction values in relation to the wind speed values recorded in all trials conducted in (a) vineyard (n = 4608); and (b) apple tree orchard (n = 3312).
Sustainability 09 00728 g005
Figure 6. Spray drift deposition profile obtained using vineyard sprayer in vineyard crop: (a) mean and (b) 90th percentile based on percent of applied volume. Spray drift deposit on the collectors are represented at each distance from the sprayed area. Configurations: nozzles (ATR: conventional, TVI: air induction), forward speed (6:6 km h−1) and airflow rate (L: low, H: high). Reference: Grape Vine Late Growth (GVLG) proposed by Rautmann et al. [42].
Sustainability 09 00728 g006
Figure 7. Airborne spray drift deposition profile obtained using vineyard sprayer in vineyard crop: (a) mean and (b) 90th percentile based on percent of applied volume. Spray drift deposit on the collectors are represented at two heights above the ground. Configurations: nozzles (ATR: conventional, TVI: air induction), forward speed (6:6 km h−1) and airflow rate (L: low, H: high).
Sustainability 09 00728 g007
Figure 8. Drift values (DVs) derived from: (a) ground deposition and airborne spray drift curves at (b) 5 m and (c) 10 m distance to the sprayed area for each configuration tested using vineyard sprayer. The bars show the mean ± SE of the mean. Configurations: nozzles (ATR: conventional, TVI: air induction), forward speed (6:6 km h−1), and fan airflow rate (L: low, H: high).
Sustainability 09 00728 g008
Figure 9. Spray drift deposition profile obtained using orchard sprayer in apple tree orchard crop: (a) mean and (b) 90th percentile based on percent of applied volume. Spray drift deposit on the collectors are represented at each distance from the sprayed area. Configurations: nozzles (ATR: conventional, TVI: air induction), forward speed (6:6 km h−1) and airflow rate (L: low, H: high). Reference: Fruit Crop Late Growth (FCLG) proposed by Rautmann et al. [42].
Sustainability 09 00728 g009
Figure 10. Airborne spray drift deposition profile obtained using orchard sprayer in apple tree orchard crop: (a) mean and (b) 90th percentile based on percent of applied volume. Spray drift deposit on the collectors are represented at each height above the ground. Configurations: nozzles (ATR: conventional, TVI: air induction), forward speed (6:6 km h−1) and airflow rate (L: low, H: high).
Sustainability 09 00728 g010
Figure 11. Drift values (DVs) derived from: (a) ground deposition and airborne spray drift at (b) 5 m and (c) 10 m distance to the sprayed area curves, according to the configurations tested using orchard sprayer. The bars show the mean ± SE of the mean. Configurations: nozzles (ATR: conventional, TVI: air induction), forward speed (6:6 km h−1), and fan airflow rate (L: low, H: high).
Sustainability 09 00728 g011
Figure 12. Visual patterns of relevant relationships among CV% of Drift Values ((e) DVs of ground and (a,c) airborne 5 m; and (b,d) airborne 10 m) and CV% of wind characteristics ((ad) wind speed and (e) wind direction) (n = 8). CV% represent the variability among the three replicates of each configuration tested in field trials using vineyard sprayer and orchard sprayer.
Sustainability 09 00728 g012
Figure 13. Principal Component Analysis (PCA) bi-plots for the first three principal components (PCs: (a) PC1 vs. PC2; (b) PC2 vs. PC3; and (c) PC3 vs. PC1), which explain 89.5% of variance in the PCA analysis of sprayer configurations tested using the ISO22866 field trials test method. Red dots represent the scores for the vineyard sprayer and green dots represent the scores for the orchard sprayer. PCA variable loadings are shown as lines: sprayer setting parameters (nozzles D[v,0.1], D[v,0.5], and D[v,0.9] in blue and fan air volume in violet), main wind characteristics (Min, Max, Mean wind speed and Mean wind direction in red) and spray drift deposition (ground and airborne at 5 m and 10 m in green). Configurations: nozzles (ATR: conventional, TVI: air induction), forward speed (6:6 km h−1) and airflow rate (L: low, H: high).
Sustainability 09 00728 g013
Table 1. Parameters of all configurations examined using vineyard (Dragone k2 500) and orchard (Fede Qi 90 Futur 2000) sprayers.
SprayerNozzle TypeFan Air Flow Rate (m3 h−1)Forward Speed (m s−1)Configuration ID a
VineyardATR 80 orange20,0001.67ATR6H
VineyardATR 80 orange11,0001.67ATR6L
VineyardTVI 8002 yellow20,0001.67TVI6H
VineyardTVI 8002 yellow11,0001.67TVI6L
OrchardATR 80 red46,0001.67ATR6H
OrchardATR 80 red29,0001.67ATR6L
OrchardTVI 80025 lilac46,0001.67TVI6H
OrchardTVI 80025 lilac29,0001.67TVI6L
a: The ID configuration is composed by three letters that means the nozzle type, one number that means the forward speed (expressed in km h−1) and another letter that means the fan air flow rate (Low and High).
Table 2. Main characteristics of the nozzles used in the trials.
Nozzle TypeSpray Pressure (MPa)D[v,0.1] a (µm)D[v,0.5] a (µm)D[v,0.9] a (µm)V100 b (%)Flow Rate (L min−1)Spray Angle (°)
ATR 80 orange1.0479517150.451.3980
TVI 8002 yellow1.019060612712.421.4680
ATR 80 red1.5328617357.642.3380
TVI 80025 lilac1.51284078725.592.2480
a D[v,0.1], 10% of spray liquid volume fraction is made up of droplets smaller than this value; D[v,0.5], volume median diameter; D[v,0.9], 90% of spray liquid volume is made up of droplets smaller than this value; b V100: spray liquid fraction generated with small droplets (<100 µm).
Table 3. Weather conditions recorded during the trials, split by replicate.
Config & ReplicatesWeather Parameters
TemperatureRHWind SpeedWind Direction
MeanMeanMinMaxMeanOutliers aMeanRangeCentered b
°C°C%%m s−1m s−1m s−1%° az.°%
Vineyard sprayer
ATR6H126.80.1563.90.391.97.14.30.0155.16996.1
226.50.1568.30.420.25.02.38.8176.014697.9
325.80.1570.60.430.44.22.14.6167.212296.1
ATR6L123.90.1678.80.410.32.21.139.9183.610499.3
228.50.1350.50.342.410.85.50.0158.97296.5
325.20.1362.90.420.13.91.712.9201.730482.5
TVI6H122.60.1470.40.500.03.41.439.5201.521669.4
222.70.1364.60.370.13.61.434.8182.618486.5
322.30.1766.30.350.12.41.147.9213.916364.7
TVI6L125.80.1572.50.461.15.82.90.0163.59199.3
225.40.1374.50.491.15.12.50.0174.676100.0
324.00.1478.90.450.83.92.10.8162.57699.4
Apple tree orchard sprayer
ATR6H124.40.1979.70.260.52.01.313.5175.79199.8
223.90.1781.60.320.42.61.225.0172.412098.3
326.10.1477.10.501.25.92.80.0180.111499.3
ATR6L125.50.1273.20.560.93.82.20.5148.110980.4
225.40.1173.00.550.94.22.30.5148.710489.4
325.30.1373.40.560.63.82.23.0153.410090.0
TVI6H124.70.1375.30.580.84.52.12.9165.68496.7
224.70.1375.60.570.95.02.50.4163.29297.1
324.60.1375.90.571.04.52.50.4168.98698.7
TVI6L126.40.1573.60.450.74.42.41.5204.18295.3
226.40.1571.90.461.05.73.00.1195.010497.6
325.90.1474.20.501.05.02.50.0187.78999.8
a Percentage of records < 1 m s−1; b Percentage of records between 180° ± 45°.
Table 4. Statistical analysis of relationships between wind speed variables and wind direction variables (n = 24).
Wind Speed
Wind DirectionMin (m s−1)Max (m s−1)Mean (m s−1)Outliers (%) a
Pr (>F)Sign. cρ dPr (>F)Sign. cρ dPr (>F)Sign. cρ dPr (>F)Sign. cρ d
Mean (°az)0.010**−0.5160.137NS−0.3120.045*−0.4130.004**0.567
Range (°)0.001***−0.6370.123NS−0.3230.025*−0.4560.007**−0.534
Center (%) b0.028*0.4470.139NS0.3110.082NS0.3630.002**−0.611
a Percentage of records < 1 m s−1; b Percentage of records between 180° ± 45°; c Statistical significance level: NS Pr > 0.05; * Pr < 0.05; ** Pr < 0.01; *** Pr < 0.001; d Pearson’s coefficient of correlation among wind speed variables (Min, Max, Mean and Outliers) and wind direction variables (Mean, Range and Centered observations).
Table 5. Significance obtained in two-way ANOVAs for Drift Values (DVs) as affected by nozzle type and sprayer fan airflow rate using vineyard sprayer. Results are categorized into ground spray and airborne spray drift depositions, assessed at 5 and 10 m from the sprayed area.
Vineyard Sprayer
Ground DVs aAirborne 5 m DVs aAirborne 10 m DVs a
SourcePr (>F)Sign. bPr (>F)Sign. bPr (>F)Sign. b
Nozzle type0.001**4.54 × 10⁻⁴***4.51 × 10⁻⁴***
Fan air flow rate0.554NS0.822NS0.753NS
Nozzle type * Fan air flow rate0.174NS0.316NS0.267NS
a Drift Values -DVs-; b Statistical significance level: NS Pr > 0.05; * Pr < 0.05; ** Pr < 0.01; *** Pr < 0.001.
Table 6. Significance obtained two-way ANOVAs for Drift Values (DVs) as affected by nozzle type and sprayer fan airflow rate using orchard sprayer. Results are categorized by ground and airborne spray drift deposition assessed at 5 and 10 m to the sprayed area.
Orchard Sprayer
Ground DVs aAirborne 5 m DVs aAirborne 10 m DVs a
SourcePr (>F)Sign. bPr (>F)Sign. bPr (>F)Sign. b
Nozzle type2.51 × 10−4***0.003**0.001**
Fan air flow rate0.193NS0.372NS0.697NS
Nozzle type * Fan air flow rate0.152NS0.600NS0.697NS
a Drift Values -DVs-; b Statistical significance level: NS Pr > 0.05; * Pr < 0.05; ** Pr < 0.01; *** Pr < 0.001.
Table 7. Relationships among Drift Values (respectively ground, airborne 5 m, and airborne 10 m) and wind speed characteristics (Min, Max, Mean, and Outliers) for 24 field trials (n = 24).
Drift Values -DVs-Wind Speed
Min (m s−1)Max (m s−1)Mean (m s−1)Outliers (%)a
Pr (>F)Sign. bρ cPr (>F)Sign. bρ cPr (>F)Sign. bρ cPr (>F)Sign. bρ c
Ground0.250NS2.44 × 10−10.026*0.4520.037*0.4290.612NS−0.109
Airborne 5 m0.012*0.5031.16 × 10−4***0.7063.07 × 10−4***0.6740.277NS−0.231
Airborne 10 m0.024*0.4602.80 × 10−4***0.6770.001***0.6410.292NS−0.225
a Percentage of records < 1 m s−1; b Statistical significance level: NS Pr > 0.05; * Pr < 0.05; ** Pr < 0.01; *** Pr < 0.001; c Pearson’s coefficient of correlation.
Table 8. Relationships among Drift Values (respectively ground, airborne 5 m, and airborne 10 m) with wind direction characteristics (Mean, Range, and Centered) for 24 field trials (n = 24).
Drift Values -DVs-Wind Direction
Mean (°az)Range (°)Centered (%) a
Pr (>F)Sign. bρ cPr (>F)Sign. bρ cPr (>F)Sign. bρ c
Ground0.339NS−0.2040.501NS0.1440.713NS0.079
Airborne 5 m0.199NS−0.2720.482NS0.1510.866NS−0.036
Airborne 10 m0.234NS−0.2520.497NS0.1460.995NS−0.001
a Percentage of records between 180° ± 45°; b Statistical significance level: NS Pr > 0.05; * Pr < 0.05; ** Pr < 0.01; *** Pr < 0.001; c Pearson’s coefficient of correlation.
Table 9. Relationships among CV% of Drift Values (DVs of ground, airborne 5 m, and airborne 10 m), and CV% of wind speed characteristics (Min, Max, Mean, and Outliers) (n = 8). CV% represents the variability among the three replicates of each configuration tested in field trials.
Drift Values -CV%-Wind Speed -CV%-
Min (m s−1)Max (m s−1)Mean (m s−1)Outliers (%) a
Pr (>F)Sign. bρ cPr (>F)Sign. bρ cPr (>F)Sign. bρ cPr (>F)Sign. bρ c
Ground0.153NS0.5560.239NS0.4710.290NS0.4280.571NS−0.237
Airborne 5 m0.104NS0.6162.93 × 10−4***0.9500.003**0.8870.785NS0.116
Airborne 10 m0.091NS0.6351.47 × 10−4***0.9610.003**0.8910.903NS0.052
a Percentage of records < 1 m s−1; b Statistical significance level: NS Pr > 0.05; * Pr < 0.05; ** Pr < 0.01; *** Pr < 0.001; c Pearson’s coefficient of correlation.
Table 10. Relationships among CV% of Drift Values (DVs of ground, airborne 5 m, and airborne 10 m), and CV% of wind direction characteristics (Mean, Range, and Centered) (n = 8). CV% represents the variability among the three replicates of each configuration tested in field trials.
Drift Values -CV%-Wind Direction -CV%-
Mean (°az)Range (°)Centered (%) a
Pr (>F)Sign. bρ cPr (>F)Sign. bρ cPr (>F)Sign. bρ c
Ground0.004**0.8770.073NS0.6630.103NS0.617
Airborne 5 m0.142NS0.5670.710NS0.1570.026*0.770
Airborne 10 m0.142NS0.5680.657NS0.1880.026*0.768
a Percentage of records between 180° ± 45°; b Statistical significance level: NS Pr > 0.05; * Pr < 0.05; ** Pr < 0.01; *** Pr < 0.001; c Pearson’s coefficient of correlation.

