
Building Criteria for Evaluating Green Project Management: An Integrated Approach of DEMATEL and ANP

1
Department of Business Administration, Tunghai University, Taichung 40704, Taiwan
2
Institute of Creative Industries Design, National Cheng Kung University, Tainan 701, Taiwan
3
Business School, Shantou University, Shantou 515063, China
*
Author to whom correspondence should be addressed.
Sustainability 2017, 9(5), 740; https://doi.org/10.3390/su9050740
Submission received: 17 March 2017
/
Revised: 17 April 2017
/
Accepted: 28 April 2017
/
Published: 3 May 2017
(This article belongs to the Section Economic and Business Aspects of Sustainability)
Abstract
:A complete framework for assessing a green project management has not been clearly identified in prior literature. The purpose of this paper is to develop a set of dimensions and criteria for evaluating a green project management. An integrated approach combining the decision making trial and evaluation laboratory (DEMATEL) and the analytical network process (ANP) is used to determine the interrelationship structure and priority of each dimension and each criterion in a green project management. Six dimensions and twenty-four criteria of a green project management are identified based on related research in the fields of environmental sustainability and supply chain management. The empirical results show the interrelationship structure and priority of each dimension and each criterion in a green project management. The findings of this study provide important implications for both managerial managers and academic researchers.
1. Introduction
Environmental sustainability has become increasingly a key focus attention to both society and business firms as regulatory requirements tighten and customer demands change [1]. Consumers have changed their views and interests in the products they buy. Environmental friendly products and services are primarily placed in the first order of consumers’ preferences [2]. Investors and shareholders are likely to invest more resources in socially responsible firms [3]. Government agency and community also favor companies that integrate environmental sustainability into their business operations [4]. As a result, many companies have embraced environmental issue into their long-term strategy [1]. This environmentally oriented strategy is of ultimate importance for sustainable corporate success, which helps firms obtain legitimacy, competitiveness, and economic performance [5].
Going green requires firms’ long-term commitment to pollution prevention, green product development, and clean technology [6,7]. Recently, the attention of corporate environmental strategy has been shifting from pollution prevention and clean technology to green product innovation [1]. This shift, due to sustainable products, can help firms develop new markets, improve corporate image, increase efficiency of resource allocation, and enhance competitive advantages [8]. In literature, investigations on environmental sustainable strategy often give more focus on green product design [9], clean production processes [10], organization environmental management system [11], and green supply chain management [12]. However, these research attentions have largely ignored the importance of green project management in the firms’ environmental strategies [13].
The success of environmental strategies depends largely on the success of green project management because it integrates all aspects of organization into a series of activities to obtain sustainable objectives [14]. For example, pollution prevention project involves in structural changes in the production process, which aims at reducing pollution at the source of the product [15]. This type of project deals with the production technology and the supply chain to ensure pollution reduction. It involves multiple departments such as engineering, marketing, production, and other stakeholders in the project [13]. By contrast, green management system project refers to infrastructure changes in the organization, which aims at reducing pollution at the root through procedural changes or different ways of conducting the operations [15]. These two types of environmental projects require the integration of both organizational and technological interactions between different steps to complete a green project [16]. Furthermore, the benefits of green project management reflect on the improvement of productivity, competitiveness, and innovative products and services [17]. However, the success of green project management often relies on project complexity, which is determined by a number of elements [17]. This set of elements and their interrelation are important in evaluating the performance of a green project management [16]. Unfortunately, none of the previous studies have clearly identified a complete set of elements for evaluating green project management [6,7,8,9,10,11,12,13,14,15,16,17]. This scant research attention provides very little references for project management researchers and business practitioners [13].
This research aims at enrich the environmental sustainability literature by developing criteria for assessing green project management. The contributions of this study are as follows. First, this study integrates environmental research and green supply chain management literature to propose a complete set of dimensions and criteria for evaluating green project management. A combination of the decision making trial and evaluation laboratory (DEMATEL) and the analytical network process (ANP) methods is used to determine the importance of each criterion and the interrelation among these criteria. Based on this framework, project managers can understand the priority and relationship among elements of a green project. Consequently, they can enhance efficiency and effectiveness and reduce risk in their decision making process. Second, this study provides direction for project managers to plan a complete framework of a green project management, which is used for dealing with cross functional units and/or cross organizations in a project. Project managers and partners can enhance their coordination and integration in order to complete their green projects. Third, the framework of green project management in this study can be viewed as an effective technique that helps firms introduce green practices and improve their environmental performance.
In the next section, the literature review is discussed in order to identify the dimensions and criteria for a green project management. Then, the research methodology is presented. Finally, the empirical analysis is carried out and the main findings are discussed.
2. Literature Review
2.1. Green Project Management
Over the past decades, environmental change has led to many challenges to business firms [1]. A wide range of factors such as institutional forces, stakeholder pressures, and organizational resources and cultural factors have driven firms to be more environmentally oriented [3]. Several studies have discussed green manufacturing, which emphasizes on practices and resources deployed by firms to address environmental challenges [18,19,20,21]. For example, Rehman et al. [18] investigated the impact of green manufacturing practices on organizational performance. Salem and Deif [19] adopted Geometric Mean Method (GMM) and Data Envelopment Analysis (DEA) to assess the greenness level of cross industries and intra-industries layer. Wong et al. [20] examined the role of green operations and the effect of environmental management capability of suppliers on firm performance. Jonrinaldi and Zhang [21] proposed a model to integrate production, inventory and transportation decision in a whole green manufacturing supply chain.
Green manufacturing mainly deals with clean technology, pollution prevention and reduction, and green management systems [22,23]. These aspects of green manufacturing often refer to activities in production process, product design, quality management, and green supply chain [24,25,26]. Besides, green project management is another important aspect of green manufacturing in coping with environmental issues [13]. Green project involves in a bundle of different green practices. The production of green products and services of large scales is typically undertaken on a green project basis [27]. For example, green purchasing and material management projects are engaged in green supply chain [26] or pollution prevention and reduction project is embraced in the total quality management [28]. The definition of green project management ranges from simple green purchasing and procurement to integration of clean production process, total quality environmental management, and green supply chain [26]. Thus, green project management is a broad concept that deals with every aspect of environmental strategies to lowering environmental impact and increasing ecological efficiency [13,29].
2.2. Green Project Management Evaluation
Sarkis [28] suggested green practices should be assessed in five major components, which include total quality environmental management, green design, green supply chain, life cycle analysis, and ISO 14000 environmental management systems. Kolk and Pinkse [30] identified environmental measures in a number of dimensions, including process improvement, product development, new product and market combination, internal transfer of emission reductions, acquisition of emission credits and supply chain. Humphreys, Wong and Chan [31] categorized environmental criteria into two groups: quantitative environmental criteria and qualitative environmental criteria. Albino et al. [1] also indicated that environmental evaluation should focus on both process and organizational levels. The process orientation emphasizes clean production while the organizational orientation highlights environmental management system. Chan et al. [3] proposed two types of environmental orientation, internal and external. Internal environmental orientation refers to firms’ internal commitment to environmental protection. External environmental orientation concerns the environmental requirements of external stakeholders. Thoumy and Vachon [13] suggested that environmental projects should be evaluated in terms of project complexity, which can be viewed as the degree of interactions between structural changes in technology and infrastructure changes in organizational management systems. Among all these above studies, however, most of them only focused on environmental view point as a whole and did not consider green project management as an integration basis. In a comprehensive view of environmental strategy, assessing green project management is important because green project management contributes to the success of a firm’s environmental strategy and financial return [13,32]. Therefore, based on the above studies and prior research in the environmental sustainability literature [3,23,26,33,34], green project management is evaluated by three constructs in this study: process, organization, and environment. Process construct involves internal and external aspects of production process and clean technology [13]. Organization construct emphasizes environmental management systems, which deals with internal firm (e.g., policy, structure, management, and performance) and external firm (e.g., stakeholders and suppliers) [1,35]. Environment construct focuses on managerial commitment and recognition of the interrelation between firms and environment [3,23]. The details of dimensions and criteria for evaluating green project management are presented in Table 1.
3. Method
3.1. Data Collection
The data of this study were collected though two phases. In the first phase, ten experts in the project management of green energy industry were invited to confirm the constructs, dimensions and criteria for evaluating a green project management (the average tenure of these experts in their fields is 7 years). After combining the suggestions of all these experts, the final framework for green project management was confirmed with 6 dimensions and 24 criteria (as presented in Table 1). In the second phase, a questionnaire was designed based on the DEMATEL and ANP methods (discussed in the following section). An example of the questionnaires can be seen in Appendix A and Appendix B, respectively. Then, the questionnaires were delivered to 10 project managers from the green energy industry. After removing three incomplete questionnaires, a final sample of 7 complete questionnaires was used for the analysis.
3.2. Integrated Approach of DEMATEL and ANP
According to prior literature on DEMATEL (decision making trial and evaluation laboratory) and ANP (analytical network process) methods [36,37,38,39,40]. An integrated approach of DEMATEL and ANP is used in this study. ANP is a good traditional approach which helps decision makers deal with both dependence of criteria within a cluster and among different clusters. However, these criteria are often interdependent and are difficult to acquire individual weights [41]. Therefore, we use DEMATEL method to construct a causal network structure among all dimensions and criteria of green project management, and then we adopt ANP approach to prioritize the ranking of weighting in all criteria based on this causal network structure. An integrated approach of DEMATEL and ANP is described as follows.
The DEMATEL method: the DEMATEL method is used to visualize and present the interrelations between criteria through the use of matrices and digraphs. The method can be summarized in the following steps:
Step 1: Find the initial average matrix. In this step, each respondent is asked to assess the degree of direct impact each dimension/criteria i exerts on each dimension/criteria j. These pairwise comparisons between any two dimensions/criteria are denoted by aij, and are evaluated by a scale of 0, 1, 2, 3, and 4, representing “no influence (0)” to “very high influence (4)”, respectively. Each respondent would generate a n n non-negative answer matrix, and then an average matrix A is obtained through the mean of the same dimensions/criteria in the various n n non-negative matrices of the respondents. The average matrix A is called the initial average matrix as presented in the following equation:
Step 2: Calculate the normalized initial influence matrix. The normalized initial influence matrix D can be obtained by normalizing the average matrix A in the following way:
where
Step 3: Compute the total influence matrix. A continuous decrease of the indirect effects of problems along the powers of D, e.g., D2, D3, …, Dg and , where , 0 ≤ dij ≤ 1 and or only one row or one column sum is equal to 1. The total influence matrix T is an n n matrix and is defined as follow:
Let r and c represent the two vectors that denote the sum of rows and sum of columns of the matrix T:
where ri represents the sum of ith row in matrix T and shows the total effects (both direct and indirect effects) of the dimension/criterion i to the other dimension/criterion j. In a similar way, cj denotes the sum of the jth column in matrix T and indicates the total effects (both direct and indirect effects) that the dimension/criterion j has received from the other dimension/criterion i. when i = j, the sum (i + j) gives an index of the strength of influences given and received by dimension/criterion i. In other words, the sum (i + j) indicates the importance of the dimension/criterion i in the problem. In addition, the difference (i − j) shows the net effect that the dimension/criterion i contribute to the problem. If the difference (i − j) is positive, then the dimension/criterion i affects other dimension/criteria, and if (i − j) is negative, then the dimension/criterion i is affected by other dimension/criteria.
Step 4: Set a threshold value and obtain the network relationship map. In order to filter some negligible effects in matrix T and reduce the complexity of information when creating the network relationship map, setting a threshold value, α, is necessary. By setting this threshold value, only dimensions/criteria whose influence values are higher than the threshold value can be selected and presented in the network relationship map. Thus, a new total influence matrix Tm is obtained (as shown in Equation (7)) and the network relationship map is generated.
The ANP method: The ANP method is an extension of the analytic hierarchy process (AHP) method. The AHP only deals with inner dependence within a dimension/criterion. However, the ANP allows more complex interrelationships among dimensions/criteria in a framework. The ANP method can be described in the following steps:
Step 5: Find the unweighted supermatrix. The unweighted supermatrix is obtained from pairwise comparison matrices of criteria in the whole framework. This is done through pairwise comparisons by asking “how much importance does a criterion have as compared to another criterion with respect to respondent’s preference?”, the assessing score is determined by using a scale ranging from 1 to 9 to represent equal importance to extreme importance. The general form of unweighted supermatrix can be described as follows:
where Gn represents the nth dimension, enm denotes the m criterion in the nth dimension, and Wij is the principle eigenvector of the influence of the criteria compared in the jth dimension to the ith dimension. If the jth dimension has no influence on the ith dimension, then Wij = [0].
Step 6: Compute the weighted supermatrix. The weighted supermatrix is computed by multiplying the normalized total-influence matix Tp and the unweighted supermatrix (Step 5). The normalized total-influence matrix Tp is derived from the total influence matrix Tm in the DEMATEL method (Step 4). The normalize total-influence matrix Tp is represented as follows:
where the normalized scores of the total-influence matrix Tp are .
Then, the weighted supermatrix Ws is calculated as follows:
Step 7: Calculating the limiting weighted supermatrix. The weighted supermatrix is raised to a sufficiently large power k until the supermatrix has converged and be stable to obtain the global priority vectors (or weights).
Furthermore, if the limiting weighted supermatrix is not the only one, it would be computed by adding the N supermatrices and diving by N (e.g., there are N supermatrices) to obtain the final limiting weighted supermatrix.
4. Empirical Results
4.1. Results of the DEMATEL Model
4.1.1. Interrelationships among Dimensions of a Green Project Management
Table 2 shows the total influence matrix of the six dimensions of a green project management. According to this table, the sum (ri + ci) and the difference (ri − ci) are calculated to determine the strength of influences given and received by the dimensions as well as the net effects of these dimensions (Table 3). As shown in Table 3, the sum of the external process (ri + ci = 3.326) is the highest value while the sum of the external environment (ri + ci = 2.655) is the lowest value, indicating the interdependent effects of external process is the greatest and the interdependent effects of external environment is the smallest in a green project management. By contrast, the difference of external process (ri − ci = −0.094) and the difference of internal process (ri − ci = −0.156) are below zero, representing both internal process and external process are affected by other dimensions of a green project management. Furthermore, the difference scores (ri − ci) of internal organization (ri − ci = 0.045), external organization (ri − ci = 0.104), internal environment (ri − ci = 0.046), and external environment (ri − ci = 0.061) are all positive, suggesting these four dimensions are the net causers in a green project management.
In addition, to visualize the interrelationships among dimensions of a green project management in a digraph, the threshold value (α value) for judgment of dimension correlation is set equal to 0.259 which is the average of the total influence matrix. With threshold value of 0.259, only dimensions whose influence values are higher than the threshold value can be selected and presented in the network relationship map (Figure 1). As shown in the Figure 1, internal process and external process are the two dimensions that receive the influences of other dimensions. Internal organization is influenced by external process, external organization, and internal environment. External organization is affected by internal organization and external process. Internal environment is influenced by internal organization and external organization. However, the influence values of external environment are less than the threshold value, and this dimension is not selected and presented in the network relationship map (Figure 1).
4.1.2. Interrelationships among Criteria of Dimensions in a Green Project Management
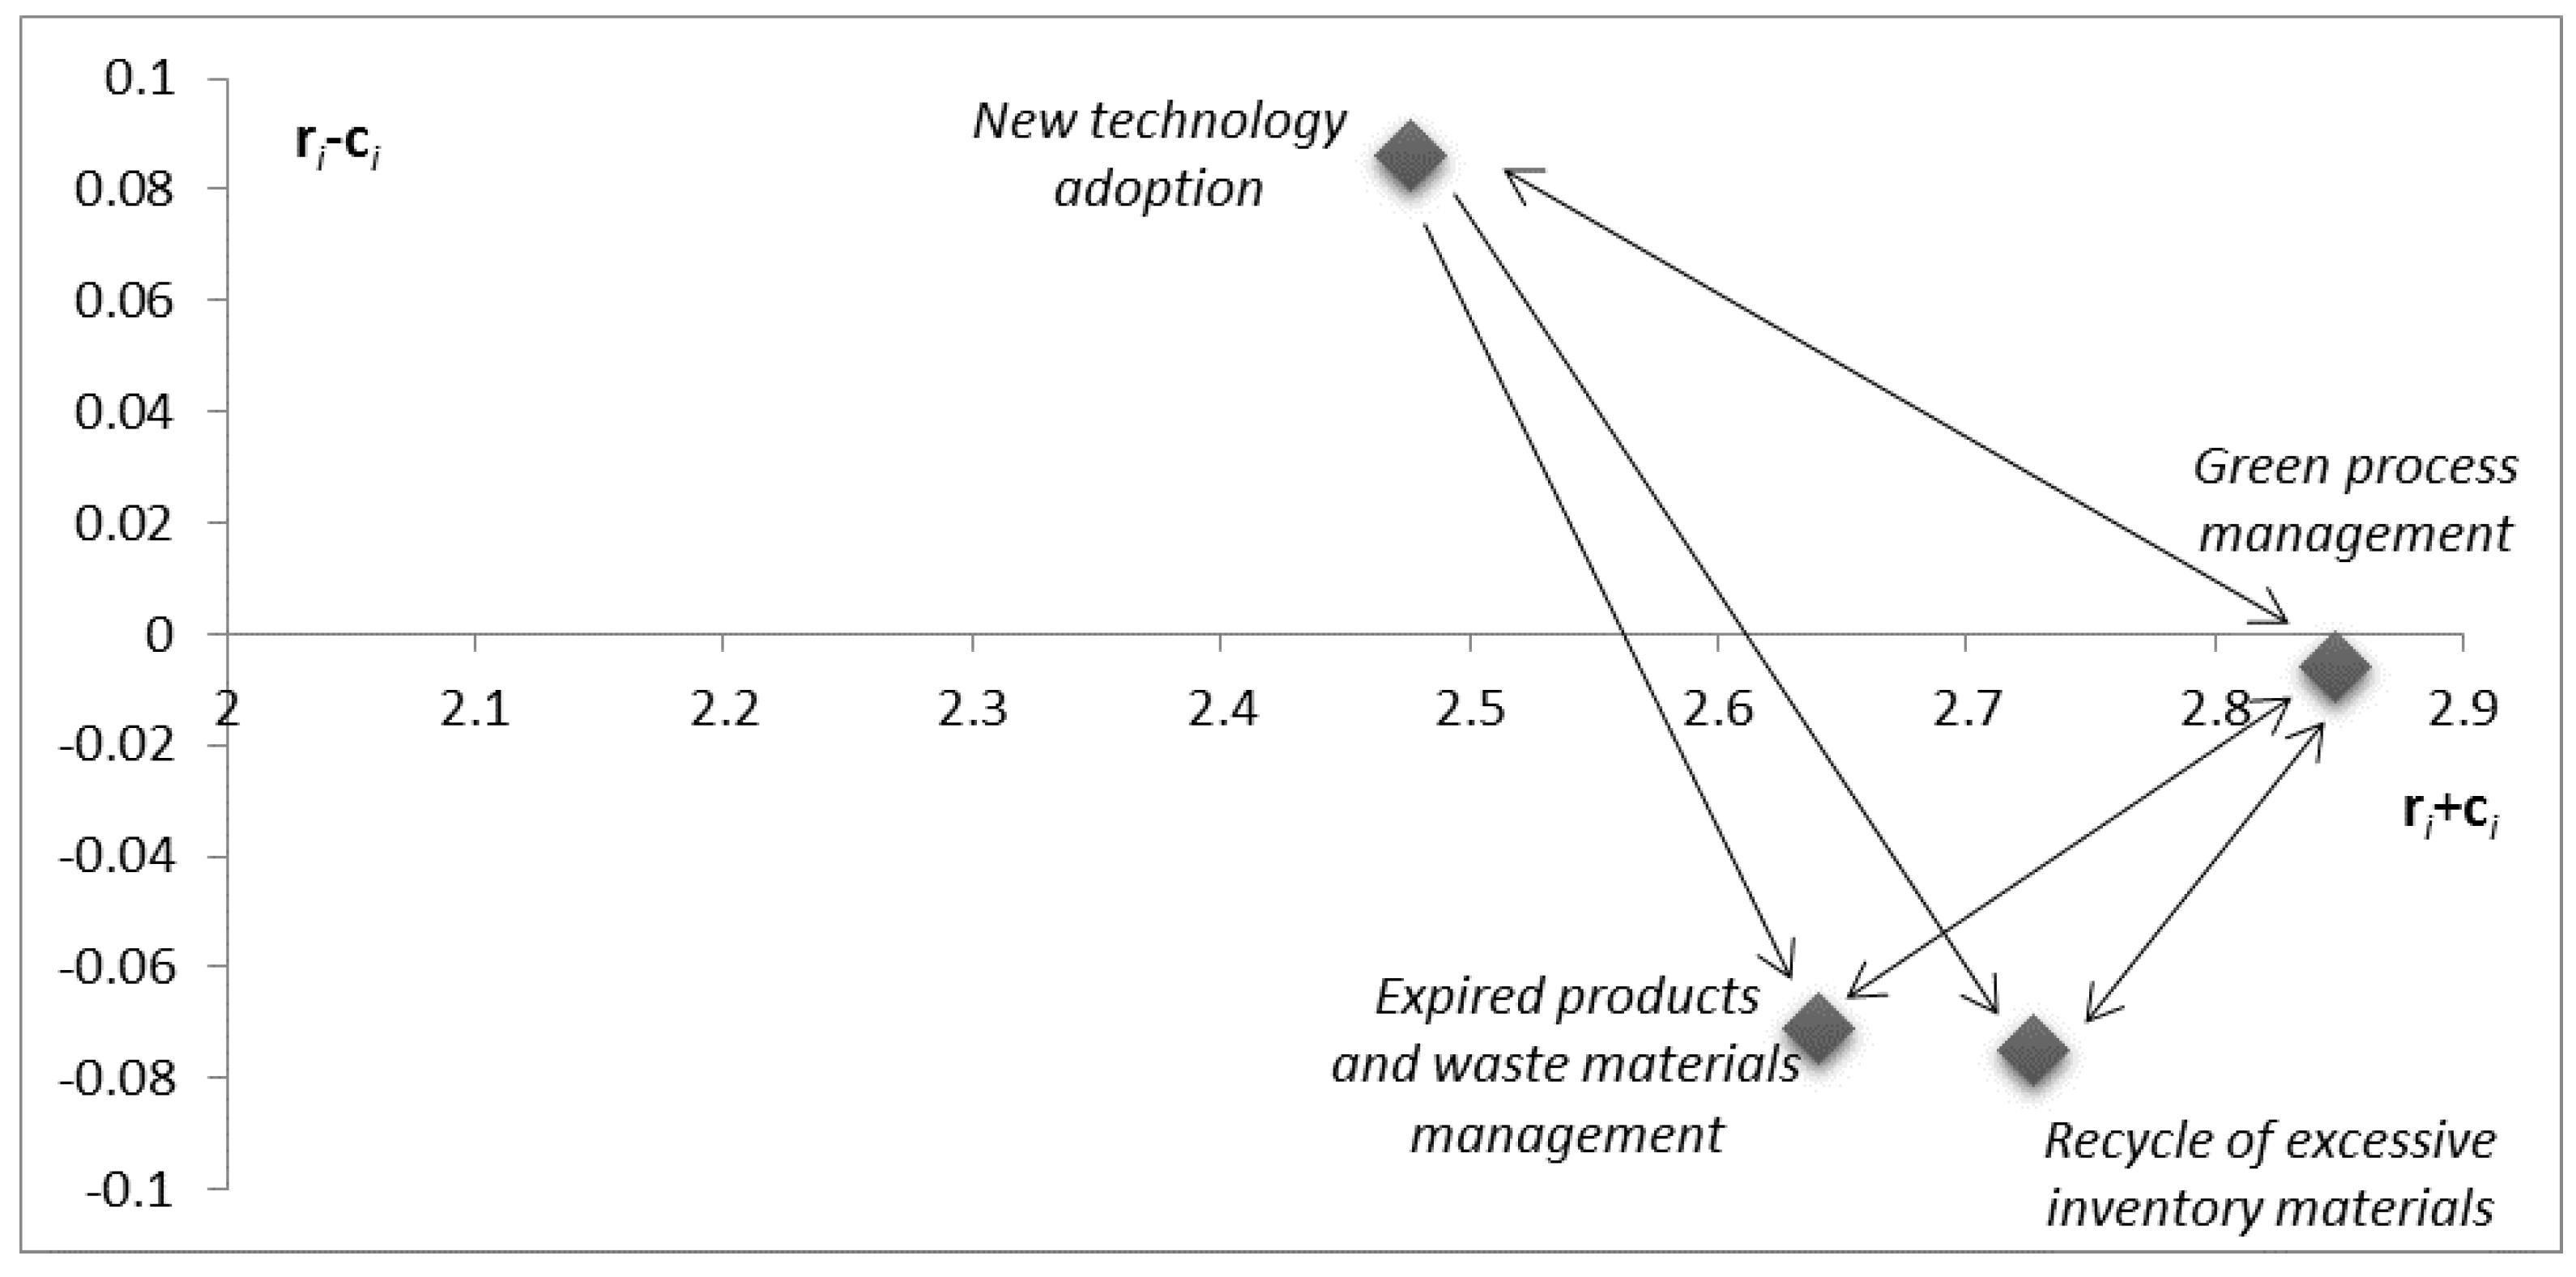
Table 4 presents the details of total influences given and received on each criterion of each dimension in a green project management. As shown in Table 4, in the internal process dimension, green process management (ri + ci = 2.848) has the highest influence/cause effects on other criteria. Uncertainty of technology (ri + ci = 2.232) has the lowest influence/cause effects on other criteria. In addition, only two of five criteria of the internal process dimension are the net causers, namely, uncertainty of technology (ri − ci = 0.066) and new technology adoption (ri − ci = 0.086), other three criteria are net receivers (recycle of excessive inventory materials: ri − ci = −0.075; expired products and waste materials management: ri − ci = −0.071; green process management: ri − ci = −0.006). The interrelationship structure of criteria in the internal process dimension is also presented in the network relationship map as shown in Figure 2.
In the external process dimension (as shown in Table 4), selection of environmentally oriented partners (ri + ci = 1.731) has the lowest influence/cause effects on other criteria, but it is the net receiver (ri − ci = −0.011). Green supply management (ri + ci = 1.797) has the highest influence/cause effect on other criteria. Both green supply management (ri − ci = 0.009) and customer cooperation (ri − ci = 0.002) are the net causers. The interrelationship structure of criteria in the external process dimension is also presented in the network relationship map as shown in Figure 3.
In the internal organization dimension (as shown in Table 4), organizational structure and policy (ri + ci = 3.125) has the highest influence/cause effects on other criteria. Management commitment (ri + ci = 2.626) has the lowest influence/cause effects on other criteria. Furthermore, cooperation between green project team (ri − ci = −0.117), size of green project team (ri − ci = −0.164), and organizational structure and policy (ri − ci = −0.047) are the net receivers. Management commitment (ri − ci = 0.148) and corporate performance (ri − ci = 0.180) are the net causers. The interrelationship structure of criteria in the internal organization dimension is also presented in the network relationship map as shown in Figure 4.
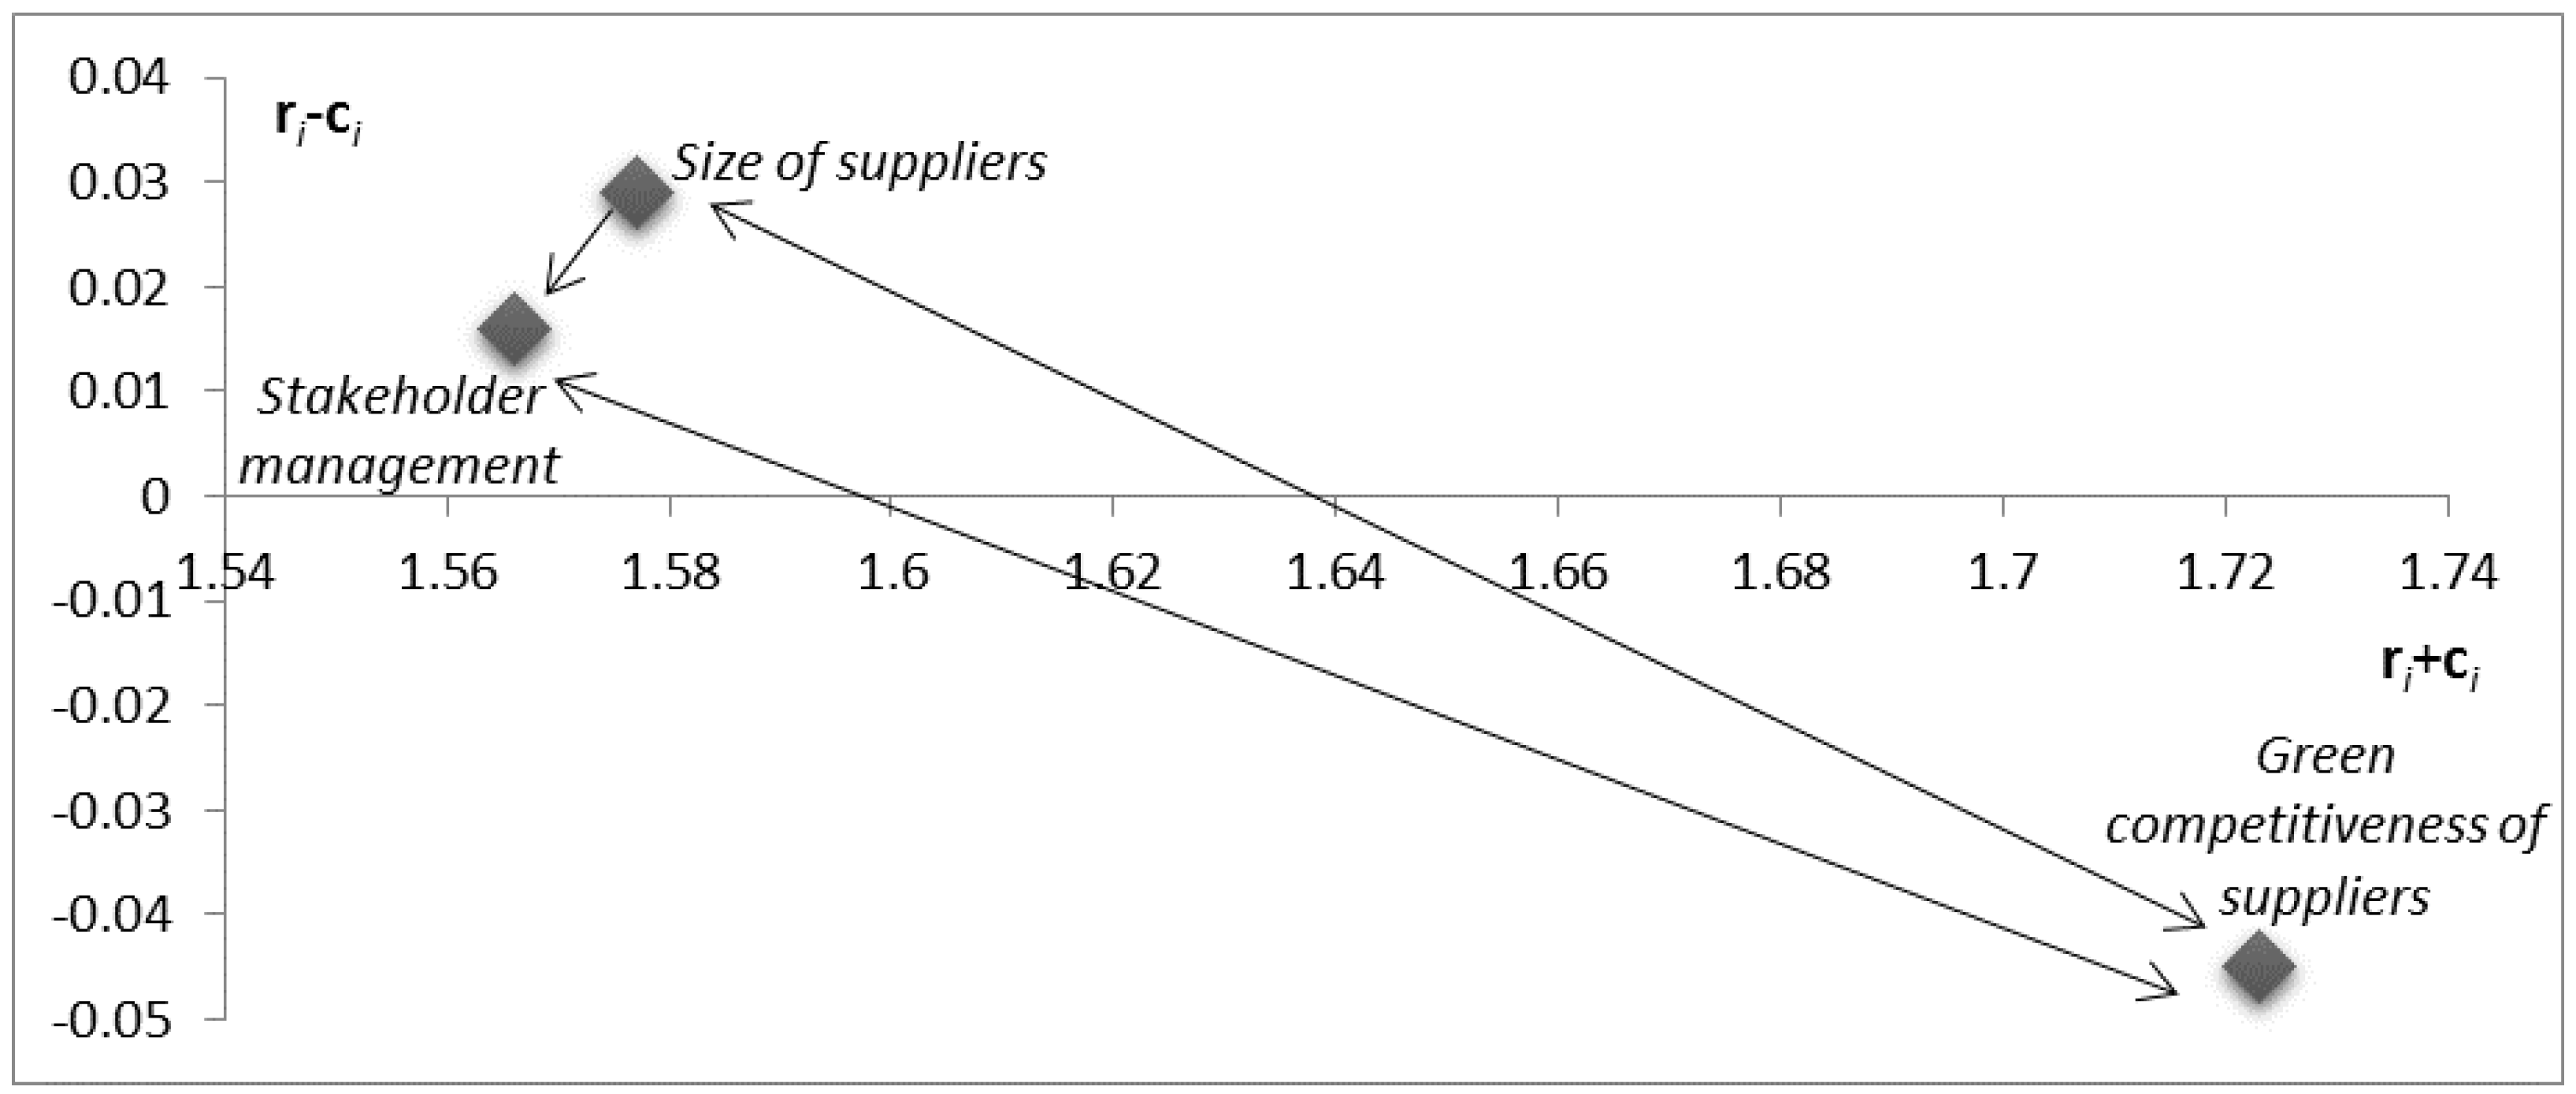
In the external organization dimension (as shown in Table 4), green competitiveness of suppliers (ri + ci = 1.723) has the highest influence/cause effects on other criteria, but it is the net receiver (ri − ci = −0.045). Stakeholder management (ri + ci = 1.566) has the lowest influence/cause effects on other criteria. Both stakeholder management (ri − ci = 0.016) and size of suppliers (ri − ci = 0.029) are the net causers. The interrelationship structure of criteria in the external organization dimension is also presented in the network relationship map as shown in Figure 5.
In the internal environment dimension (as shown in Table 4), environmental investment (ri + ci = 2.213) has the highest influence/cause effects on other criteria. Size of community (ri + ci = 1.691) has the lowest influence/cause effects on other criteria. Besides, only implementation of environmental management systems (ri − ci = −0.035) is the net receiver. The three other criteria are the net causers (environmental investment: ri − ci = 0.019; location of the firms: ri − ci = 0.001; size of community: ri − ci = 0.015). The interrelationship structure of criteria in the internal environment dimension is also presented in the network relationship map as shown in Figure 6.
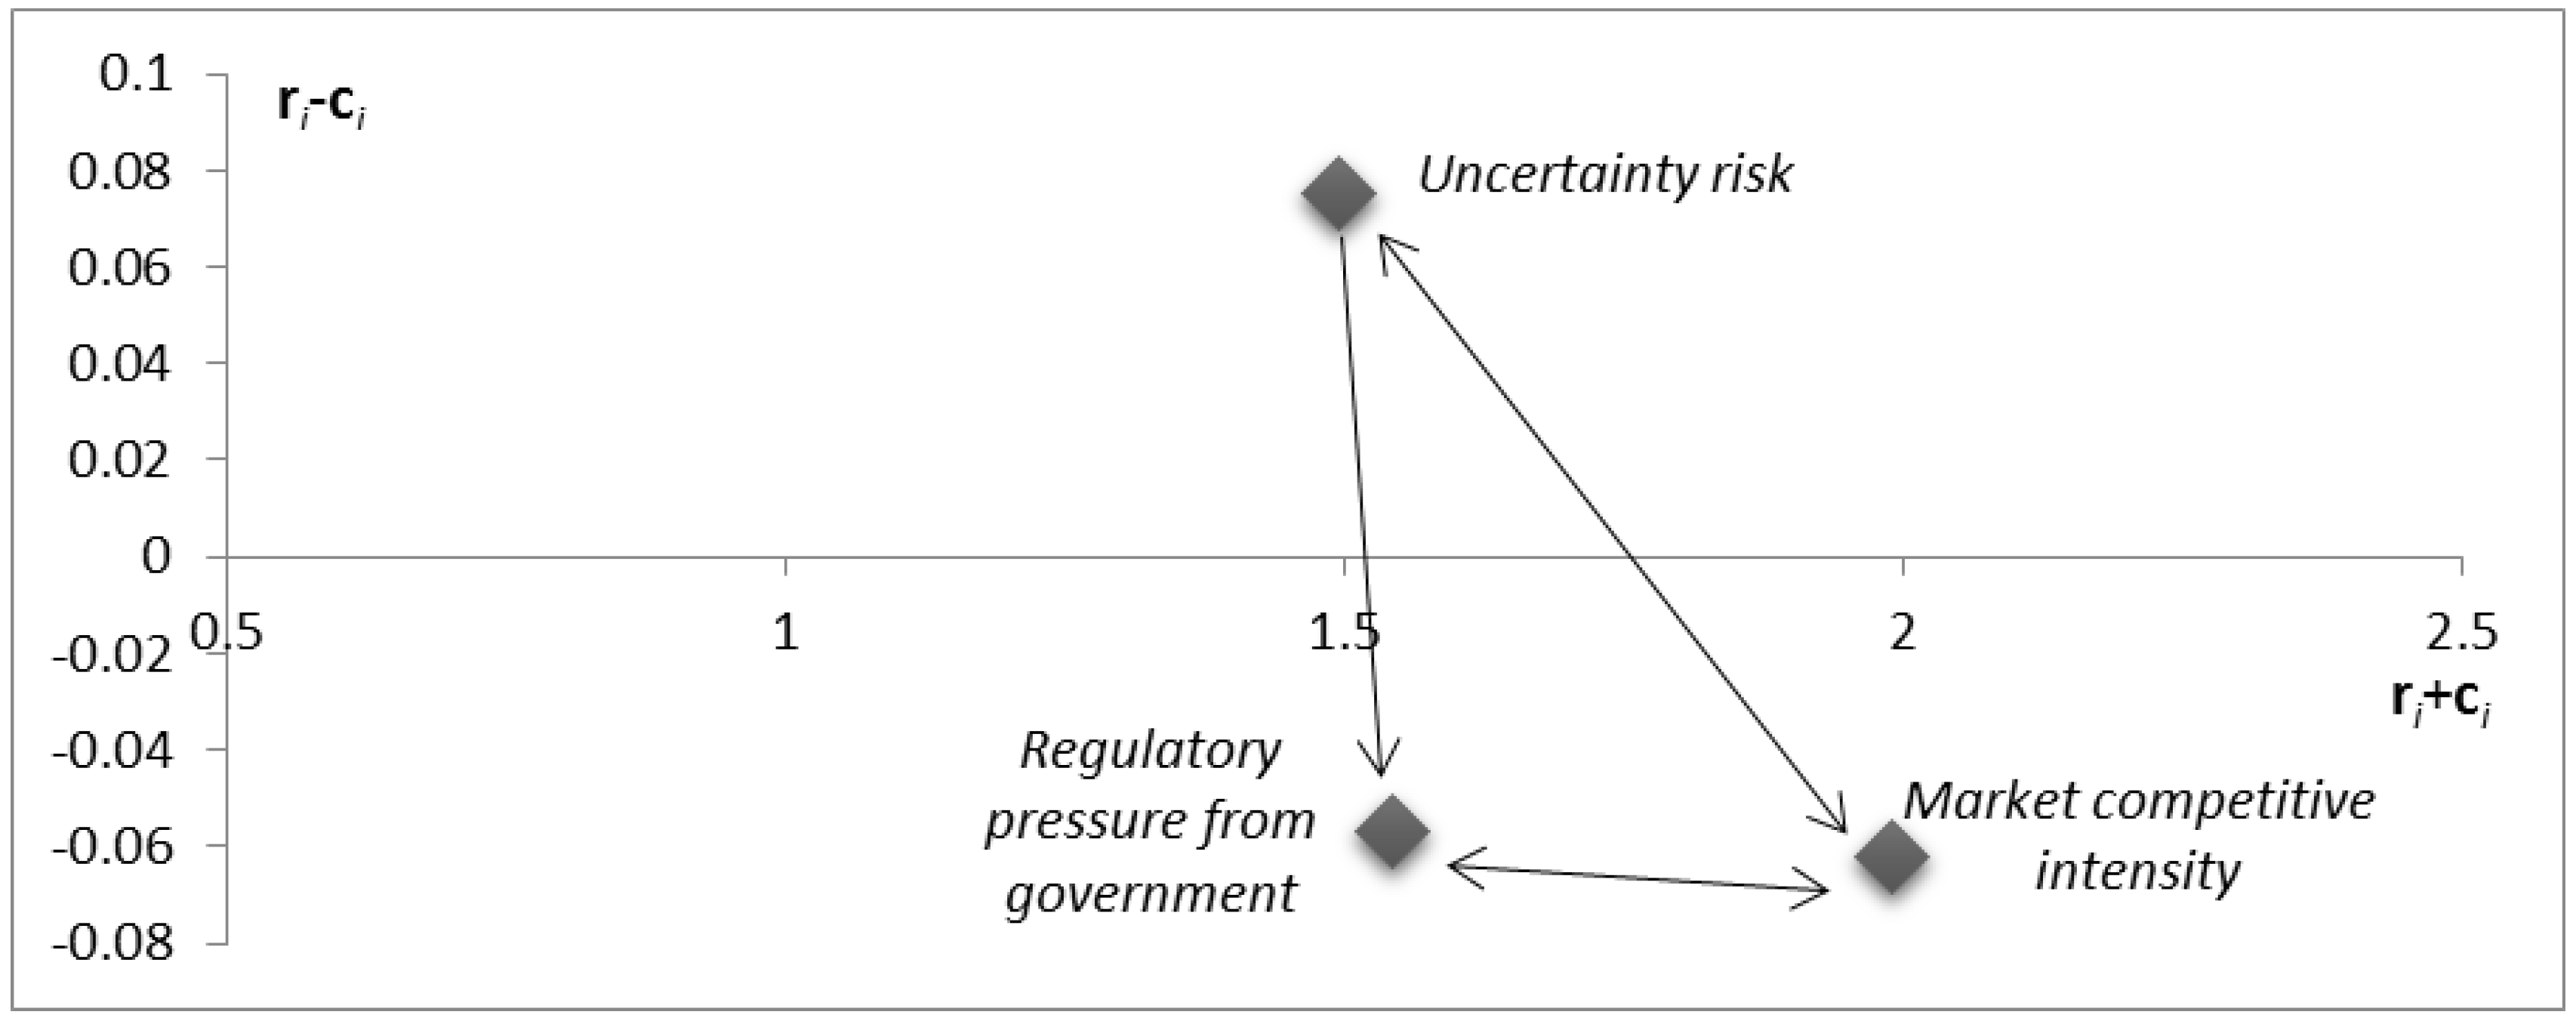
In the external environment dimension (as shown in Table 4), market competitive intensity (ri + ci = 1.990) has the highest influence/cause effects on other criteria. Climate change (ri + ci = 0.942) has the lowest influence/cause effects on other criteria. In addition, market competitive intensity (ri − ci = −0.062) and regulatory pressure from government (ri − ci = −0.057) are the net receivers. Climate change (ri − ci = −0.062) and Uncertainty risk (ri − ci = −0.062) are the net causers. The interrelationship structure of criteria in the external environment dimension is also presented in the network relationship map as shown in Figure 7.
4.2. Results of the ANP Model
4.2.1. Comparisons of Six Dimensions in a Green Project Management
Table 5 shows the results of the ANP model, which presents the weights and ranks of the six dimensions in a green project management. In the calculation process of ANP, this study adopts the aggregation approach to count the response from the seven experts. In this aggregation process, we use the geometric mean value of their opinions in the calculation of ANP software. As shown in Table 5, external process has the highest weight (0.184) and ranks number 1, implying external process is the most important dimension in a green project management. Internal process ranks number 2 (weight = 0.175). External organization ranks number 3 (weight = 0.171). Internal organization ranks number 4 (weight = 0.166). In addition, internal environment ranks number 5 (weight = 0.159) and external environment ranks number 6 (weight = 0.141), implying that internal and external environments are the two least important dimensions in a green project management.
4.2.2. Comparisons of Criteria in a Green Project Management
Table 6 presents the results of the ANP model for criteria in a green project management. As indicated in Table 6, the top five most important criteria are green supply management (weight = 0.082, rank number 1), customer cooperation (weight = 0.081, rank number 2), selection of environmentally oriented partners (weight = 0.080, rank number 3), green competitiveness of suppliers (weight = 0.057, rank number 4), and stakeholder management (weight = 0.049, rank number 5). By contrast, the top five least important criteria are climate change (weight = 0.019, rank number 24), uncertainty of technology (weight = 0.027, rank number 23), management commitment (weight = 0.028, rank number 22), uncertainty risk (weight = 0.049, rank number 21), and new technology adoption (weight = 0.049, rank number 20).
5. Discussion and Conclusions
5.1. Discussion
The combination of the DEMATEL and ANP methods provides many interesting findings in this study. In terms of the six dimensions of a green project management, internal process and external process are the two most important dimensions that need to be improved in a green project management. However, improvement of these two dimensions may only lead to a better short-term performance, because they are influenced by other dimensions in a green project management. By contrast, internal organization, external organization, internal environment, and external environment are less important in a green project management. However, these dimensions are the net causers that influence internal process and external process. Thus, improvement in these net causers may lead to improvement in internal and external process, which will generate a better long-term performance for a green project management.
In terms of criteria of each dimension in a green project management, the top five most important criteria are green supply management, customer cooperation, selection of environmentally oriented partners, green competitiveness of suppliers, and stakeholder management. All of these criteria relate to suppliers, customers, and stakeholders. This result indicates that improvement in suppliers, customers and stakeholders need to be placed in the top priority of a green project management, and these improvements may also lead to the success of a green project management. However, the top five least important criteria are climate change, uncertainty of technology, management commitment, uncertainty risk, and new technology adoption. Most of these criteria relate to macro environment factors of a business firm’s external boundary. Thus, firms can only analyze and predict these factors in order to improve performance of a green project management.
5.2. Conclusions
In this paper, we developed the dimensions and criteria for evaluating a green project management. An integrated approach combining the DEMATEL and ANP methods was used to determine the interrelationships and priorities of each dimension and each criterion in a green project management. The analysis for this framework of a green project management showed several interesting results. Thus, the present study provides important implications for both managerial managers and theoretical researchers.
The managerial implications are clear. Managers are able to determine what dimensions and criteria need more attention and which dimensions and criteria may be given less priority. In a green project management, external process has the greatest interdependent effects (ri + ci = 3.326). Internal process and external process are the two dimensions that receive the influences of other dimensions. Furthermore, findings of this study also suggest that external process (weight = 0.187, rank number 1) and internal process (weight = 0.175, rank number 2) are the two most important dimensions of a green project management. Therefore, managers should focus on internal process and external process to enhance their short-term performance. However, they can also focus on a long-term strategy that improves internal and external organization as well as internal environment and external environment.
Regarding to criteria of a green project management, green supply management (ri + ci = 1.797, weight = 0.082, rank number 1), customer cooperation (ri + ci = 1.780, weight = 0.081, rank number 2), selection of environmentally oriented partners (ri + ci = 1.731, weight = 0.080, rank number 3), green competitiveness of suppliers (ri + ci = 1.723, weight = 0.057, rank number 4), and stakeholder management (ri + ci = 1.566, weight = 0.049, rank number 5) are the most important criteria of a green project management. Thus, mangers should give more efforts to improve these criteria.
Furthermore, based on the framework of this study, managers can understand how to evaluate a green project management with a complete set of dimensions and criteria. In addition, managers can also use the technique of combining the DEMATEL and ANP methods to help plan the direction of their green project management by determining how particular dimensions and criteria affect each other in their specific project.
Researchers can also find this framework of green project management valuable for their studies in the field of environmental sustainability. With clear dimensions and criteria of a green project management, researchers can apply this framework to a single in-depth case study or comparisons between difference green projects. In addition, researchers can also integrate this framework to the green supply chain management. The interrelationships and priorities of each dimension and criteria may be used to identify the various structures of several green projects in supply chain management.
Even with managerial and theoretical insights provided by this study, there are still many limitations. One major limitation is the evaluation efforts of respondents to complete the questionnaires. Each respondent of this study had to complete two questionnaires, namely, DEMATEL based-questionnaire and ANP-based questionnaire. Each set of questionnaire consisted of 24 × 24 pairwise comparisons. The number of dimensions and sub-criteria decision making process seems to be very time-consuming. This limitation may lead to some reliability problems. Future research may give more efforts on designing and collecting the questionnaires, such as collecting data in different phases, each phase with only DEMATEL based-questionnaire or ANP-based questionnaire. In addition, the dimensions and criteria of green project management are evaluated by experts and managers in the green energy industry. This limitation may affect the generalization of the framework of green project management in this study. Future research can apply the framework of this study to different industry. The application can confirm and broaden the validity of this framework of green project management to other industries.
Acknowledgments
The authors would like to thank the Ministry of Science and Technology of the Republic of China, Taiwan (Contract No. MOST-100-2221-E-029-022-MY3) and the Shantou University Scientific Research Foundation for financially supporting this research.
Author Contributions
The paper was conducted by Ying-Chyi Chou, Chia-Han Yang, Ching-Hua Lu, Van Thac Dang, and Pei-An Yang. Ying-Chyi Chou and Chia-Han Yang contributed to research ideas, instruction and decision making aspects of this paper. Pei-An Yang contributed to data collection. Ching-Hua Lu contributed to the data analysis. Van Thac Dang contributed to writing and detailed revision of this paper (Van Thac Dang is the corresponding author of this paper). All authors have read and approved the final manuscript.
Conflicts of Interest
The authors declare no conflict of interest.
Appendix A. Example of DEMATEL Questionnaire
Please evaluate the causal influence of each dimension in green project management from score 1 to 7. The score 7 means the highest degree of influence that the column factor affect the row factor, and the score 1 means the lowest degree of influence that the column factor affect the row factor.
| Internal Process | External Process | Internal Organization | External Organization | Internal Environment | External Environment | |
| Internal process | 0 | |||||
| External process | 0 | |||||
| Internal organization | 0 | |||||
| External organization | 0 | |||||
| Internal environment | 0 | |||||
| External environment | 0 |
Appendix B. Example of ANP Questionnaire
Please pairwise compare the importance for green project management between each two dimensions from score 1 to 9. The score 9 means the dimension is strongly more important than another compared dimension, and the score 1 means both these two dimensions are equally important in green project management.
| 9: 8: 7: 6: 5: 4: 3: 2: 1: 2: 3: 4: 5: 6: 7: 8: 9 | ||
| Internal process | External process | |
| Internal process | Internal organization | |
| Internal process | External organization | |
| Internal process | Internal environment | |
| Internal process | External environment | |
| External process | Internal organization | |
| External process | External organization | |
| External process | Internal environment | |
| External process | External environment | |
| Internal organization | External organization | |
| Internal organization | Internal environment | |
| Internal organization | External environment | |
| External organization | Internal environment | |
| External organization | External environment | |
| Internal environment | External environment |
References
- Albino, V.; Balice, A.; Dangelico, R.M. Environmental strategies and green product development: An overview on sustainability-driven companies. Bus. Strat. Environ. 2009, 18, 83–96. [Google Scholar] [CrossRef]
- Chen, Y.S.; Lai, S.B.; Wen, C.T. The influence of green innovation performance on corporate advantage in Taiwan. J. Bus. Eth. 2006, 67, 331–339. [Google Scholar] [CrossRef]
- Chan, R.Y.K.; He, H.; Chan, H.K.; Wang, W.Y.C. Environmental orientation and corporate performance: The mediation mechanism of green supply chain management and moderating effect of competitive intensity. Ind. Mark. Manag. 2012, 41, 621–630. [Google Scholar] [CrossRef]
- Chung, Y.; Tsai, C. The effect of green design activities on new product strategies and performance: An empirical study among high-tech companies. Int. J. Manag. 2007, 24, 276–288. [Google Scholar]
- Maxwell, D.; Sheate, W.; van der Vorst, R. Functional and system aspects of the sustainable product and service development approach for industry. J. Clean. Prod. 2006, 14, 1466–1479. [Google Scholar] [CrossRef]
- Chrismann, P. Effect of best practices’ of environmental management on cost advantage: The role of complementary assets. Acad. Manag. J. 2000, 43, 663–680. [Google Scholar] [CrossRef]
- Orsato, R.J. Competitive environmental strategies: When does it pay to be green? Calif. Manag. Rev. 2006, 48, 127–143. [Google Scholar] [CrossRef]
- Pujari, D. Eco-innovation and new product development: Understanding the influences on market performance. Technovation 2006, 26, 76–85. [Google Scholar] [CrossRef]
- Baumann, H.; Boons, F.; Bragd, A. Mapping the green product development field: Engineering, policy and business perspectives. J. Clean. Prod. 2002, 10, 409–425. [Google Scholar] [CrossRef]
- Kjaerheim, G. Cleaner production and sustainability. J. Clean. Prod. 2005, 13, 329–339. [Google Scholar] [CrossRef]
- Florida, R.; Davison, D. Gaining from green management: environmental management systems inside and outside the factory. Calif. Manag. Rev. 2001, 43, 64–81. [Google Scholar] [CrossRef]
- Ravi, V.; Shankar, R.; Tiwari, M.K. Analyzing alternatives in reverse logistics for end-of-life computers: ANP and balanced scorecard approach. Comput. Ind. Eng. 2005, 48, 327–356. [Google Scholar] [CrossRef]
- Thoumy, M.; Vachon, S. Environmental projects and financial performance: Exploring the impact of project characteristics. Int. J. Prod. Econ. 2012, 140, 28–34. [Google Scholar] [CrossRef]
- Vachon, S.; Klassen, R.D. Green project partnership in the supply chain: The case of the package printing industry. J. Clean. Prod. 2006, 14, 661–671. [Google Scholar] [CrossRef]
- Baines, T.; Brown, S.; Benedettini, O.; Ball, P. Examining green production and its role within the competitive strategy of manufacturers. J. Ind. Eng. Manag. 2012, 5, 53–87. [Google Scholar] [CrossRef]
- Geraldi, J.; Maylor, H.; Williams, T. Now, let’s make it really complex (complicated). Int. J. Oper. Prod. Manag. 2011, 20, 966–990. [Google Scholar] [CrossRef]
- Vachon, S.; Klassen, R.D. An exploratory investigation of the effects of supply chain complexity on delivery performance. IEEE Trans. Eng. Manag. 2002, 49, 218–230. [Google Scholar] [CrossRef]
- Rehman, M.A.; Seth, D.; Shrivastava, R.L. Impact of green manufacturing practices on organizational performance in Indian context: An empirical study. J. Clean. Prod. 2016, 137, 427–448. [Google Scholar] [CrossRef]
- Salem, A.H.; Deif, A.M. Developing greenometer for green manufacturing assessment. J. Clean. Prod. 2016, 154, 413–423. [Google Scholar] [CrossRef]
- Wong, C.W.Y.; Lai, K.; Shangc, K.; Lud, C.; Leunge, T.K.P. Green operations and the moderating role of environmental management capability of suppliers on manufacturing firm performance. Int. J. Prod. Econ. 2012, 140, 283–294. [Google Scholar] [CrossRef]
- Jonrinaldi, J.; Zhang, D.Z. An integrated production, inventory and transportation decision in a whole green manufacturing supply chain. Int. J. Ind. Syst. Eng. 2017, 25, 520–544. [Google Scholar]
- Fu, X.; Zhu, Q.; Sarkis, J. Evaluating green supplier development programs at a telecommunication systems providers. Int. J. Prod. Econ. 2012, 140, 357–367. [Google Scholar] [CrossRef]
- Klassen, R.D.; Whybark, D.C. Environmental management in operations: The selection of environmental technologies. Decis. Sci. 1999, 30, 601–631. [Google Scholar] [CrossRef]
- Chen, C. Design for the environment: A quality-based model for green production development. Manag. Sci. 2001, 47, 250–263. [Google Scholar] [CrossRef]
- Pil, F.K.; Rothenberg, S. Environmental performance as a driver of superior quality. Prod. Oper. Manag. 2003, 12, 404–415. [Google Scholar] [CrossRef]
- Lee, A.H.I.; Kang, H.Y.; Hsu, C.F.; Hung, H.C. A green supplier selection model for high-tech industry. Expert Syst. Appl. 2009, 36, 7917–7927. [Google Scholar] [CrossRef]
- Gavronski, I.; Klassen, R.D.; Vachon, S.; Nascimeto, L.F.M.D. A resource-based view of green supply management. Transp. Res. Part E 2011, 47, 872–885. [Google Scholar] [CrossRef]
- Sarkis, J. Evaluating environmentally conscious business practices. Eur. J. Oper. Res. 1998, 107, 159–174. [Google Scholar] [CrossRef]
- Hoeck, R.I.V. From inverse logistics to green supply chains. Logist. Solut. 2000, 2, 28–33. [Google Scholar]
- Kolk, A.; Pinkse, J. Business responses to climate change: Identifying emergent strategies. Calif. Manag. Rev. 2005, 47, 6–20. [Google Scholar] [CrossRef]
- Humphreys, P.; Mclvor, R.; Chan, F.T.S. Integrating environmental criteria into the supplier selection process. J. Mater. Process. Technol. 2003, 138, 349–356. [Google Scholar] [CrossRef]
- Shar, R.; Ward, P.T. Defining and developing measures of lean production. J. Oper. Manag. 2007, 25, 785–805. [Google Scholar]
- Zhao, X.; Hwang, B.G.; Gao, Y. A fuzzy synthetic evaluation approach for risk assessment: A case of Singapore’s green projects. J. Clean. Prod. 2015, 115, 203–213. [Google Scholar] [CrossRef]
- Rostamzadeth, R.; Govindan, K.; Esmaeili, A.; Sabaghi, M. Application of fuzzy VIKOR for evaluation of green supply chain management practices. Ecol. Indic. 2015, 49, 188–203. [Google Scholar] [CrossRef]
- Tzeng, G.H.; Chiang, C.H.; Li, C.W. Evaluating intertwined effects in e-learning programs: A novel hybrid MCDM model based on factor analysis and MEMATEL. Expert Syst. Appl. 2007, 32, 1028–1044. [Google Scholar] [CrossRef]
- Saaty, T.L. The Analytic Hierarchy Process; McGraaw-Hill: New York, NY, USA, 1980. [Google Scholar]
- Yang, J.L.; Tzeng, G.H. An integrated MCDM technique combined with DEMATEL for a novel cluster-weighted with ANP method. Expert Syst. Appl. 2011, 38, 1417–1424. [Google Scholar] [CrossRef]
- Yang, Y.P.O.; Shieh, H.M.; Leu, J.D.; Tzeng, G.H. A novel hybrid MCDM model combined with DEMATEL and ANP with applications. Int. J. Oper. Res. 2008, 5, 160–168. [Google Scholar]
- Baviera-Puig, A.; Gómez-Navarro, T.; García-Melón, M.; García-Martínez, G. Assessing the Communication Quality of CSR Reports. A Case Study on Four Spanish Food Companies. Sustainability 2015, 7, 11010–11031. [Google Scholar] [CrossRef]
- Caballero-Luque, A.; Aragones-Beltran, P.; Garcia-Melon, M. Analysis of the Alignment of Company Goals to Web Content Using ANP. Int. J. Inf. Technol. Decis. Mak. 2010, 9, 419–436. [Google Scholar] [CrossRef]
- Pan, J.N.; Nguyen, H.T.N. Achieving Customer Satisfaction through Product-Service Systems. Eur. J. Oper. Res. 2015, 247, 179–190. [Google Scholar] [CrossRef]
Figure 1.
Network relationship map of influences among six dimensions.
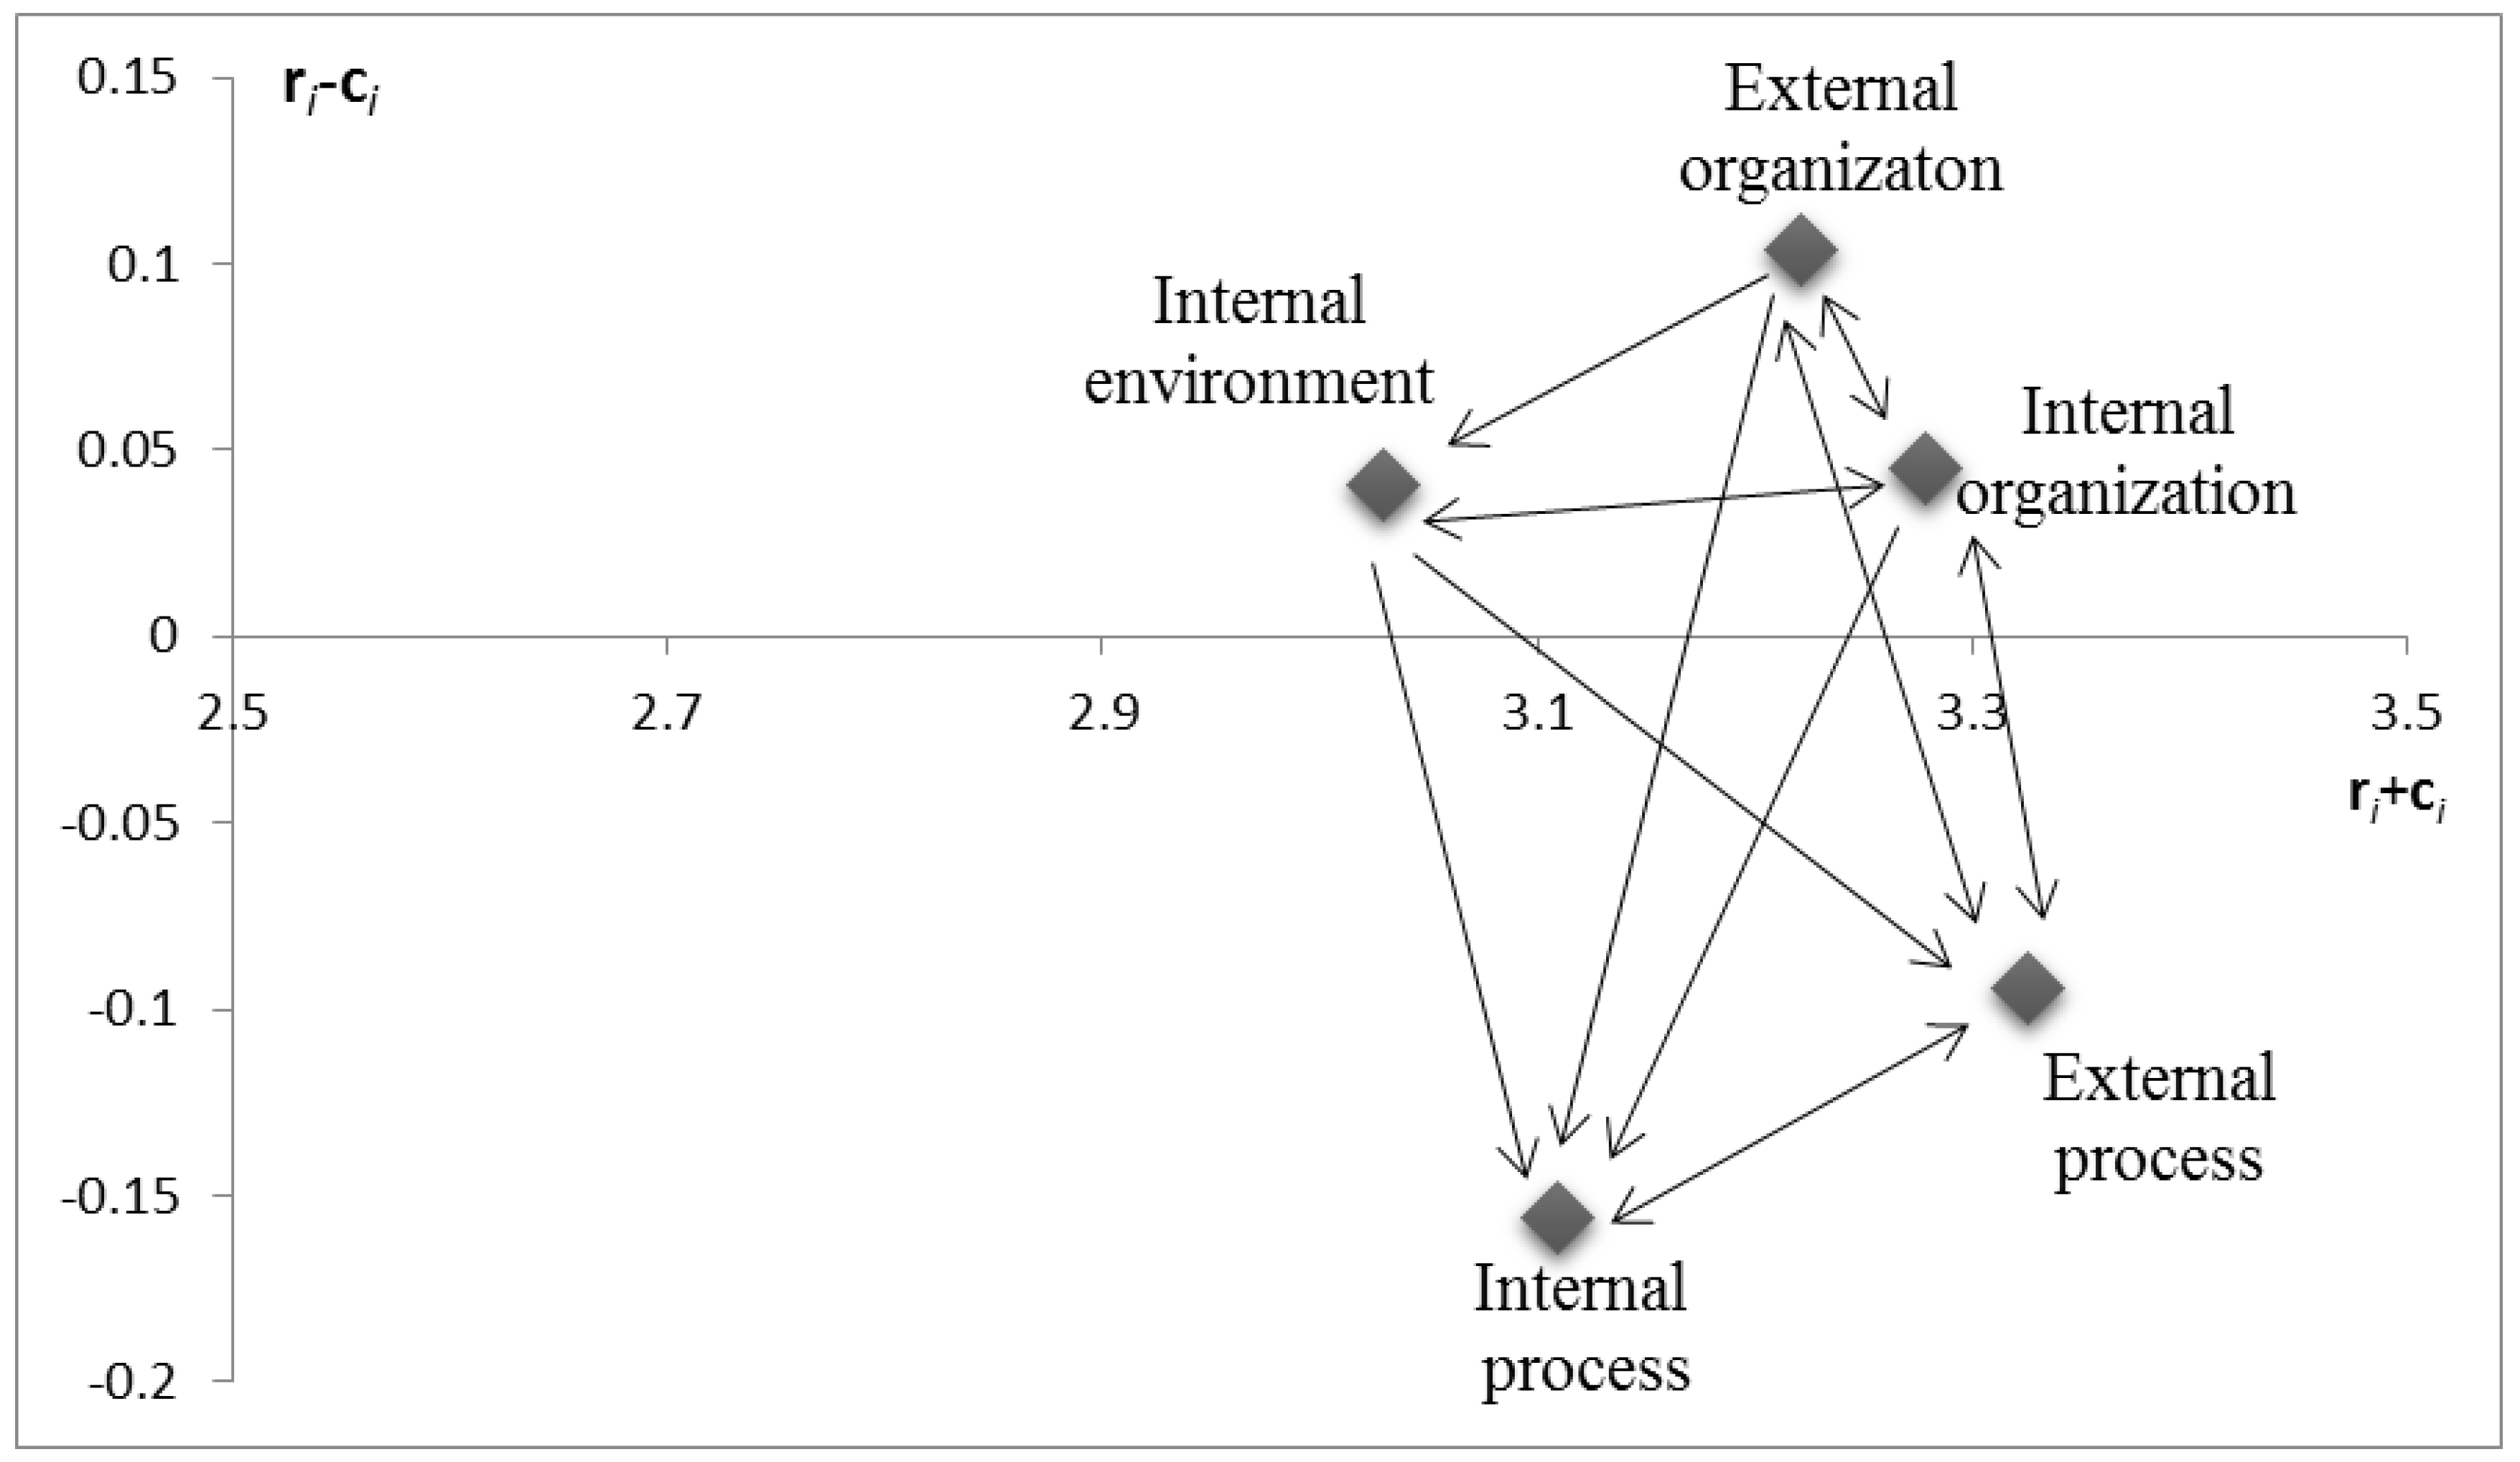
Figure 2.
Network relationship map of influences among criteria of internal process.

Figure 3.
Network relationship map of influences among criteria of external process.
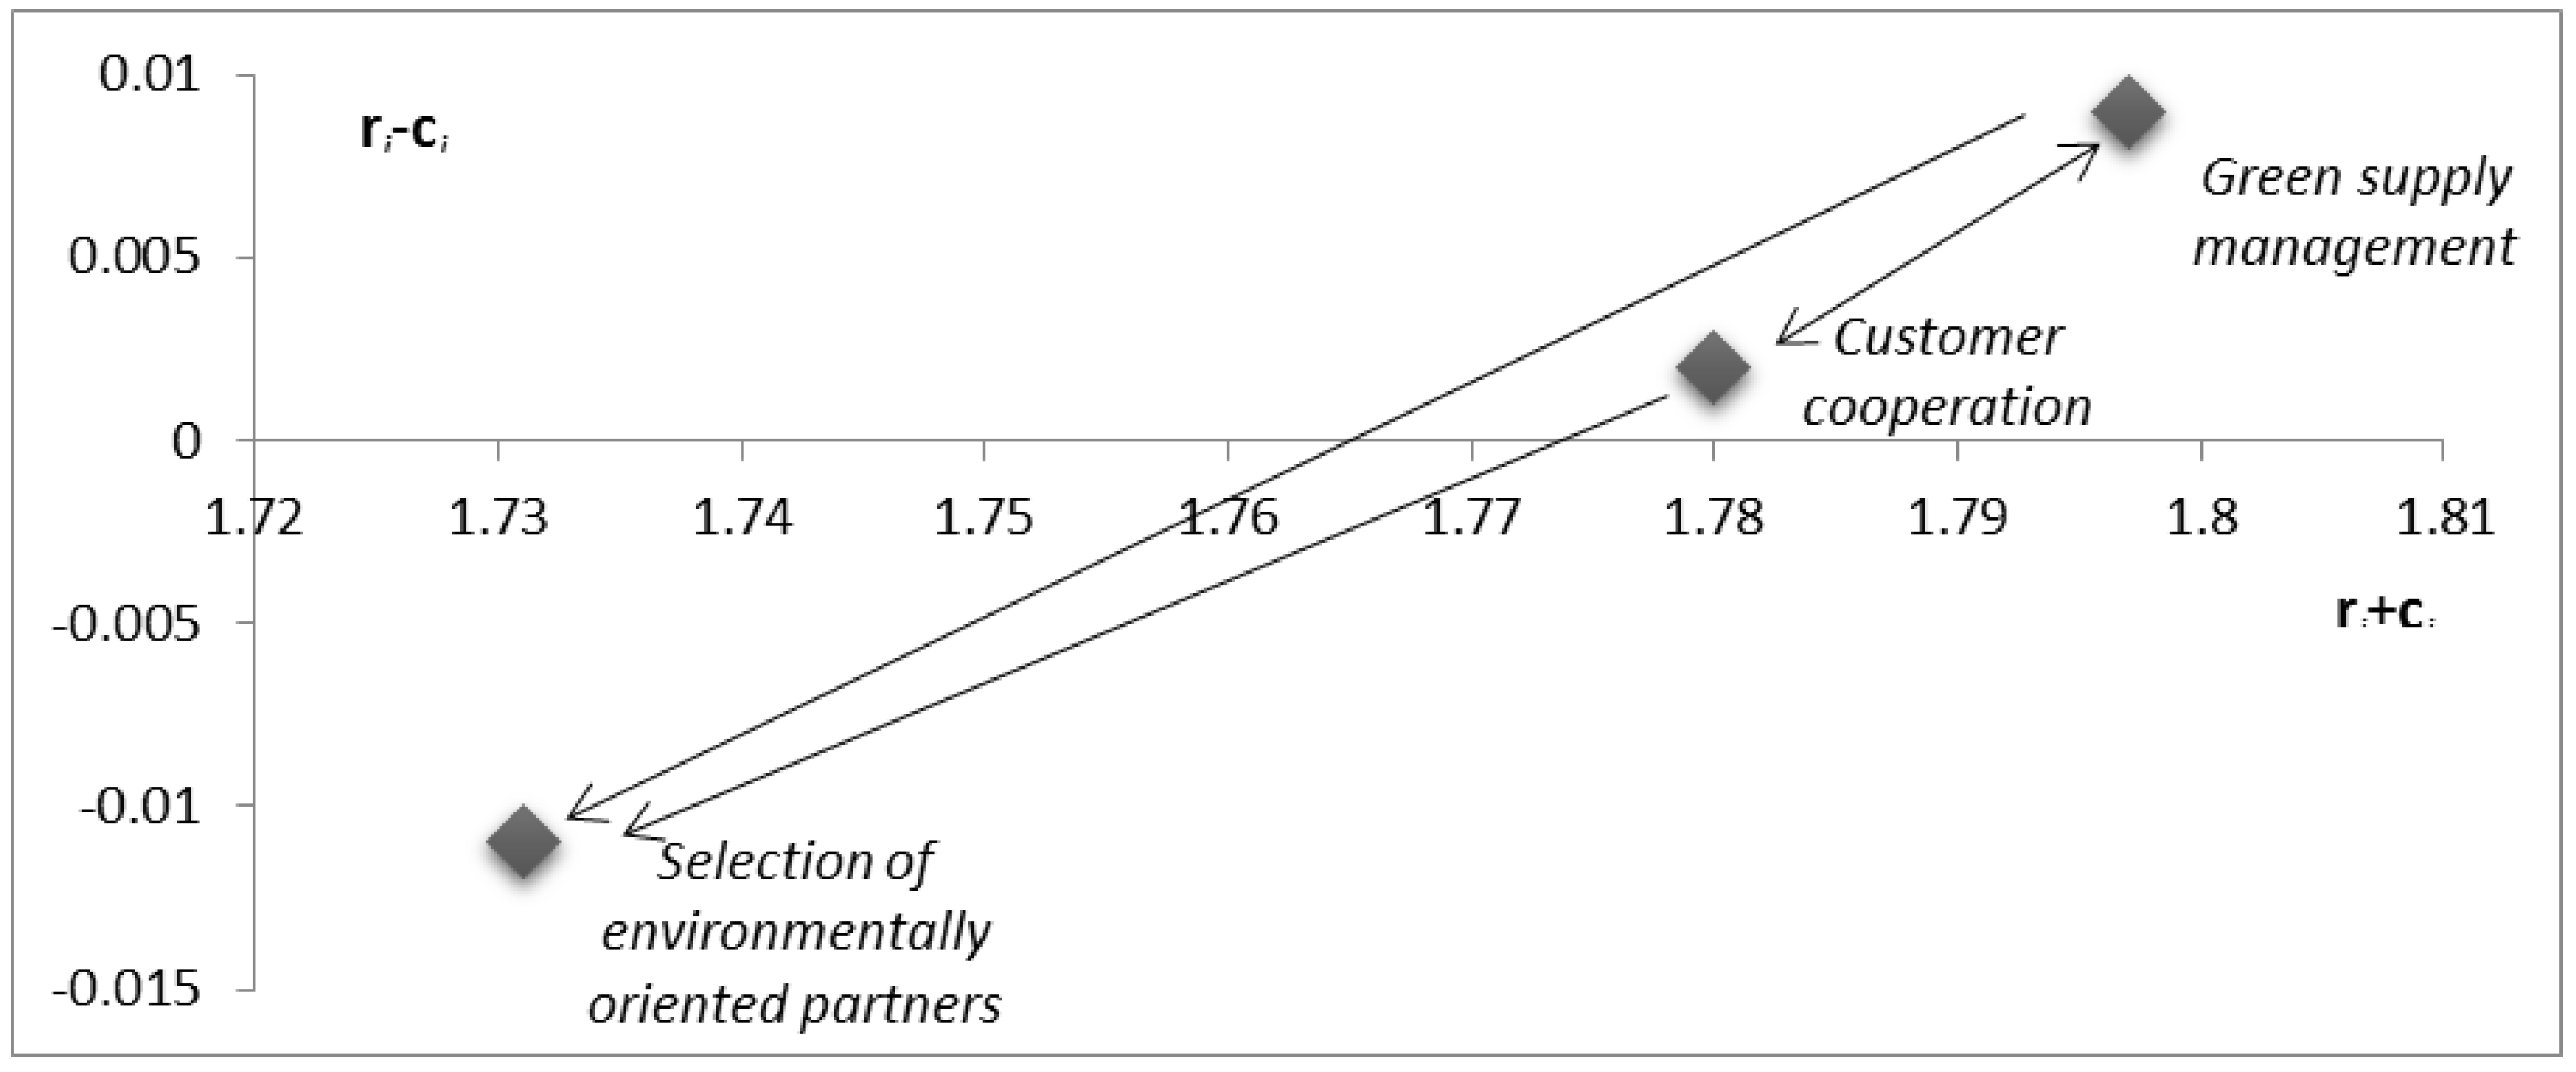
Figure 4.
Network relationship map of influences among criteria of internal organization.
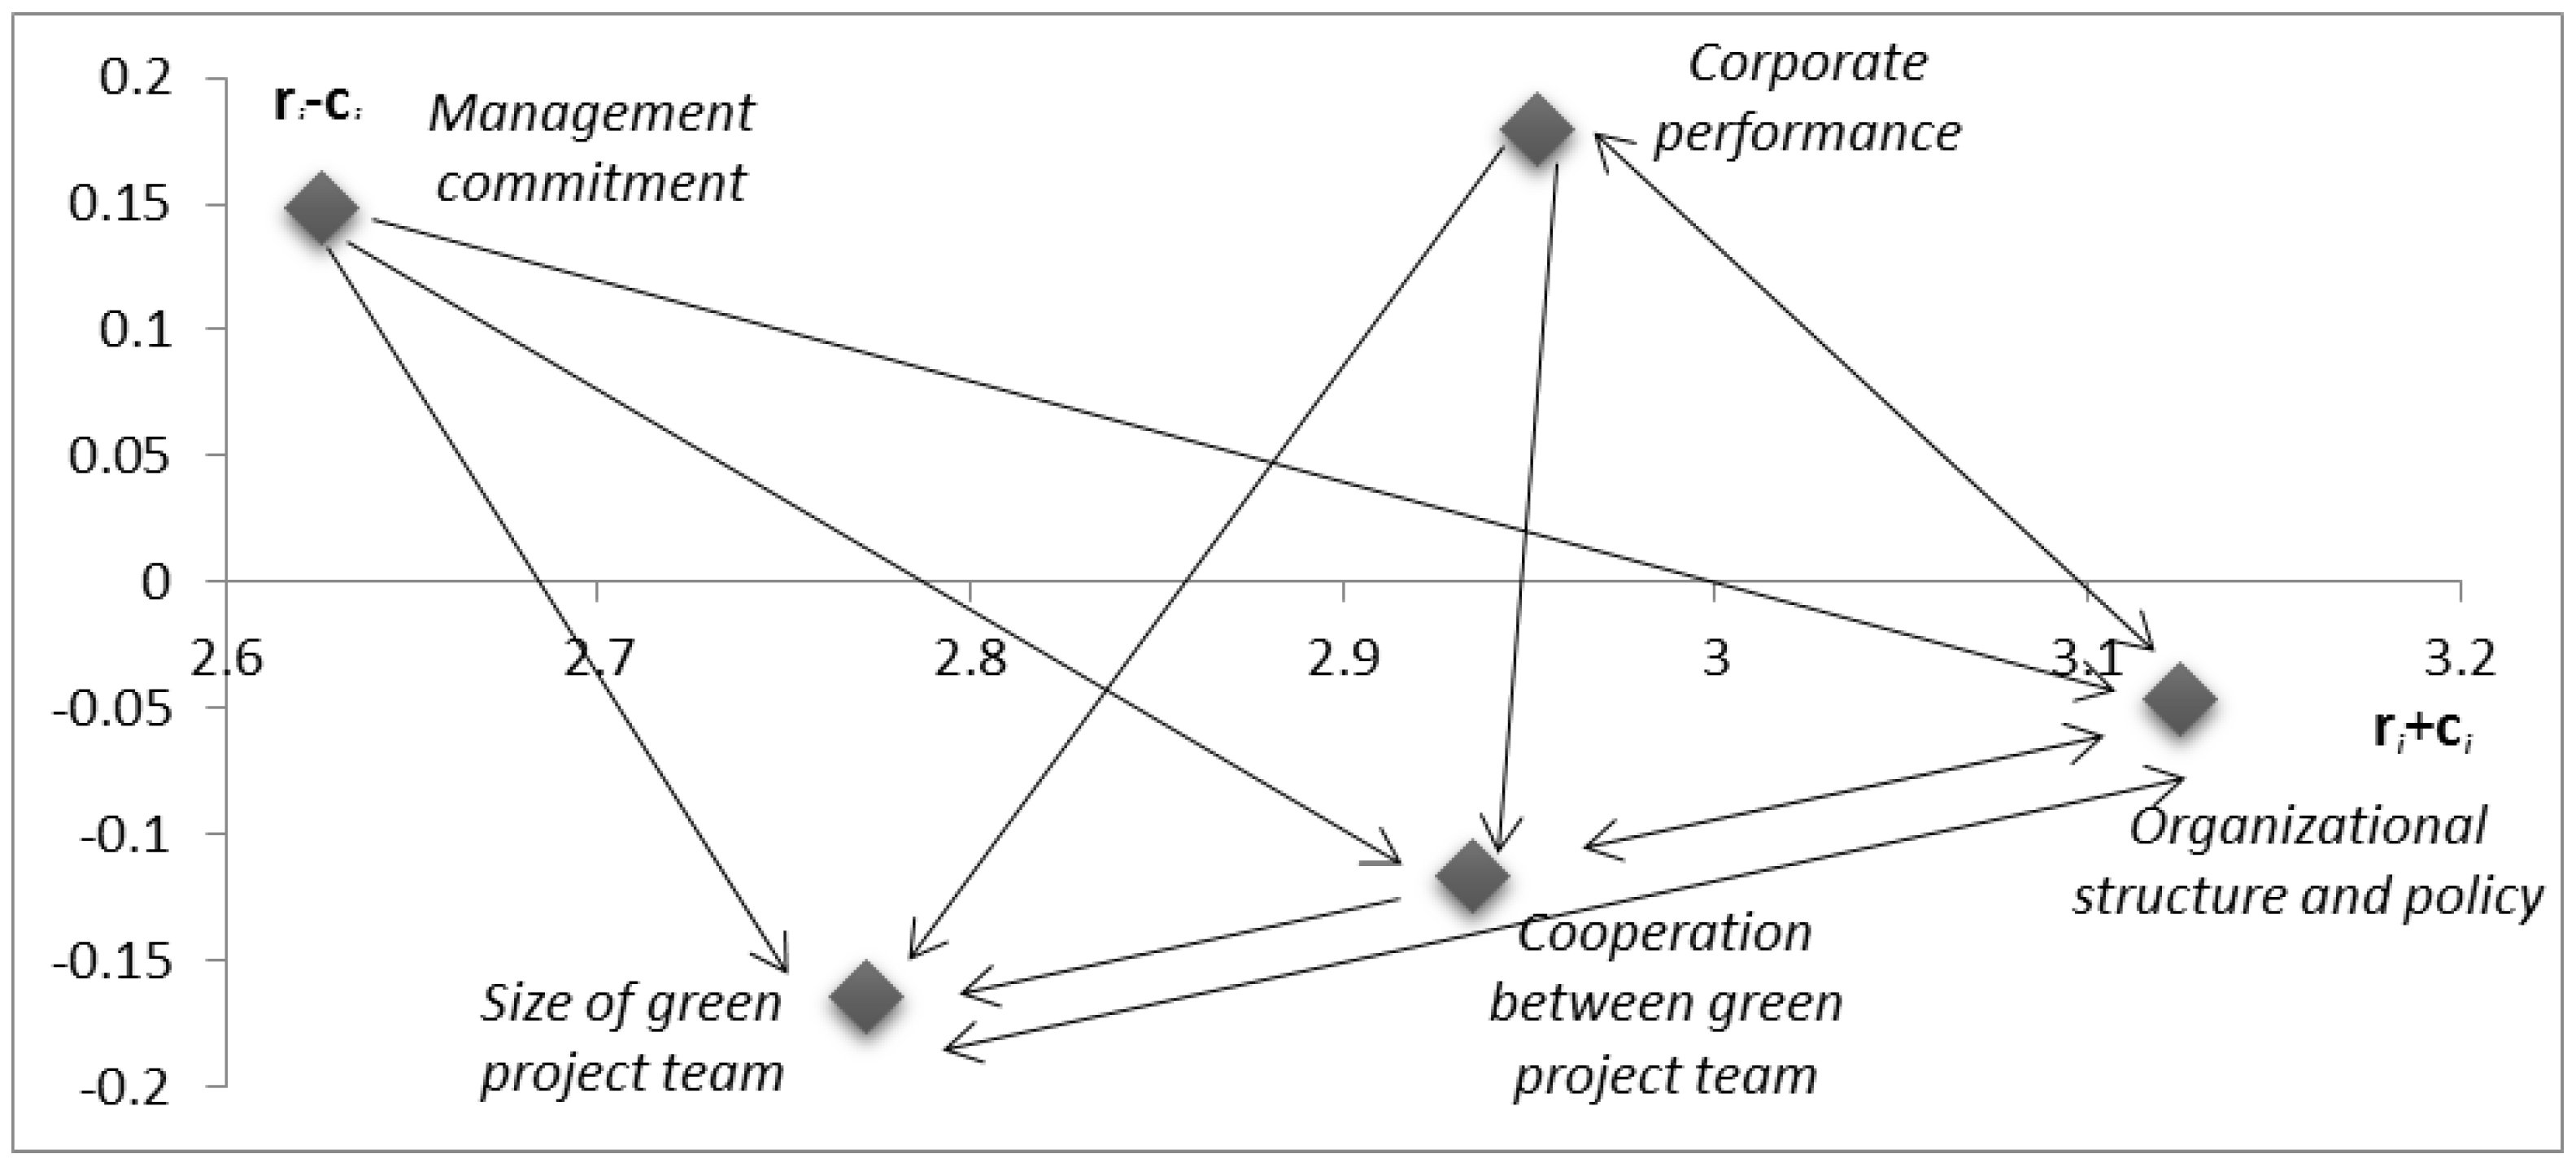
Figure 5.
Network relationship map of influences among criteria of external organization.

Figure 6.
Network relationship map of influences among criteria of internal environment.
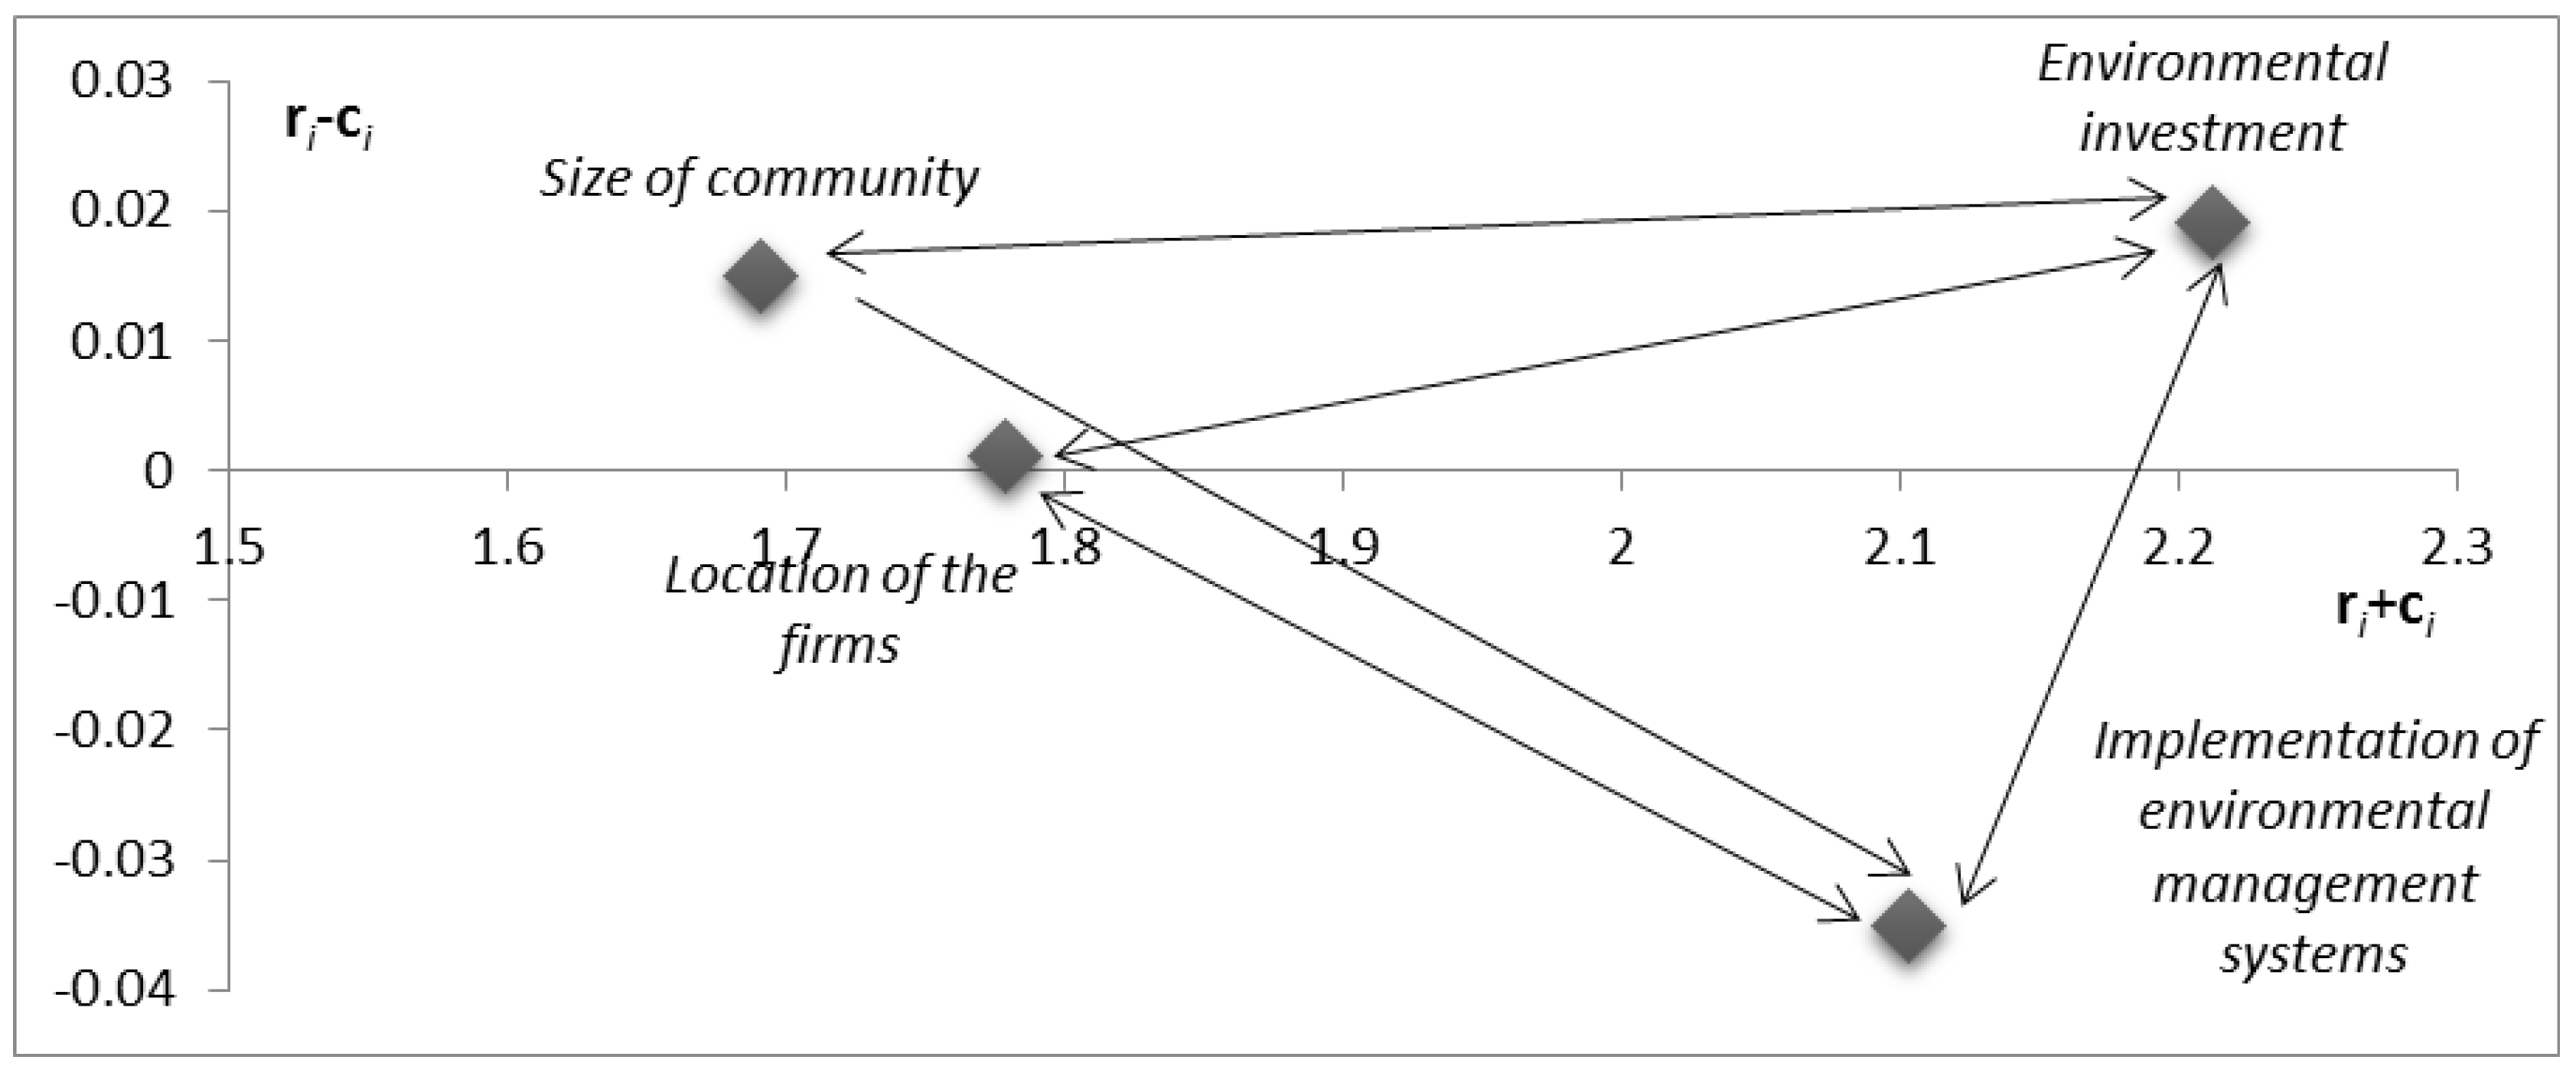
Figure 7.
Network relationship map of influences among criteria of external environment.

Table 1.
Dimensions and criteria for green project management evaluation.
| Process Construct |
| Internal process |
|
| External process |
|
| Organization Construct |
| Internal organization |
|
| External organization |
|
| Environment Construct |
| Internal environment |
|
| External environment |
|
Table 2.
Total influence matrix T of the six dimensions.
| Dimensions | 1 | 2 | 3 | 4 | 5 | 6 |
|---|---|---|---|---|---|---|
| 1. Internal process | 0.258 | 0.277 | 0.253 | 0.245 | 0.235 | 0.209 |
| 2. External process | 0.286 | 0.295 | 0.281 | 0.274 | 0.256 | 0.224 |
| 3. Internal organization | 0.288 | 0.310 | 0.288 | 0.283 | 0.264 | 0.230 |
| 4. External organization | 0.288 | 0.313 | 0.291 | 0.270 | 0.269 | 0.231 |
| 5. Internal environment | 0.269 | 0.285 | 0.265 | 0.256 | 0.243 | 0.217 |
| 6. External environment | 0.243 | 0.230 | 0.239 | 0.231 | 0.228 | 0.187 |
Table 3.
Sum of influences given and received on each dimension.
| Dimension | ri + ci | ri − ci |
|---|---|---|
| 1. Internal process | 3.110 | −0.156 |
| 2. External process | 3.326 | −0.094 |
| 3. Internal organization | 3.279 | 0.045 |
| 4. External organization | 3.222 | 0.104 |
| 5. Internal environment | 3.029 | 0.041 |
| 6. External environment | 2.655 | 0.061 |
Table 4.
Sum of influences given and received on each criterion.
| Dimensions | Criteria | ri + ci | ri − ci |
|---|---|---|---|
| Internal process | Recycle of excessive inventory materials | 2.727 | −0.075 |
| Expired products and waste materials management | 2.641 | −0.071 | |
| Green process management | 2.848 | −0.006 | |
| Uncertainty of technology | 2.232 | 0.066 | |
| New technology adoption | 2.476 | 0.086 | |
| External process | Selection of environmentally oriented partners | 1.731 | −0.011 |
| Green supply management | 1.797 | 0.009 | |
| Customer cooperation | 1.780 | 0.002 | |
| Internal organization | Cooperation between green project team | 2.935 | −0.117 |
| Size of green project team | 2.772 | −0.164 | |
| Organizational structure and policy | 3.125 | −0.047 | |
| Management commitment | 2.626 | 0.148 | |
| Corporate performance | 2.952 | 0.180 | |
| External organization | Stakeholder management | 1.566 | 0.016 |
| Size of suppliers | 1.577 | 0.029 | |
| Green competitiveness of suppliers | 1.723 | −0.045 | |
| Internal environment | Environmental investment | 2.213 | 0.019 |
| Location of the firms | 1.779 | 0.001 | |
| Size of community | 1.691 | 0.015 | |
| Implementation of environmental management systems | 2.103 | −0.035 | |
| External environment | Market competitive intensity | 1.990 | −0.062 |
| Regulatory pressure from government | 1.543 | −0.057 | |
| Climate change | 0.942 | 0.044 | |
| Uncertainty risk | 1.497 | 0.075 |
Table 5.
Weights and ranks of six dimensions in a green project management.
| Dimension | Weight | Rank |
|---|---|---|
| External Process | 0.187 | 1 |
| Internal Process | 0.175 | 2 |
| External organization | 0.171 | 3 |
| Internal organization | 0.166 | 4 |
| Internal environment | 0.159 | 5 |
| External environment | 0.141 | 6 |
Table 6.
Weights and ranks of criteria in a green project management.
| Dimensions | Criteria | Weight | Rank |
|---|---|---|---|
| Internal process | Recycle of excessive inventory materials | 0.035 | 11 |
| Expired products and waste materials management | 0.034 | 14 | |
| Green process management | 0.036 | 10 | |
| Uncertainty of technology | 0.027 | 23 | |
| New technology adoption | 0.030 | 20 | |
| External process | Selection of environmentally oriented partners | 0.080 | 3 |
| Green supply management | 0.082 | 1 | |
| Customer cooperation | 0.081 | 2 | |
| Internal organization | Cooperation between green project team | 0.034 | 15 |
| Size of green project team | 0.033 | 16 | |
| Organizational structure and policy | 0.035 | 12 | |
| Management commitment | 0.028 | 22 | |
| Corporate performance | 0.031 | 18 | |
| External organization | Stakeholder management | 0.049 | 5 |
| Size of suppliers | 0.049 | 6 | |
| Green competitiveness of suppliers | 0.057 | 4 | |
| Internal environment | Environmental investment | 0.042 | 8 |
| Location of the firms | 0.033 | 17 | |
| Size of community | 0.031 | 19 | |
| Implementation of environmental management systems | 0.042 | 9 | |
| External environment | Market competitive intensity | 0.045 | 7 |
| Regulatory pressure from government | 0.035 | 13 | |
| Climate change | 0.019 | 24 | |
| Uncertainty risk | 0.030 | 21 |
© 2017 by the authors. Licensee MDPI, Basel, Switzerland. This article is an open access article distributed under the terms and conditions of the Creative Commons Attribution (CC BY) license (http://creativecommons.org/licenses/by/4.0/).
Share and Cite
MDPI and ACS Style
Chou, Y.-C.; Yang, C.-H.; Lu, C.-H.; Dang, V.T.; Yang, P.-A. Building Criteria for Evaluating Green Project Management: An Integrated Approach of DEMATEL and ANP. Sustainability 2017, 9, 740. https://doi.org/10.3390/su9050740
AMA Style
Chou Y-C, Yang C-H, Lu C-H, Dang VT, Yang P-A. Building Criteria for Evaluating Green Project Management: An Integrated Approach of DEMATEL and ANP. Sustainability. 2017; 9(5):740. https://doi.org/10.3390/su9050740
Chicago/Turabian StyleChou, Ying-Chyi, Chia-Han Yang, Ching-Hua Lu, Van Thac Dang, and Pei-An Yang. 2017. "Building Criteria for Evaluating Green Project Management: An Integrated Approach of DEMATEL and ANP" Sustainability 9, no. 5: 740. https://doi.org/10.3390/su9050740
Note that from the first issue of 2016, this journal uses article numbers instead of page numbers. See further details here.