Article

Promoting the Opportunity Identification of Industrial Symbiosis: Agent-Based Modeling Inspired by Innovation Diffusion Theory

School of Economics and Management, Beihang University; Beijing 100191, China
*
Author to whom correspondence should be addressed.
Sustainability 2017, 9(5), 765; https://doi.org/10.3390/su9050765
Submission received: 6 March 2017 / Revised: 2 May 2017 / Accepted: 2 May 2017 / Published: 6 May 2017
(This article belongs to the Section Economic and Business Aspects of Sustainability)

Abstract

:
Promotion of the emergence of synergistic linkages between different firms is crucial in the development of Industrial Symbiosis (IS) networks or Eco-Industrial Parks (EIP). Appropriate strategies for the promotion of inter-firm interactions are required to enhance the emergence of IS networks through institutional capacity building. This research draws on insight from Diffusion of Innovations (DoI) theory, and considers the emergence and development of IS as a process where the knowledge, attitude and implementation of IS synergies are gradually adopted by firms. Accordingly, we propose an Agent-Based Model (ABM) to investigate the influence of promoting strategies associated with various dimensions of institutional capabilities, on the identification of opportunity sets for IS synergies. The simulation results show that both “Knowledge Coordination” and “Relationship Coordination” have a positive impact on the identification of IS opportunities (represented by the adoption of positive attitudes). However, the performance of promoting strategies depends to a great extent on the mobilization capacity and the characteristics of the specific IS solutions. We believe the proposed research provides insights and implications for the design of the strategies to promote effective IS practice.

1. Introduction

Since the 1970s, a network of inter-firm synergistic linkages has gradually emerged in Kalundborg, Denmark, where firms trade their by-products and formed a cascade of interacting use of energy with one another, yielding remarkable environmental and economic benefits [1]. In the 1990s, this unique collaborative pattern was described as “Industrial Symbiosis (IS)”, an ecological metaphor to explain the synergistic relationships between co-located industries which had been traditionally separated [2]. Through the exchange of by-products, infrastructure/utility sharing and joint service provision, IS has been shown to reduce the negative impact of industrial activities on the environment [2,3]. The Kalundborg case has become an inspiration for global sustainable development, and IS has also drawn increasing attention from academics, industries, and governments, as an appealing solution to address environmental issues resulting from industrial activities. In the 21st century, there has been an increase in the number of IS pilot projects, particularly in the form of Eco-Industrial Parks (EIPs) [2]. Over 40 countries have been involved in EIP and IS practices [4], and each country has specific ways to interpret and implement IS in its industrial activities [5].
However, attempts to implement IS have not always been successful. Many articles based on empirical studies have discussed the barriers as well as the determining factors which promote the emergence of IS. Heeres et al., (2004) described the barriers that need to be overcome to establish symbiotic exchange relationships, including economic, informational, organizational, as well as legal and regulatory barriers. They also recognized the importance of the active participation of companies and the presence of the third party coordination agencies on the success of EIP development [6]. Moreover, as argued in many empirical studies, the emergence and performance of an IS network depends more on non-technical factors [6,7,8], which include collective learning processes [9,10], diversity [11], trust and pre-existing relationships [6,12,13], the coordinating bodies [14,15] and social embeddedness [16]. The above mentioned non-technical factors relevant to the emergence of IS could be analyzed using the concept of institutional capacity [5,17].
The existing literature has discussed the underlying mechanisms which allow IS synergies to occur, from the point-of-view of self-interested interactions and collaboration at the level of individual firms or stakeholders [18,19]. The factors, capacities and dynamics at the level of local, regional and even national industrial systems have also been addressed [5,20]. However, there is still a lack of understanding of the conceptual links between these factors and dynamics of the macro-level systems and the actions of micro level individual actors [17]. Additionally, the transformation of industrial systems towards IS or EIPs requires the application of analytic methodology and modeling tools to support and facilitate the process [21], other than the conventional ex-post evaluation and analysis of the IS development process. To fill this research gap, we propose an Agent-Based Model (ABM) to investigate how the promoting strategies influence the identification of opportunity sets for IS emergence. In this model, we introduce the Diffusion of Innovation (DoI) theory to explain the behavior and decision-making of firms which are likely to be involved in IS, considering the identification of IS opportunities as the diffusion/adoption of the knowledge of certain IS synergies and the positive attitudes towards them. Then we conduct simulation experiments to investigate the performances of the promoting strategies with their special focus on various dimensions of institutional capacity building.
The remainder of the paper is organized as follows. Section 2 introduces the relevant theoretical background and the Agent-Based Modeling and Simulation (ABMS) method. Section 3 proposes the ABM, introduces the interaction rules and decision mechanisms of the agents. Section 4 describes the model implementation and initialization, followed by the analysis and discussion of the simulation results in Section 5. Finally, Section 6 summarizes the conclusions of the study and suggests the further research themes.

2. Relevant Theories and Research Methods

2.1. Theoretical Perspective of Diffusion of Innovation (DoI) Theory

2.1.1. DoI Theory

DoI theory was first proposed by Rogers in 1962, with the aim of explaining how and why an innovation spreads through certain communication channels among the members of a given social system [22] (p. 5). DoI proposes a theoretical framework that integrates the diffusion process at the macro level with the adopter’s adoption-decision and actions at the micro level. According to DoI theory, the process for an individual or other decision-making unit to adopt a certain innovation includes five stages: (1) knowledge; (2) persuasion; (3) decision; (4) implementation; and (5) confirmation [22] (p. 169). Each stage corresponds to certain actions/decisions such as the adoption of knowledge (Stage 1), the formation of attitude (Stage 2), and the adoption of practice (Stages 3–5).
It should be noted that most studies of innovation diffusion, especially those in the early days, took the individual person as the unit of adoption analysis. However, nowadays using the DoI theoretical framework, the unit of adoption has been broadened to include organizations and other social communities [22] (pp. 225–226).

2.1.2. The Development of IS as an Innovation Diffusion Process

The term “eco-innovations” refers to the approaches that lead to positive impacts on sustainability and better environmental performance, including new products, technologies, process, organizational arrangements, and even social and institutional changes [23,24]. The Organization for Economic Cooperation and Development (OECD) recognized IS as an example of a transformative eco-innovation to realize green growth, since it proposes a novel business model that works across the organizational boundaries of industrial actors, to exchange by-products, share services and utilities, eventually creating a closed-loop of resource flows [25]. The emergence of IS linkages and development of IS networks could be considered as the process in which increasing numbers of firms have adopted the novel concept of IS, identified the opportunities, and eventually have started to participate in IS practice. DoI has proved itself as a reliable tool to interpret and predict the diffusion patterns and performance of systemic eco-innovations, for example, the diffusion of Green Supply Chain Management (GSCM) among manufacturers [26,27]. Therefore, in this research we consider IS as an eco-innovation, and draw on the theoretical lens from DoI to understand the adoption behavior of potential participating firms and the patterns of development in IS networks.

2.1.3. Typical Models for IS Development

IS networks have emerged through distinct arrangement approaches, which in general can be divided into three development models [28,29]: (1) the self-organizing model; (2) the top-down planned model; and (3) the facilitated model.
A self-organizing model indicates a bottom-up spontaneous pattern of IS development. A self-organizing IS usually emerges from the inter-firm resource exchanges driven by mutual self-interest, and is without environmental awareness at the early stages [30]. In contrast, the planned model uses a goal-directed pattern to implement IS with top-down planning and coordination of the governmental agencies [30]. Thus, the main focus of the self-organizing model lies in the emergence and evolution of IS, while in the planned model IS implementation is intended. Many empirical studies have illustrated that spontaneous IS practices seem to be more sustainable and resilient compared with planned IS, due to the profit-driven nature and active participation of firms in self-organizing approaches [6,30,31]. However, compared to the rapid implementation of planned IS, self-organizing IS can be very slow to emerge and is usually restricted to a smaller scale [28]. The facilitated model of IS development is considered as a third way between the “top-down” planning and “bottom-up” self-organizing [15]. It arose in the last decade, and has been widely reported and analyzed in the literature (e.g., [15,20,28,31,32,33,34]). The facilitated model introduces the idea of organization by a third party—usually called a “facilitator”—to promote inter-firm communication through networking activities, encourage information exchange to help firms recognize opportunities, and eventually facilitate the emergence of synergistic linkages [28]. This approach is more applicable to the establishment of by-product synergies in a wider regional dimension.
Studies also show that the often-used distinction between and among self-organizing, planned and facilitated IS can be rephrased from the process perspective [35]. For example, Tianjin Economic-technological Development Area (TEDA) EIP started with a planned approach and has transferred to a planned and facilitated EIP [20], and the IS which spontaneously emerged and was “uncovered” in Kalundborg is now facilitated by the coordinating body—Symbiosis Institute [30].
Drawing on the insight of DoI, we can easily conclude that the three IS development models correspond to the decentralized, centralized, and hybrid models of diffusion systems respectively ([22] pp. 394–399). Table 1 compares the three IS development models based on the characteristics of their corresponding diffusion systems. The DoI perspective helps to clarify the essential elements in an emerging IS system, including potential adopters (the firms), the promoting agency (i.e., the central planner in the planned IS model, and the facilitator in the facilitated IS model), innovations, and communication channels (represented by the direction of diffusion). Nevertheless, Table 1 only provides a highly simplified model to distinguish how various types of diffusion systems are organized and operated. Similarly, the three IS development models discussed above (also referred to widely in the IS literature) just offer a generic typology to distinguish the dynamics of how IS linkages emerge among firms.

2.2. Stimulating IS Emergence: Strategies for Institutional Capacity Building

Considering the strategies that promote the IS process at the industrial park- or cluster-level, Boons et al. (2011), and Boons and Spekkink (2012) have provided a hypothesis that the emergence of IS linkages is made by continuous institutional capacity building, which includes three dimensions of institutional capabilities as follows [5,17].
  • Relational capacity: The ability provided by networking activities to reduce transaction costs among firms through increased trust and mutual understanding.
  • Knowledge capacity: The ability to acquire and share information/knowledge that enables firms and other actors to reduce the environmental impact of their activities.
  • Mobilization capacity: The ability of actors to activate and involve the firms that are necessary for IS development.
Based on substantial IS literature, Boons and Spekkink (2012) have further proposed a conceptual framework (see Figure 1) that indicates that the institutional capacity directly affects the feasibility of IS opportunities, which in turn affects the condition and performance of inter-firm symbiotic synergies.
The micro-level part of this conceptual model shows a quite similar sequence of actions as in the adoption-decision process. The conceptual model proposes that the firms/actors first identify the opportunities for IS synergies, then make decisions based on these opportunity sets and implement them in IS practice. Accordingly, from the perspective of DoI, the decision process for firms to participate in IS practices consists of the sequence of knowledge adoption, attitude formulation, and the innovation decision, among which the former two (knowledge adoption and attitude formulation) eventually lead to the outcomes of innovation decision. It could be concluded that, in the context of IS emergence, the understanding and interpretation of micro-level actions are verified mutually from both the DoI perspective and IS institutional capacity perspective. We then propose that the identification of opportunity sets by firms could be considered as their adoption of knowledge of certain IS synergies as well as the positive attitudes towards them, while the follow-up decision-making and IS implementation correspond to the practice adoption of the adoption-decision process.

2.3. Agent-Based Modeling and Simulation (ABMS)

Agent-Based modeling (ABM) is a computational approach that investigates macro level complex emergent phenomena by simulation of the collective micro behavior of autonomous agents. As one of the methodologies and tools developed associated with the area of complex science [36], ABM adopts a “bottom-up” perspective, focusing on actions and interactions instead of establishing a complete image of a complex system. Agent-Based Modeling and Simulation (ABMS) has been applied to a wide range of research fields including biology, sociology, epidemiology, economics, and organizational science. Its application not only provides these fields with the intuitive aids to facilitate the construction of theories and concepts, but also is a practical tool for scenario evaluation, decision support and policy forecasting [37].
Many articles have demonstrated the potential contribution of ABMS to the relevant contexts of IS, for instance in industrial ecology/ecosystems and eco-industrial parks (EIPs). Axtell et al., (2001) considered ABMS as a promising approach for industrial ecologists that provides a test bed for conducting experiments to evaluate management and public policy [38]. Janssen (2008) underlined the ABM approach as the carrier to introduce a social science perspective to the analysis of industrial ecosystems [39]. Romero and Ruiz (2014) applied ABM as an analytical tool to support and facilitate the transformation of industrial systems into industrial ecosystems [21].

3. Agent-Based Model Design

3.1. The Assumptions of a Generic Industrial System

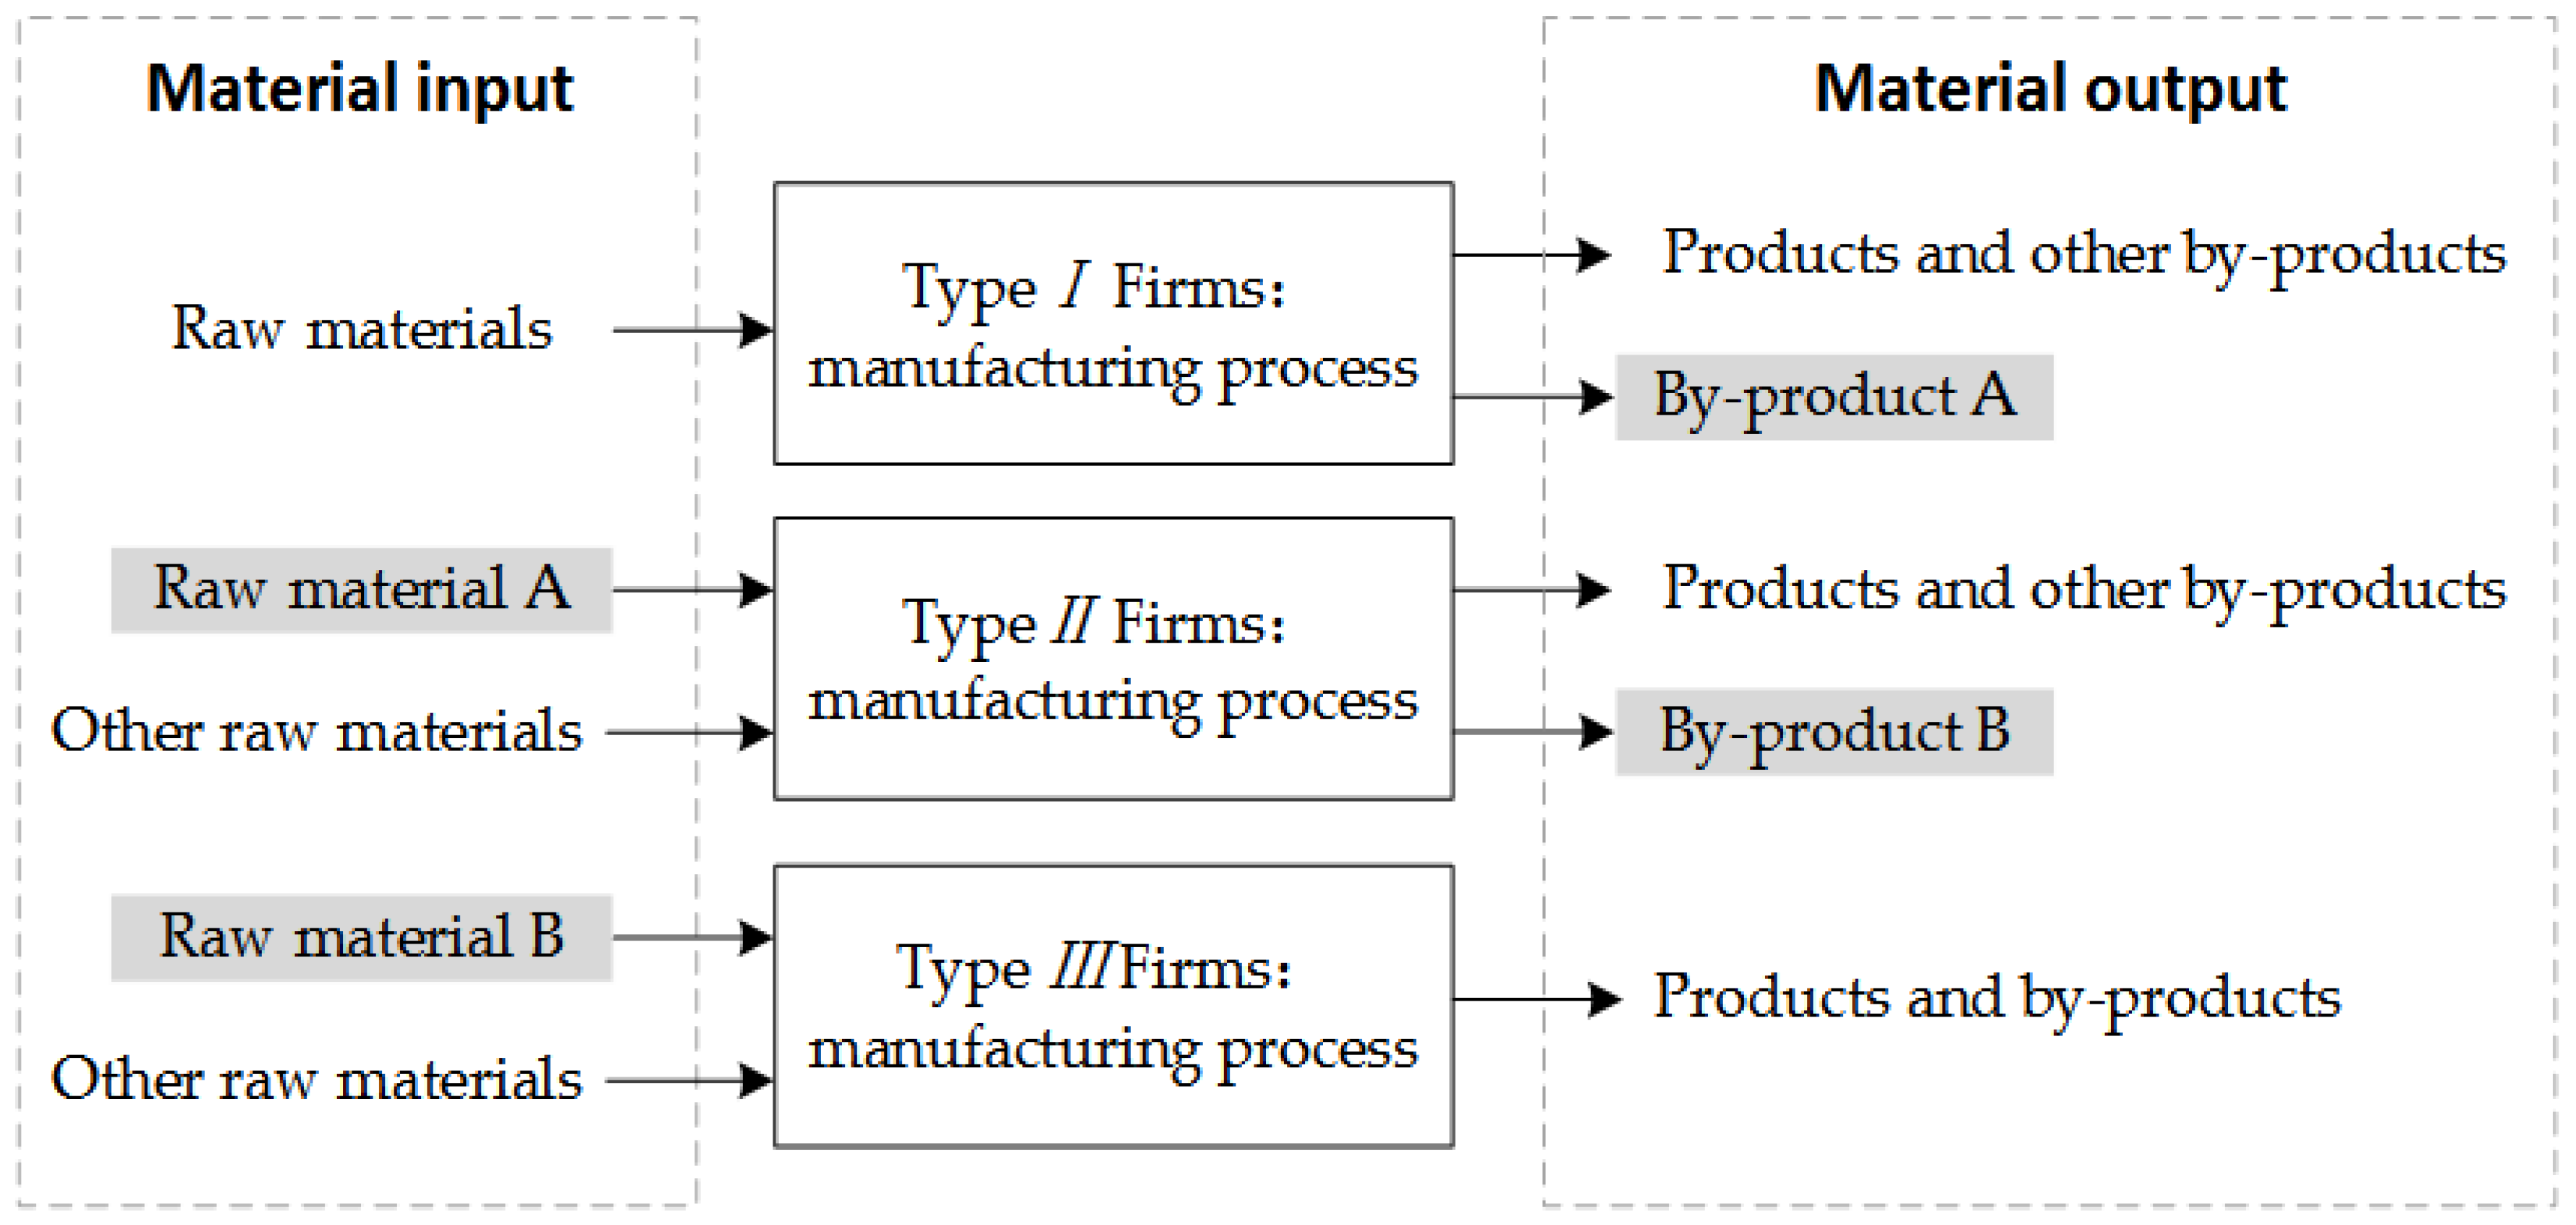
The aim of this model is to investigate the impact of promoting strategies on the identification of IS opportunities in an estimated industrial system that consists of three different types of N firms (represented as type I, type II and type III firms). The process of opportunity identification could be considered as the process of diffusion/adoption of the knowledge of certain IS synergistic solutions, and the positive attitudes towards them, as discussed in Section 2.2. The manufacturing input–output processes in the estimated industrial system are shown in Figure 2.
Figure 2 illustrates two opportunities to establish inter-firm material synergies: (1) the by-product A produced by type I firms could be introduced to type II firms as an alternative source of required input; and (2) the by-product B of type II firms could be used by type III firms as a substitute for raw material B . As such, we could also conclude that the potential adopters of the IS solution for by-product A are the type I and type II firms, while the type II and type III firms are the potential adopters of the IS solution for by-product B .
It is assumed that at the beginning, a few firms may have already identified potential IS synergies (through their own R&D efforts, or through other R&D institutes, e.g., universities). The firms then transfer/exchange the knowledge of certain IS synergies with each other spontaneously, or under the intervention of a promoting agency, and eventually form their attitude (positive or not) towards the IS synergies. Accordingly, the following strategies for promoting the emergence of IS that will be investigated in the model:
  • Self-organizing (S-O) adopts a spontaneous strategy in the knowledge/attitude diffusion process of IS. The firms interact directly with each other through the self-organized inter-firm network, and spread their knowledge and opinions to their peers spontaneously without the intervention of the promoting agency.
  • Knowledge coordination (K-C) is a promoting strategy where the promoting agency acts as a “knowledge banker” [40], providing firms with the ideas and knowledge of IS solutions via its connections with them. It is assumed that the promoting agency also has full knowledge about the IS solution in this scenario, and becomes one of the sources of the knowledge for the IS synergies.
  • Relationship coordination (R-C) is a promoting strategy where the promoting agency acts as the relationship broker, helping the firms to build new connections and strengthen communication with each other. In this scenario, the promoting agency is not involved in the knowledge transfer.
  • Combined coordination (C-C) is a promoting strategy where the promoting agency adopts both K-C and C-C to accelerate the adoption-decision making of firms.
Moreover, the strategies employed by the promoting agency promote the knowledge/attitude diffusion process (including K-C, R-C and C-C) by means of enhancing institutional capacity building. For example, knowledge coordination (K-C) strategy re-organizes knowledge transfer and helps enhance the knowledge capacity of potential IS participating firms, while relationship coordination (R-C) strategy re-constructs the inter-firm communication channels and facilitates inter-firm relationship building, enhancing their relationship capacity [41,42]. Additionally, mobilization capacity will also be enhanced through the promoting agency getting more firms in contact to exert influence.
Other basic assumptions of this model are addressed as follows:
  • Except for the strategies discussed above, this model does not consider other external factors (e.g., regulations) that might lead to changes in firms’ attitudes towards the IS synergies.
  • This model does not consider the participation of other R&D institutes (universities, consultants etc.).
  • This model does not consider the process of knowledge generation by the firms themselves. We assume that at the beginning of the simulation, there already have been several firms (or promoting agency) that have full knowledge about certain IS synergies.
  • This model neither considers the removal of established firms and inter-agent connections, nor does it consider the entry of new firms during the simulation.
  • For each simulation experiment, there is only one strategy that has been employed (S-O, K-C, R-C, or C-C) in the system at the same time. That is to say, this model does not consider the shifting of strategies during the simulation.

3.2. Agents and Their Properties

There are two types of agents involved in the estimated IS knowledge/attitude process: firm agents and promoter agents.

3.2.1. Firm Agents

Firm agents perceive potential innovation solutions, seek information and gain knowledge about the innovations, and eventually decide which attitude they will hold towards the innovation. Firms’ decision-making processes, as described by Rogers (2003), depend on the knowledge the potential adopters gradually accumulate about the innovations, and are also influenced by the opinions of their near-peers [22] (pp. 174–176). Moreover, the decision outcomes of adopters are also closely related to the their level of innovativeness [22] (p. 297). Based on the above discussion, we divide the properties of firm agents into two categories: inherent properties and status properties. Inherent properties are properties that do not change during the simulation process. These properties provide the basic profiles of the individual firm agents, and reveal their heterogeneity, which leads to different behavior and decision-making patterns. On the other hand, firm agents will update their status properties over time, based on their behavior rules and their perceived surrounding environment. Status properties present the current status of the knowledge the agents have, their evaluation of certain eco-innovations, and the decisions they make. Table 2 lists all the properties of a firm agent.

3.2.2. Promoter Agents

In the proposed research, the promoting agency (represented as “promoter agent” in the designed model) is considered as the carrier and executor of the promoting strategies. As discussed in Section 3.1, the strategies considered in this research include knowledge coordination, relationship coordination and mobilization capacity building. In this model, we consider the introduction of a promoting agency in the industrial system as the major initiative to improve the mobilization capacity, through which knowledge sources and relational resources are formed and mobilized [5].
We design the promoter agent with the following inherent properties (see Table 3):

3.3. Agents’ Behavior and Interactions

In an ABM, the intelligent agents adjust their behaviors and update their properties according to the environment they have perceived through interaction with other agents or certain environmental variables within this model. During the knowledge/attitude diffusion (or adoption from the individual agents’ perspective) process, the behavior and interactions of firm agents we need to model include:
  • Exchange of knowledge with other firm agents and promoter agents.
  • Decision-making about their attitude towards a specific IS solution.
  • Generation of new contacts with the coordination of the promoter agent.
Moreover, in this model, two agents can only interact with each other when there is a link between them. This link reflects certain social channels existing between the firms in the real-world, through which the firms could exchange information, knowledge and share opinions.

3.3.1. The Channel of Interactions: Network Model Construction

In the model, the network of interaction channels consists of two parts—a hub-and-spoke network in which the promoter agent occupies the hub position, and an inter-firm network which is formed spontaneously.
The promoter creates contacts with the firm agents to transfer knowledge to them. Assume the number of firm agents in the model is N , then they form a star-shape network with N * p p r o edges (see Table 3 for the explanation of p p r o ).
We use a weighted small-world network to present the initial structure of the inter-firm network. The small-world network is a typical mathematical network model with a relatively high clustering coefficient and short average path length, exhibiting the characteristics of both a regular network and a random network [43]. Many realistic social networks, particularly inter-firm networks, are frequently characterized by the notion of a small-world structure [44], and the mathematical and computational model of small-world networks has frequently been used in modeling and simulation experiments [45,46]. We construct a small-world network with the Watts–Strogatz mechanism [43]. First, we build a regular graph with N firm agents as vertices, with each vertex having edges with its nearest n vertices ( n is also the mean degree of the network), and it should satisfy N n ln ( N ) . Then, the edges are rewired with the probability p r e w i r e ( 0 p r e w i r e 1 ) to create short cuts. e i j represents the edge between firm agents i and j , and the weight of edge e i j is w i j . For this undirected network, e i j = e j i and w i j = w j i . The value of w i j reflects the interaction frequency and the mutual influence between agents i and j . The higher w i j is, the greater the impact on the opinions of each other. The initial value of w i j = 1 , and every interaction conducted through e i j will add 1 to w i j .
In addition, the “relationship coordination (R-C)” and “combined coordination (C-C)” strategies will bring dynamic changes to the structure of the inter-firm network. At each time step t , n r c pairs of firm agents that have been linked with the promoter agent are randomly selected. If there has been an edge between the selected pair of agents (e.g., agent i and agent j ), then its weight w i j will add 1, indicating that agent i and j have communication under a promoter’s coordination; on the contrary, new edge e i j is created with an initial weight w i j = 1.

3.3.2. Knowledge Exchange among Agents

We adopt the “knowledge broadcast” model proposed by Cowan (2005) [47] to construct the knowledge exchange mechanism in this model. The basic idea of “knowledge broadcast” is that, at certain time step t , for the interacting agent i and agent j , if k i r ( t ) > k j r ( t ) 0 , then the knowledge is transferred from agent i to agent j . In this case, agent i is the knowledge broadcaster, and agent j is the knowledge recipient. According to Cowan et al. (2004), we model how the knowledge recipient (e.g., agent j ) adjusts its knowledge properties after the knowledge exchange [48]:
k j r ( t + 1 ) = k j r ( t ) × { 1 + ( k j r ( t ) k i r ( t ) ) λ × [ 1 ( k j r ( t ) k i r ( t ) ) λ ] } ,   k i r ( t ) > k j r ( t ) 0
According to Equation (1), knowledge exchange would not happen if k j r ( t ) > k i r ( t ) , or k i r ( t ) ,   k j r ( t ) = 0 . The knowledge transferred at time t is ( k j r ( t ) k i r ( t ) ) λ × [ 1 ( k j r ( t ) k i r ( t ) ) λ ] .
This reflects the realistic scenario that when the knowledge level of the recipient is far behind that of the broadcaster, it is hard for the recipient to understand and absorb the knowledge from the broadcaster. As the knowledge level of recipient increases, its capability to learn from the broadcaster is strengthened. However, as the knowledge levels of the two become more and more congruent, there is increasingly less new knowledge that the recipient could get from the broadcaster. Here λ indicates the capability of the recipient (agent j ) to learn and absorb the innovative knowledge. Given a relatively higher value of λ , it is possible to get a result that k j r ( t + 1 ) > k i r ( t ) at some point, which means the Formula (1) is also able to simulate the innovation of knowledge. In this model, we assign the value of knowledge capability k c j to λ , for k c j [ 0 , 1 ] , k j r ( t + 1 ) k i r ( t ) .
In the proposed model, at each time step t , each firm agent contacts one of the other firm agents it has linked to exchange knowledge based on the algorithm we have discussed above. In addition, when the promoter agent employs the strategy of knowledge coordination (K-C) or combined coordination (C-C), at each time step, it contacts a certain number ( n k c ) of firm agents it has linked to transfer knowledge to them.

3.3.3. Decision-Making about the Formation of Attitude

Threshold models are frequently applied in diffusion research, especially in the diffusion of technology and products [49]. However, unlike commercial products or Information and Communication Technologies (ICT), which are the cases frequently studied in diffusion research, IS initiatives are not universally applicable for potential adopters since they require more resources and opportunities to ensure the follow-up business transactions.
An individual firm agent makes a decision about their attitude towards certain IS solutions based on their internal motivations and the perceived external influences. Then for firm agent i , the utility of a specific IS solution (about material r ) is evaluated as:
U i r = β r × U i n f , r + ( 1 β r ) U k , r   ,   0 < β r < 1
U i n f , r represents the utility that agent i has perceived from its near peers, U k , r represents the utility that agent i predicts based on its own knowledge, and β r is the weighting factor that measures the ratios of the two aspects of the utility in the evaluation. β r reflects the degree of uncertainty and the associated risk of corresponding IS solutions to some content. Firms expect more support from the comments and opinions of their near peers when they consider a newly emerged, or more radical innovation. Thus, we could say that, a higher value of β r indicates that the corresponding IS solution has a higher associated risk and is more difficult to implement. Then firm agent i makes the decision to form an attitude towards a specific IS solution, by comparing U i r with its utility threshold:
a t i r = { 1   U i r m i n U i 0   U i r < m i n U i
As we have explained in Table 2, the value of a t i r implies agent i ’s attitude towards the IS solution about material r , either favor it ( a t i r = 1 ) or not ( a t i r = 0 ). The value of   m i n U i is determined by the adopter category ( a i ) of agent i .
Then we explain the calculation of utilities evaluated both based on their knowledge ( U k , r ) and the externally influence they have perceived ( U i n f , r ). First, agent i ’s knowledge is an important basis for determining the utility of certain IS solutions, thus:
U k , r =   k i r
The decision of an individual/organization to innovate is also influenced by the behavior and attitude of its peers. For the firm agents, the behavior of their peers towards certain innovations creates external pressures on their decision. When the pressure that firm agents have perceived is strong enough, they will follow the action that their peers have taken. The function of perceived utility is:
U i n f , r = i n f i × p _ i n f i r
This part of utility is determined by agents’ perception towards the eco-innovation ( i n f i ), and the external influences that agents have perceived ( p _ i n f i r ). For agent   i , i n f i is determined by its adopter category; the firms that are more likely to adopt an eco-innovation (such as early adopters) can sense the positive attitudes towards the eco-innovation more easily. p _ i n f i r stands for the external attitude that agent   i has perceived towards certain IS solutions the firm perceived. Here a threshold model proposed by Valente (1996) is adopted, which measures the influence from agents’ direct connections [49]. Moreover, we improve the threshold model by taking into account the weights of the firm agents’ linkages. As we discussed earlier, w i j measures the interaction frequency and the mutual influence between agents i and j , thus they will be more likely to exert influence on each other if w i j is high.
p _ i n f i r = { 1   x h 0   x < h
x = j τ r ( i ) w i j / j τ ( i ) w i j ,   τ r ( i ) τ ( i )
τ ( i ) indicates the collection of firm agents that are directly connected with agent   i , while τ r ( i ) indicates the agents within τ ( i ) that have held a positive attitude towards the IS solution about material r . x measures the weighted ratio of positive attitudes towards a certain IS solution among agent i ’s directly-connected agents. When   x exceeds a given threshold h , as expressed in Equation (6), firm agent i presumes that this IS solution has been generally approved by the community it is located in. Therefore, based on Equations (5)–(7):
U i n f , r = { i n f i j τ r ( i ) w i j / j τ ( i ) w i j h 0 j τ r ( i ) w i j / j τ ( i ) w i j < h

4. Model Implementation

Section 3 described the building blocks of this model: model assumptions, the agents, their behavior pattern, the network structure of their interactions, and the mechanism of their decision-making. This section explains how these components come together to implement the agent-based model and conduct a simulation experiment.

4.1. Simulation Process Scheduling

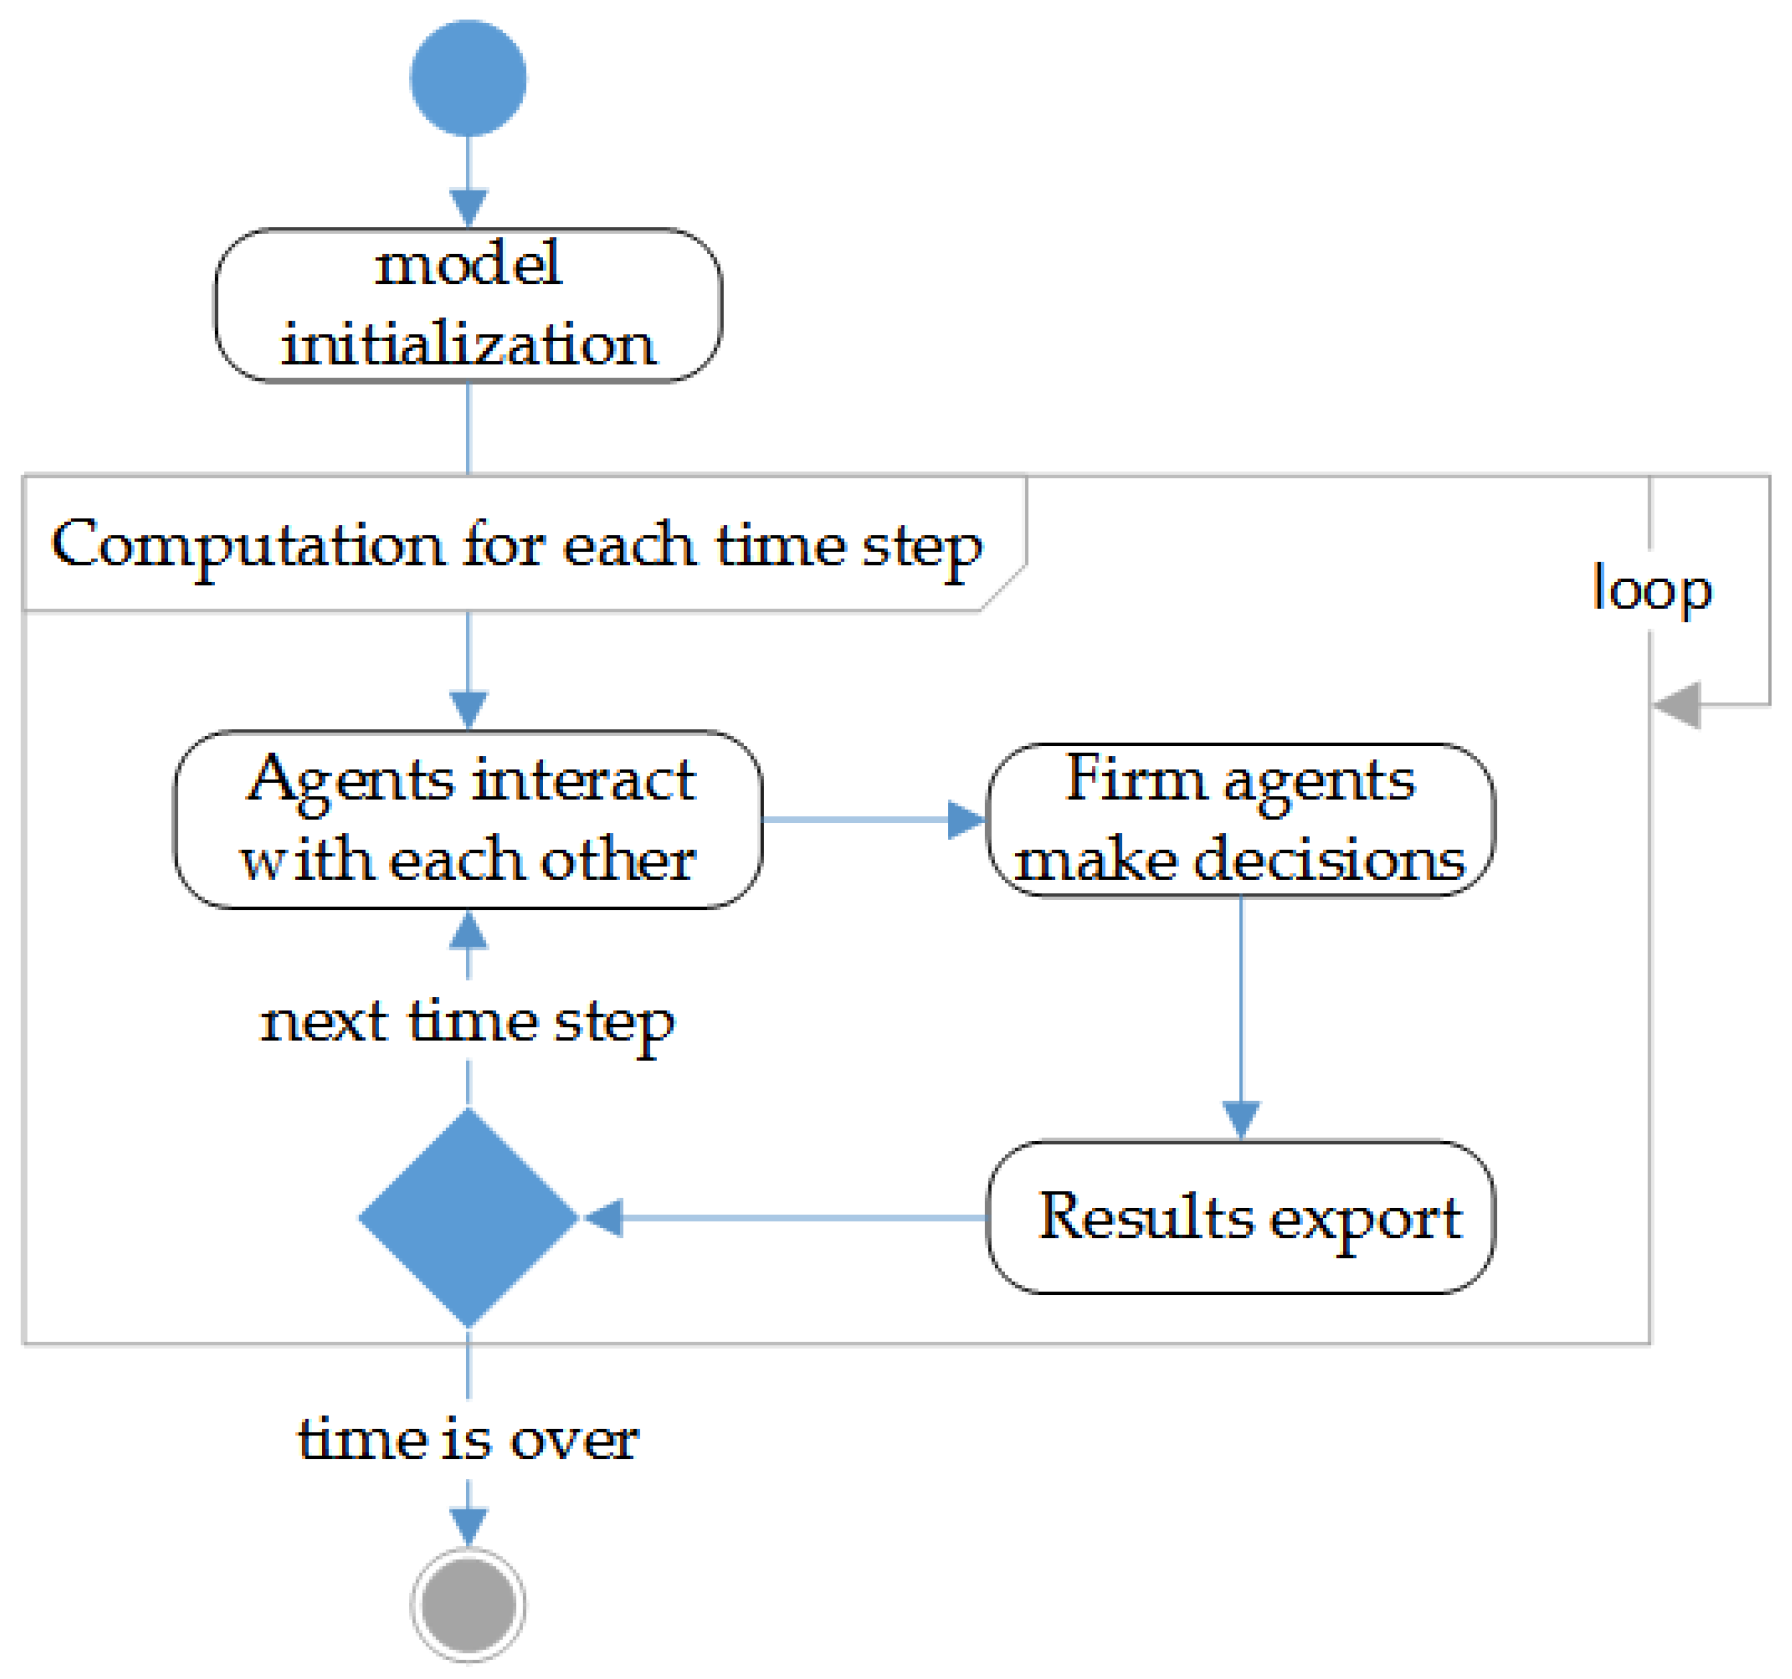
Figure 3 outlines the overall process of the simulation experiment, where the blue dot marks the starting point and the gray dot marks the end of the simulation process. The simulation begins with the model initialization which includes the creation of agents and the construction of the inter-agents network.
As shown in Figure 4, a specified number of agents and the linkages among them are created, and their properties are set to the initial values. Moreover, the initialization procedure is slightly different according to the estimated strategies that we have discussed in Section 3.1—including self-organizing (S-O), knowledge coordination (K-O), relationship coordination (R-C) and combined coordination (C-C). The gray dot in Figure 4 marks the end of initialization as well as the beginning of the simulation experiment shown in Figure 5.
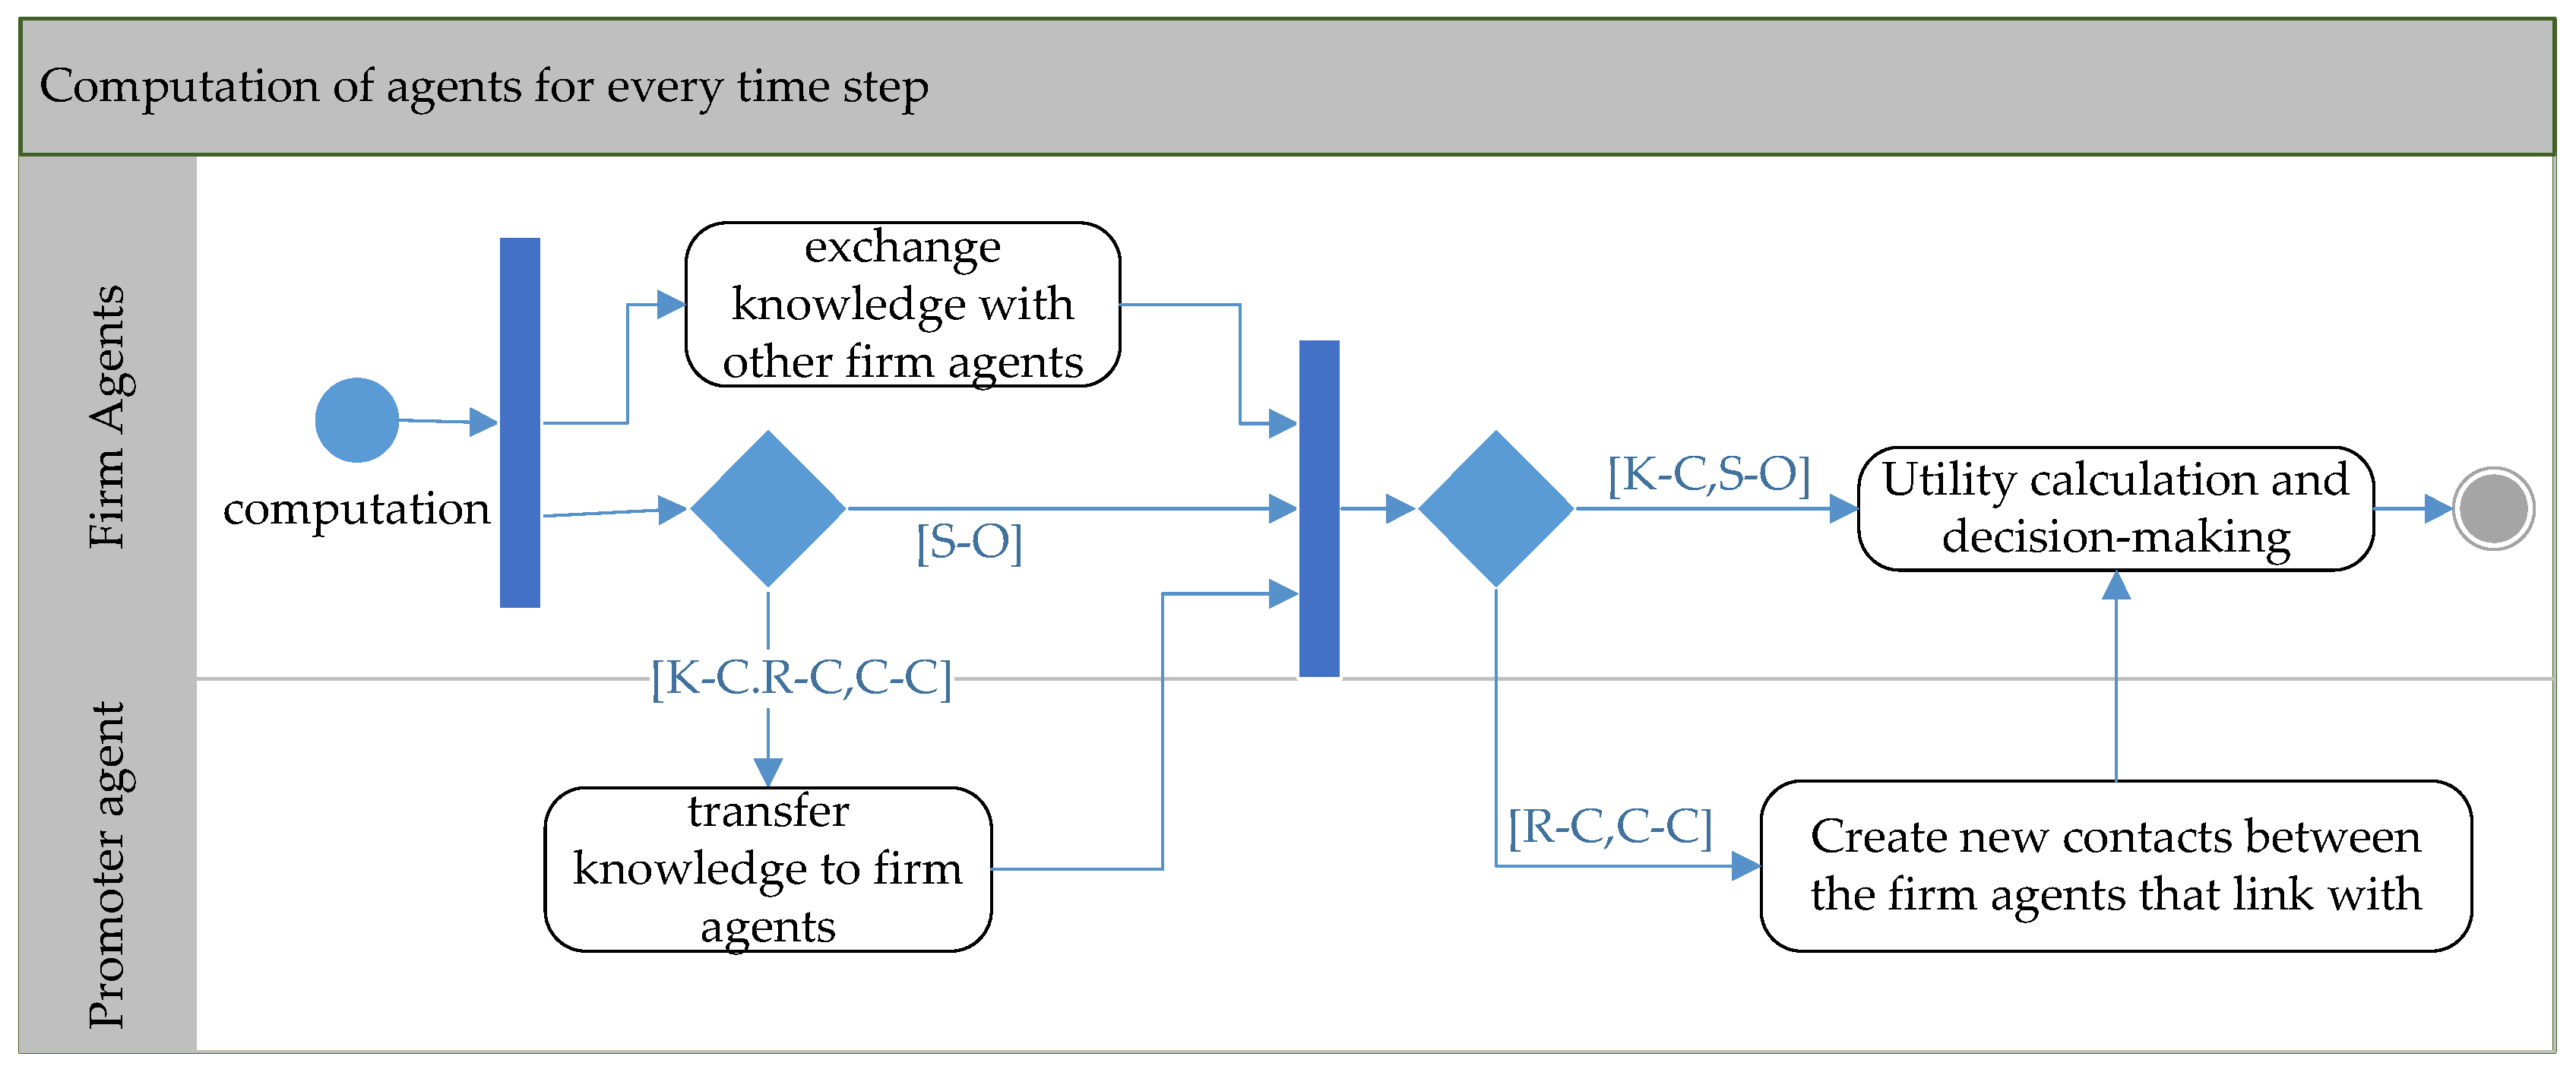
Figure 5 demonstrates the activities of agents during the computation of each time step—who evolved, what happened, and in what order. At each time step, the following happens: (1) the agents interact and exchange their knowledge with each other; (2) the firm agents decide on their attitude towards the IS solutions; and (3) data are exported for making plots and analysis of the results. Additionally, the promoter agent is required to facilitate the communication between firm agents when the R-C or C-C strategies are employed. The process shown in Figure 5 is repeated in a given simulation time period (see the initial settings in Table 4).

4.2. Implementation

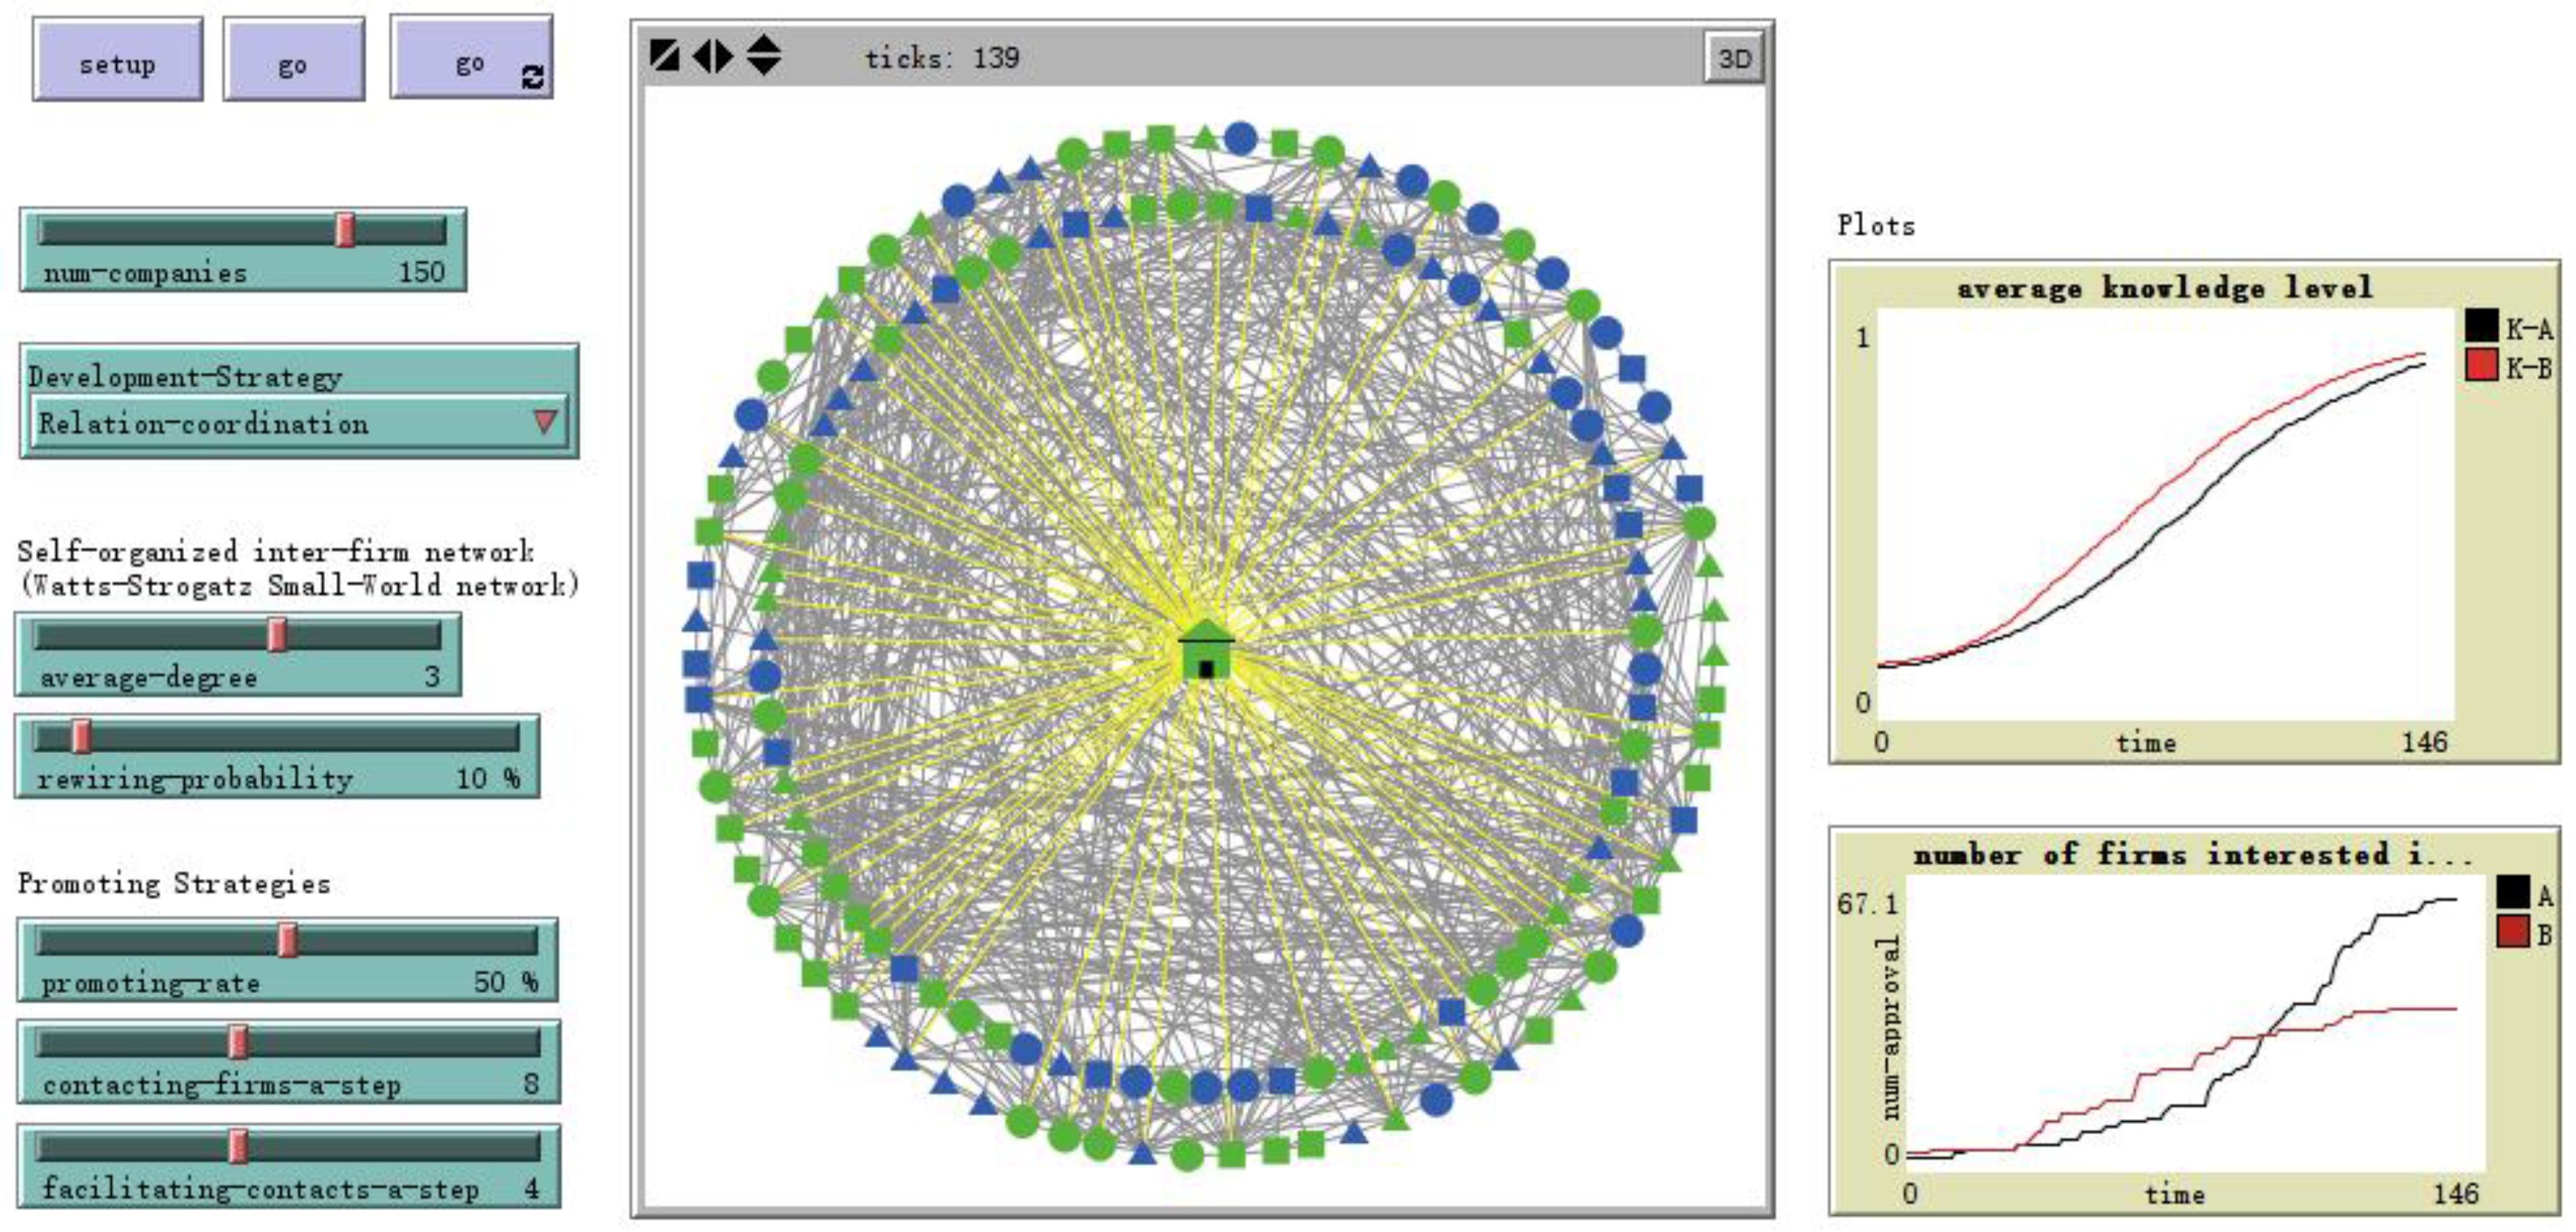
This study introduces the simulation platform NetLogo 5.3.1 [50] to implement the designed ABM and run the simulation. The NetLogo interface of the proposed ABM is shown in Figure 6. The buttons on the upper left control the experimental process. The green drop-down selecting box and sliders can be used to adjust the initial parameters of the model, e.g., the strategies, the network structures, and so on. The interactions and behavior of the agents are displayed in the 2D view in the middle of the interface. The two charts on the right side monitor the dynamic changes of agents.
The initial settings of the simulation environment and the agents are shown in Table 4 and Table 5, respectively.

5. Analysis of Results

The simulation experiments investigated the knowledge/attitude diffusion of two by-product synergistic solutions—about by-products   A and B —under different promoting strategies (K-C, R-C, and C-C) with a special focus on institutional capacity building. Additionally, the experiment on the spontaneous strategy S-O was also conducted to contrast with the outcomes observed with the promoting strategies.
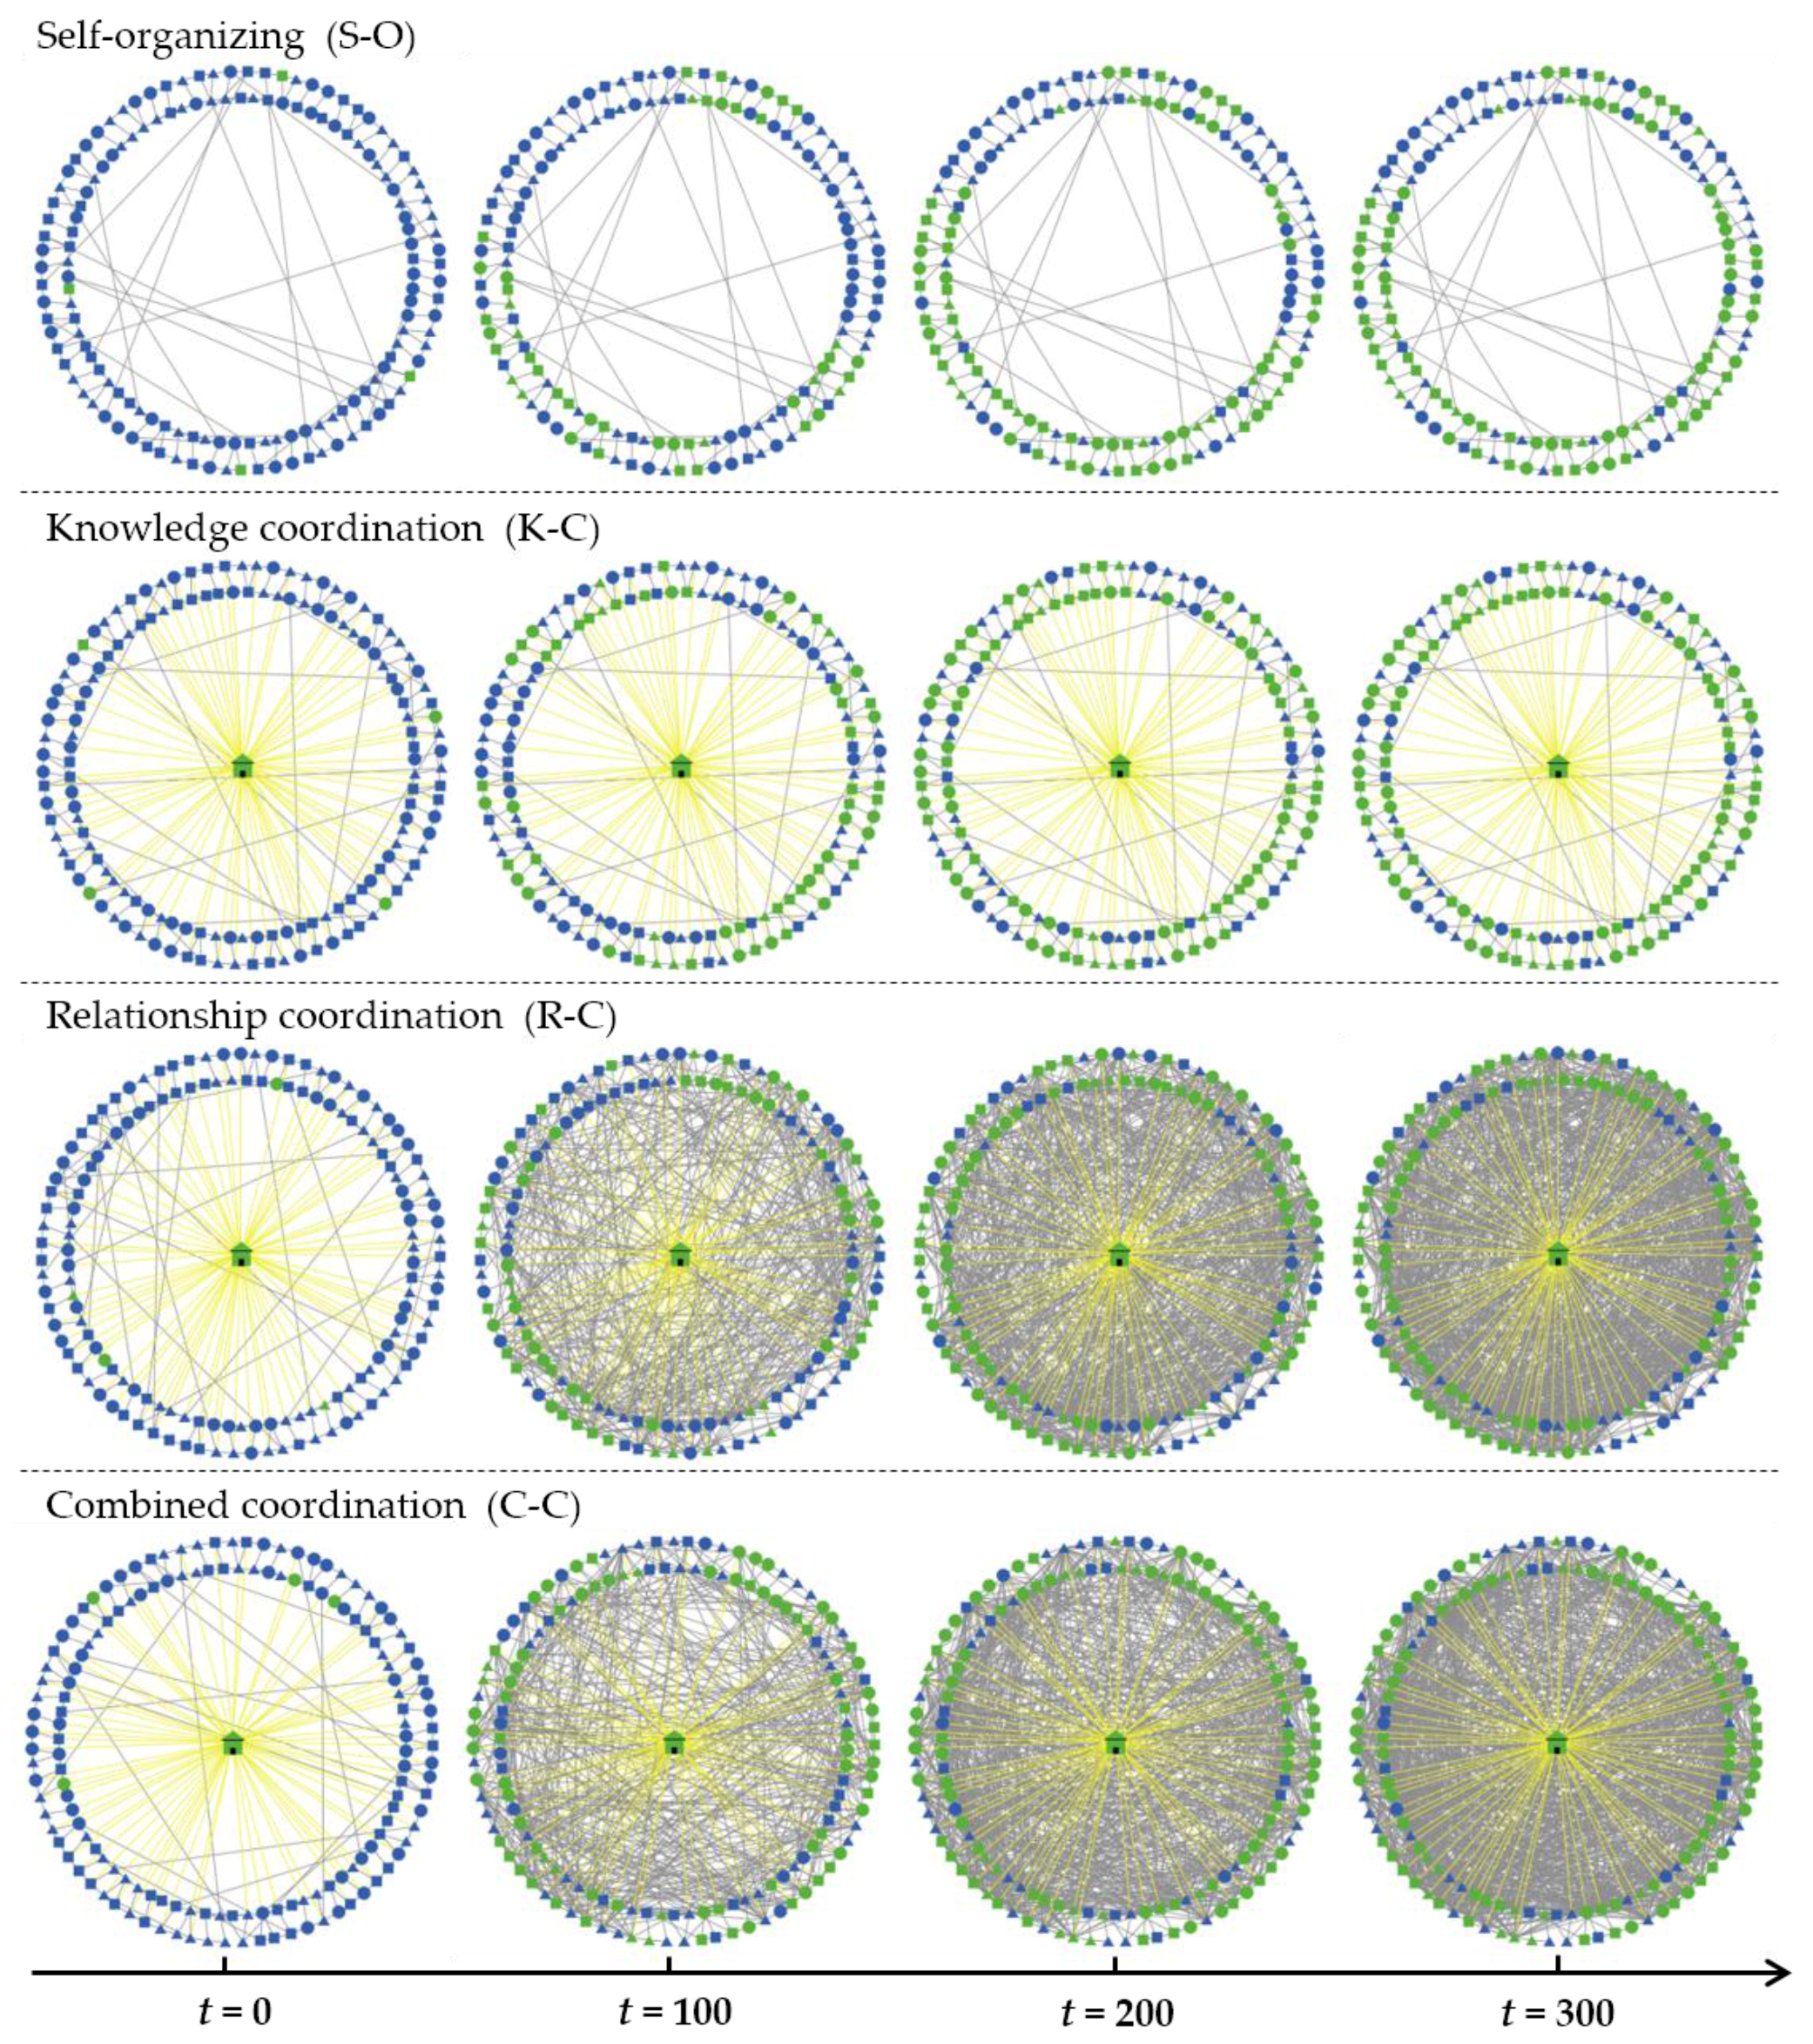
Figure 7 shows the knowledge/attitude diffusion process of IS under the different strategies. The type I, type II, and type III firm agents are represented by the circles, squares and triangles respectively. Moreover, the color of the firm agents indicates their attitudes toward the IS solutions—if the color turns green, the firm has formed positive attitude(s) towards at least one IS solution. The knowledge and influence are delivered through the inter-firm networks (the gray edges) and promoter-firm linkages (the yellow edges).
For each strategy, we conducted an experiment that was repeatedly executed 20 times, taking the average results to compare the performance of different strategies on: (1) diffusion of knowledge; and (2) diffusion of positive attitudes.

5.1. The Performance of Promoting Strategies

5.1.1. Diffusion of Knowledge

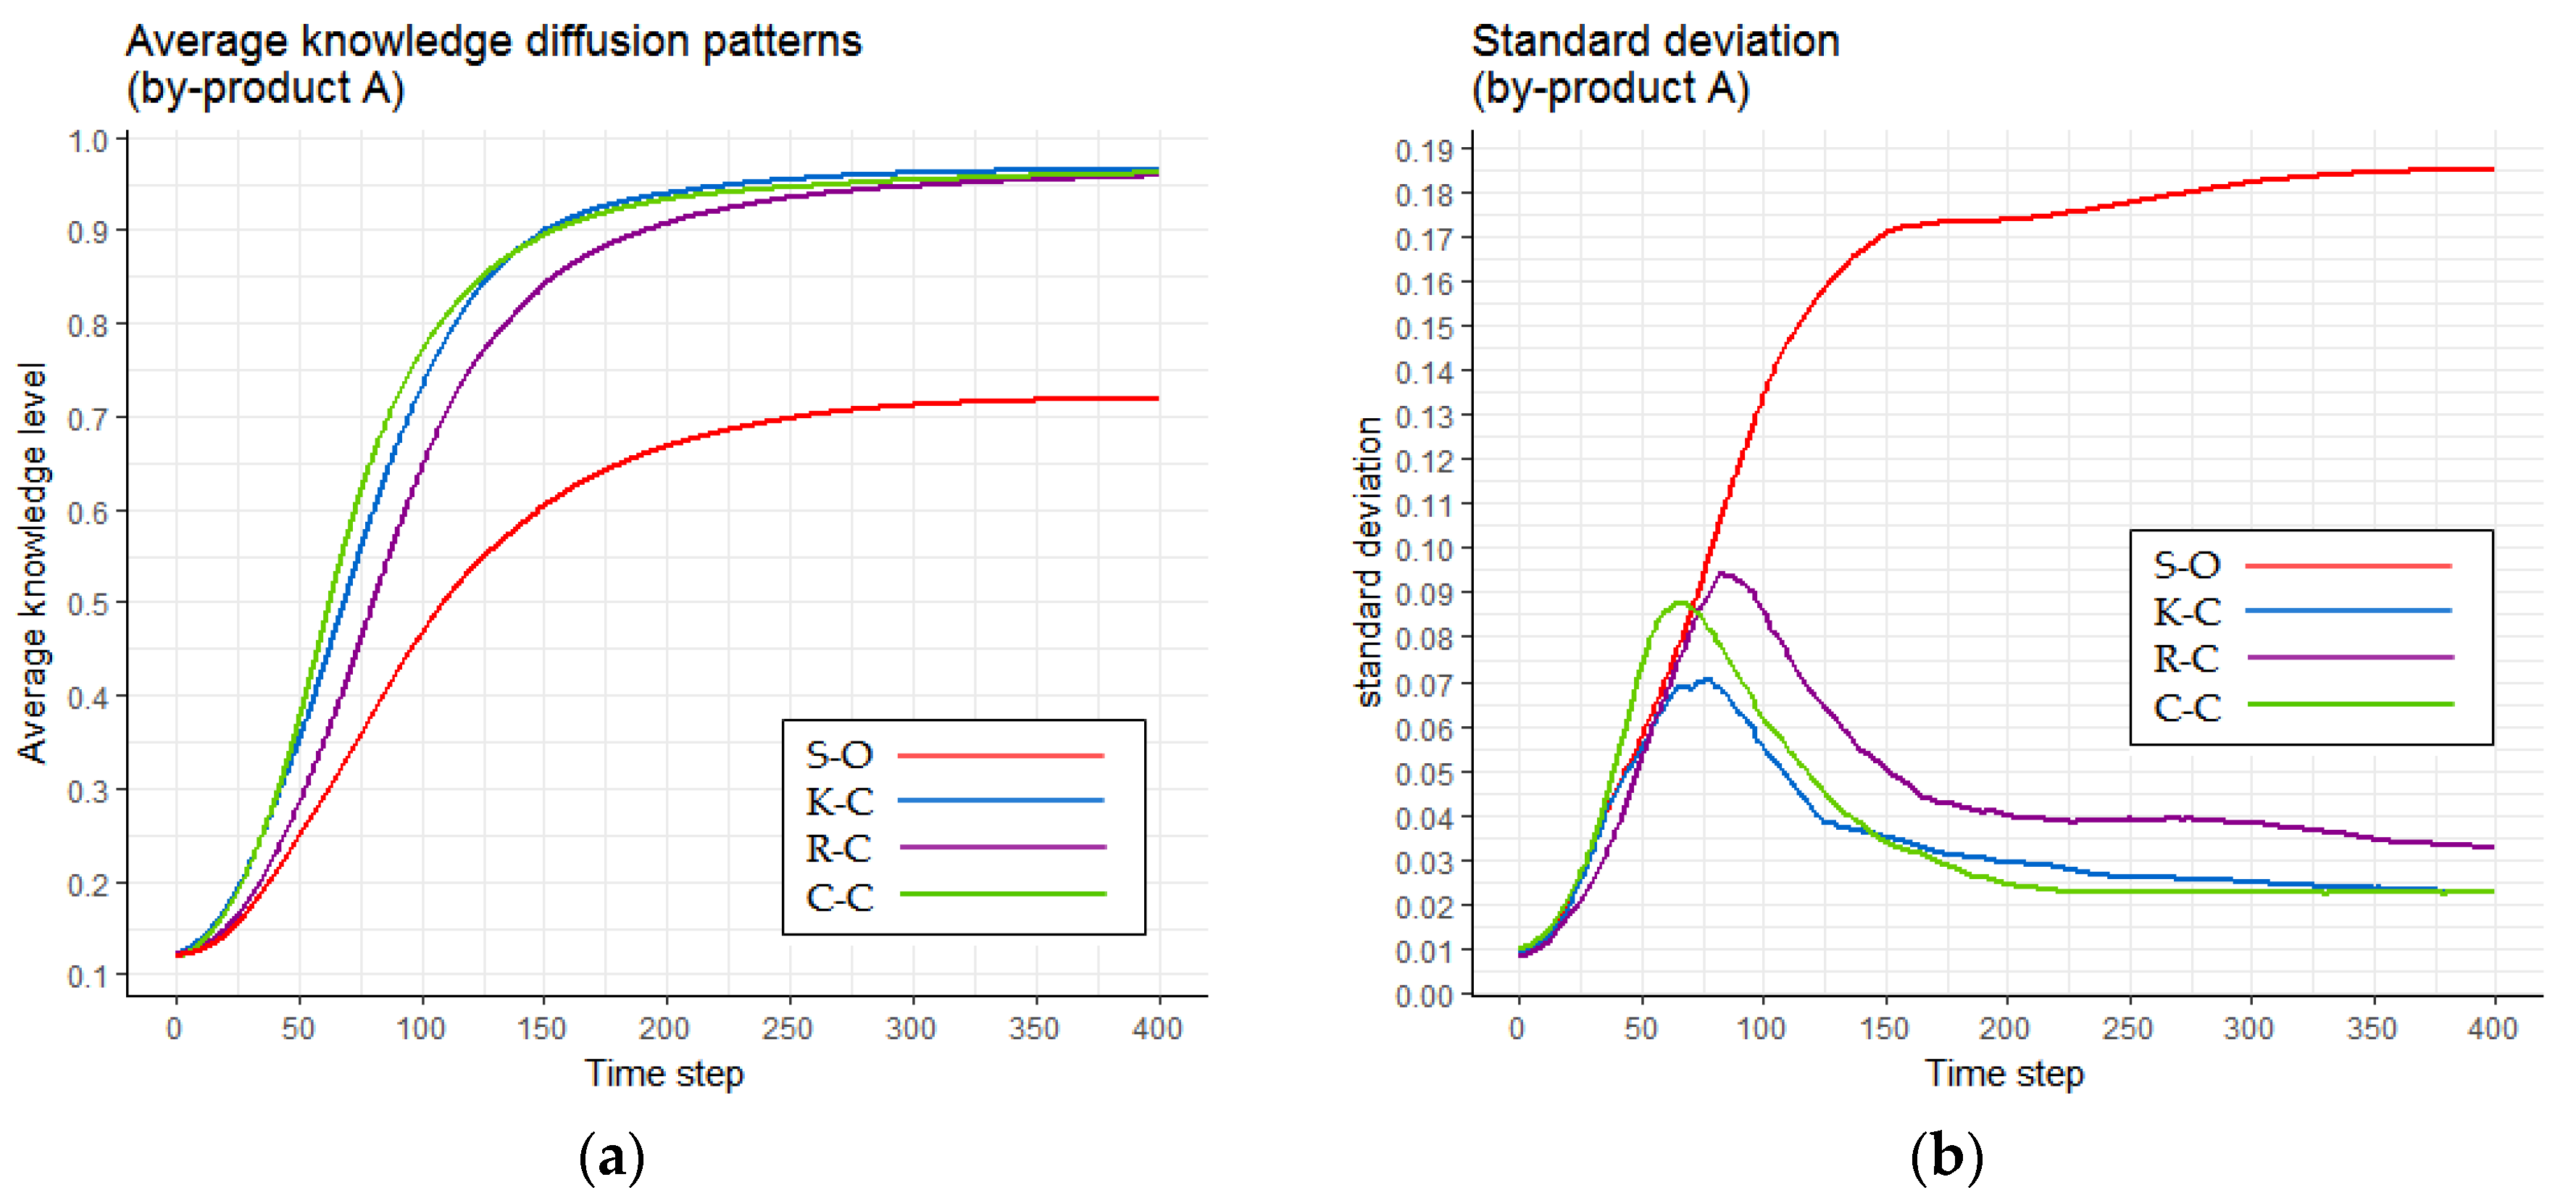
We consider the growth of average knowledge level of firms towards certain IS solutions as a reflection of knowledge diffusion. According to the designed interaction mechanism and the initial settings, with the two diffused IS solutions having similar mechanisms of knowledge transformation, their knowledge diffusion will not be very different under the same simulated strategies. Therefore we can just investigate the knowledge diffusion of IS solution about A , compare the mean values of k i A of all the type I and type II firm agents, and draw the results as in Figure 8. Given a rate of promotion p p r o = 40 % , the performance of the S-O, K-C, R-C and C-C strategies, including the average knowledge level (Figure 8a) and the standard deviation (Figure 8b) of the simulation outcomes, were compared.
Firstly, as we can see in Figure 8a, if promoted by K-C, R-C or C-C, the average knowledge level increases faster and can eventually reach a much higher saturation level compared with the spontaneous strategy (S-O). The results of S-O also show a higher level of uncertainty or dispersion than those of the promoting strategies, because the standard deviation in S-O is much higher and consistently increases during the simulation process (Figure 8b).
Secondly, we further compared the performances of the three promoting strategies. It could be concluded that, under the current settings, the strategies that have employed the measure of knowledge coordination (including K-C and C-C) perform better in knowledge diffusion. As shown in Figure 8a, the average knowledge level grows faster under K-C and C-C, even though it eventually reaches the same saturation level compared with the R-C strategy. On the other hand, the performance of C-C (green line) also indicated that the enhancement brought by the combined use of K-C and R-C strategies seems slim under current conditions. Moreover, the standard deviation curves of the results under the three promoting strategies show trends which are quite similar to each other.

5.1.2. Diffusion of Positive Attitudes

For the analysis of attitude diffusion, we compared the performances of the different strategies based on their influence on two different IS solutions, given a rate of promotion p p r o = 40 % . We set the weights of external influence as β A = 0.3 and β B = 0.5 , which reflects how much the firms depend on the opinions of their peers when they make decisions about their attitude towards these two available IS solutions. Based on the initial settings of the simulation, there are 100 potential adopters for each IS solution. The increasing number of firms which become interested in the IS solutions indicates the diffusion process of positive attitudes among firms.
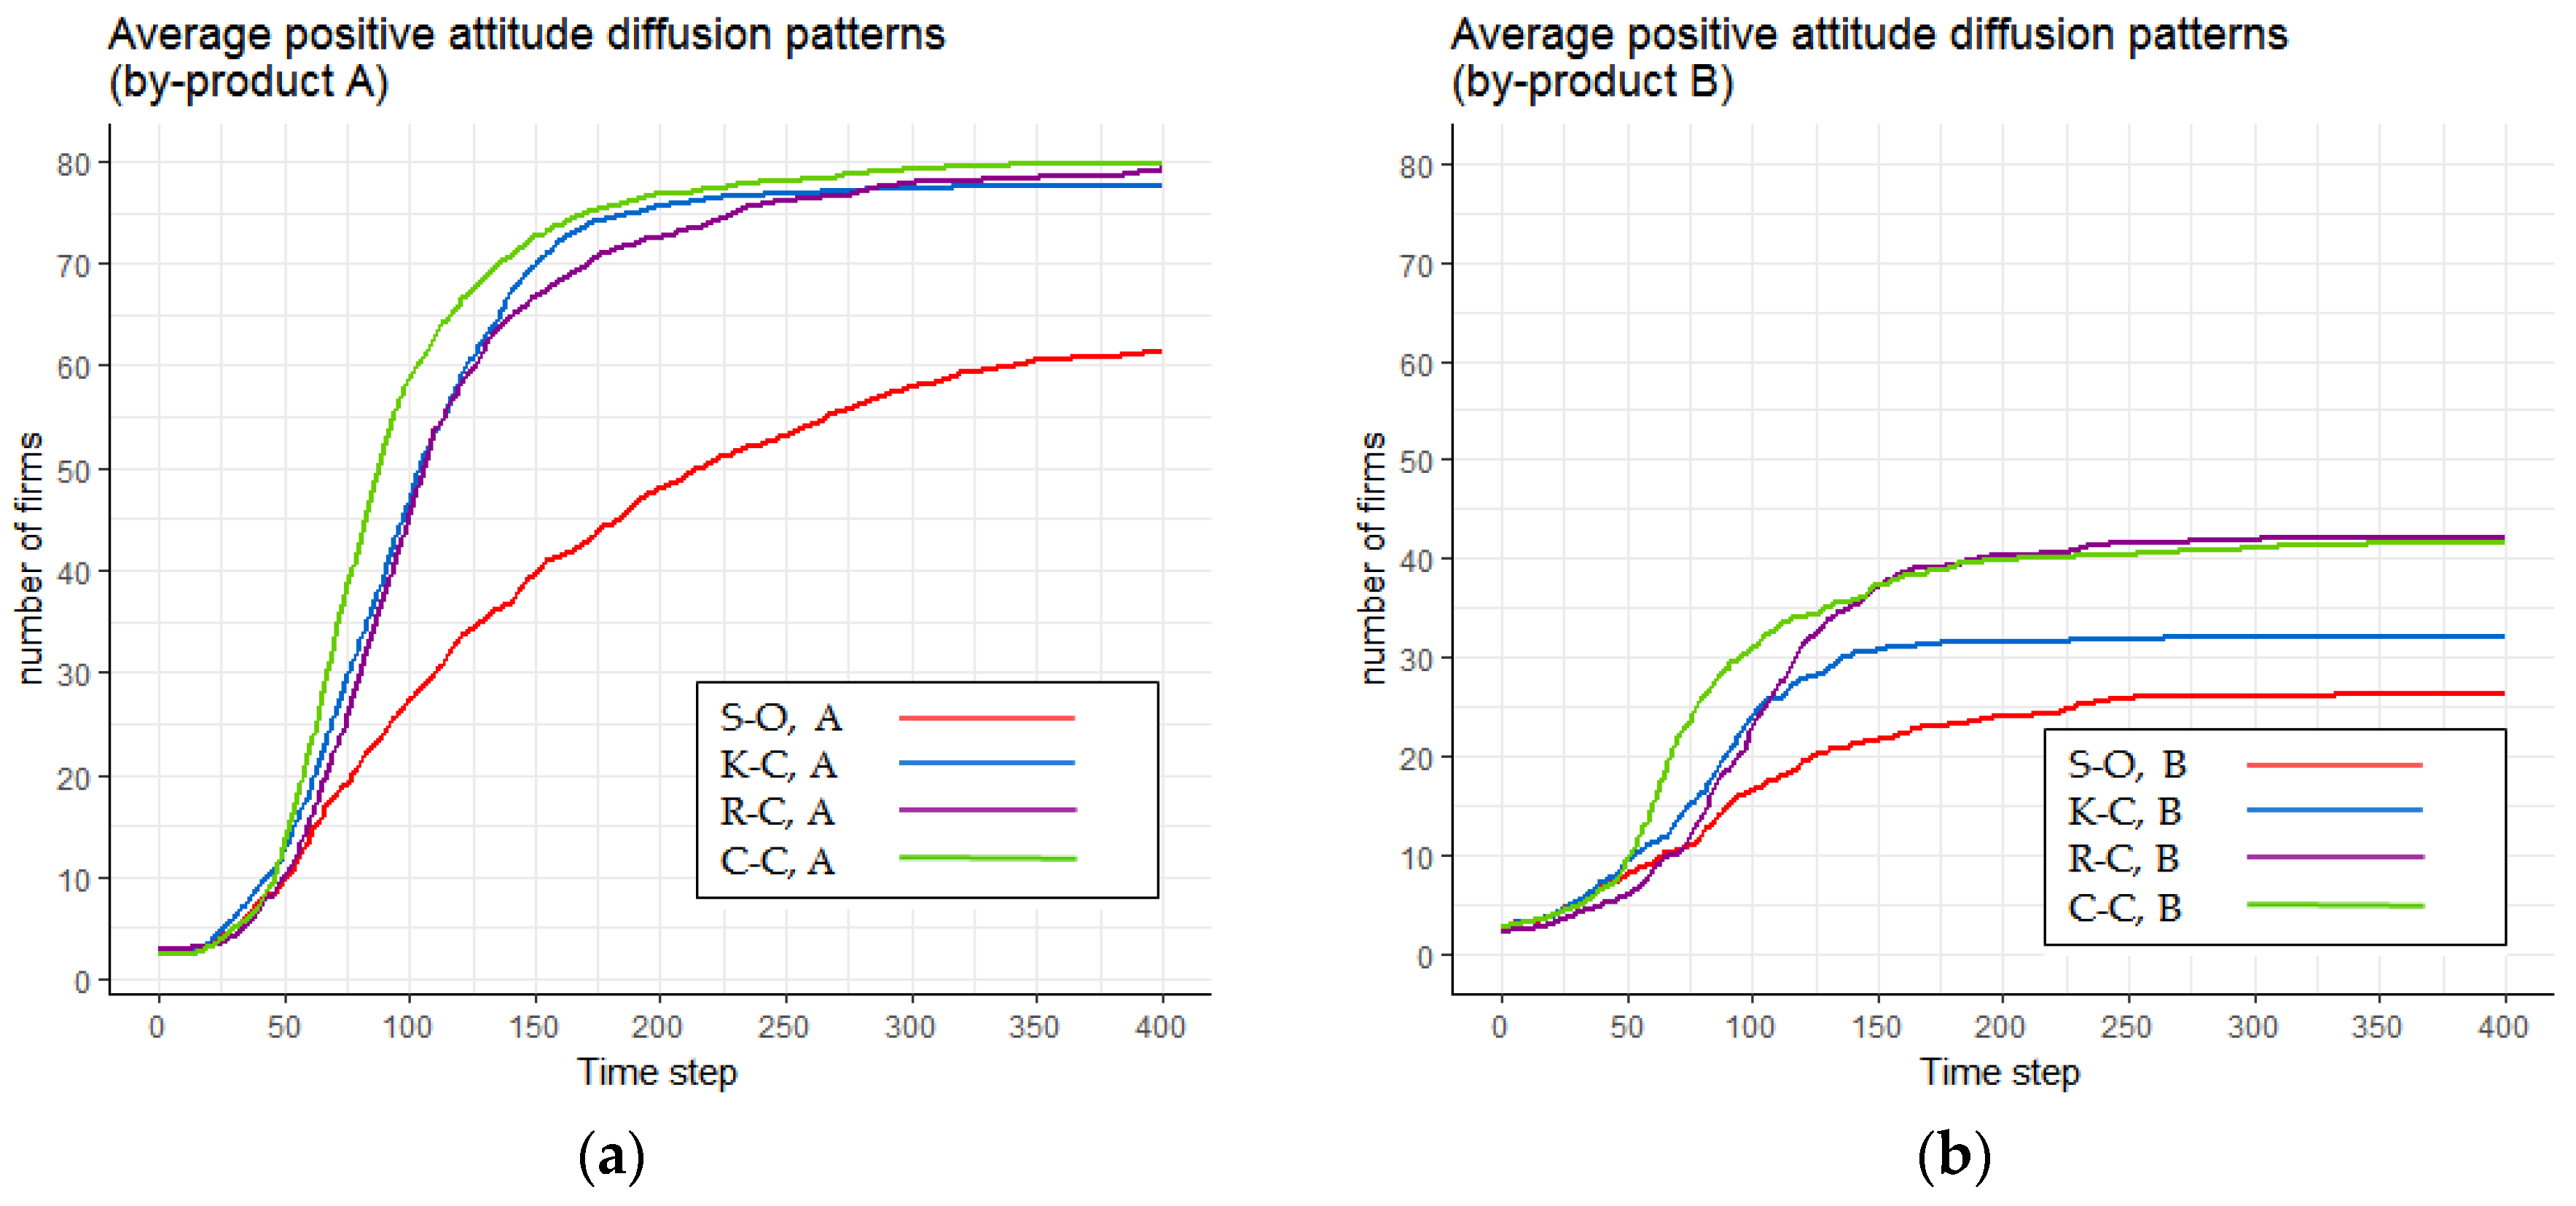
Figure 9 shows the simulation results under the strategies of S-O, K-C, R-C, C-C. We can see that, none of the strategies were successful in spreading the positive attitudes to all the potential adopters, since the firms’ decision-making is more or less dependent on their peers’ opinion as well as their own level of innovativeness (represented by adopter categories). In addition, we observed the significant influence of the weight of external influence ( β A and β B ) on the diffusion of positive attitudes. We also observed the significance of the weight of external influence ( β A and β B ) on the diffusion of positive attitudes. In general, under the same conditions (e.g., strategies), the positive attitudes towards the solution of by-product A could be adopted by more firms than that of by-product B .
Figure 9a,b shows results that seem very similar to those of knowledge diffusion (see Figure 8a), where the diffusion of positive attitudes towards both IS solutions could be largely improved by the promoting strategies. Figure 9a shows that for the IS solution of by-product A , the positive attitude diffusion patterns under different promoting strategies eventually reach a similar saturation, although with slightly different speeds. While considering the IS solution of by-product B , where the adoption decision is more dependent on peers’ opinions, the R-C and C-C strategies show significant advantages compared with K-C (see Figure 9b)—the attitude diffusion reaches a higher saturation level under R-C than K-C, and the combined use of the two strategies (C-C) can make the process reach the saturation level faster.

5.2. Sensitivity Analysis: The Influence of Rate of Promotion (ppro)

In order to validate how changes in input parameters could alter the simulation results, it was necessary to conduct a sensitivity analysis. The p p r o parameter describes the proportion of firm agents it could reach to exert influence (see Table 3), reflecting the mobilization capacity provided by the promoter (discussed in Section 2.2 and Section 3.1). Table 6 shows the different scenarios examined in the sensitivity analysis, with different values of p p r o (30%, 40%, and 50%) and the different promoting strategies.
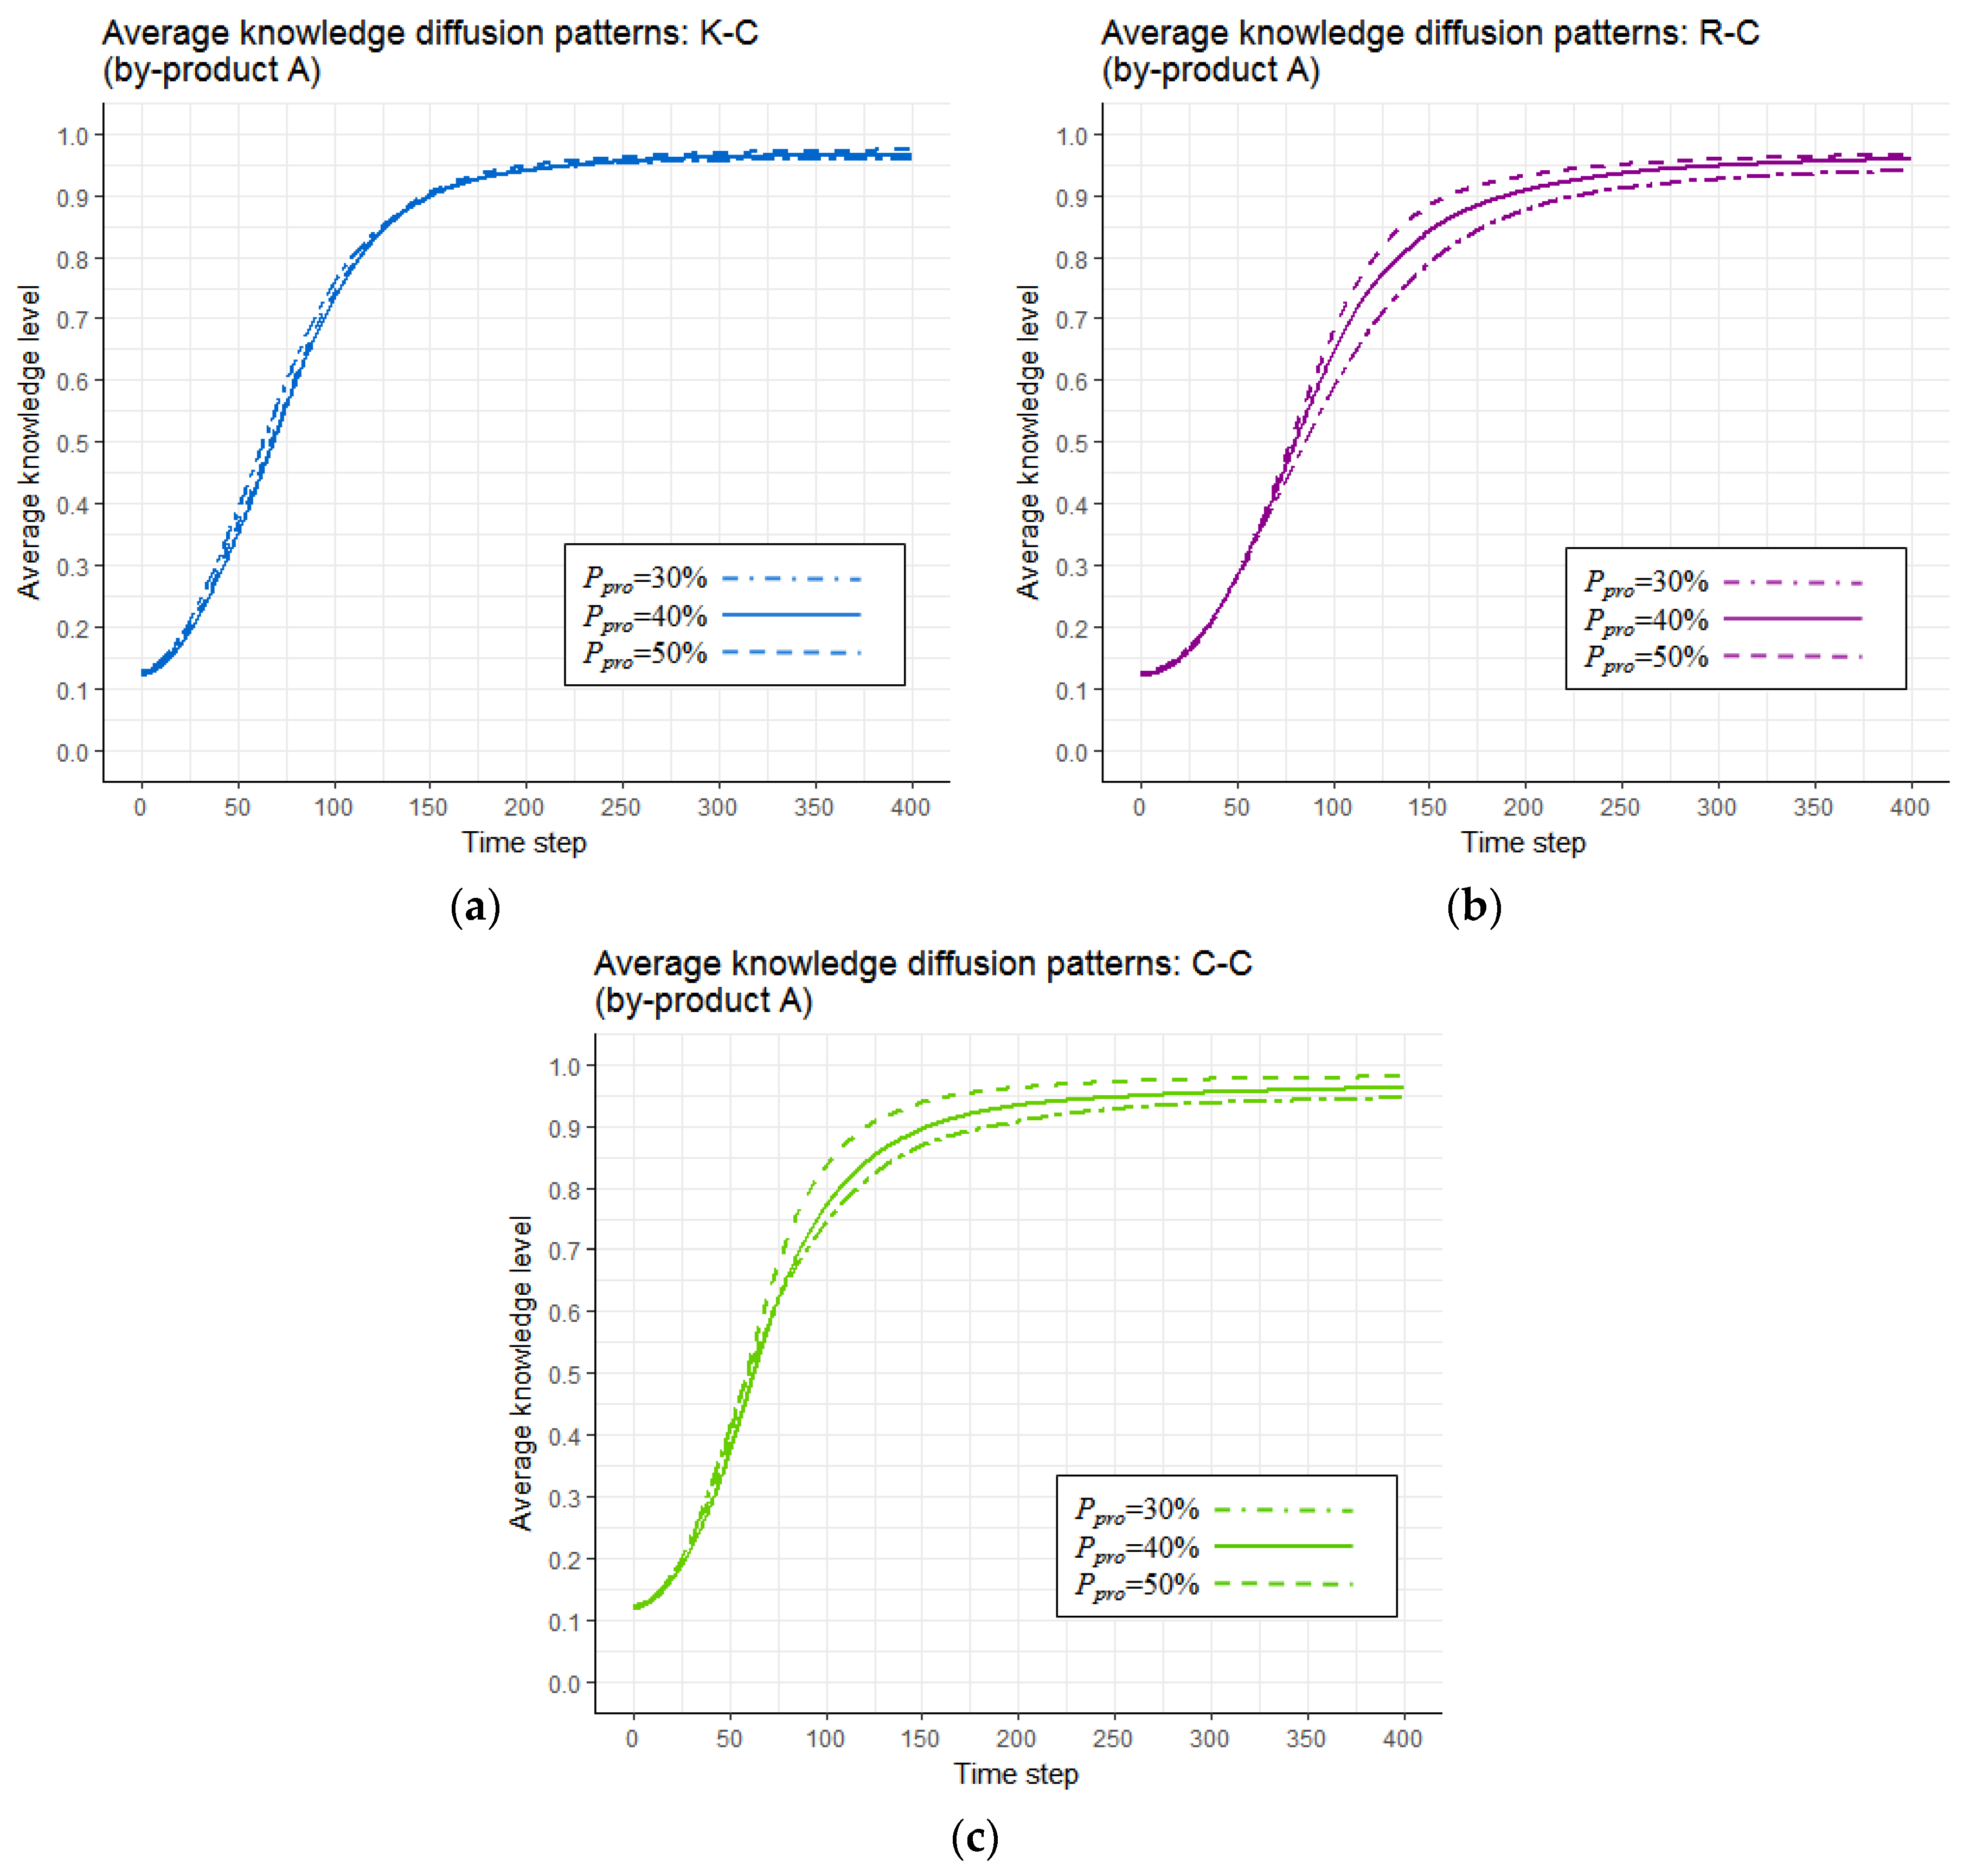
Figure 10 presents the patterns of knowledge diffusion under different values of p p r o . It shows that the changes in values of p p r o do have an effect on the performance of R-C and C-C strategies (see Figure 10b,c respectively). The increase of p p r o speeds up the knowledge diffusion process and also improves the saturation level of knowledge that eventually could be achieved. However, Figure 10a shows a negligible effect of the increase of p p r o on the performance of K-C.
Then, we investigate the diffusion of positive attitudes, which reflects the identification or discovery of the IS opportunity sets. Considering the attitude diffusion of two IS synergies, one reflects a simpler IS solution (of by-product A with β A = 0.3 ) and the other reflects a much more complex solution (of by-product B with β B = 0.5 ).
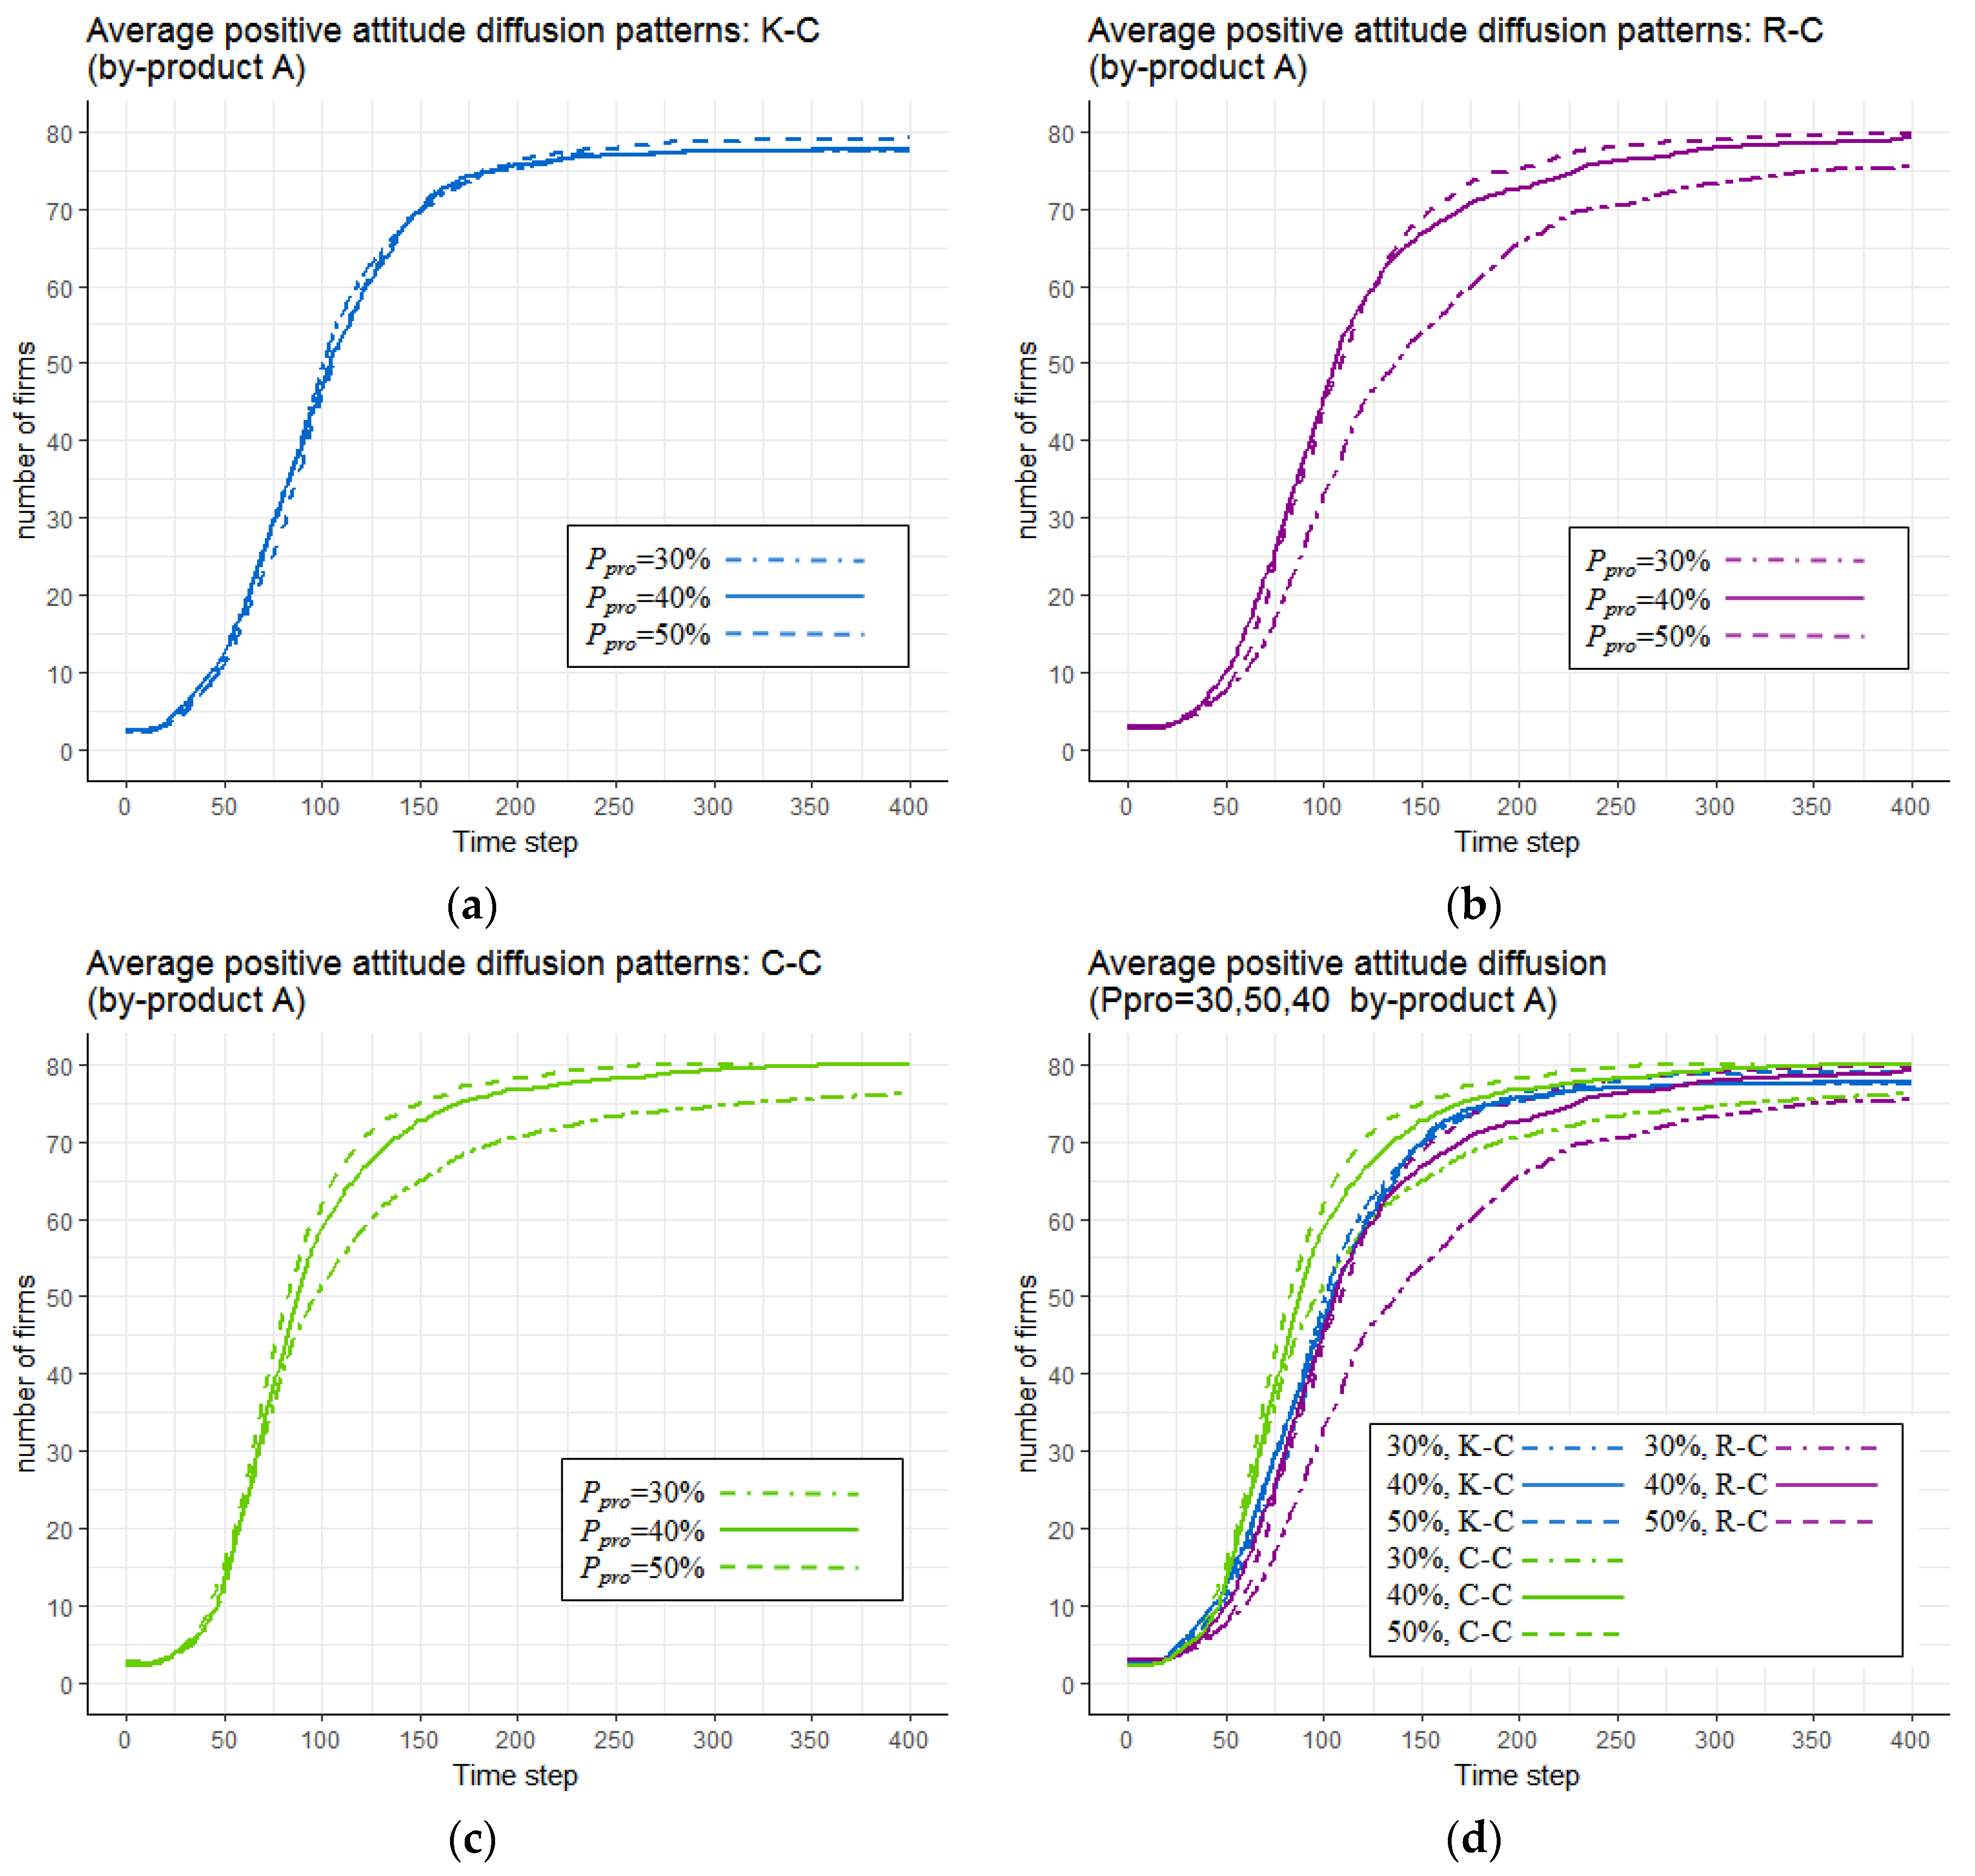
Figure 11 shows the performance of different strategies on the diffusion of positive attitudes towards the IS solution of by-product A . It shows that increased p p r o could improve the performance of R-C (see Figure 11b) and C-C (see Figure 11c); however, it had very little impact on the performance of K-C (see Figure 11a). Figure 11d further shows the cross comparison, indicating that given a lower value of p p r o (30%), K-C might be the better strategy to promote the diffusion of positive attitudes, rather than either of the other two strategies. However, with increasing p p r o (40%, 50%), the performance of R-C starts to improve and becomes very close to that of K-C. In addition, the performance of C-C, which is the combined use of K-C and R-C, shows a significant improvement with the increase of p p r o .
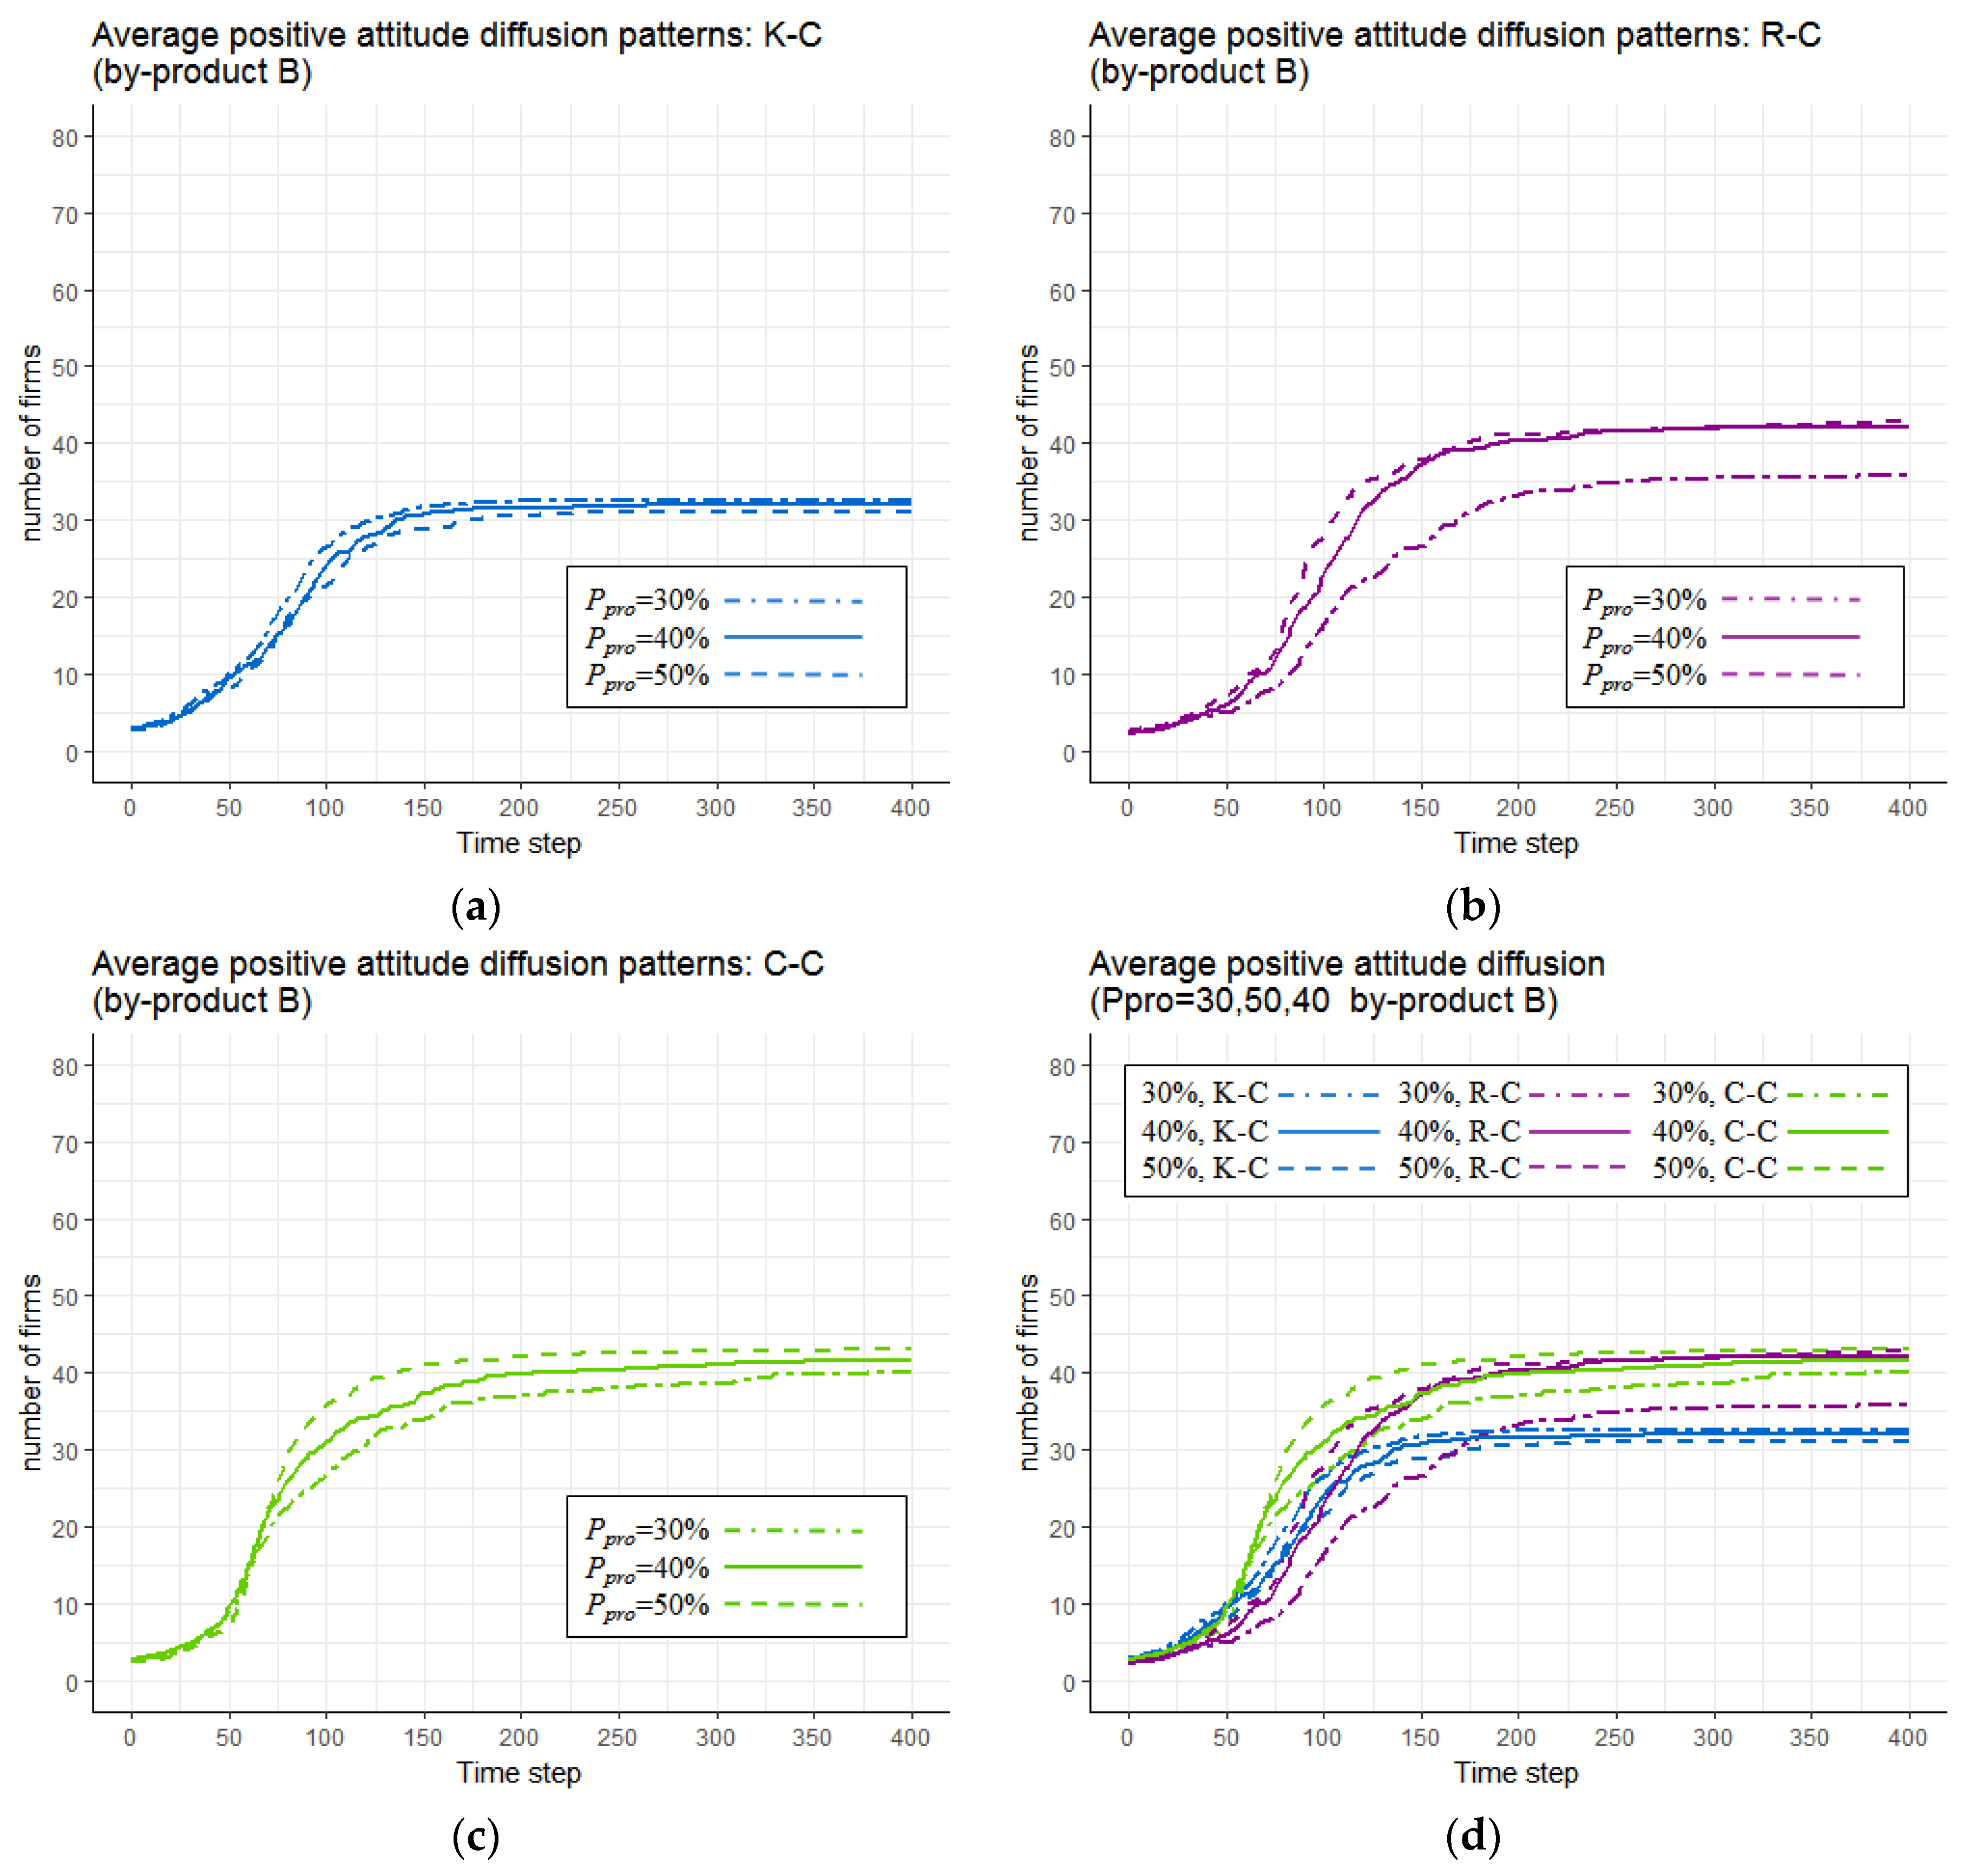
In the case of positive attitudes diffusion towards the IS solution of by-product B , the increase of p p r o improved the performance of all the three promoting strategies (see Figure 12). However, the effect of p p r o was more pronounced in R-C and C-C (see Figure 12b,c), while in K-C the enhancement of performance brought by the increase of p p r o seems very limited (see Figure 12a). Figure 11d also indicates that R-C is a more promising strategy to promote the diffusion of positive attitudes towards the IS solution of by-product B , compared with K-C, because it could achieve a higher saturation level, even with a lower p p r o (30%). Additionally, compared with R-C, the employment of C-C could speed up the diffusion process of positive attitudes.

5.3. Discussion of Results

In this model, the knowledge/attitude diffusion process of the IS solutions leads to the identification of potential IS opportunities, and gradually emerges with or without the intervention by a promoter agent through strategies that enhance institutional capacity building. It can be concluded that, although the K-C does have a positive impact on promoting knowledge and attitude diffusion, its performance could only be slightly further enhanced through the increase of p p r o . K-C is only shown to be an effective strategy for the attitude diffusion of the simpler IS solution (i.e., about by-product A ), given the limited mobilization capacity (i.e., p p r o = 30%) provided by the promoting agency.
The advantage of R-C is mainly manifested in the diffusion of positive attitudes towards a more complex solution (e.g., about by-product B ) with relatively high uncertainty and associated risk, and the increase of p p r o could largely enhance the performance of R-C. We could therefore say that, through R-C, the promoter gathers the firms together to establish a community where the firms become interconnected gradually and more dependent on the opinions of each other. Additionally, the increase of p p r o enlarges the size of this community and further magnifies firms’ perceptions of positive attitudes. The simulation results also show that the C-C strategy—combined use of K-C and R-C—could achieve better improved diffusion of positive attitudes than solely applying K-C or R-C, especially given sufficient mobilization capacity (i.e., p p r o = 40%, 50%). However, we should consider the cost of conducting both K-C and R-C at the same time in reality.
Given a complex real-world phenomenon such as the emergence process of IS, which is difficult to perfectly replicate from place to place, it is impractical to conduct repeated experiments in the real world to obtain optimal decisions. However, the ABM approach provides a practical tool for addressing real-world problems with computational simulation experiments [38]. As discussed above, the proposed ABM could be applied as a testbed for scenario analysis and strategy evaluation in the contexts of IS knowledge and attitude diffusion (or the identification of IS opportunities). The simulated scenarios in this ABM are simplified to focus on the performance of promotion strategies conducted through enhanced institutional capacity building. Aiming to evaluate strategies and provide recommendations that promote the emergence of IS, the proposed ABM is suitable for the investigation of realistic cases involving large EIPs as well as the industrial clusters in eco-transformation. Given the certain scale of large EIPs and industrial clusters, the role of the promoter becomes even more necessary to conduct knowledge and relationship coordination to accelerate the spread of knowledge and positive attitude in the heterogeneous systems involving diverse industries.

6. Conclusions and Future Research

This paper investigates the performance of different strategies to promote the identification of opportunity sets for IS synergies. Considering that IS as a systemic eco-innovation, we incorporated the theoretical perspective of DoI into the research framework of IS development, gained an understanding of the actions and interactions of firms based on the innovation-decision process, and designed an ABM to conduct simulations on the diffusion of IS knowledge/attitudes.
Two strategies that correspond with the enhancement of knowledge capacity (knowledge coordination strategy) and relationship capacity (relationship coordination strategy) were investigated in the simulation. Additionally, a sensitivity analysis using the parameter p p r o , which provided an indication of the mobilization capacity of a promoting agency, was conducted. The results confirmed that the implementation of promoting strategies, independently or simultaneously, will largely promote the identification of IS opportunities (reflected by the diffusion of positive attitudes towards certain IS solutions). In addition, the mobilization capacity of a promoting agency (reflected by p p r o ) has a positive impact on the performance of promoting strategies. Our results prove that our model is an effective testbed for scenario analysis and strategy evaluation in the context of the identification of IS opportunities, and the results have implications for the IS promoting agencies (e.g., central planners in the planned IS/EIPs, or facilitators in the facilitated IS/EIPs) to choose their strategy or design a combination of strategies in a given context.
At the current stage of the model, our approach presents some limitations that arise from the assumptions made in the model design, including:
(1)
The current model focuses on the identification of IS opportunity sets, and does not analyze the matching-making and decision-making processes that lead to IS implementation.
(2)
The current model does not take external environmental conditions into consideration; for example, policy pressure, regulation and environmental subsidies.
(3)
The cestimated industrial system basically consists of three types of firms and two feasible IS synergies. The diversity presented in the model is very low compared with that of industrial systems in the real world.
(4)
The current model is based on a relatively static community structure, where neither the entry/exit of firms nor the break of inter-agent relationships is considered.
Our future research will focus not only the identification of opportunity sets, but also on firms’ decision-making based on their own economic interests. It will be necessary to look at the decision-making and IS implementation processes, and investigate how the elements of institutional capacity stimulate the implementation of IS synergies identified in the opportunity sets, for example, through reducing the transaction cost for symbiotic exchanges [17].

Acknowledgments

The authors are grateful for the expert comments from three anonymous reviewers and the kind help of the editor. Meanwhile, Kaifang Zheng would also like to thank Frank Schiller for enlightening the research idea, Liyin Shen for his helpful comments on paper writing, Qi Qi for her useful discussions when we were revising our manuscript, and Mingwei Li and Shuangzhe Wang for proofreading our final manuscript.

Author Contributions

Kaifang Zheng designed the method and the model, conducted the simulation experiments and wrote the article. Suling Jia supervised the proposed research and modified this article. All the authors have read and approved the final manuscript.

Conflicts of Interest

The authors declare no conflict of interest.

Abbreviations

The following abbreviations are used in this manuscript (in alphabetical order)
ABMAgent-Based Models/Modeling
ABMSAgent-Based Modeling and Simulation
DoIDiffusion of Innovations
EIPEco-industrial Park
GSCMGreen Supply Chain Management
ICTInformation and Communication Technologies
ISIndustrial Symbiosis
OECDOrganization for Economic Cooperation and Development
TEDATianjin Economic-technological Development Area
UMLUnified Modeling Language

References

  1. Ehrenfeld, J.; Gertler, N. Industrial Ecology in Practice: The Evolution of Interdependence at Kalundborg. J. Ind. Ecol. 1997, 1, 67–79. [Google Scholar] [CrossRef]
  2. Chertow, M.R. INDUSTRIAL SYMBIOSIS: Literature and Taxonomy. Annu. Rev. Energy Environ. 2000, 25, 313–337. [Google Scholar] [CrossRef]
  3. Chertow, M.R.; Ashton, W.; Espinosa, J. Industrial Symbiosis in Puerto Rico: Environmentally Related Agglomeration Economies. Reg. Stud. 2008, 42, 1299–1312. [Google Scholar] [CrossRef]
  4. Massard, G.; Jacquat, O.; Wagner, L.; Zürcher, D. International Survey on Eco-Innovation Parks: Learnings from Experiences on the Spatial Dimension of Eco-Innovation; Federal Office for the Environment FOEN, ERA-NET ECO-INNOVERA: Geneva, Switzerland, 2014. [Google Scholar]
  5. Boons, F.; Spekkink, W.; Mouzakitis, Y. The dynamics of industrial symbiosis: A proposal for a conceptual framework based upon a comprehensive literature review. J. Clean. Prod. 2011, 19, 905–911. [Google Scholar] [CrossRef]
  6. Heeres, R.; Vermeulen, W.J.V.; de Dewalle, F. Eco-industrial park initiatives in the USA and the Netherlands: first lessons. J. Clean. Prod. 2004, 12, 985–995. [Google Scholar] [CrossRef]
  7. Gibbs, D. Trust and networking in inter-firm relations: The case of eco-industrial development. Local Econ. 2003, 18, 222–236. [Google Scholar] [CrossRef]
  8. Boons, F.; Baas, L.W. Types of industrial ecology: The problem of coordination. J. Clean. Prod. 1997, 5, 79–86. [Google Scholar] [CrossRef]
  9. Baas, L.W.; Boons, F. An industrial ecology project in practice: Exploring the boundaries of decision-making levels in regional industrial systems. J. Clean. Prod. 2004, 12, 1073–1085. [Google Scholar] [CrossRef]
  10. Lambert, A.; Boons, F. Eco-industrial parks: Stimulating sustainable development in mixed industrial parks. Technovation 2002, 22, 471–484. [Google Scholar] [CrossRef]
  11. Korhonen, J.; Snäkin, J.-P. Analysing the evolution of industrial ecosystems: Concepts and application. Ecol. Econ. 2005, 52, 169–186. [Google Scholar] [CrossRef]
  12. Ashton, W. Understanding the Organization of Industrial Ecosystems: A social network approach. J. Ind. Ecol. 2008, 12, 34–51. [Google Scholar] [CrossRef]
  13. Gibbs, D.; Deutz, P. Reflections on implementing industrial ecology through eco-industrial park development. J. Clean. Prod. 2007, 15, 1683–1695. [Google Scholar] [CrossRef]
  14. Mirata, M.; Emtairah, T. Industrial symbiosis networks and the contribution to environmental innovation: The case of the Landskrona industrial symbiosis programme. J. Clean. Prod. 2005, 13, 993–1002. [Google Scholar] [CrossRef]
  15. Paquin, R.L.; Howard-Grenville, J.A. Facilitating Regional Industrial Symbiosis: Network Growth in the UK’s National Industrial Symbiosis Programme. In The Social Embeddedness of Industrial Ecology; Boons, F., Howard-Grenville, J.A., Eds.; Edward Elgar Publishing: Northampton, UK, 2009; pp. 103–128. [Google Scholar]
  16. Boons, F.; Howard-Grenville, J.A. Introducing the social embeddedness of industrial ecology. In The Social Embeddedness of Industrial Ecology; Boons, F., Howard-Grenville, J.A., Eds.; Edward Edgar: Cheltenham, UK, 2009; pp. 3–27. [Google Scholar]
  17. Boons, F.; Spekkink, W. Levels of Institutional Capacity and Actor Expectations about Industrial Symbiosis. J. Ind. Ecol. 2012, 16, 61–69. [Google Scholar] [CrossRef]
  18. Boons, F. Connecting levels: A systems view on stakeholder dialogue for sustainability. Prog. Ind. Ecol. Int. J. 2004, 1, 385–396. [Google Scholar] [CrossRef]
  19. Andrews, C.J. Building a Micro Foundation for Industrial Ecology. J. Ind. Ecol. 2001, 4, 35–51. [Google Scholar] [CrossRef]
  20. Yu, C.; De Jong, M.; Dijkema, G.P.J. Process analysis of eco-industrial park development—The case of Tianjin, China. J. Clean. Prod. 2014, 64, 464–477. [Google Scholar] [CrossRef]
  21. Romero, E.; Ruiz, M.C. Proposal of an agent-based analytical model to convert industrial areas in industrial eco-systems. Sci. Total Environ. 2014, 468–469, 394–405. [Google Scholar] [CrossRef] [PubMed]
  22. Rogers, E.M. Diffusion of Innovations, 5th ed.; The Free Press, A Division of Simon & Schuster, Inc.: New York, NY, USA, 2003. [Google Scholar]
  23. Rennings, K. Redefining innovation—Eco-innovation research and the contribution from ecological economics. Ecol. Econ. 2000, 32, 319–332. [Google Scholar] [CrossRef]
  24. Aquilani, B.; Silvestri, C.; Ioppolo, G.; Ruggieri, A. The challenging transition to bio-economies: Towards a new framework integrating corporate sustainability and value co-creation. J. Clean. Prod. 2017. forthcoming. [Google Scholar] [CrossRef]
  25. OECD. OECD Project on Green Growth & Eco-innovation: Nominate Examples of “Radical and Systemic” Eco-Innovation. Available online: http://www.oecd.org/science/inno/45169190.pdf (accessed on 20 March 2016).
  26. Zhu, Q.; Sarkis, J.; Lai, K.-H. Green supply chain management innovation diffusion and its relationship to organizational improvement: An ecological modernization perspective. J. Eng. Technol. Manag. 2012, 29, 168–185. [Google Scholar] [CrossRef]
  27. Zhu, Q.; Tian, Y.; Sarkis, J. Diffusion of selected green supply chain management practices: An assessment of Chinese enterprises. Prod. Plan. Control 2012, 23, 837–850. [Google Scholar] [CrossRef]
  28. Paquin, R.L.; Howard-Grenville, J.A. The Evolution of Facilitated Industrial Symbiosis. J. Ind. Ecol. 2012, 16, 83–93. [Google Scholar] [CrossRef]
  29. Ghali, M.R.; Frayret, J.-M.; Robert, J.-M. Green social networking: Concept and Potential Applications to Initiate Industrial Synergies. J. Clean. Prod. 2015, 115, 23–35. [Google Scholar] [CrossRef]
  30. Chertow, M.R. “Uncovering” Industrial Symbiosis. J. Ind. Ecol. 2007, 11, 11–30. [Google Scholar] [CrossRef]
  31. Costa, I.; Ferrão, P.C. A case study of industrial symbiosis development using a middle-out approach. J. Clean. Prod. 2010, 18, 984–992. [Google Scholar] [CrossRef]
  32. Wang, Q. Knowledge Transfer to Facilitate Industrial Symbiosis: A Case Study of UK-China Collaborators. Ph.D. Thesis, University of Hull, Hull, UK, 2013. [Google Scholar]
  33. Aid, G.; Brandt, N.; Lysenkova, M.; Smedberg, N. Looplocal—A heuristic visualization tool to support the strategic facilitation of industrial symbiosis. J. Clean. Prod. 2015, 98, 328–335. [Google Scholar] [CrossRef]
  34. Hatefipour, S. Facilitation of Industrial Symbiosis Development in a Swedish Region. Ph.D. Thesis, Linköping University, Linköping, Sweden, 2012. [Google Scholar]
  35. Boons, F.; Spekkink, W.; Jiao, W. A Process Perspective on Industrial Symbiosis. J. Ind. Ecol. 2014, 18, 341–355. [Google Scholar] [CrossRef]
  36. Dijkema, G.; Basson, L. Complexity and industrial ecology: Foundations for a Transformation from Analysis to Action. J. Ind. Ecol. 2009, 13, 157–164. [Google Scholar] [CrossRef]
  37. Kiesling, E.; Günther, M.; Stummer, C.; Wakolbinger, L.M. Agent-based simulation of innovation diffusion: A review. Cent. Eur. J. Oper. Res. 2012, 20, 183–230. [Google Scholar] [CrossRef]
  38. Axtell, R.L.; Andrews, C.J.; Small, M.J. Agent-Based Modeling and Industrial Ecology. J. Ind. Ecol. 2001, 5, 10–13. [Google Scholar] [CrossRef]
  39. Janssen, M.A. Agent-Based Analysis of Dynamic Industrial Ecosystems: An Introduction. In Changing Stocks, Flows and Behaviors in Industrial Ecosystems; Ruth, M., Davidsdottir, B., Eds.; Edward Elgar Publishing: Cheltenham, UK, 2008; pp. 157–162. [Google Scholar]
  40. Von Malmborg, F. Networking for knowledge transfer: Towards an understanding of local authority roles in regional industrial ecosystem management. Bus. Strateg. Environ. 2004, 13, 334–346. [Google Scholar] [CrossRef]
  41. Taddeo, R.; Simboli, A.; Ioppolo, G.; Morgante, A. Industrial Symbiosis, Networking and Innovation: The Potential Role of Innovation Poles. Sustainability 2017, 9, 169. [Google Scholar] [CrossRef]
  42. Ioppolo, G.; Cucurachi, S.; Salomone, R.; Saija, G.; Shi, L. Sustainable Local Development and Environmental Governance: A Strategic Planning Experience. Sustainability 2016, 8, 180. [Google Scholar] [CrossRef]
  43. Watts, D.J.; Strogatz, S.H. Collective dynamics of “small-world” networks. Nature 1998, 393, 440–442. [Google Scholar] [CrossRef] [PubMed]
  44. Baum, J.A.C.; Shipilov, A.V.; Rowley, T.J. Where do small worlds come from? Ind. Corp. Chang. 2003, 12, 697–725. [Google Scholar] [CrossRef]
  45. Uzzi, B.; Amaral, L.A.; Reed-Tsochas, F. Small-world networks and management science research: A review. Eur. Manag. Rev. 2007, 4, 77–91. [Google Scholar] [CrossRef]
  46. Watts, D.J. The “New” Science of Networks. Annu. Rev. Sociol. 2004, 30, 243–270. [Google Scholar] [CrossRef]
  47. Cowan, R. Network models of innovation and knowledge diffusion. In Clusters, Networks, and Innovation; Bresch, S., Malerba, F., Eds.; Oxford University Press: Oxford, UK, 2005; pp. 29–53. [Google Scholar]
  48. Cowan, R.; Jonard, N.; Özman, M. Knowledge dynamics in a network industry. Technol. Forecast. Soc. Chang. 2004, 71, 469–484. [Google Scholar] [CrossRef]
  49. Valente, T.W. Social network thresholds in the diffusion of innovations. Soc. Netw. 1996, 18, 69–89. [Google Scholar] [CrossRef]
  50. Wilensky, U. Netlogo 1999. Available online: http://ccl.northwestern.edu/netlogo/ (accessed on 11 May 2016).
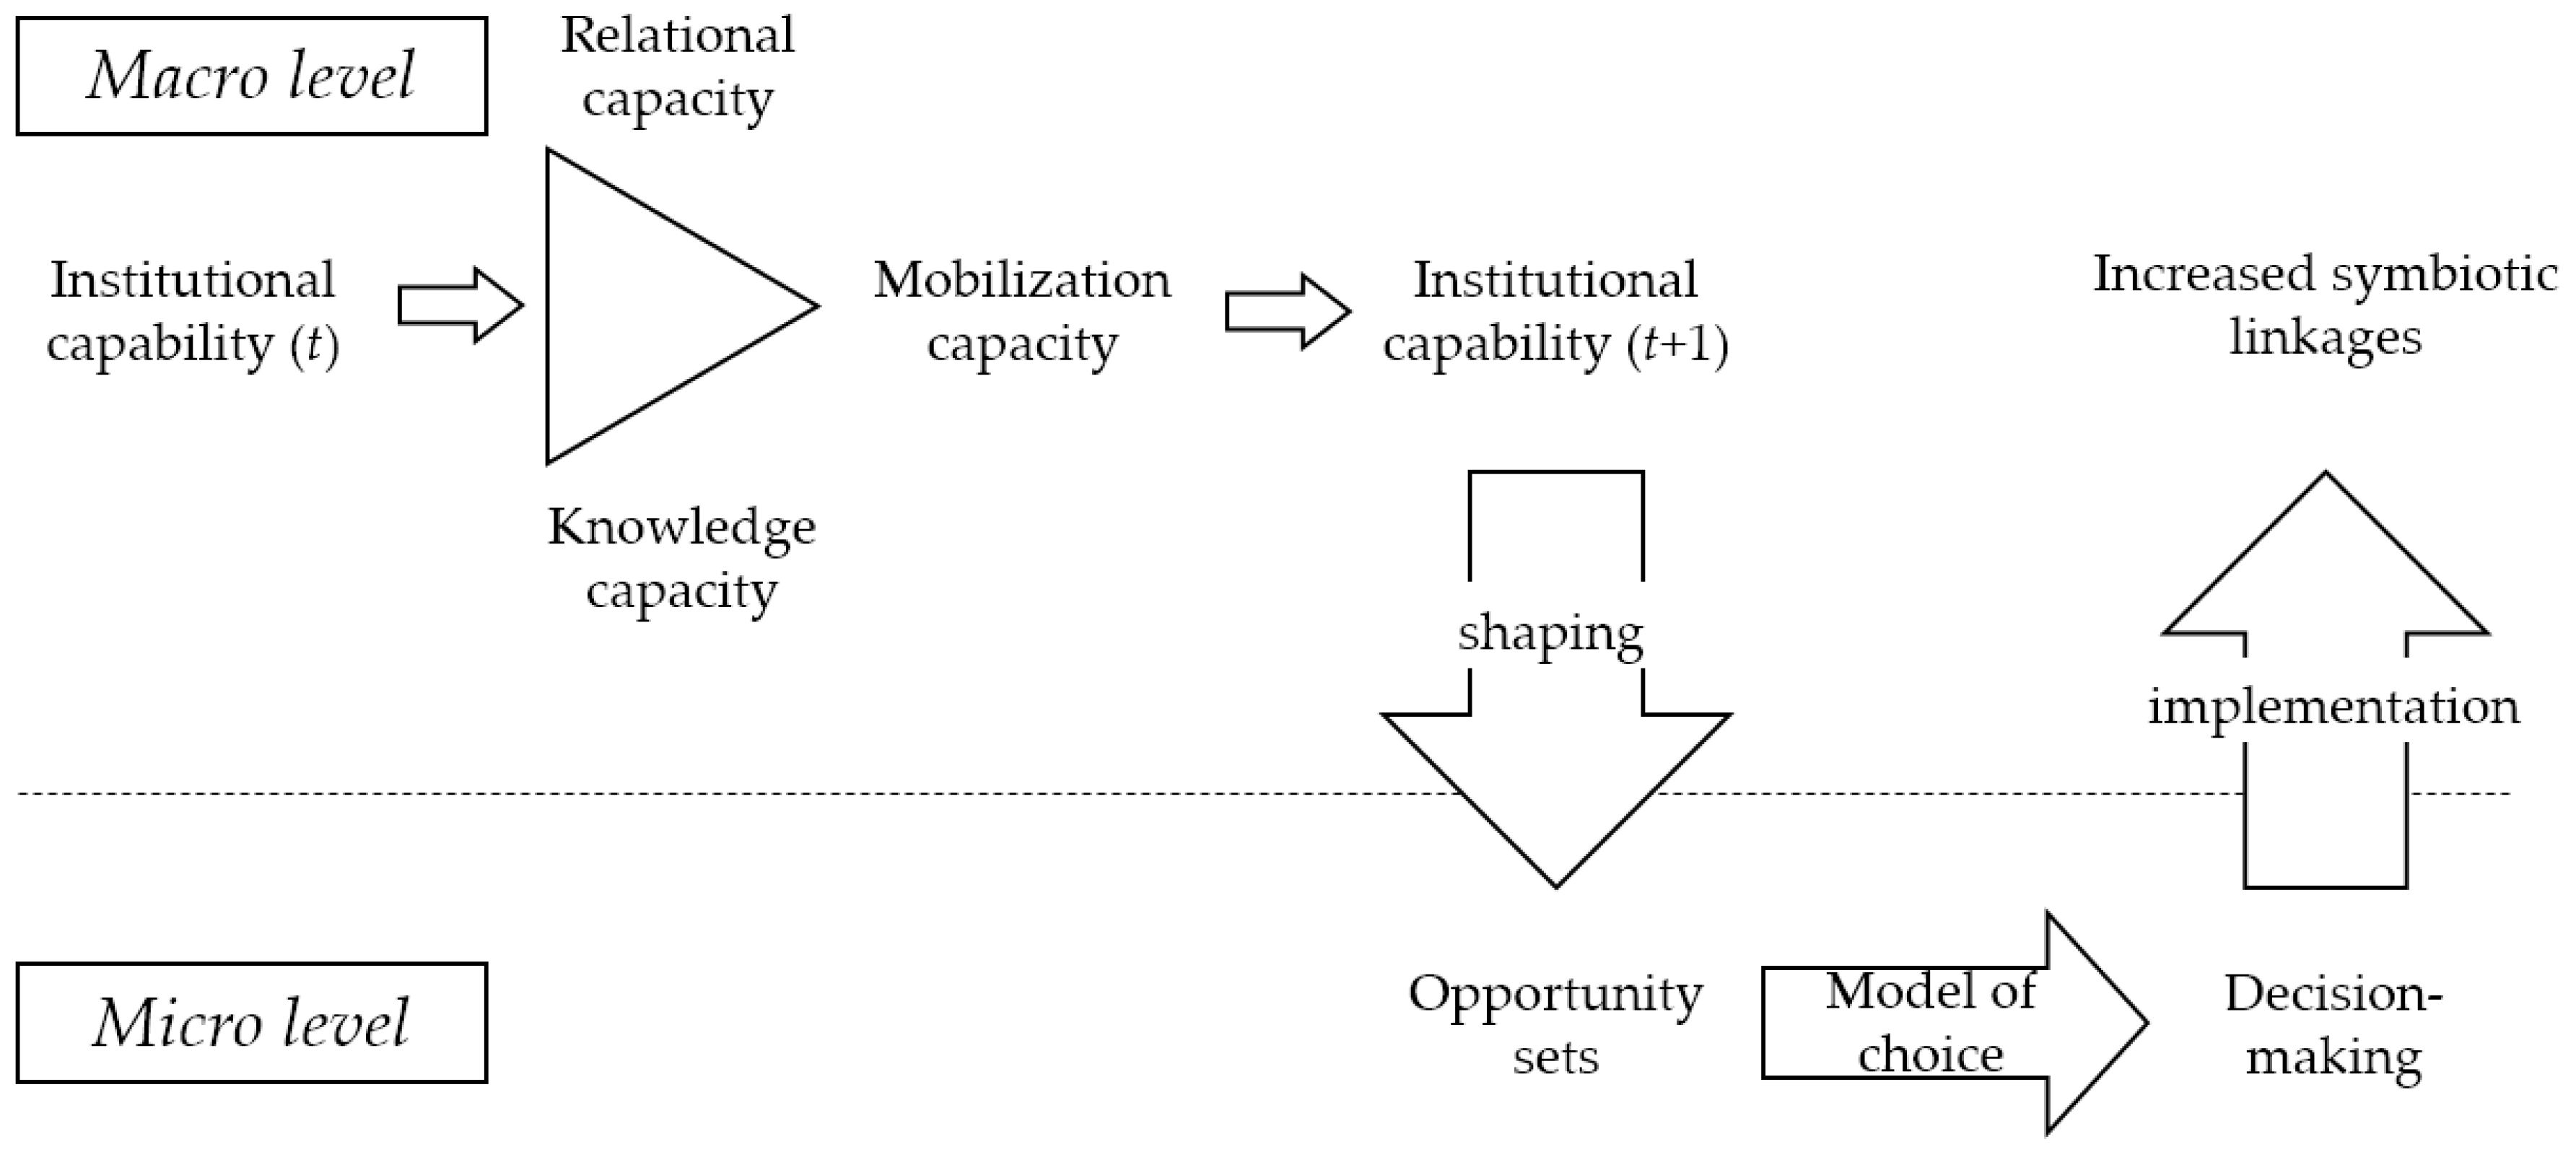
Figure 1. Conceptual framework from Boons and Spekkink (2012) [17] describing how institutional capacity affects IS emergence.
Sustainability 09 00765 g001
Figure 2. The input–output processes for the three types of firms in the estimated industrial system.
Sustainability 09 00765 g002
Figure 3. An overview of the simulation executive process visualized with a UML (Unified Modeling Language) activity diagram.
Sustainability 09 00765 g003
Figure 4. The initialization procedure of the simulation process, visualized with a UML activity diagram.
Sustainability 09 00765 g004
Figure 5. The activities of agents for each timestep of the simulation, visualized with a UML activity diagram.
Sustainability 09 00765 g005
Figure 6. An overview of the NetLogo interface for the IS knowledge/attitude diffusion model.
Sustainability 09 00765 g006
Figure 7. The IS knowledge/attitude diffusion process visualized by NetLogo under the condition of S-O, K-C, R-C, and C-C (from top to bottom).
Sustainability 09 00765 g007
Figure 8. Statistical comparison of the performance on knowledge diffusion under different strategies ( p p r o = 40 % ); (a) average knowledge level; (b)standard deviation of the results.
Sustainability 09 00765 g008
Figure 9. Statistical comparison of positive attitudes diffusion under different strategies ( p p r o = 40 % ); (a) IS solution of by-product A ; (b) IS solution of by-product B .
Sustainability 09 00765 g009
Figure 10. Sensitivity analysis: Average knowledge diffusion patterns with different p p r o values; (a) K-C; (b) R-C; (c) C-C.
Sustainability 09 00765 g010
Figure 11. Sensitivity analysis: Average positive attitude diffusion patterns with different p p r o values towards the IS solution of by-product A; (a) results under C-C; (b) results under R-C; (c) results under C-C; (d) results under all promoting strategies.
Sustainability 09 00765 g011
Figure 12. Sensitivity analysis: Average positive attitude diffusion patterns with different p p r o values towards the IS solution of by-product B; (a) results under K-C; (b) results under R-C; (c) results under C-C; (d) results under all promoting strategies.
Sustainability 09 00765 g012
Table 1. Characteristics of IS development models from the perspective of diffusion systems 1.
Self-OrganizingPlannedFacilitated
Corresponding Diffusion SystemsDecentralizedCentralizedHybrid
Direction of diffusionAmong the firms (that could be considered as the potential adopters of IS knowledge, positive attitude and practice) through their horizontal networks.One-way direction from the promoting agency to firms.
In the context of planned IS, the promoting agency (usually a governmental agency) acts as the central planner.
Among firms through the coordination of the promoting agency, as well as from the promoting agency.
In the context of facilitated IS, the promoting agency is usually a third-party organization who acts as facilitator.
Source of innovationsInnovations come from the firms who are also the potential adopters.Innovations come from R&D, introduced by the promoting agency (central planner).Innovations come from the firms themselves as well as the R&D introduced by the promoting agency (facilitator).
Who decide the innovationThe firms themselves.Top administrators and technical subject-matter experts (in the context of planned IS, represented by the central planner).The firms themselves.
In addition, top administrators might be involved in the introduction of some very promising innovations (coordinated by the facilitator).
Degree of centralization in innovation-decisionSharing of control among the firms themselves; or client control by the opinion leaders in the firms.Overall controlled by the top administrators and technical subject-matter experts (represented by the central planner).Sharing of control among the firms themselves; or client control by the opinion leaders. Alternatively, decisions on some promising innovations might follow the centralized model.
1 Contents of Table 1 are generated partially based on Rogers (2003), Table 9-1 [22] (p. 396).
Table 2. The properties of firm agent i   ( i = 1 , 2 , , N ) 1.
CategoryLabelNameDescription
Inherent properties T i Industrial typeFor agent i , T i { 1 ,   2 ,   3 } . The value of T i indicates that the agent i is one of the type I ( T i = 1 ) , type II ( T i = 2 ) or type III   ( T i = 3 ) firms.
M i Processed materialIn the model, we only consider the material A ,   B —the two materials that can be involved in the potential by-product synergies. For firm agent i , the materials it needs to process are presented by a vector M i = ( m i A , m i B ) , m i r { 1 ,   0 }   ( r = A ,   B ) . For a firm agent   i , m i r = 1 means it need to process material r   ( r = A ,   B ) , otherwise it needs not. According to Figure 2, for a firm agent   i :
  • If T i = 1 , then M i = ( m i A , m i B ) = ( 1 ,   0 ) ;
  • If T i = 2 , then M i = ( 1 ,   1 ) ;
  • If T i = 3 , then M i = ( 0 ,   1 ) .
a i Adopter categoryRogers (2003) defined five adopter categories—innovators, early adopters, early majority, late majority, and laggards—on the basis of innovativeness [22] (p. 297). a i indicates the adopter category of firm agent i . The firm agents labeled as “innovator”, have full knowledge of potential IS synergies, and act as the starting points of the diffusion process.
a i is an influential factor for other properties of firm agent i , such as its capability to gain knowledge about eco-innovations ( k c i ), the utility threshold for it to approve the IS solution ( m i n U i ) , and its perceptual capability to sense the sounding influences about certain eco-innovations ( i n f i ).
k c i Knowledge capabilityFor firm agent   i , k c i is its capability to absorb the knowledge of a specific innovation. The value of   k c i [ 0 ,   1 ]   is determined by the agent’s a i . For example, the agent, which is an innovator or early adopter, obtains a higher value of k c i .
m i n U i Utility thresholdFor firm agent i , m i n U i [ 0 ,   1 ] is the minimum utility value needed to form a positive attitude towards the idea of an eco-innovation. m i n U i is a constant value determined by a i . For example, as an early adopter, the agent i needs a relatively lower utility threshold to adopt a new idea, while the laggards need more evidence to prove the utility of the innovation.
i n f i Perceptual capabilityAgent i s’ perceptual ability to sense the sounding influences about certain eco-innovations, the value of i n f i [ 0 ,   1 ]   is determined by the agent’s a i .
Status properties K i KnowledgeThe vector K i = ( k i A , k i B ) , k i r [ 0 ,   1 ]   ( r = A ,   B ) indicates firms’ knowledge level about a specific IS solution for the process of material A ,   B . The firm agent i updates its knowledge after the interaction with other agents. Moreover, k i r is also determined by m i r in a way that if m i r = 0 , then k i r = 0 , which means the agent will not get involved in the knowledge exchanges if it is irrelevant to them. At the initial stage, assume that the firm agents have a basic understanding about their processed materials, that is, if m i r = 1 , then k i r = k 0 ( 0 , 1 ) . The knowledge algorithm will be given later in Section 3.3.2.
A T i AttitudeThe vector A T i = ( a t i A , a t i B ) indicates firm agent i ’s attitude towards all the possible IS solutions for the process of material A ,   B . Each element a t i r ( r = A ,   B ) of vector A T i represents firm agent i’s attitude towards one specific IS solution. If a t i r = 1 ( r = A ,   B ) , firm agent i has approved and accepted the idea of the corresponding IS solution. Otherwise, a t i r = 0 ( r = A ,   B ) . The attitude algorithm will be given in Section 3.3.3.
U i r UtilityFor firm agent i , U i r is the utility it has evaluated about a specific IS solution for the process of material r ( r = A ,   B ) . The calculation of U i r will be given in Section 3.3.3.
p _ i n f i r Perceived external influenceFor firm agent i , p _ i n f i r is the overall attitude of its external environment it has perceived towards IS solution about r . The calculation of p _ i n f i r will be given in Section 3.3.3.
1 N refers to the total number of firm agents.
Table 3. The properties of a promoter agent.
LabelNameDescription
P T Types of promoting strategy P T determines the strategies employed by the promoter agent. As discussed above, the strategies employed by the promoter agent considered in the proposed research including “knowledge coordination”, “relationship coordination” and “combined coordination” (i.e., the combination of “knowledge coordination” and “relationship coordination”).
p p r o Rate of promotion p p r o ( p p r o [ 0 ,   1 ] ) is the percentage of the firm agents in the industrial system that the promoter agent has connected with. p p r o reflects the mobilization capacity brought by the promoter agent.
n k c Number of contacted firms at each time stepWhen the promoter employs the strategy of knowledge coordination (K-C), at each time step, it contacts a certain number ( n k c ) of firm agents it has linked to transfer knowledge to them.
P K Promoter’s KnowledgeWhen the promoter employs the strategy of knowledge coordination (K-C), we assume that the promoter has the full knowledge of the available IS solutions in this system, that is, P K = ( p k A , p k B ) = ( 1 ,   1 ) .
n r c Number of coordinated pairs at each time stepWhen the promoter employs the strategy of relationship coordination (R-C), the promoter agent facilitates the communication and relationship building between firm agents it has linked with. At every time step, the promoter facilitates n r c pair of firm agents to make them communicate or build new contacts with each other.
Table 4. Initial settings of the system environment.
VariablesInitial ValuesNotes
The number of firm agents N 150
The proportion of firms: (type I:type II:type III)1:1:1If N = 150, thus there are 50 type I firms, 50 type II firms and 50 type III firms. As such, There are 100 potential adopters (the total number of type I and type II firms) of the solution of by-product A and 100 potential adopters (the total number of type II and type III firms) of the solution of by-product   B .
The proportion of firms: (innovators:early adopters:early majority:late majority:laggards)2.5%:13.5%:34%:34%:16% 1If N = 150, randomly divide the firm agents into four categories, then there are approximately 4 innovators (set a i = 0), 20 early adopters (set a i = 1), 51 early majority (set a i = 2), 51 late majority (set a i = 3) and 24 laggards (set a i = 4).
Average degree of the inter-firm small-world network3
The rewiring probability of the inter-firm small-world network0.1
Initial weight w i j of the inter-firm linkage e i j 1
The weight of external influence when making decision β r ( β A , β B ) β A = 0.3
β B = 0.5
The value indicates greater uncertainty of implementation of the IS solution for by-product   B .
Threshold h 0.6
Basic knowledge level of firms k 0 0.1
Simulation time period400A simulation lasts for 400 time steps.
1 Based on Rogers (2003) [16] (p. 281).
Table 5. Initial settings of the agents.
AgentsVariablesInitial Values
Firm agents K i ( t = 0 ) : Initial knowledge of the material that firm agent need to processIf T i = 1 , K i = ( k 0 ,   0 ) = ( 0.1 ,   0 ) ;
if T i = 2 , K i = ( k 0 ,   k 0 ) = ( 0.1 ,   0.1 ) ;
if T i = 3 , K i = ( 0 ,   k 0 ) = ( 0 ,   0.1 ) .
k c i : Knowledge capability of firmsIf a i = 0 , 1, k c i = 1 ; if a i = 2 , k c i = 0.7 ;
if   a i = 3 , k c i = 0.4 ; if   a i = 4 , k c i = 0.1 .
i n f i : Perceptual capability of firmsIf a i = 0 , 1, i n f i = 0.8 ; if a i = 2 , i n f i = 0.6 ;
if   a i = 3 , i n f i = 0.4 ; if   a i = 4 , i n f i = 0.2 .
m i n U i : Utility threshold for firms to approve the IS solutionIf a i = 0 , 1, m i n U i = 0.4 ; if a i = 2 , m i n U i = 0.6 ;
if   a i = 3 , m i n U i = 0.8 ; if   a i = 4 , m i n U i = 1 .
Promoter agent P K : Knowledge of promoter agent P K = ( p k A , p k B ) = ( 1 ,   1 )
n k c : Number of contacted firms at every time step8
n r c : Number of coordinated pairs at every time step4
p p r o : The percentage of firm agents that the promoter agent has connected with40%
P T : The promoting strategies that are employedknowledge coordination (K-C) relationship coordination (R-C) combined coordination (C-C)
Table 6. Sensitivity analysis: compared scenarios.
PTPromoting Strategies
ppro K-CR-CC-C
40%40%, K-C (baseline)40%, R-C (baseline)40%, C-C (baseline)
30%30%, K-C30%, R-C30%, C-C
50%50%, K-C50%, R-C50%, C-C