
Monitoring Spatial Patterns and Changes of Ecology, Production, and Living Land in Chinese Urban Agglomerations: 35 Years after Reform and Opening Up, Where, How and Why?


Abstract
:
1. Introduction
- (1)
- There were few reliable data to support the study of trajectories, patterns and drivers of EPL in Chinese UAs from 1980 to 2015. The unique national Chinese remotely-sensed LUCC product of 1980 and 2015 was just released by Data Center for Resources and Environmental Sciences, Chinese Academy of Sciences (RESDC) in 2017. Before this, the data can only cover the period of 1990–2010.
- (2)
- Although the importance of promoting UAs as the main space for the new type urbanization is gradually recognized by government and academics, research on urban agglomeration is still limited due to their late development, which is less than 35 years in China. Its spatial delineation, basic connotations, construction foci, and degree of development are less certain and more contentious [8].
- (3)
- The rapid development of economy and society made scholars pay more attention to the urbanization and industrialization but ignore integrated analysis of production, living, and ecology.
2. Study Area and Data
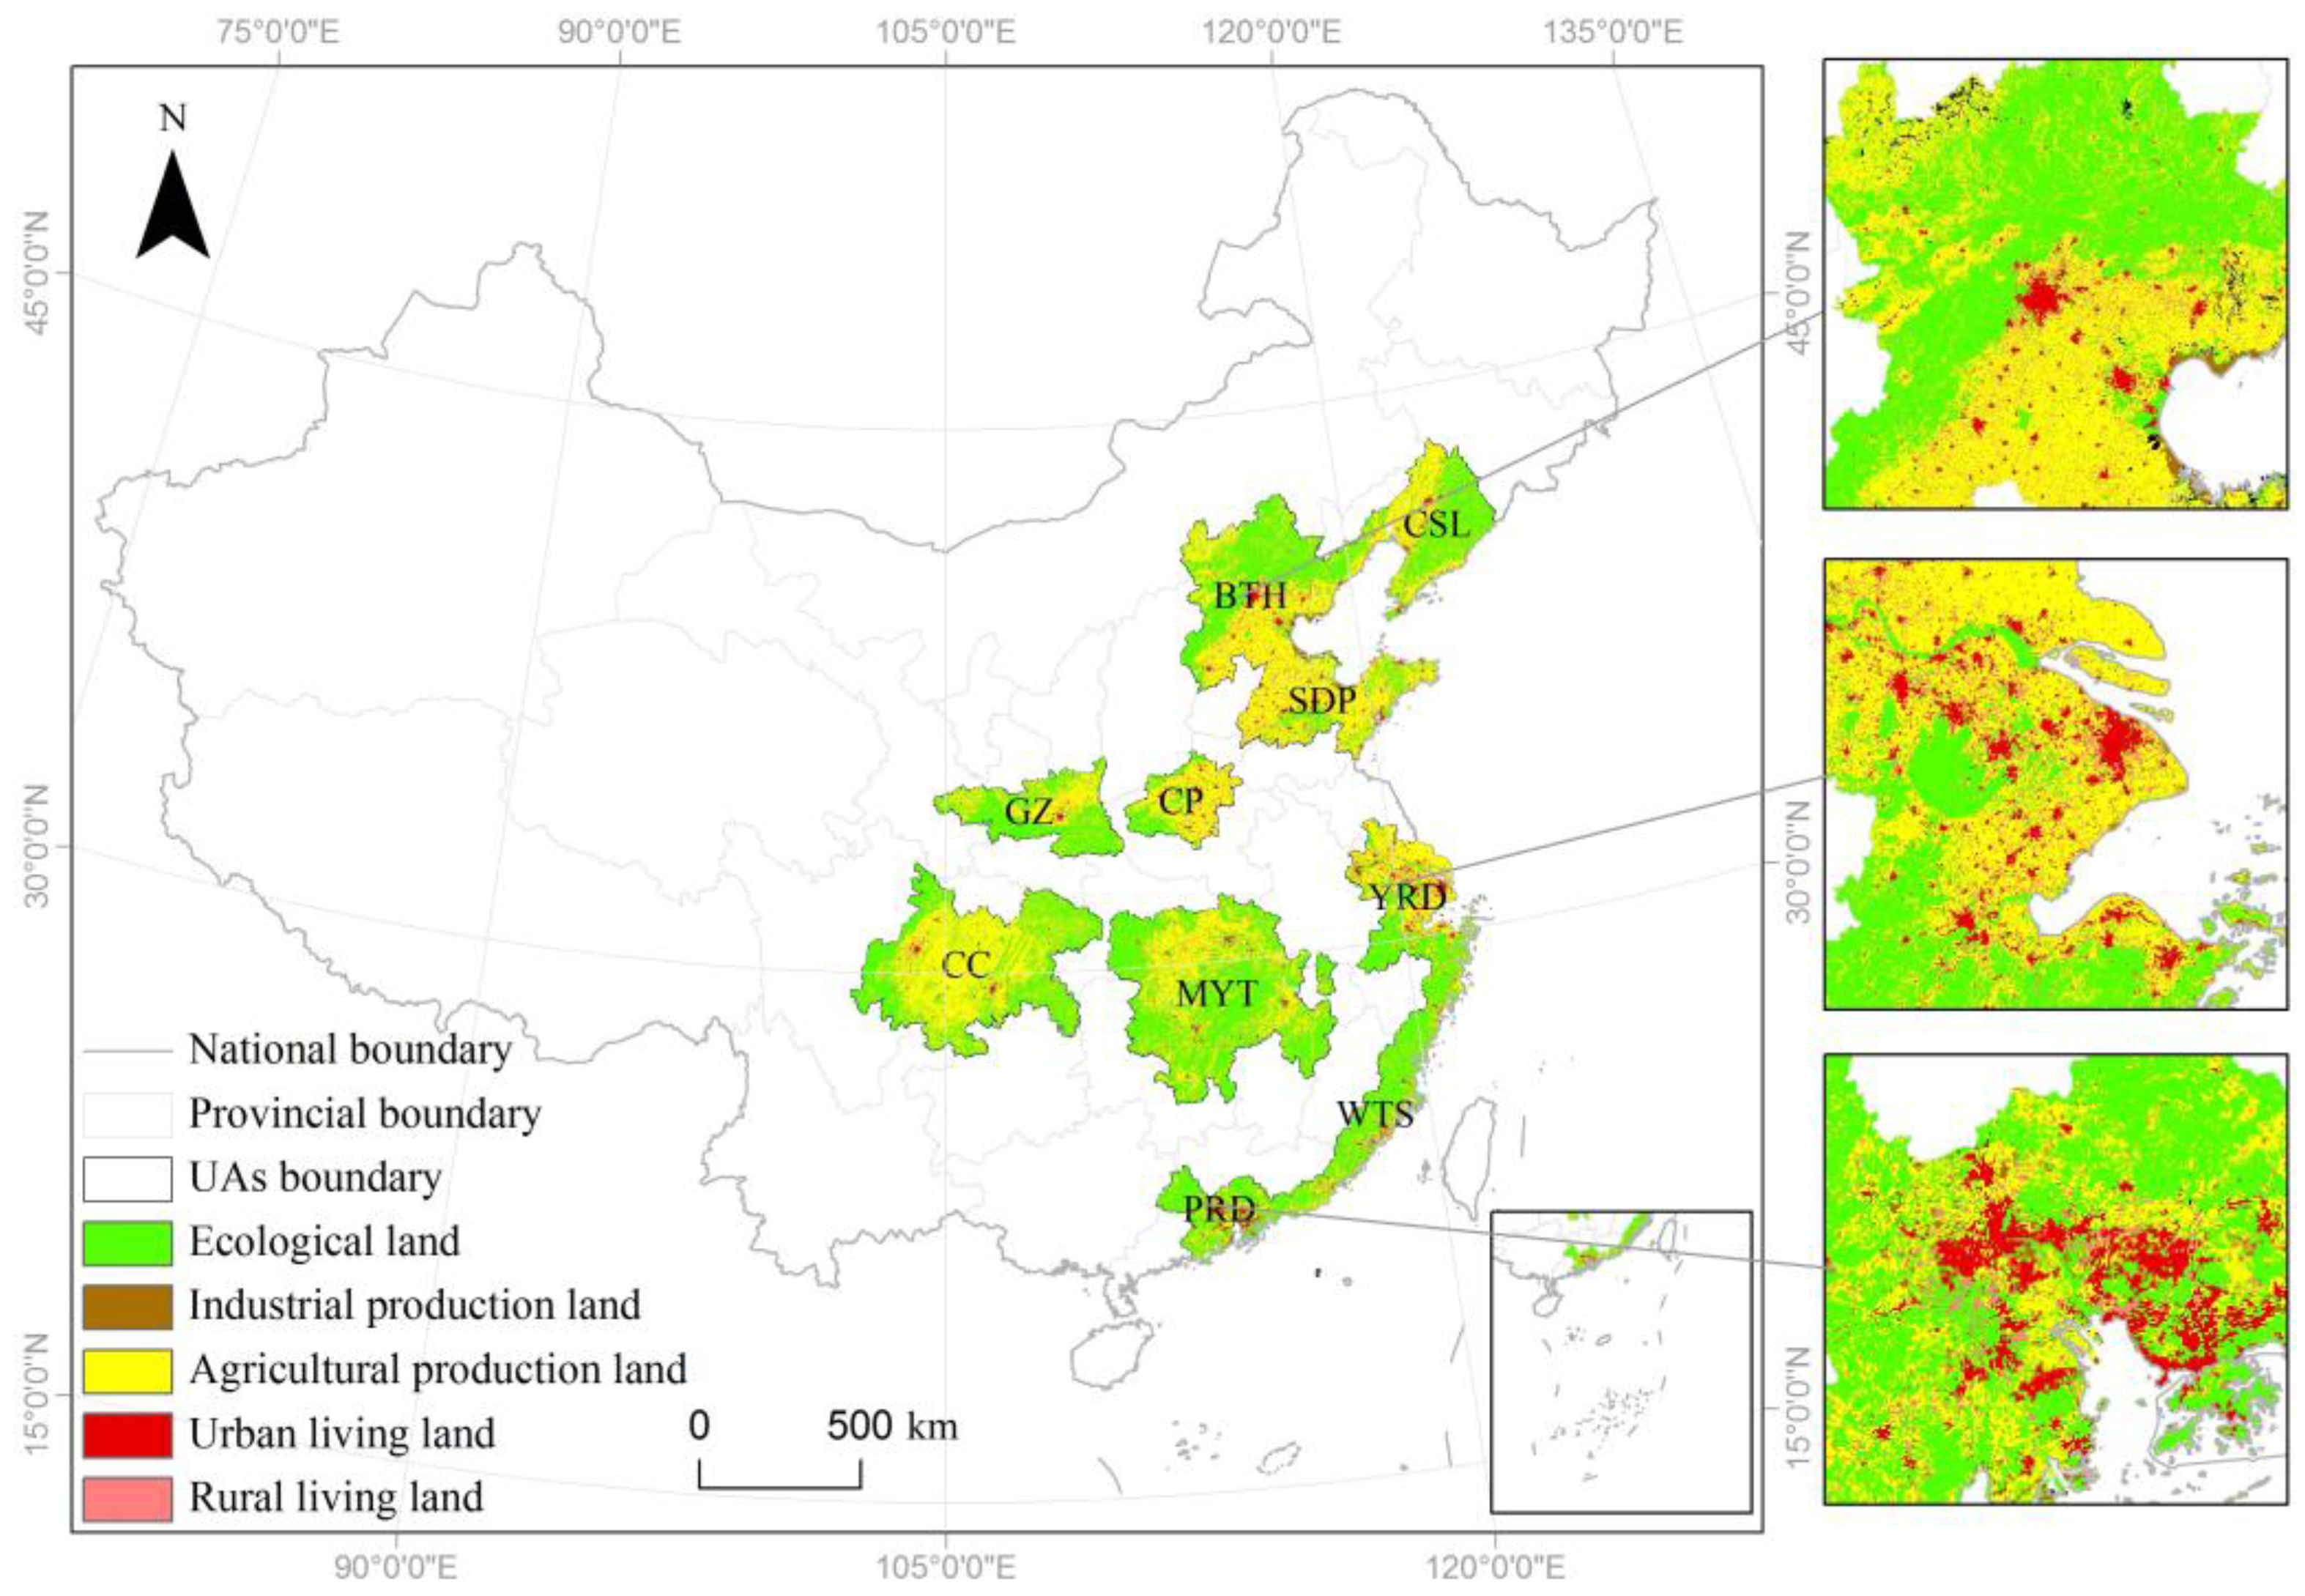
2.1. Study Area
2.2. Data Used
3. Methods
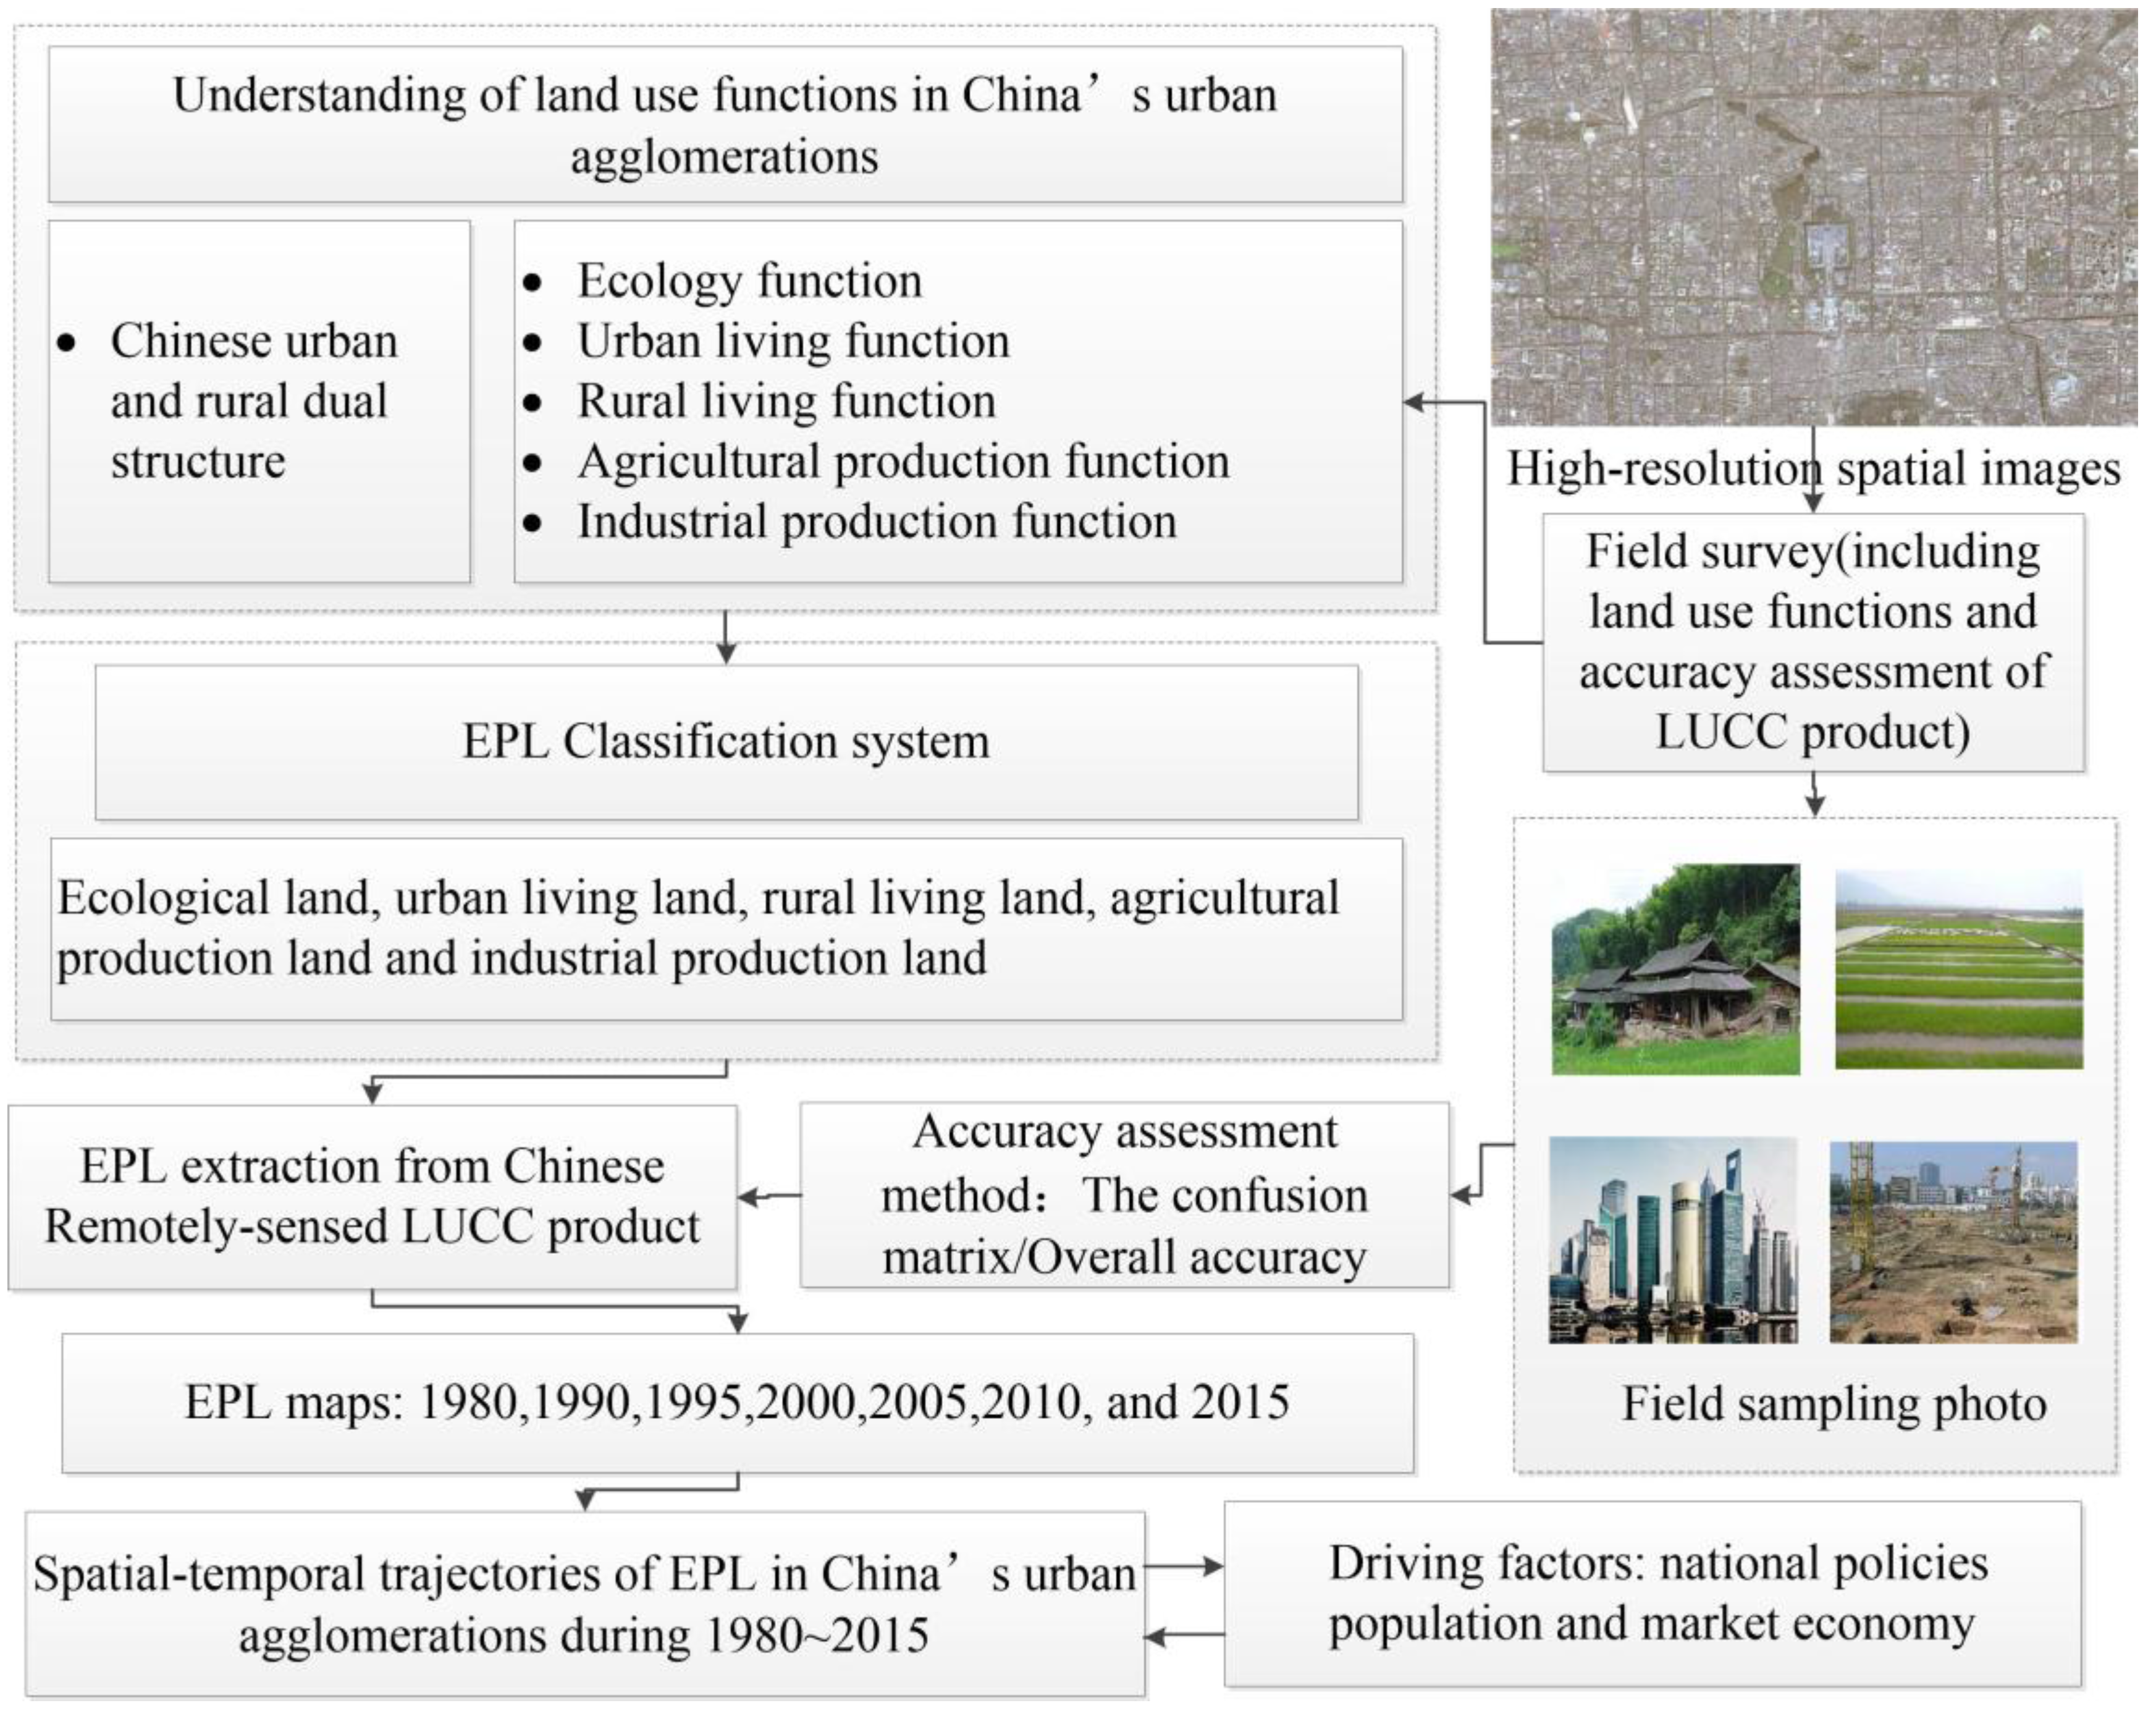
3.1. EPL Classification System
- (1)
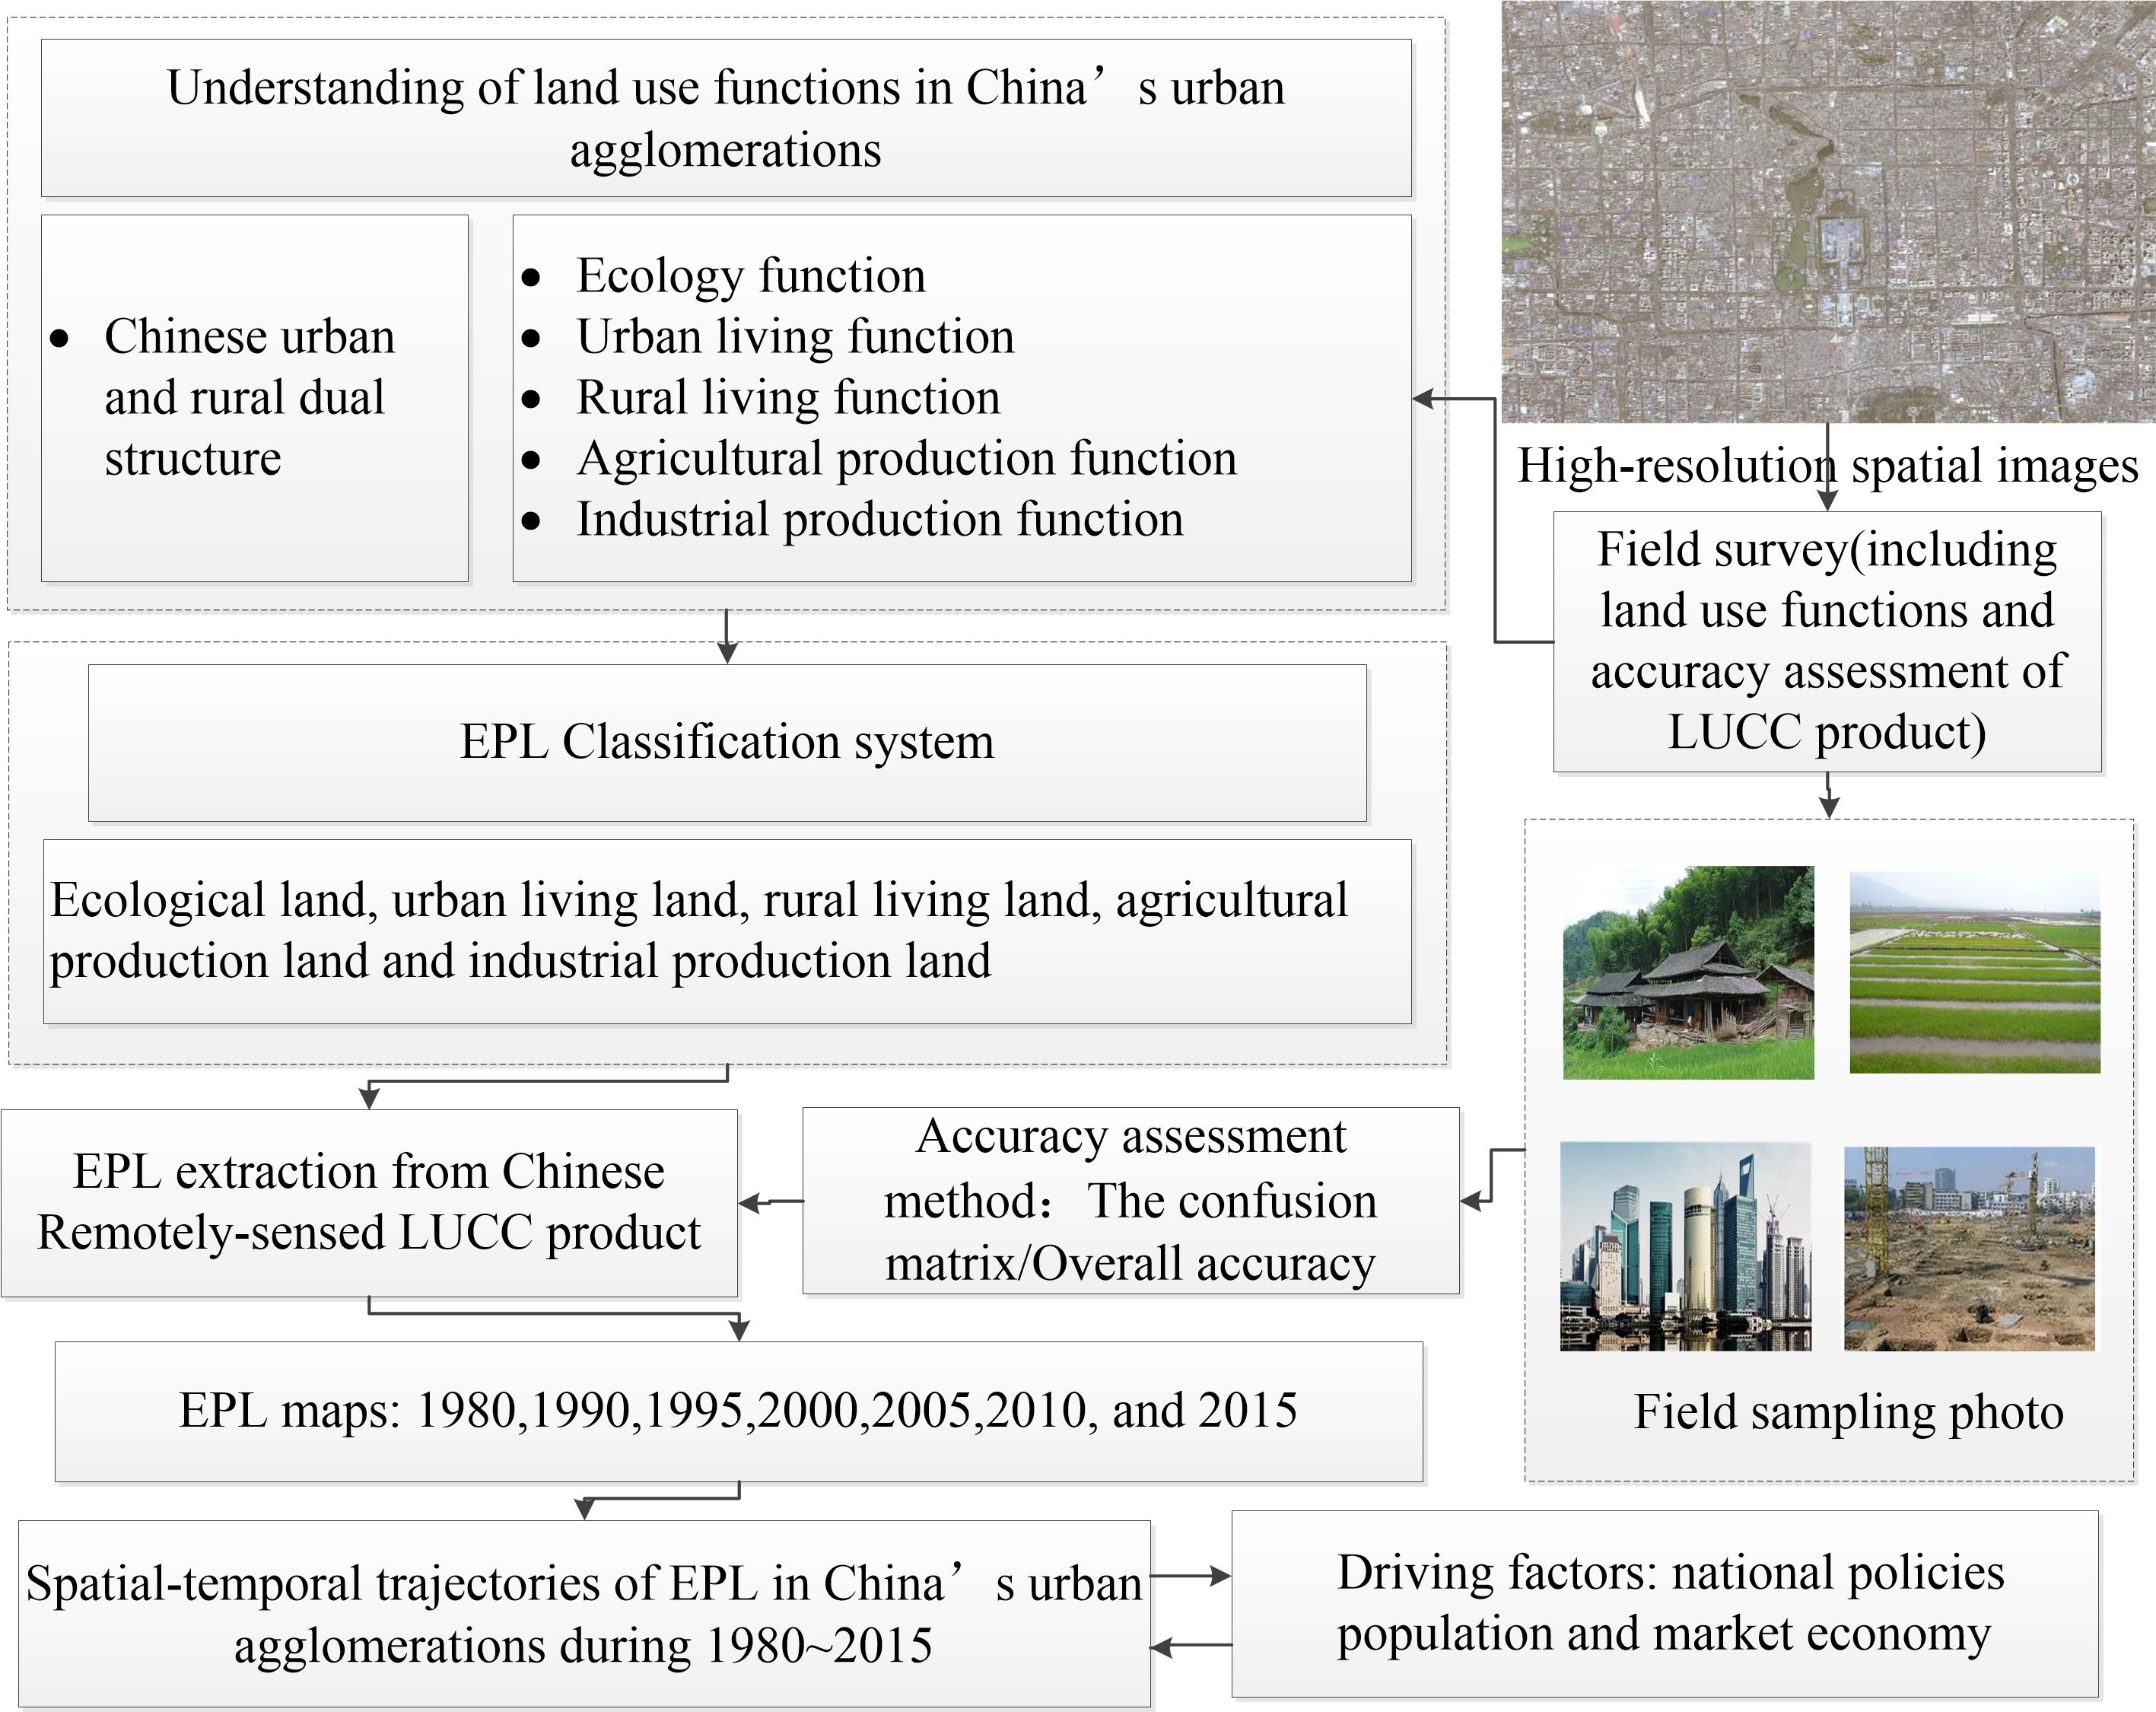
- Field sampling photos exhibit the enormous differences between Chinese rural and urban regions. It is rather clear due to the dual structure of Chinese urban and rural regions. It was also certificated by our team members through our field investigation. Thus, we should consider these enormous differences in our EPL classification system.
- (2)
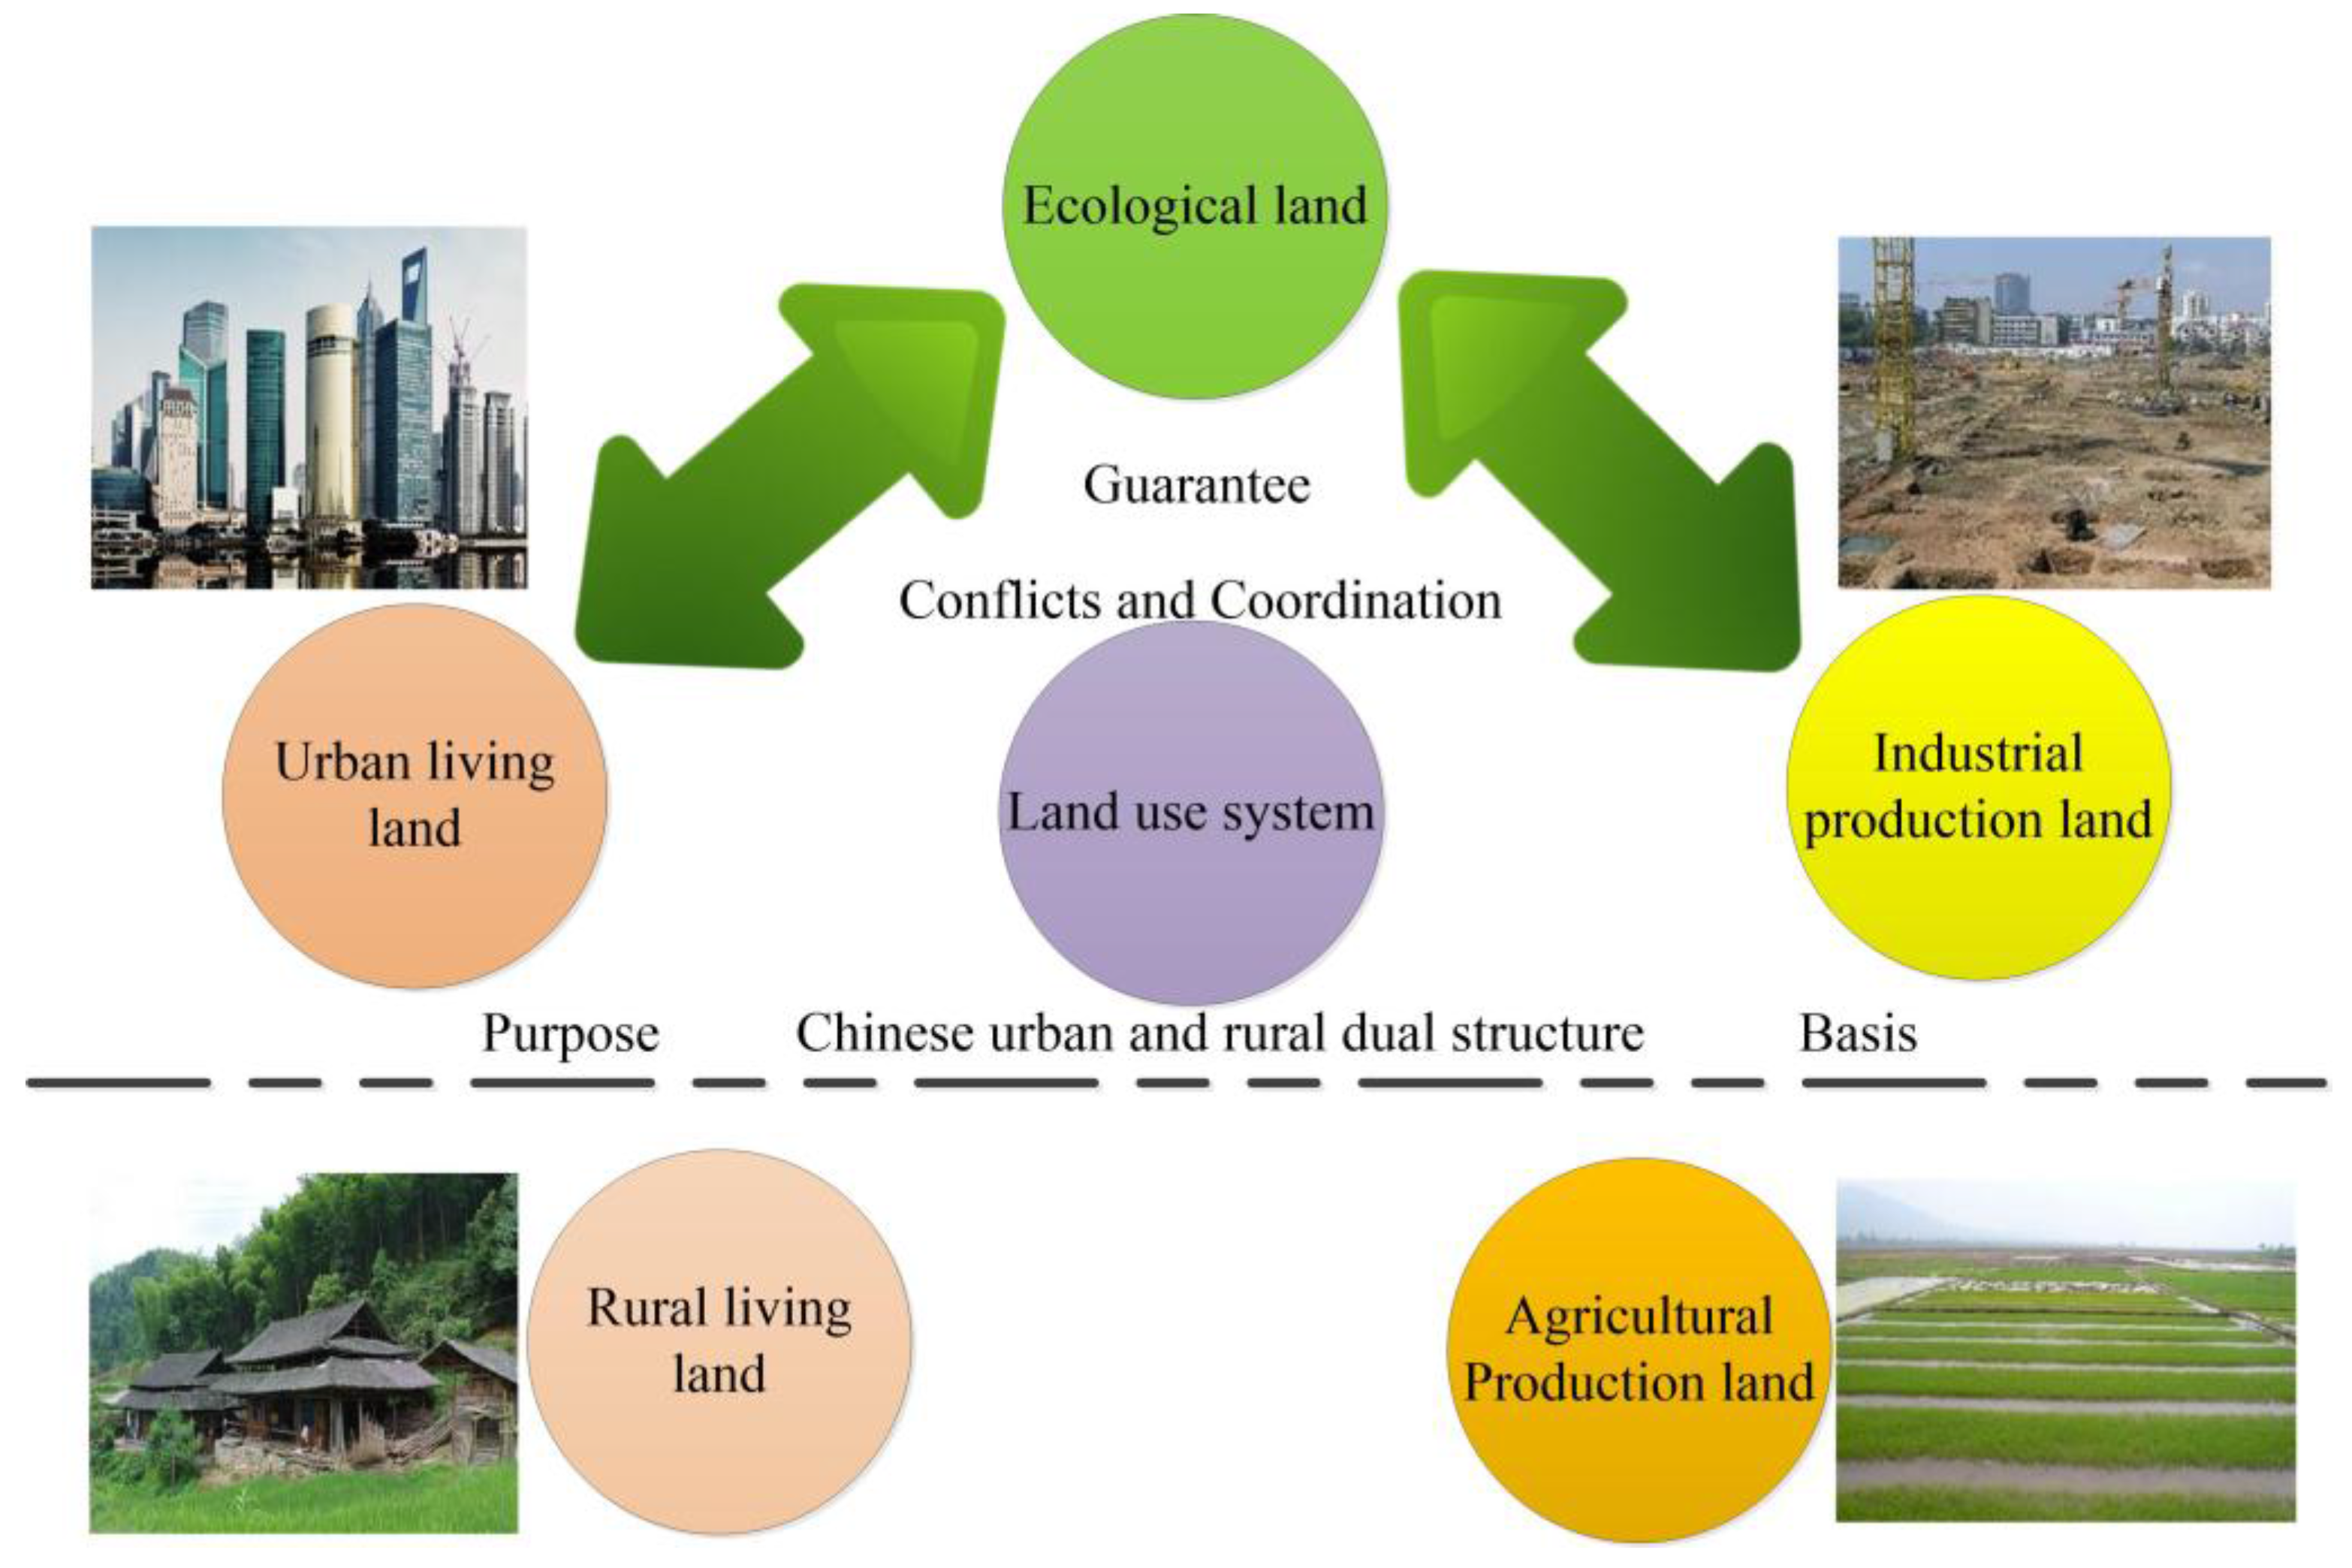
- The ecology land (EL) has ecology functions, which is the support in a land use system. The production land has production functions, which is the land use system’s guarantee. The living land has living functions, which is the land use system’s ultimate purpose. Thus, they collaborate with each other and are indispensable.
- (3)
- Due to the differences between Chinese urban and rural regions, the production land can be further divided into APL and IPL. The living land can be further divided into ULL and RLL. There were also conflicts among EPL in Chinese UAs land use system, for example, the conflicts between economic development and environment protection, as well as cultivated land reclamation and ecological production.
- (1)
- EL: A region that can provide important ecological functions, such as climate regulation, water conservation and so on, including forest land, grassland and waters.
- (2)
- IPL: A region can provide industrial products, including factories, quarries, mining, and oil-field wastes outside cities as well as land for special uses, such as roads and airports.
- (3)
- APL: A region can provide agricultural products and their services, including paddy land and arid land.
- (4)
- ULL: A region can provide functions of non-agricultural population living and public activities, including built-up area of large, medium and small cities and counties.
- (5)
- RLL: A region can provide functions of agricultural population living and public activities, including rural residential outside cities and counties.
3.2. Analysis Average Variation Rate and Driving Factors of EPL Changes
3.3.The Level of Urban Agglomeration and Regional Division
4. Results
4.1. EPL Area Changes
4.1.1. EPL Changes in Different Classes Level
- (1)
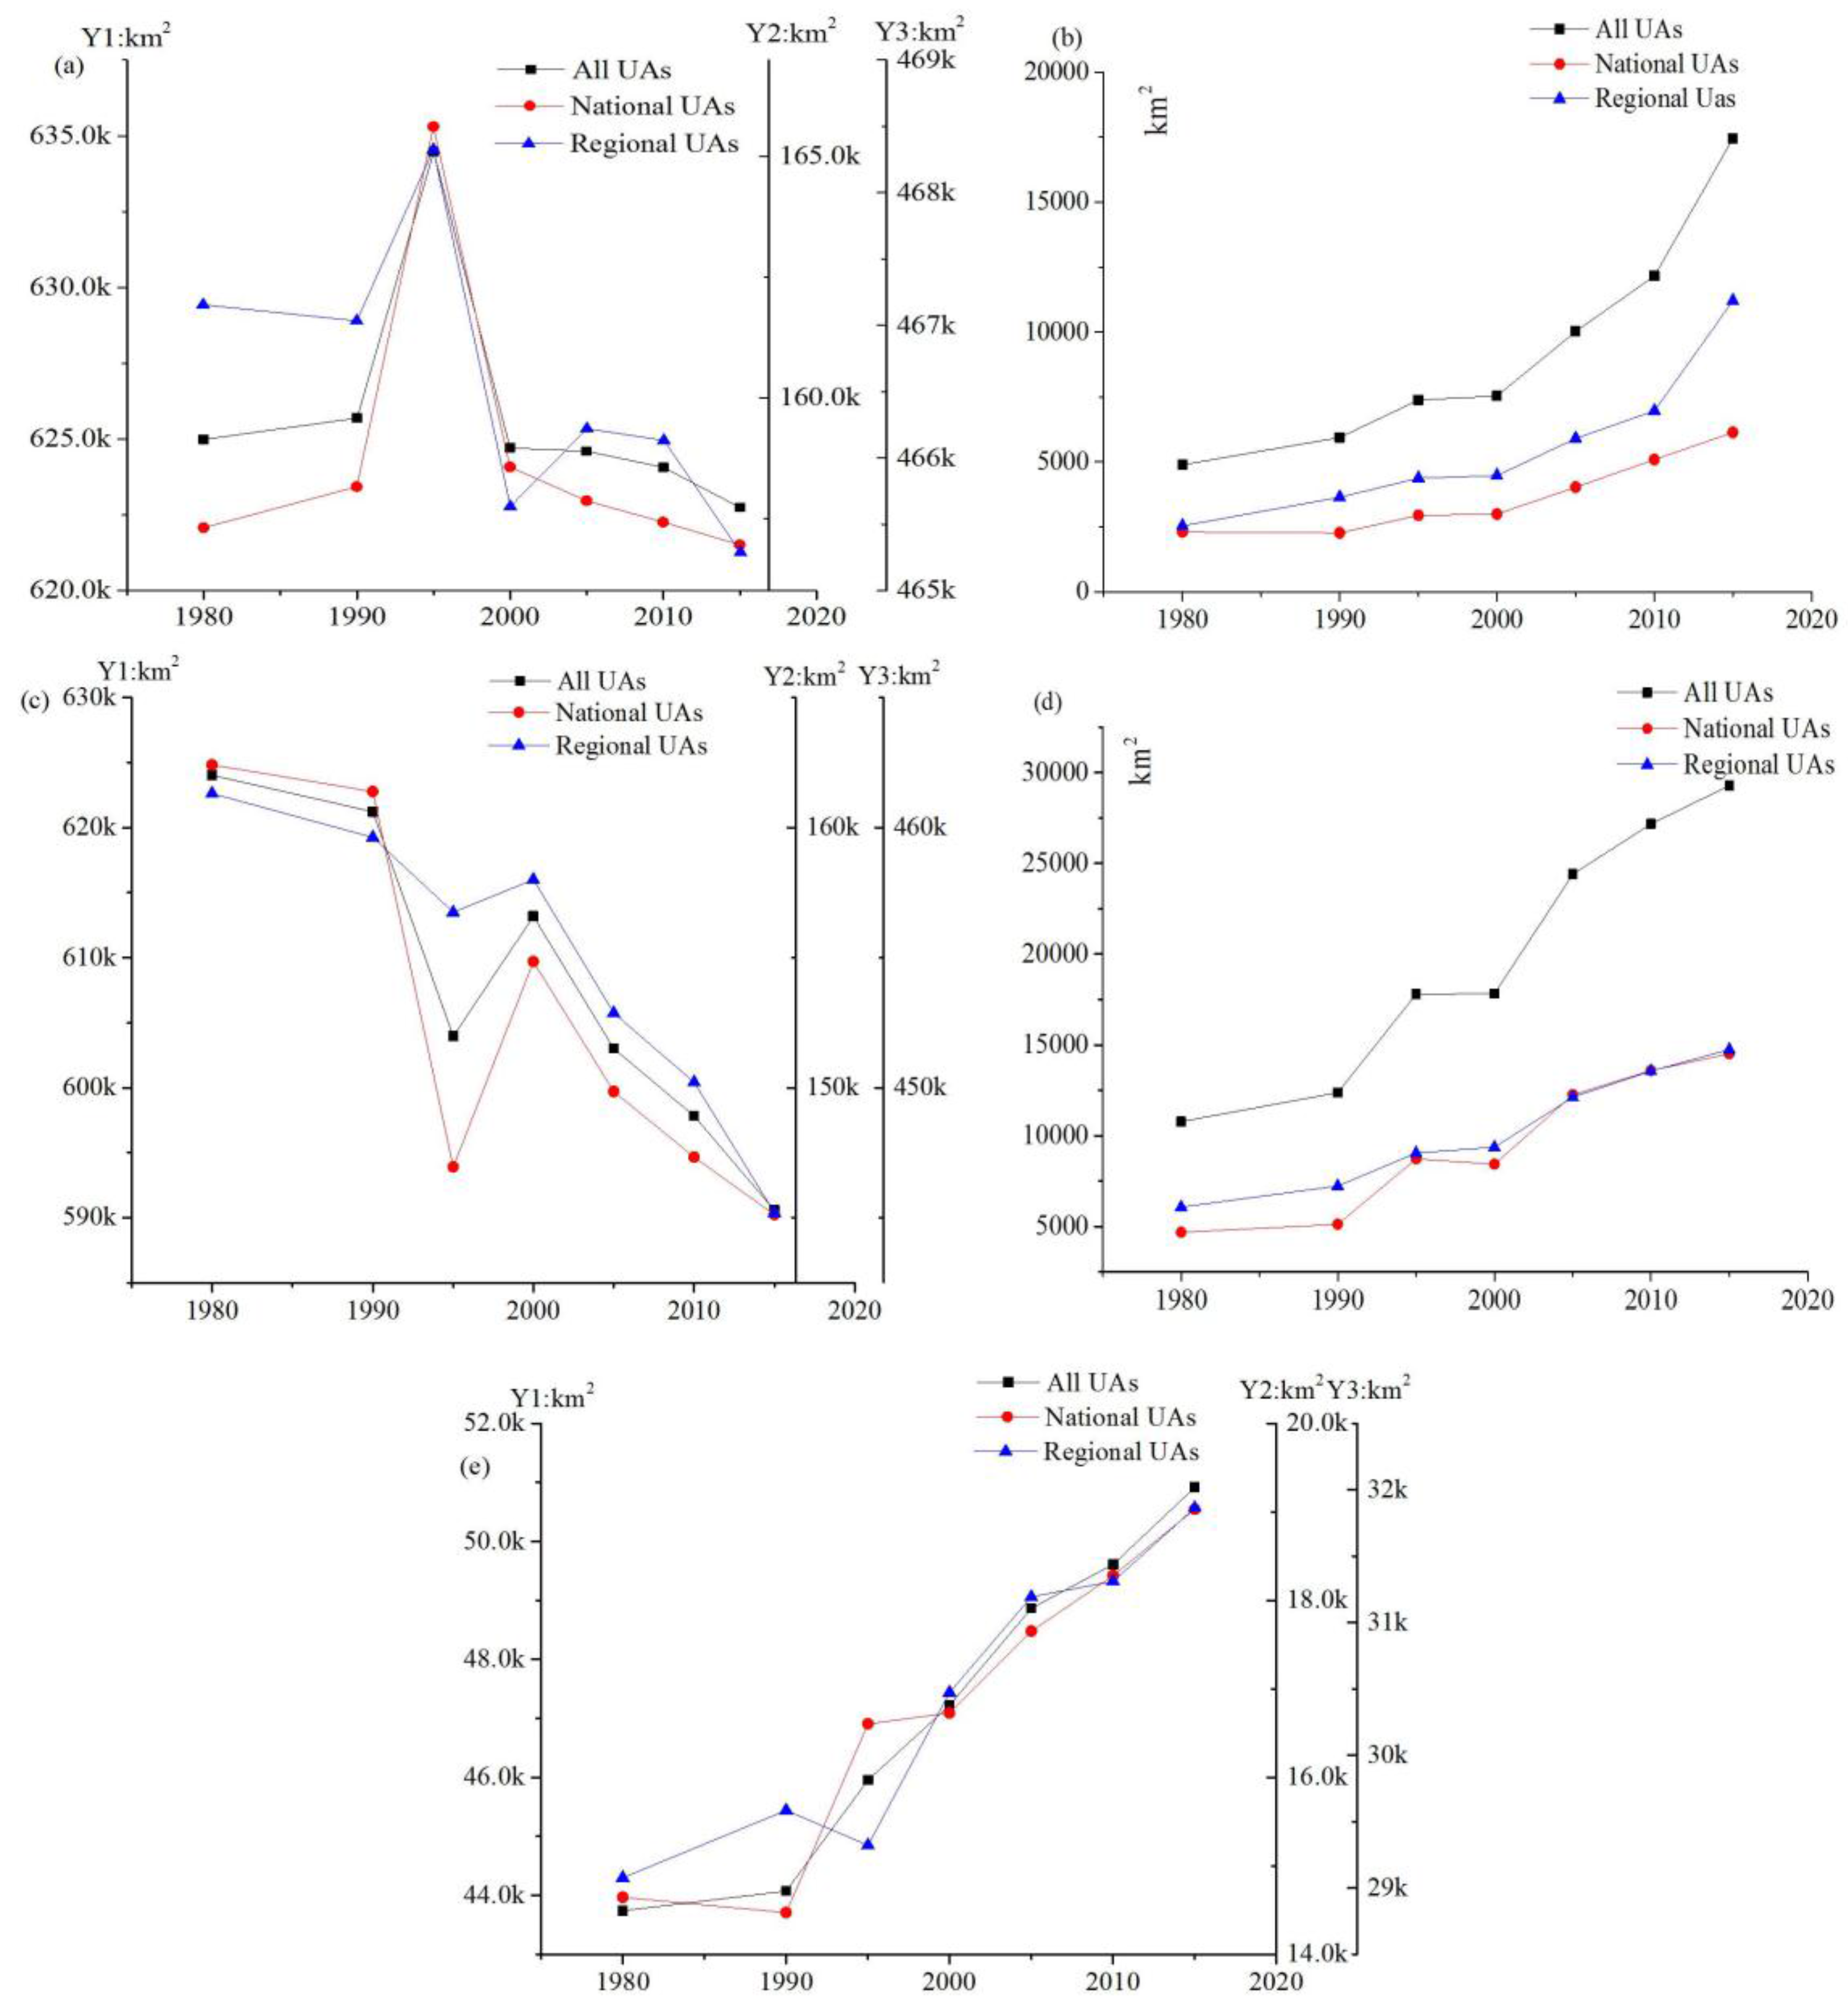
- During 1980–2015, there was a rapidly increasing trend for both ULL and IPL areas in Chinese UAs (Table 4, Figure 4b,d). ULL increased by 18,508 km2, and its expansion rate was 529 km2/year. It increased by 9831 km2 in national UAs and 8659 km2 in regional UAs. IPL increased by 12,563 km2 and its expansion rate was 359 km2/year. It increased by 3833 km2 in national UAs and 8660 km2 in regional UAs (Table 4). ULL area in national UAs was larger than those in regional UAs in 2015 (Figure 4d).
- (2)
- During 1980–2015, both APL and EL in Chinese UAs were decreased seriously (Table 4, Figure 4a,c). APL decreased by 33,454 km2 and its reduction rate was 956 km2/year. It decreased by 17,295 km2 in national UAs and 16,136 km2 in regional UAs. EL decreased by 2249 km2 and its reduction rate was 64.26 km2/year. It decreased by 352 km2 in national UAs and 1867 km2 regional UAs. The most serious period of APL reduction was during 1990–1995, and then it had a dramatically increasing trend momently from 1995 to 2000 (Figure 4c). On the contrary, there was a steeply increasing trend for EL from 1990 to 1995, and quickly a sharp decrease during 1995–2000 (Figure 4a). All of these dramatically increasing or decreasing trends of APL and EL were affected by Chinese national policies (returning farmland to forest and grassland in 1992, regulations on the protection of prime farmland in 1994, and land management law revision, which set up the world’s strictest farmland protection policy, in 1998).
- (3)
4.1.2. ULL and IPL Changes in Different UAs
- (1)
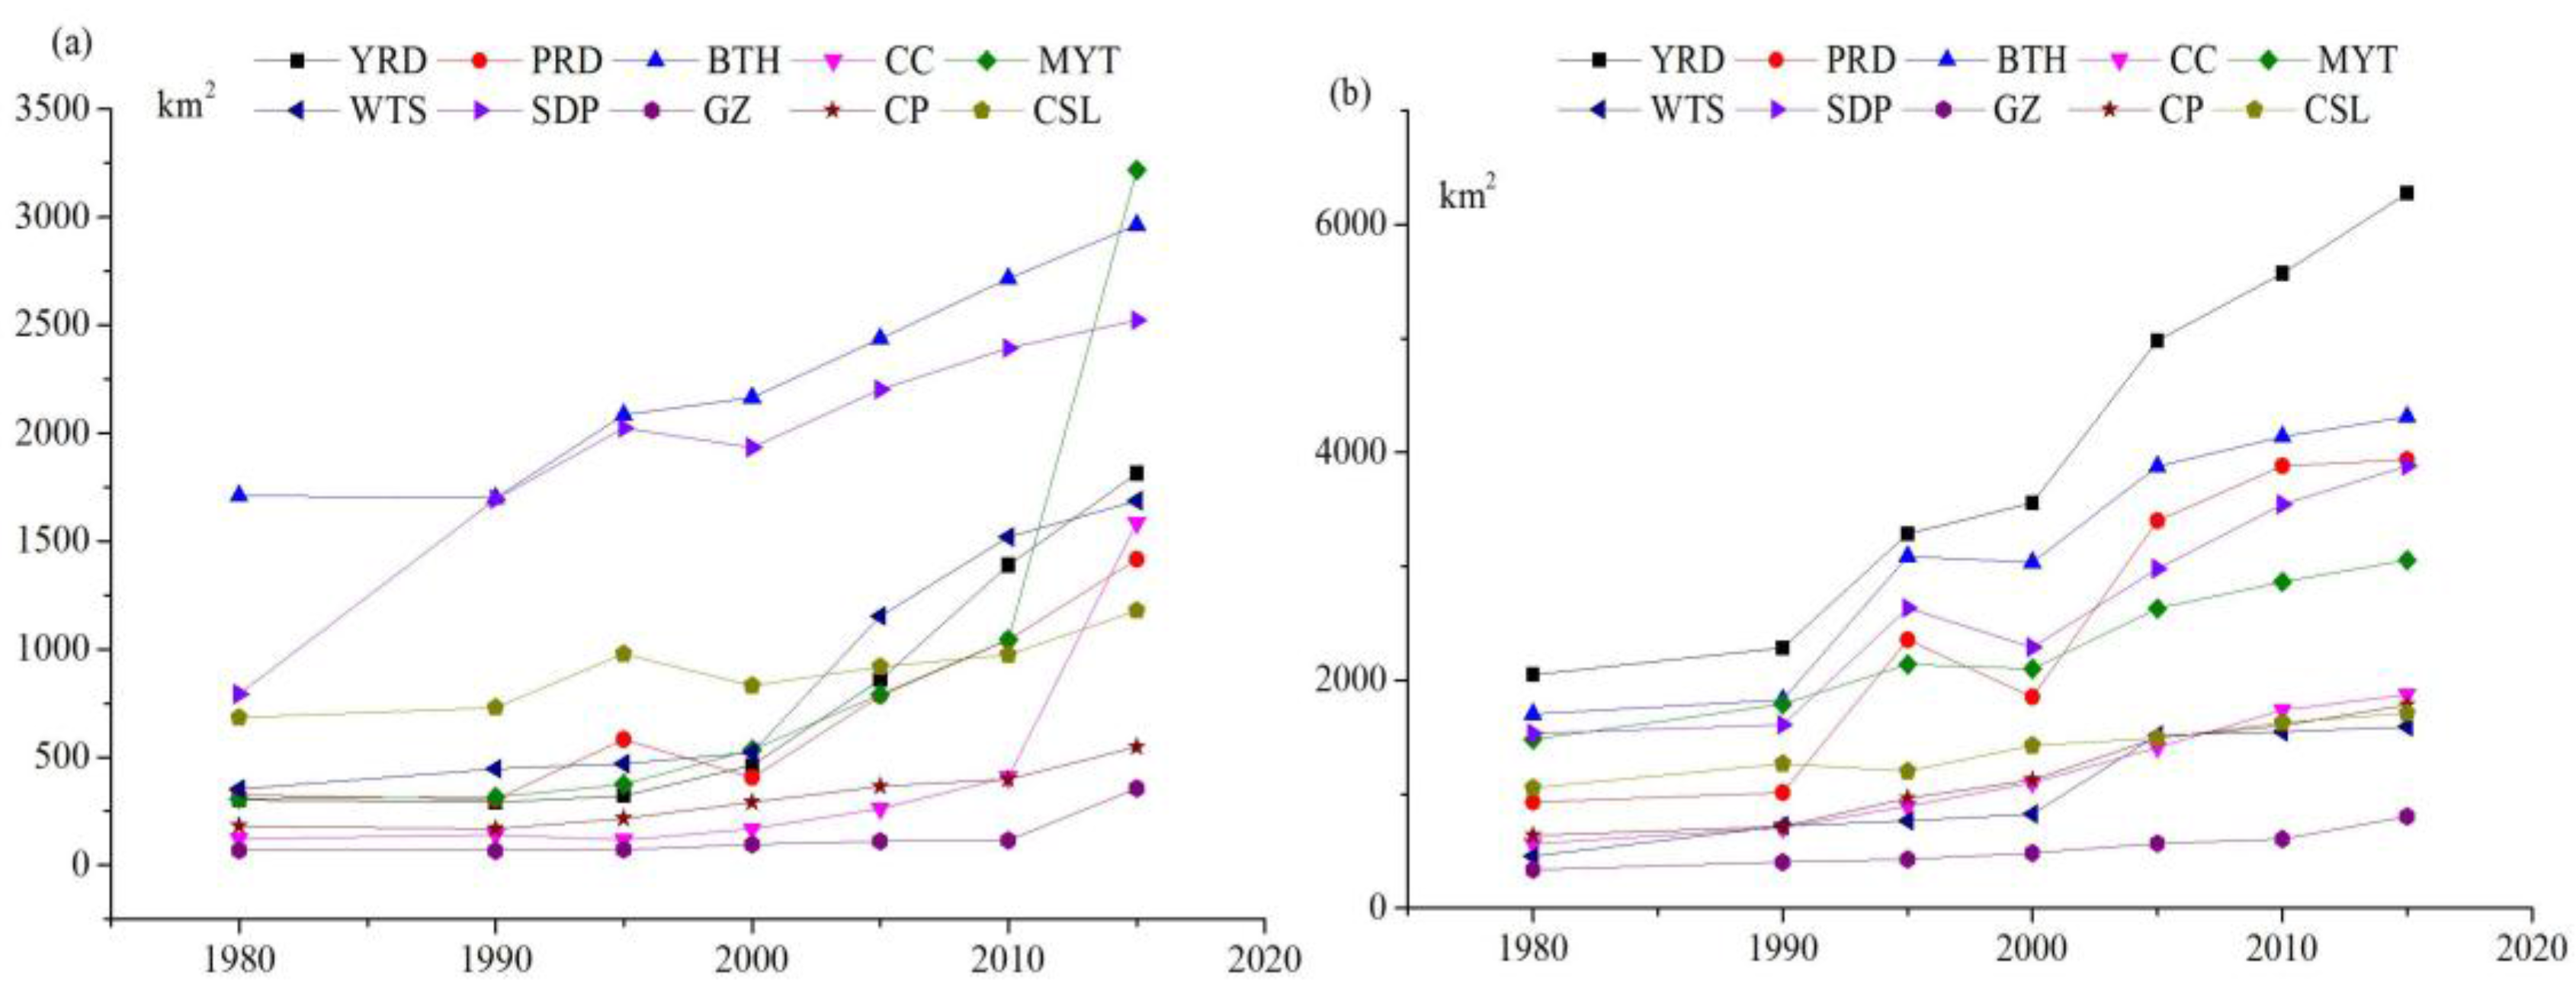
- In 2015, MYT had the largest IPL area, which was up to 3218 km2. The most rapid period of its expansion was during 2010–2015. As to different UAs, the rank (from high to low) of IPL area was MYT, BTH, SDP, YRD, WTS, CC, PRD, CSL, CP, and GZ in 2015. GZ had the smallest IPL area, which was only 355 km2. There were different growth rates in different UAs, and it is possible because of different UAs’ functions and the impacts of national policies.
- (2)
- In 2015, YRD had the largest ULL area, 6276 km2, followed by BTH and PRD, while GZ had the smallest ULL area, only 804 km2.
- (3)
- There was slow growth or negative growth of IPL and ULL for all UAs during 1995–2000.
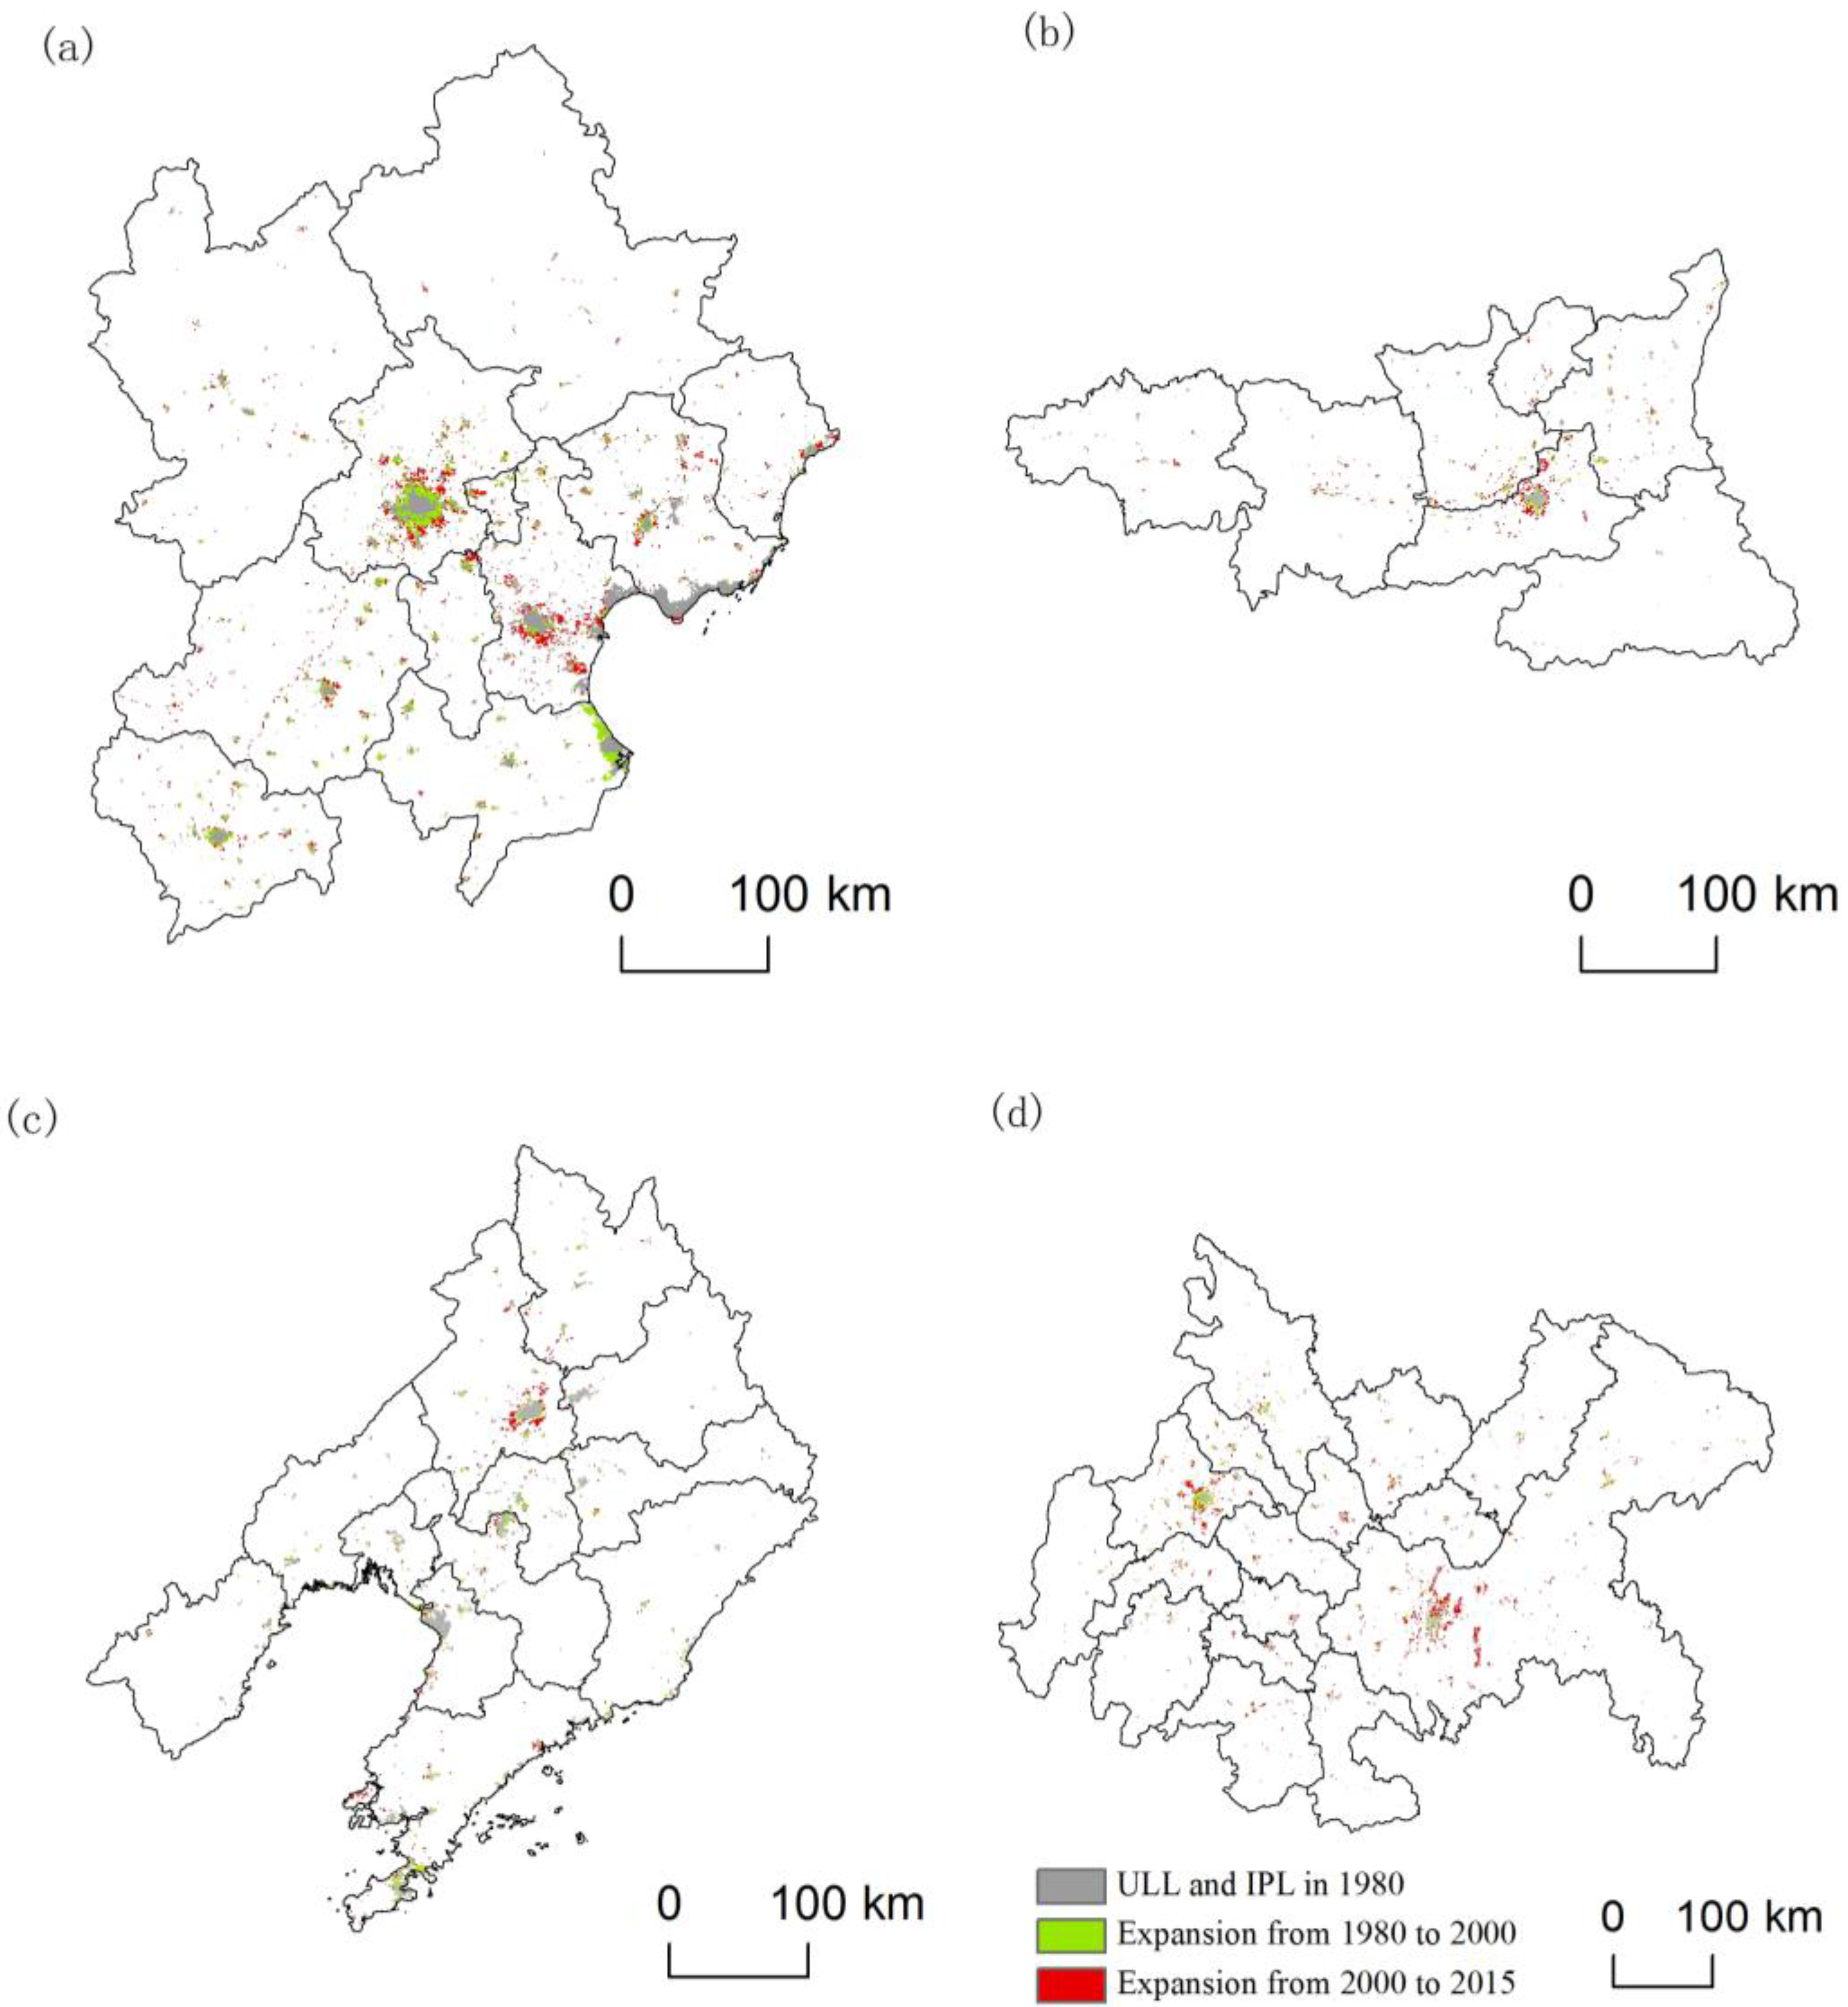
4.2. Spatial—Temporal Patterns of EPL
- (1)
- There were different spatial patterns of expansions in different cities. Most cities showed a “standing pancake” feature, and the growth patterns showed a “Concentric circle” feature.
- (2)
- There were also different expansion rates of ULL and IPL in different UAs: the national UAs including YRD, BTH, and PRD had higher expansion rates than the regional UAs. As to different regional zones, the growth pattern of ULL and IPL showed spatial heterogeneity. The growth rates ranked from high to low were as follows: eastern UAs, central zone UAs, western UAs and northeast UAs. However, as time goes on, the hot spots of rapid growth gradually moved from the eastern UAs to the central and western UAs.
- (3)
- All of the ULL and IPL areas in core cities were larger than those in non-core cities, such as Beijing and Tianjin cities in BTH; Shenyang city in CSL; and Chengdu and Chongqing cities in CC. It is clear that the population and industrial resources continue to concentrate in large cities.
4.3. Impacts of Policies on the Changes of EPL
- (1)
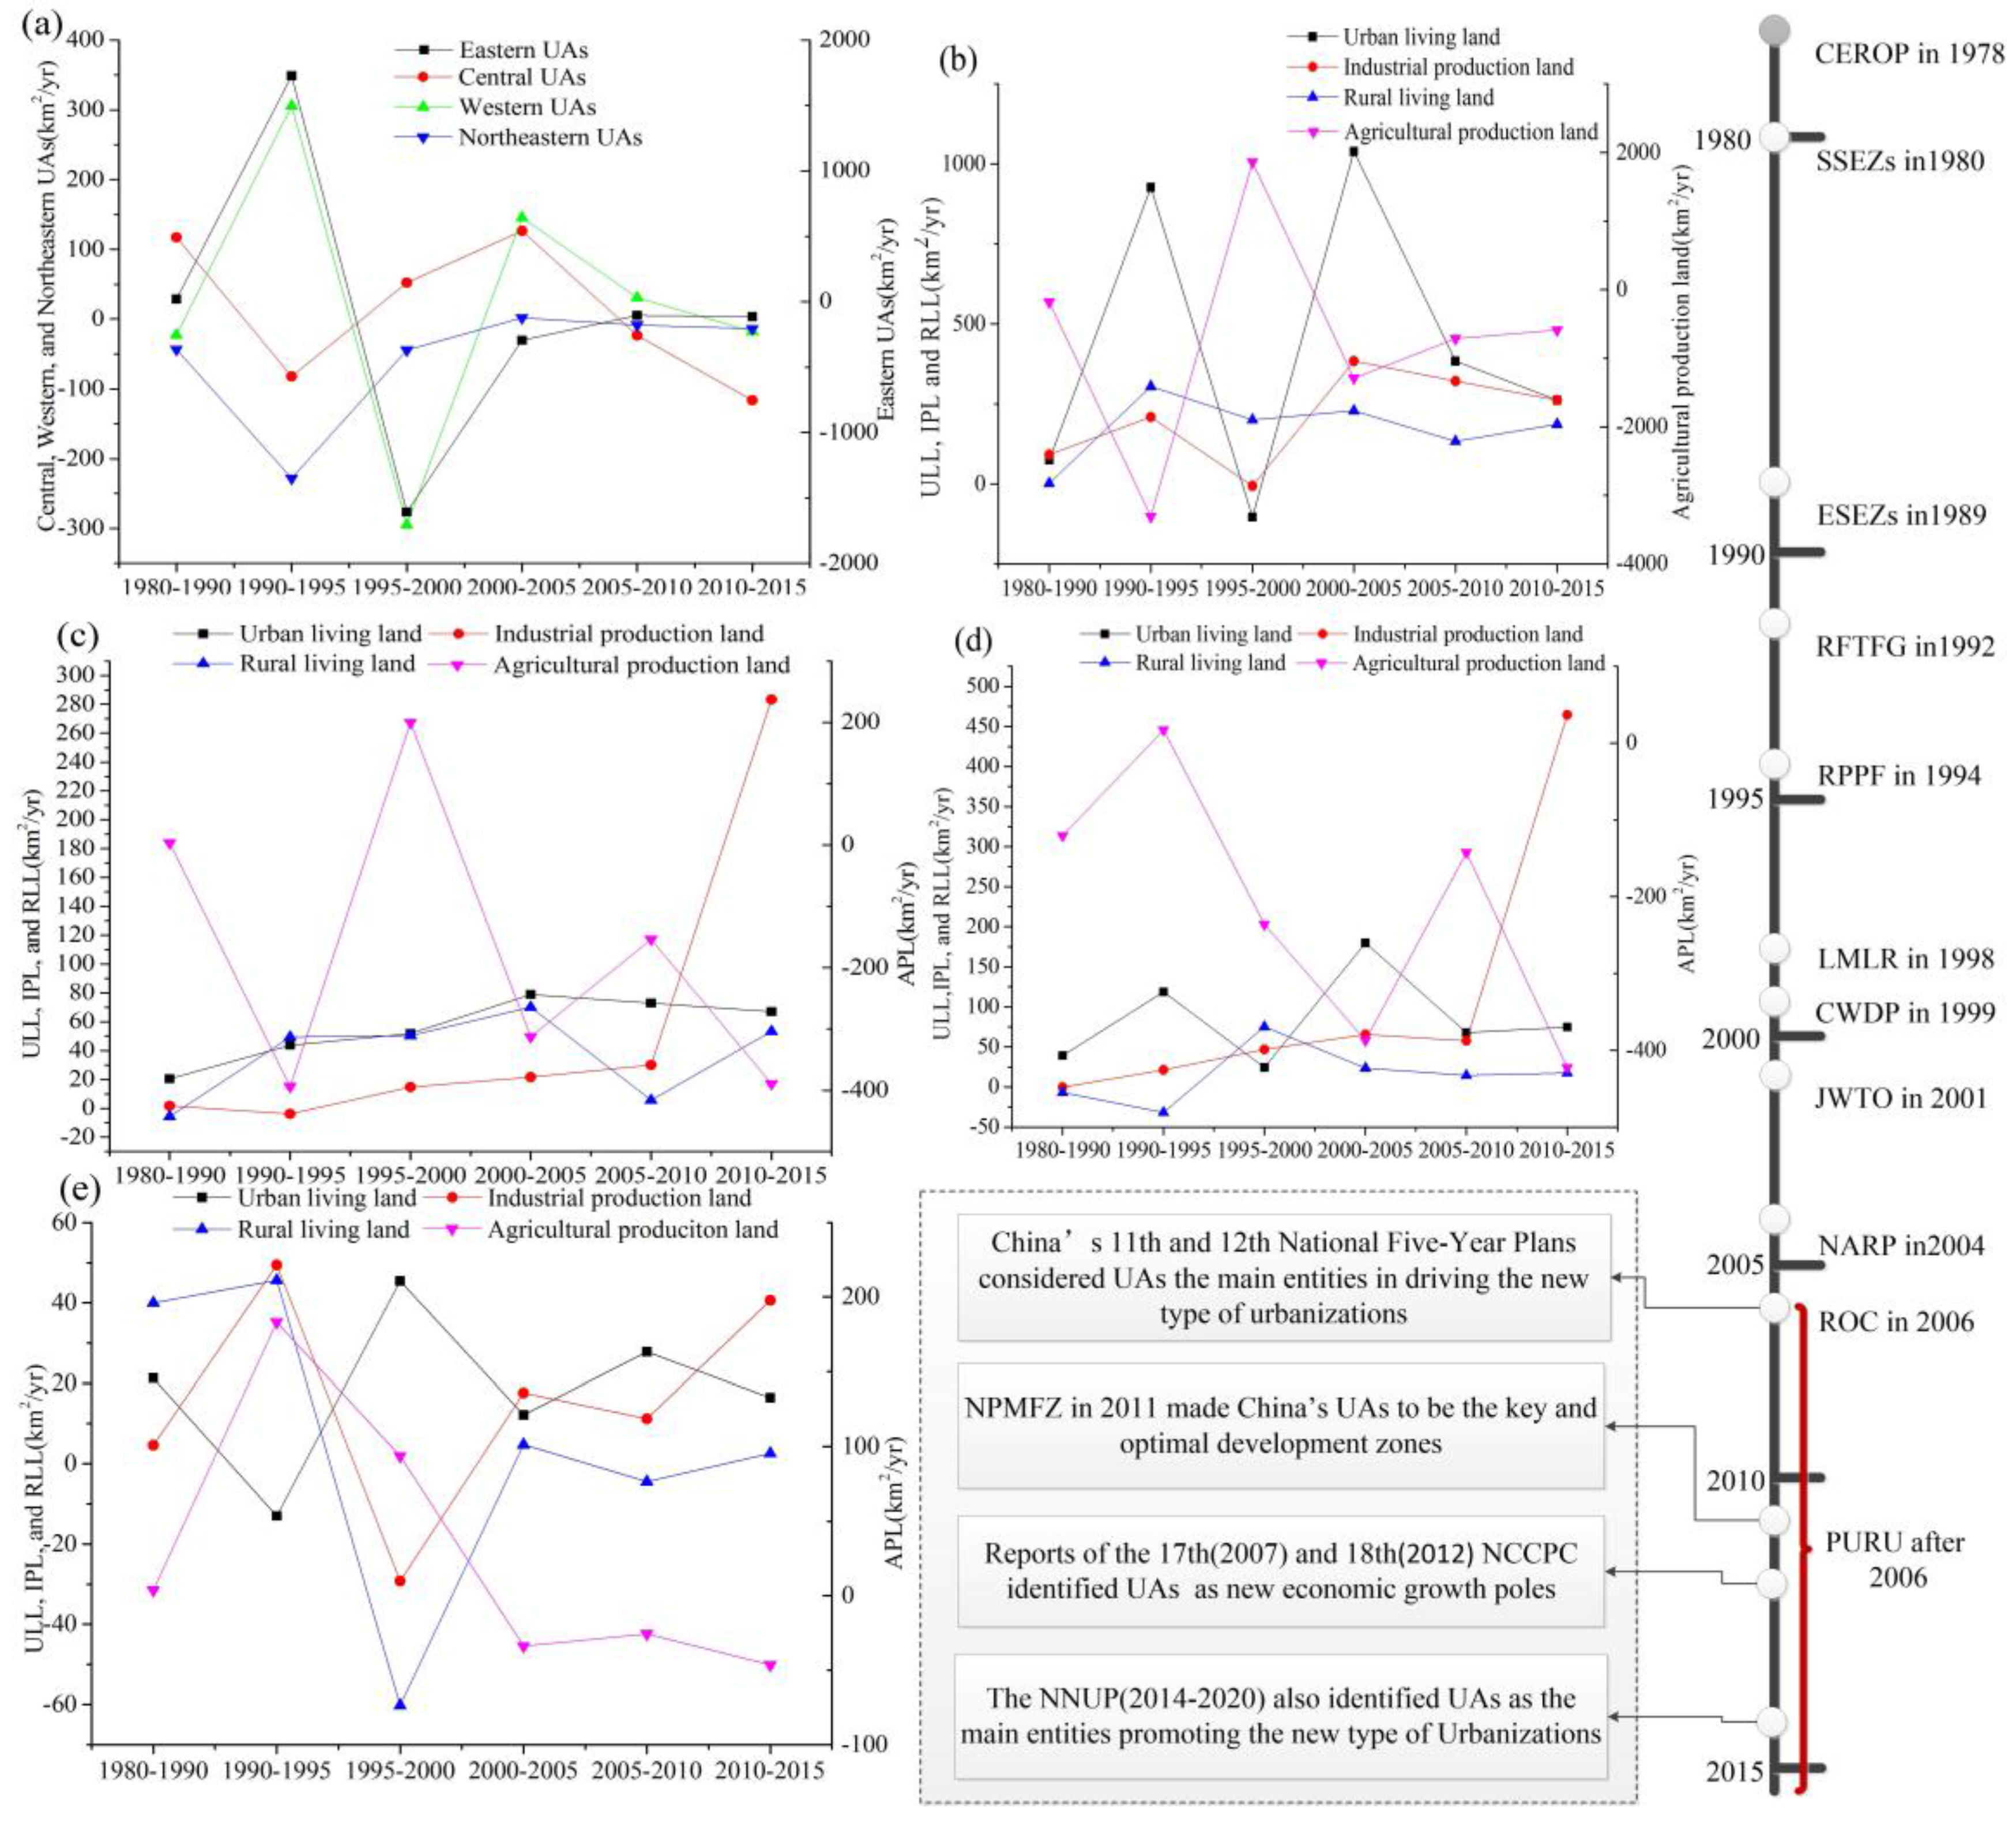
- With the implementation of reform and opening up in 1978, Chinese urbanization and industrialization accelerated rapidly. Setting up special economic zones in four eastern coastal cities in 1980 and further extending the coastal special economic zones in 1989 had greatly stimulated the rapid development of the eastern coastal UAs. There was a substantial increasing trend of ULL and IPL in eastern UAs (Figure 7b), and the growth rate in eastern UAs was faster than that in central zone, western zone, and northeastern UAs.
- (2)
- With the implementation of returning farmland to forest and grassland in 1992, there was a significant reduction in APL from 1990 to 1995. The reduction rate of APL was 3454 km2/year in this period, while the expansion rate of EL was 1757 km2/year. There were continuous transformations from APL to EL and ULL during 1990–1995 (Figure 7a and Table 4). On the contrary, regulations on the protection of prime farmland in 1994 had greatly stimulated a great increase in APL, which was increased by 9209 km2 from 1990 to 1995. Moreover, the implementation of cultivated land conservation contributed to the serious reduction of EL and constrained the expansion of ULL and IPL in this period (Figure 7a–d and Table 4).
- (3)
- After China joined the WTO in 2001, ULL and IPL accelerated rapidly again from 2000 to 2005 (Figure 7b–e). Western development plan in 2000 promoted the increasing of IPL and ULL in western UAs from 2000 to 2010 (Figure 7c). Northeast area revitalization plan in 2004 also promoted the increase of ULL in northeastern UAs from 2005 to 2010 (Figure 7e). Rising of Central China Plain in 2006 had little effects on the expansion of IPL and ULL. On the contrary, there was a decrease trend of IPL and ULL during 2005–2010 (Figure 7d).
- (4)
- With the promoting UAs as the main spaces for pushing forward the new type urbanization after 2006, China had implemented a series of policies to stimulate the development of UAs (Figure 7). All of these national policies had brought new opportunities for the socioeconomic development of UAs, especially for western, central, and northeastern UAs. As a result, IPL in western, central, and northeastern UAs were increased rapidly from 2010 to 2015 (Figure 7c–e and Table 4).
4.4. Impacts of Socioeconomic Factors on the Changes of EPL
4.4.1. Impacts of Population and GDP on the Changes of ULL and IPL
- (1)
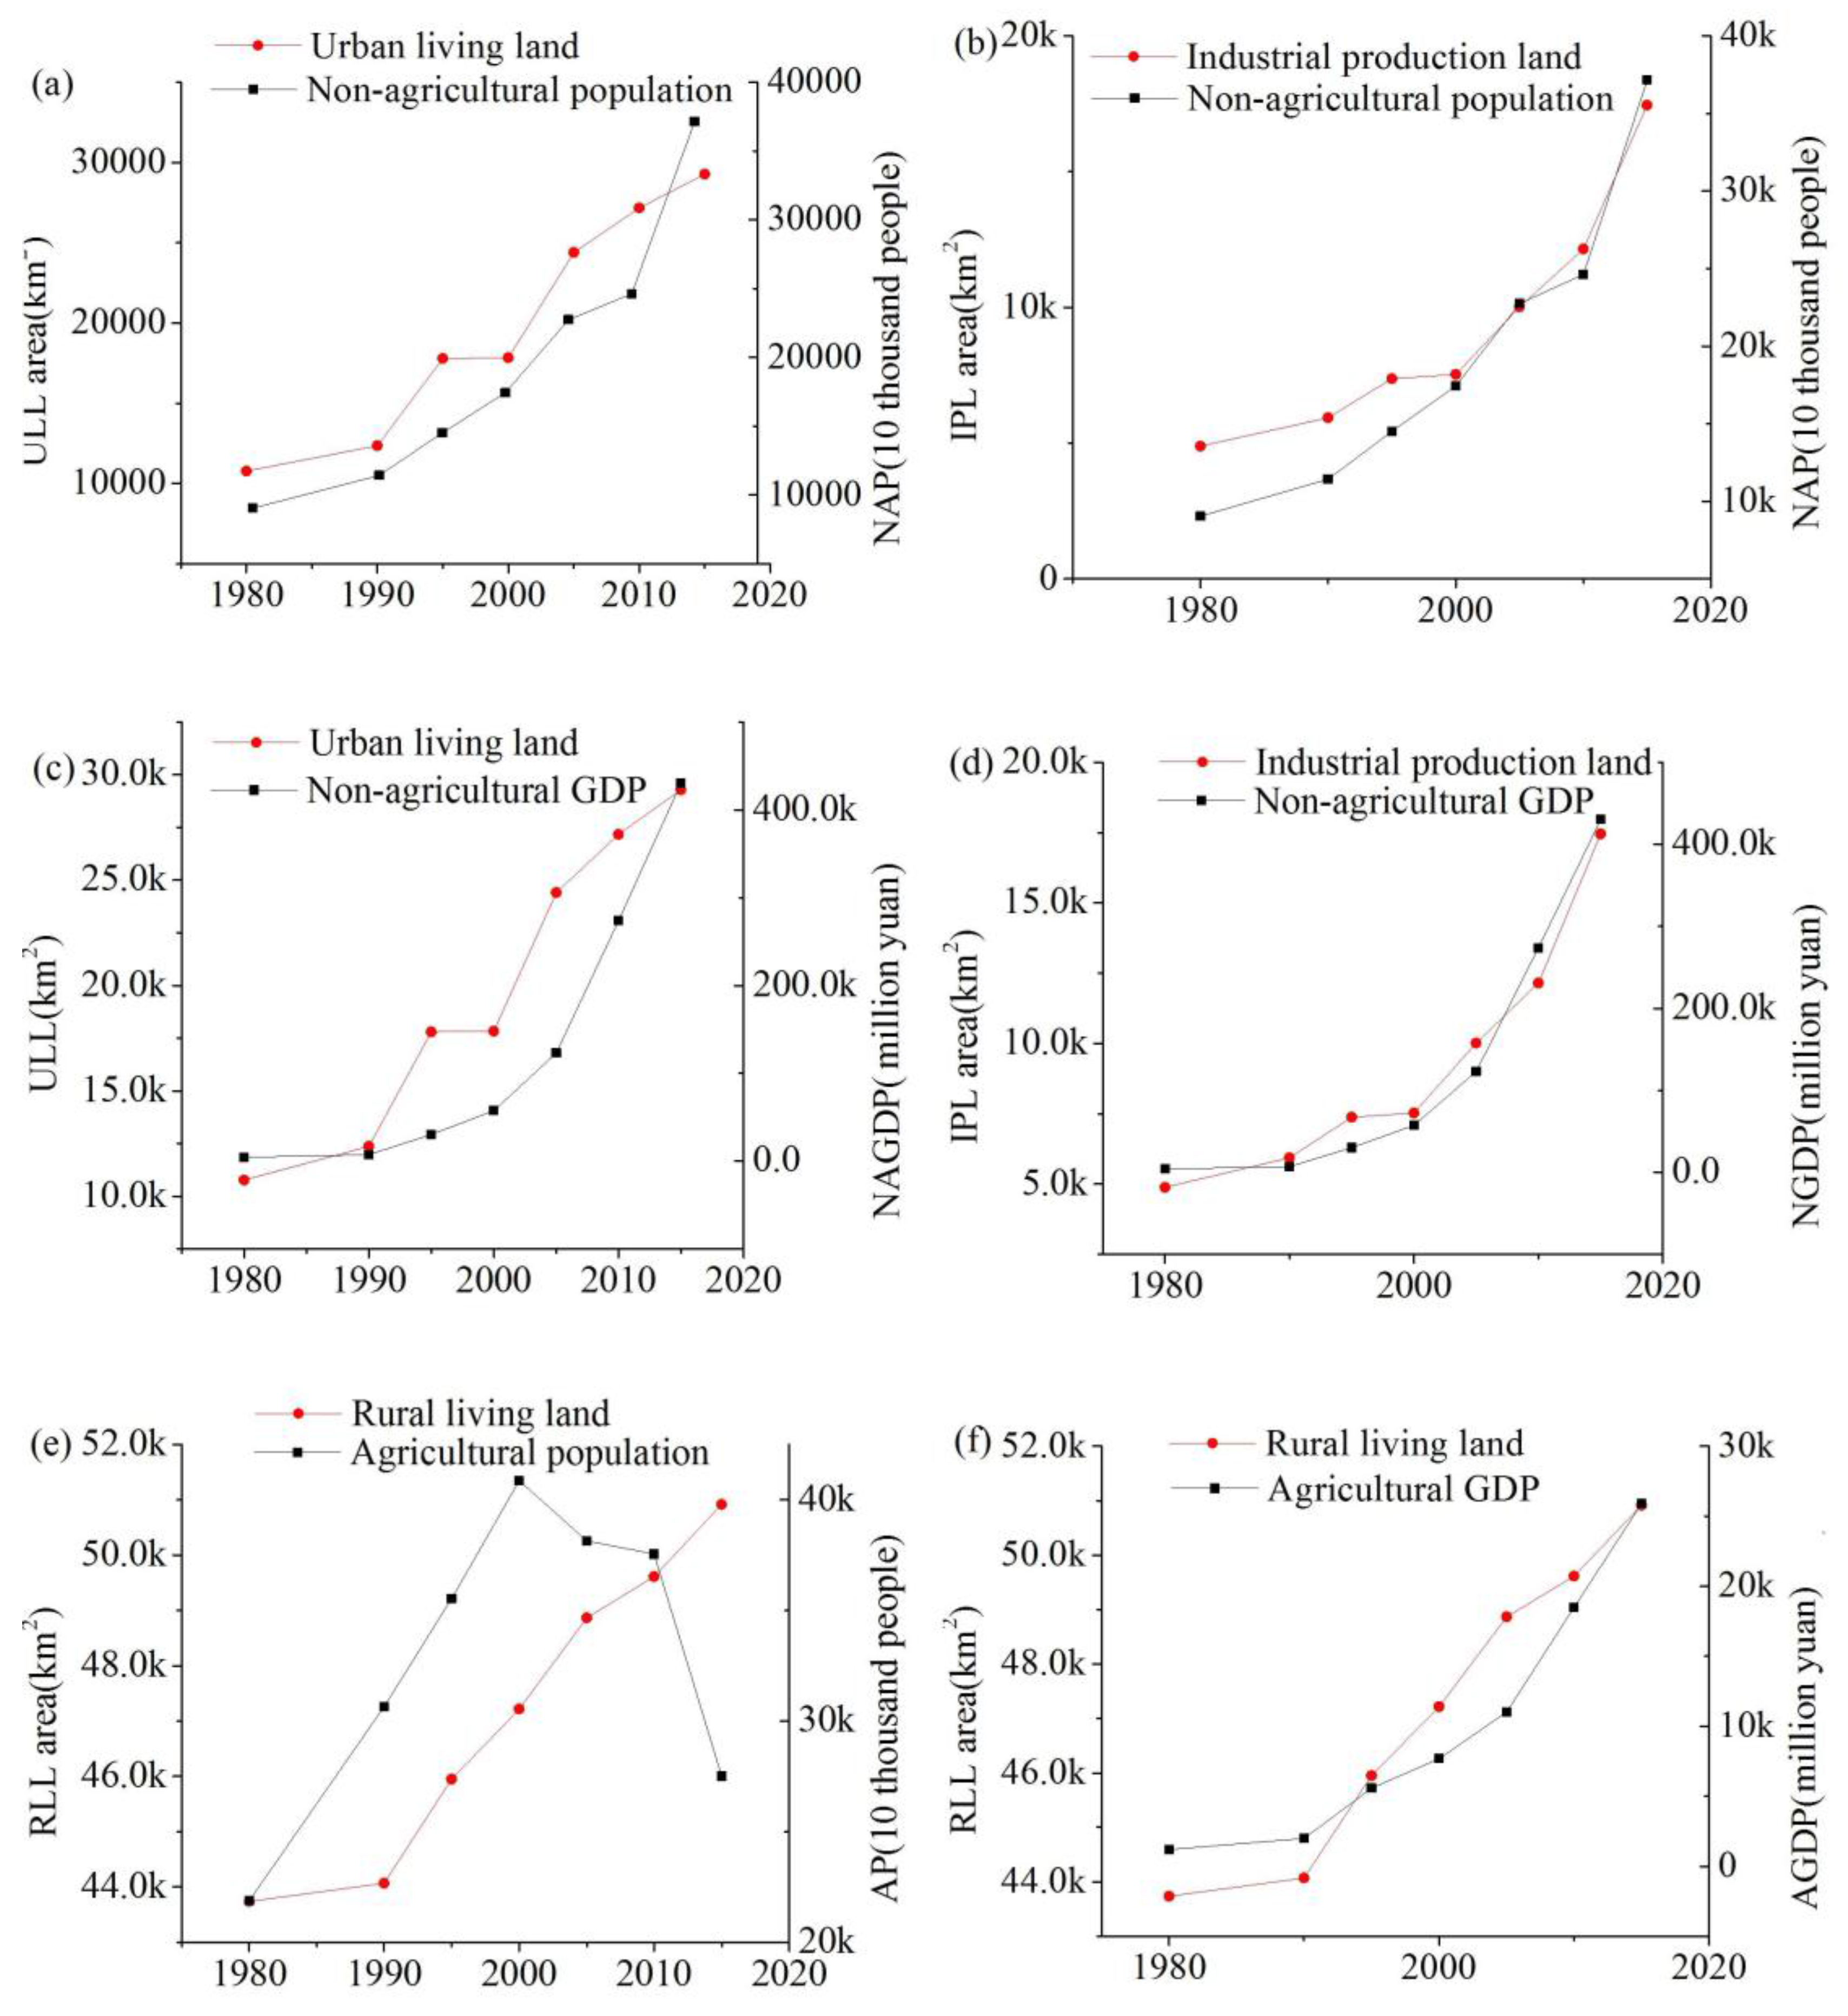
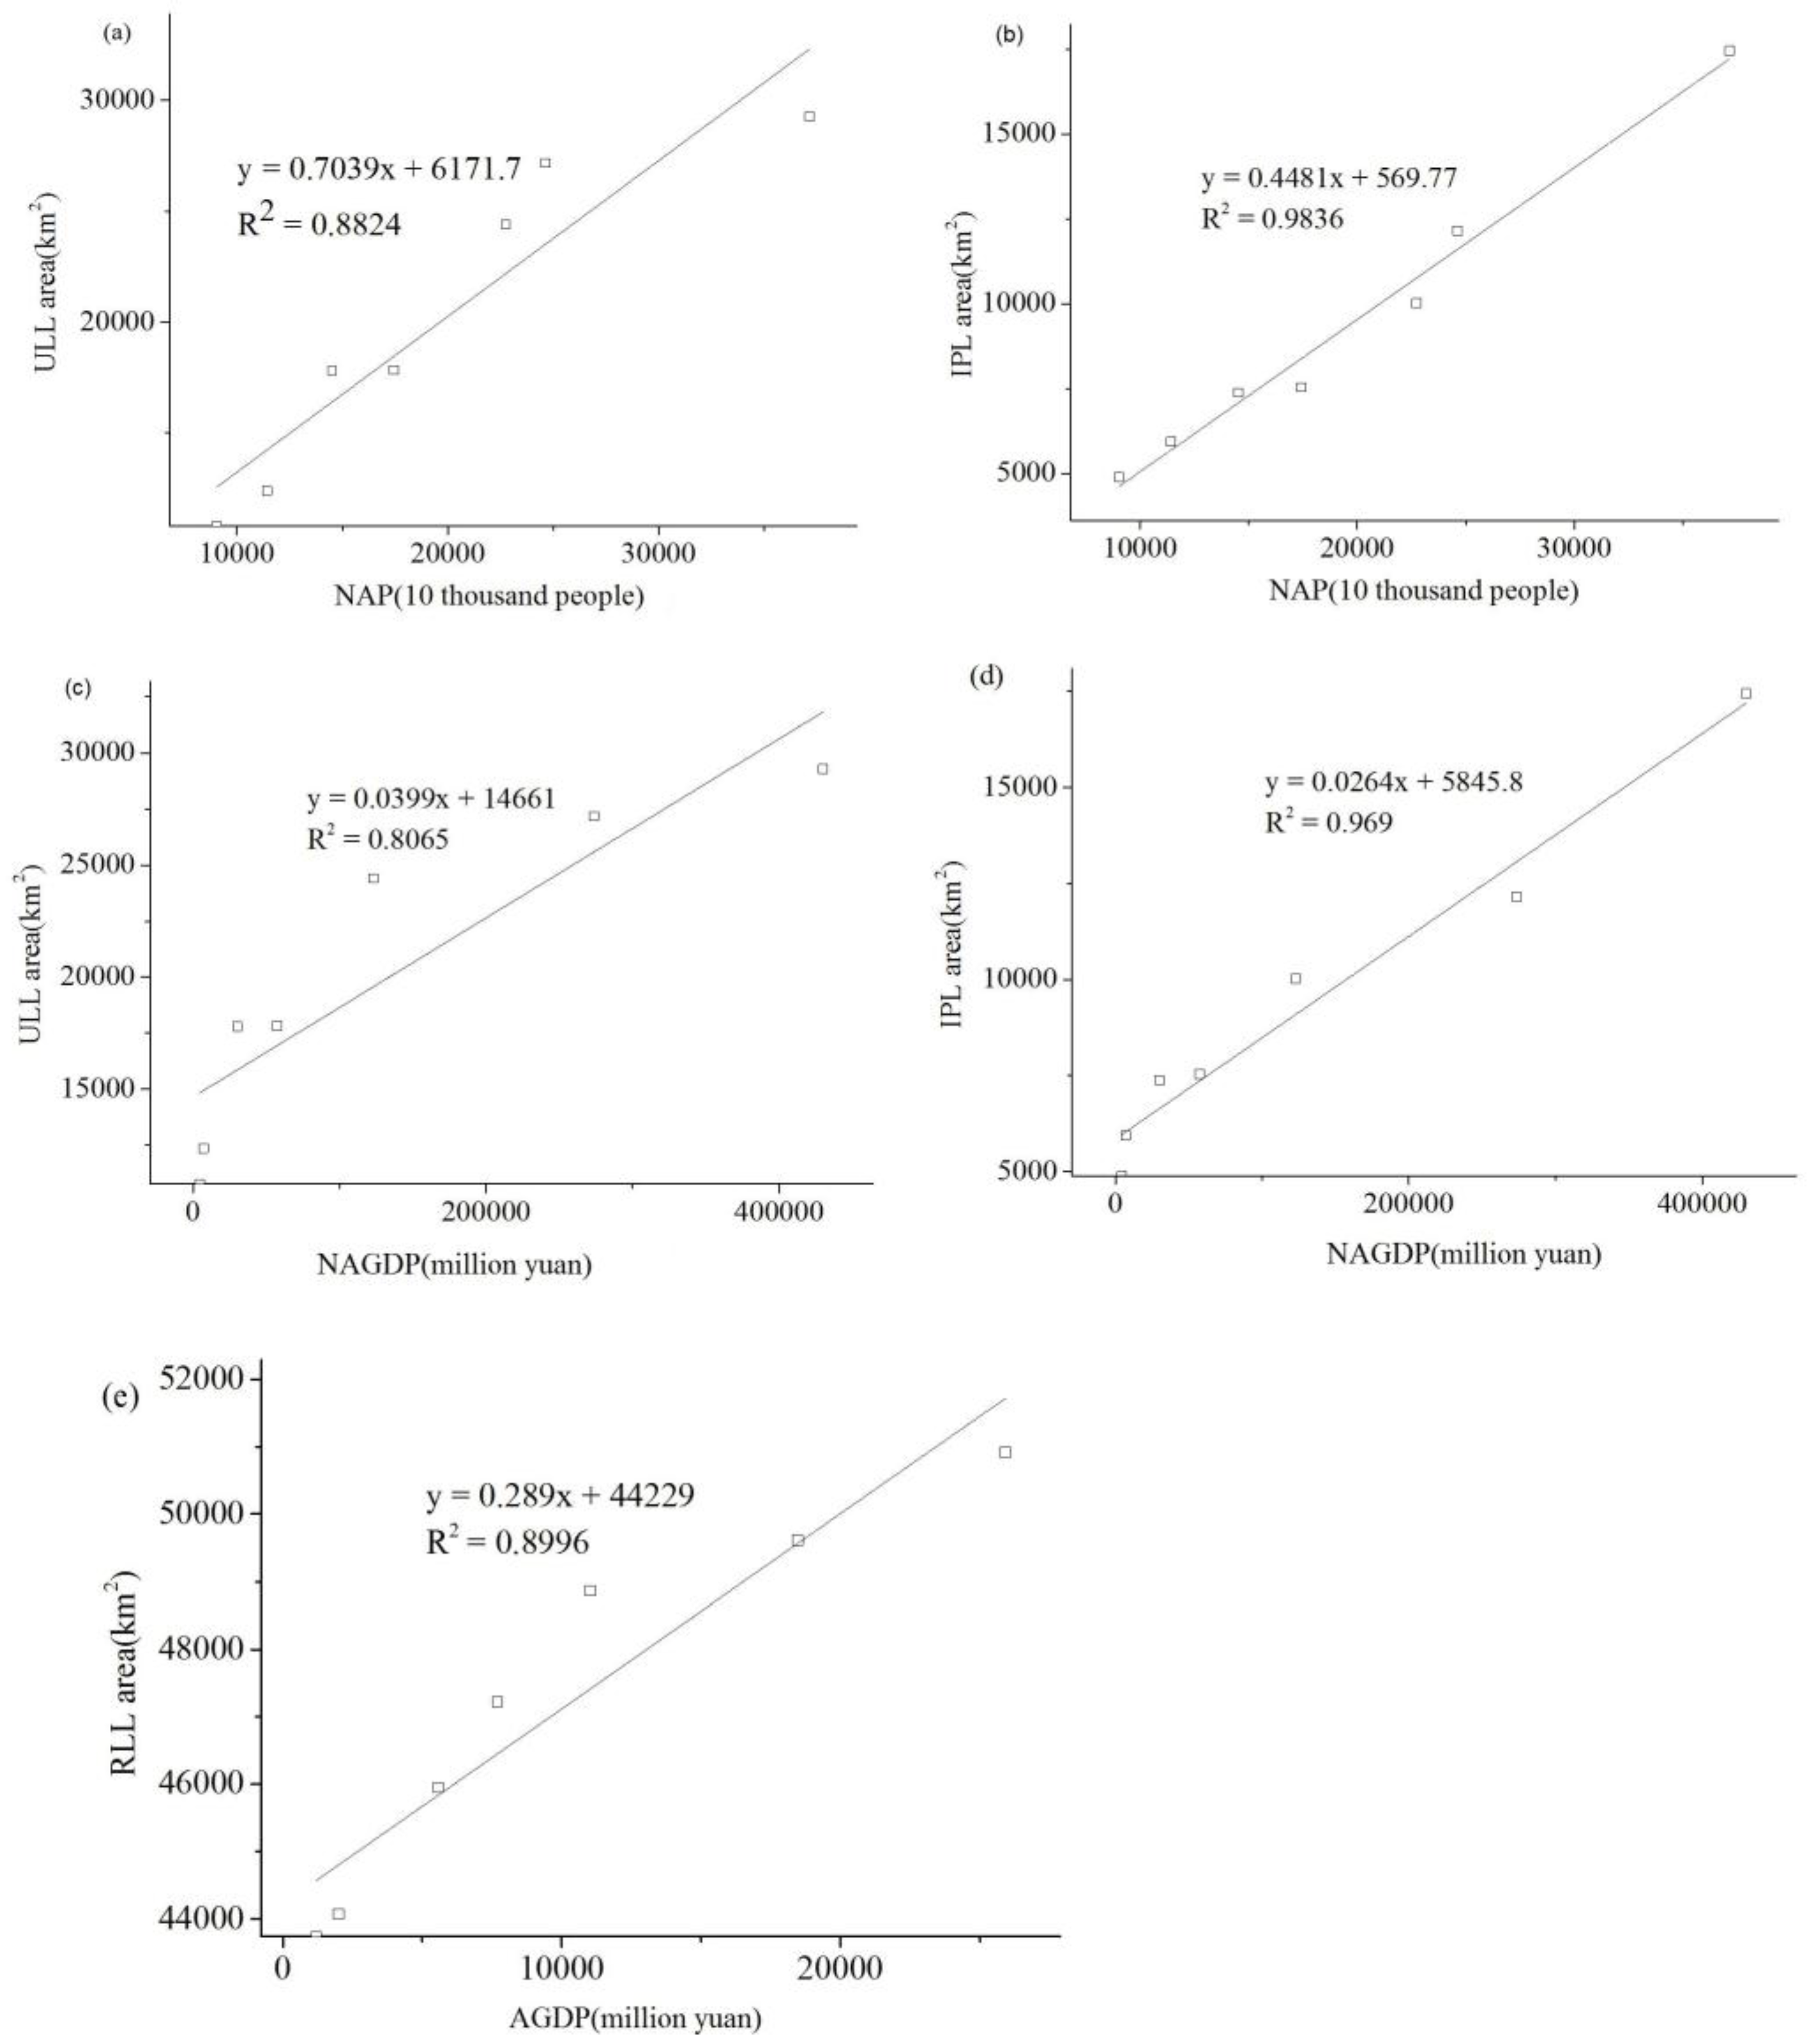
- Non-agricultural population (NAP): NAP increased from 90.47 million people in 1980 to 371.47 million people in 2015 and had an increase of ~3.11 times. It had a constant stimulation for the increase in ULL and IPL. The correlation coefficient R2 was 0.88 (Figure 8a), and 0.98 (Figure 8b) between NAP and ULL area, and NAP and IPL area, respectively. In addition, there was a good consistent increase trend both of them (Figure 9a,b).
- (2)
- Non-agricultural GDP (combined second and tertiary industry GDP, NAGDP): The rapid increase in NAGDP had an effective impact on the expansion of ULL, and it increased from 441.8 billion Yuan in 1980 to 43,011 billion Yuan in 2015, which had an increase of ~96.35 times. The correlation coefficient R2 between NAGDP and ULL area was 0.80 (Figure 8c), but the growth trend between them was not completely consistent, especially in periods of 1995–2000 and 2000–2005. It implied that to some extent, the EPL changes in UAs were more influenced by the policies than the market economy. The rapid increase in NAGDP also greatly stimulated the increase in IPL. The correlation coefficient R2 between NAGDP and IPL area was 0.96 (Figure 8d) and there was a consistent growth trend between them, except for the period during 1995–2000.
4.4.2. Impacts of Population and GDP on the Changes of RLL and APL
- (1)
- Agricultural population (AP): The AP increased from 218.85 million people in 1980 to 275.11 million people in 2015, and had an increase by 56.26 million people. It had a constant stimulation for the increase in RLL. However, the correlation coefficient R2 between them was low. As can be seen in Figure 9e, the growth trend was consistent before 2000. With the rapidly accelerated urbanization after 2000 in China, there was a sharp decrease in AP. The correlation coefficient R2 between APL and AP was also low during 1980–2015.
- (2)
- Agricultural GDP (AGDP): The rapid increase in AGDP had greatly promoted the growth of RLL. It was increased from 119.9 billion Yuan in 1980 to 25,911 billion Yuan in 2015, and had an increase of ~20.61 times. As can be seen in Figure 8e, the correlation coefficient R2 was high between AGDP and RLL, which was up to 0.89, and the growth trend between them was consistent (Figure 9f). The correlation coefficient R2 between APL area and AGDP was low during 1980–2015. This implied that APL changes were mainly affected by policies.
5. Discussion
5.1. Spatial-Temporal Trajectories of EPL during 1980–2015
5.2. The Main Driving Factors of EPL Spatial-Temporal Changes
5.3. The Rationality of Our EPL Classification System and the Effectiveness of Chinese Remotely-Sensed LUCC Product-Based Research
5.4. Policy Enlightenment of EPL Spatial-Temporal Trajectories in Chinese UAs
6. Conclusions
Acknowledgments
Author Contributions
Conflicts of Interest
Nomenclature
| AGDP | agricultural GDP |
| AP | agricultural population |
| APL | agricultural production land |
| BTH | Beijing-Tianjin-Hebei UA |
| CC | Chengdu-Chongqing UA |
| CP | Central Plain UA |
| CPC | National Congress of the Communist Party of China |
| CSL | Central and southern Liaoning UA |
| EL | ecological land |
| EPL | Ecology-Production-Living Land |
| ETM+ | Enhanced Thematic Mapper |
| GDP | Gross Domestic Product |
| GZ | Guanzhong UA |
| IPL | industrial production land |
| LUCC | Land-Use and Land-Cover Change |
| MYT | Middle Yangtze UA |
| NAGDP | non-agricultural GDP (combined second and tertiary industry, NAGDP) |
| NAP | non-agricultural population |
| OLI | Operational Land Imager |
| PRD | Pearl River Delta UA |
| RESDC | Data Center for Resources and Environmental Sciences, Chinese Academy of Sciences |
| RLL | rural living land |
| SDP | Shandong Peninsula UA |
| TM | Thematic Mapper |
| UA | urban agglomeration |
| UAs | urban agglomerations |
| ULL | urban living land |
| WTO | World Trade Organization |
| WTS | Western Taiwan Strait UA |
| YRD | Yangtze River Delta UA |
References
- United Nations, Department of Economic and Social Information and Policy Analysis. World Urbanization Prospects, 3rd ed.; United Nations, Department of Economic and Social Information and Policy Analysis: New York, NY, USA, 2012. [Google Scholar]
- Taubenböck, H.; Wegmann, M.; Roth, A.; Mehl, H.; Dech, S. Urbanization in India—Spatiotemporal analysis using remote sensing data. Comput. Environ. Urban Syst. 2009, 33, 179–188. [Google Scholar] [CrossRef]
- Liu, X.; Derudder, B.; Taylor, P. Mapping the evolution of hierarchical and regional tendencies in the world city network, 2000–2010. Comput. Environ. Urban Syst. 2014, 43, 51–66. [Google Scholar] [CrossRef]
- Yue, W.; Zhang, L.; Liu, Y. Measuring sprawl in large Chinese cities along the Yangtze River via combined single and multidimensional metrics. Habitat Int. 2016, 57, 43–52. [Google Scholar] [CrossRef]
- Zhou, D.; Xu, J.; Wang, L.; Lin, Z. Assessing urbanization quality using structure and function analyses: A case study of the urban agglomeration around Hangzhou Bay (UAHB), China. Habitat Int. 2015, 49, 165–176. [Google Scholar] [CrossRef]
- He, C.; Chen, T.; Mao, X.; Zhou, Y. Economic transition, urbanization and population redistribution in China. Habitat Int. 2015, 51, 39–47. [Google Scholar] [CrossRef]
- Lang, W.; Chen, T.; Li, X. A new style of urbanization in China: Transformation of urban rural communities. Habitat Int. 2016, 55, 1–9. [Google Scholar] [CrossRef]
- Fang, C. Important progress and future direction of studies on China’s urban agglomerations. J. Geogr. Sci. 2015, 25, 1003–1024. [Google Scholar] [CrossRef]
- Bach, P.M.; Staalesen, S.; Mccarthy, D.T.; Deletic, A. Revisiting land use classification and spatial aggregation for modelling integrated urban water systems. Lands. Urban Plan. 2015, 143, 43–55. [Google Scholar] [CrossRef]
- Verstegen, J.A.; Karssenberg, D.; Hilst, F.V.D.; Faaij, A.P.C. Detecting systemic change in a land use system by Bayesian data assimilation. Environ. Model. Softw. 2015, 75, 424–438. [Google Scholar] [CrossRef]
- Zhang, Y. Multiple-use forestry vs. forestland-use specialization revisited. For. Policy Econ. 2005, 7, 143–156. [Google Scholar] [CrossRef]
- Lian, H.; Lejano, R.P. Interpreting Institutional Fit: Urbanization, Development, and China’s “Land-Lost”. World Dev. 2014, 61, 1–10. [Google Scholar] [CrossRef]
- Pan, J. From industrial toward ecological in China. Science 2012, 336, 1397. [Google Scholar] [CrossRef] [PubMed]
- Wei, Y.D.; Ye, X. Urbanization, land use, and sustainable development in China. Stoch. Environ. Res. Risk Assess. 2014, 28, 755–755. [Google Scholar] [CrossRef]
- Zhu, J. Governance over land development during rapid urbanization under institutional uncertainty, with reference to periurbanization in Guangzhou metropolitan region, China. Environ. Plan. Gov. Policy 2013, 31, 257–275. [Google Scholar] [CrossRef]
- Zhu, Y.G. Environmental impacts of rapid urbanization in China: A showcase of recent research developments. Environ. Sci. Pollut. Res. 2012, 19, 1351. [Google Scholar] [CrossRef] [PubMed]
- Wang, L.; Chou, K.C.; Seetharaman, S. A comparison of traditional geometrical models and mass triangle model in calculating the surface tensions of ternary sulphide melts. Calphad 2008, 32, 49–55. [Google Scholar] [CrossRef]
- Wang, S.Y.; Liu, J.S.; Yang, C.J. Eco-Environmental Vulnerability Evaluation in the Yellow River Basin, China. Pedosphere 2008, 18, 171–182. [Google Scholar] [CrossRef]
- Yang, G.; Chen, Z. RS-based fuzzy multiattribute assessment of eco-environmental vulnerability in the source area of the Lishui River of northwest Hunan Province, China. Nat. Hazards 2015, 78, 1–17. [Google Scholar] [CrossRef]
- Gao, C.; Zhou, P.; Jia, P.; Liu, Z.; Wei, L.; Tian, H. Spatial driving forces of dominant land use/land cover transformations in the Dongjiang River watershed, Southern China. Environ. Monit. Assess. 2016, 188, 1–15. [Google Scholar] [CrossRef] [PubMed]
- Ge, X.; Dong, K.; Luloff, A.E.; Wang, L.; Xiao, J. Impact of land use intensity on sandy desertification: An evidence from Horqin Sandy Land, China. Ecol. Indic. 2015, 61, 346–358. [Google Scholar] [CrossRef]
- The Report on the Government’s Work Delivered at the Fourth Session of the Twelfth National People’s Congress. Available online: http://english.gov.cn/premier/news/2016/03/17/content_281475309417987.htm (accessed on 17 March 2017).
- Fang, C.; Mao, Q.; Pengfei, N.I. Discussion on the scientific selection and development of China’s urban agglomerations. Acta Geogr. Sin. 2015, 70, 515–527. [Google Scholar]
- Chinese remotely-sensed LUCC product. Available online: http://www.resdc.cn (accessed on 3 January 2017). (In Chinese).
- Liu, J.; Liu, M.; Tian, H.; Zhuang, D.; Zhang, Z.; Zhang, W.; Tang, X.; Deng, X. Spatial and temporal patterns of China’s cropland during 1990–2000: An analysis based on Landsat TM data. Remote Sens. Environ. 2005, 98, 442–456. [Google Scholar] [CrossRef]
- Kuang, W.; Liu, J.; Dong, J.; Chi, W.; Zhang, C. The rapid and massive urban and industrial land expansions in China between 1990 and 2010: A CLUD-based analysis of their trajectories, patterns, and drivers. Landsc. Urban Plan. 2016, 145, 21–33. [Google Scholar] [CrossRef]
- Liu, J.; Deng, X. Spatio-Temporal Patterns and Driving Forces of Urban Land Expansion in China during the Economic Reform Era. Ambio A J. Hum. Environ. 2005, 34, 450–455. [Google Scholar] [CrossRef]
- Nelson, E.; Mendoza, G.; Regetz, J.; Polasky, S.; Tallis, H.; Cameron, D.; Chan, K.M.; Daily, G.C.; Goldstein, J.; Kareiva, P.M.; et al. Modeling Multiple Ecosystem Services, Biodiversity Conservation, Commodity Production, and Tradeoffs at Landscape Scales. Front. Ecol. Environ. 2009, 7, 4–11. [Google Scholar] [CrossRef]
- Nelson, E.; Sander, H.; Hawthorne, P.; Conte, M.; Ennaanay, D.; Wolny, S.; Manson, S.; Polasky, S. Projecting Global Land-Use Change and Its Effect on Ecosystem Service Provision and Biodiversity with Simple Models. PLoS ONE 2012, 5, e14327. [Google Scholar] [CrossRef] [PubMed]


| Class | Field Survey Truth Samples (Pixels) | Total Classified Pixels | Accuracy (%) | |||||||
|---|---|---|---|---|---|---|---|---|---|---|
| classification | Cropland | Woodland | Grassland | Water area | Urban built-up area | Industrial land | Rural settlement | Other | ||
| Cropland | 930 | 22 | 24 | 2 | 6 | 2 | 26 | 8 | 1020 | 91.18 |
| Woodland | 9 | 443 | 12 | 3 | 4 | 2 | 14 | 3 | 490 | 90.41 |
| Grassland | 22 | 24 | 900 | 6 | 2 | 4 | 32 | 2 | 992 | 90.73 |
| Water area | 1 | 0 | 4 | 78 | 0 | 0 | 0 | 2 | 85 | 91.76 |
| Urban built-up area | 22 | 0 | 14 | 0 | 900 | 22 | 16 | 14 | 988 | 91.09 |
| Industrial land | 28 | 16 | 14 | 6 | 14 | 920 | 0 | 8 | 1006 | 91.45 |
| Rural settlement | 8 | 24 | 22 | 10 | 8 | 6 | 886 | 16 | 980 | 90.41 |
| Other | 20 | 21 | 6 | 11 | 4 | 14 | 10 | 750 | 836 | 89.71 |
| Total sampling pixels | 1040 | 550 | 996 | 116 | 938 | 970 | 984 | 803 | 6397 | - |
| Overall accuracy (%) | 90.78 | |||||||||
| 1st Level Classes | Subclasses | Description |
|---|---|---|
| Ecology land | Forestland | Land used for woodland, shrub land, forest land and so on |
| Grassland | Land used for high coverage grassland, medium coverage grassland, and low coverage grassland | |
| Water area | Land used for river canal, lake, reservoir pond, beach, and so on | |
| Production land | Agricultural production land | Land used for paddy land and arid land |
| Industrial production land | Land used for factories, quarries, mining, and oil-field wastes outside cities as well as land for special uses, such as roads and airports | |
| Living land | Urban living land | Land used for build-up area of large, medium and small cities and counties |
| Rural living land | Land used for rural residential outside cities and counties | |
| Others | Unused land | Unused land such as desert , saline-alkali land and so on |
| Classes Division | Urban Agglomerations |
|---|---|
| National level | Beijing-Tianjin-Hebei, Yangtze River Delta, Pearl River Delta |
| Region level | Chengdu-Chongqing, Middle Yangtze, Shandong peninsula, Western Taiwan Strait, Central and southern Liaoning, Central Plain, Guanzhong |
| Regional Division | Urban Agglomerations |
| Eastern coastal zones in China | Beijing-Tianjin-Hebei, Shandong peninsula, Yangtze River Delta, Pearl River Delta, Western Taiwan Strait |
| Central zones in China | Central Plain, Middle Yangtze |
| Western zones in China | Guanzhong, Chengdu-Chongqing |
| Northeastern zones in China | Central and southern Liaoning |
| 1980–1990 | 1990–1995 | 1995–2000 | 2000–2005 | 2005–2010 | 2010–2015 | 1980–2015 | |
|---|---|---|---|---|---|---|---|
| Variation rate of ecology land area (km2/year) | |||||||
| All | 69.80 | 1757.20 | −1953.80 | −21.60 | −106.20 | −265.00 | −64.26 |
| National | 84.80 | 1492.60 | −1410.80 | −140.00 | −88.60 | −93.20 | −10.06 |
| Regional | −12.00 | 258.00 | −538.20 | 117.60 | −17.80 | −169.00 | −53.34 |
| Variation rate of industrial production land area (km2/year) | |||||||
| All | 104.90 | 288.40 | 30.80 | 497.20 | 426.80 | 1059.60 | 358.94 |
| National | −4.00 | 136.20 | 9.00 | 207.80 | 213.00 | 208.60 | 109.51 |
| Regional | 109.60 | 146.60 | 19.60 | 286.60 | 212.20 | 847.80 | 247.43 |
| Variation rate of agricultural production land area (km2/year) | |||||||
| All | −280.20 | −3454.20 | 1841.80 | −2030.60 | −1037.80 | −1449.60 | −955.83 |
| National | −102.50 | −2886.20 | 1579.80 | −1000.00 | −505.40 | −442.20 | −494.14 |
| Regional | −169.50 | −575.80 | 253.00 | −1027.00 | −531.80 | −1006.60 | −461.03 |
| Variation rate of urban living land area (km2/year) | |||||||
| All | 159.50 | 1084.80 | 7.60 | 1314.00 | 554.40 | 421.80 | 528.80 |
| National | 44.40 | 719.00 | −56.80 | 763.80 | 266.20 | 185.20 | 280.89 |
| Regional | 115.00 | 363.60 | 65.60 | 549.60 | 287.80 | 235.20 | 247.40 |
| Variation rate of rural living land area (km2/year) | |||||||
| All | 33.30 | 376.20 | 253.20 | 329.40 | 149.20 | 260.40 | 205.00 |
| National | −17.40 | 426.60 | 25.00 | 184.80 | 125.80 | 149.40 | 125.26 |
| Regional | 50.70 | −52.60 | 230.20 | 144.20 | 23.20 | 110.80 | 79.60 |
© 2017 by the authors. Licensee MDPI, Basel, Switzerland. This article is an open access article distributed under the terms and conditions of the Creative Commons Attribution (CC BY) license (http://creativecommons.org/licenses/by/4.0/).
Share and Cite
Cao, S.; Hu, D.; Zhao, W.; Mo, Y.; Chen, S. Monitoring Spatial Patterns and Changes of Ecology, Production, and Living Land in Chinese Urban Agglomerations: 35 Years after Reform and Opening Up, Where, How and Why? Sustainability 2017, 9, 766. https://doi.org/10.3390/su9050766
Cao S, Hu D, Zhao W, Mo Y, Chen S. Monitoring Spatial Patterns and Changes of Ecology, Production, and Living Land in Chinese Urban Agglomerations: 35 Years after Reform and Opening Up, Where, How and Why? Sustainability. 2017; 9(5):766. https://doi.org/10.3390/su9050766
Chicago/Turabian StyleCao, Shisong, Deyong Hu, Wenji Zhao, You Mo, and Shanshan Chen. 2017. "Monitoring Spatial Patterns and Changes of Ecology, Production, and Living Land in Chinese Urban Agglomerations: 35 Years after Reform and Opening Up, Where, How and Why?" Sustainability 9, no. 5: 766. https://doi.org/10.3390/su9050766