
Performing Ecosystem Services at Mud Flats in Seocheon, Korea: Using Q Methodology for Cooperative Decision Making


Bureau of Ecological Research, National Institute of Ecology, Seocheon, Choongnam 33657, Korea
*
Author to whom correspondence should be addressed.
Sustainability 2017, 9(5), 769; https://doi.org/10.3390/su9050769
Submission received: 18 January 2017
/
Revised: 28 April 2017
/
Accepted: 1 May 2017
/
Published: 8 May 2017
(This article belongs to the Section Environmental Sustainability and Applications)
Abstract
:The concept of ecosystem services, which are the direct and indirect benefits of nature to humans, has been established as a supporting tool to increase the efficiency in decision-making regarding environmental planning. However, preceding studies on decision-making in relation to ecosystem services have been limited to identifying differences in perception, whereas few studies have reported cooperative alternatives. Therefore, this study aimed to present a method for cooperative decision-making among ecosystem service stakeholders using Q methodology. The results showed three perspectives on ecosystem services of small mud flat areas: ecological function, ecotourism, and human activity. The perspectives on cultural services and regulating services were diverse, whereas those on supporting services were similar. Thus, supporting services were considered crucial for the cooperative assessment and management of small mud flat ecosystems as well as for the scientific evaluation of regulating services. Furthermore, this study identified practical implementation measures to increase production through land management, to manufacture related souvenirs, and to link them to ecotourism. Overall, our results demonstrated the ideal process of cooperative decision-making to improve ecosystem services.
1. Introduction
The concept of ecosystem services as “benefits from nature” [1] has been established as a decision-making tool that converts ecosystems into market value [2] to assist its sustainable management [3]. Various studies have aimed to provide detailed information on provisioning, regulating, supporting, and cultural services [4] to identify correlations among said services and factors that influence them [5] and to assist stakeholders in making rational decisions [6,7]. In terms of research methodology, ecosystem service studies are different from other ecological studies, since the participants’ perspectives are reflected in converting an ecosystem into market value [8]. The ever-changing perspectives of people to evaluate ecosystem services and a decision-making method as well as an alternative plan based on the evaluation have remained unresolved tasks to a large extent.
Some researchers have investigated the differences in perception among stakeholders of ecosystem services depending on occupation [9,10], scale [11], time [12], and expertise [13]. Furthermore, other studies have aimed to establish expected scenarios to demonstrate trade-off relationships [14]. However, such methods have generally been unable to identify the extent of the differences in stakeholders’ perceptions.
Recently, numerous ecosystem service studies have been conducted using a stakeholder analysis method called Q methodology in order to analyze the complex interests involved in ecosystem services. Q methodology is a method of analyzing the interests of stakeholders, which can solve the priority puzzle based on interviews and prior research data [15]. In addition, Q methodology analyzes the interests of a small number of stakeholders, as opposed to analyzing shared traits from numerous samples; thus, it is possible to conduct research that includes a small number of participants (even one individual) [16]. Thus, Q methodology is useful for studies on ecological areas with a small number of residents [17]. Based on this advantage, perspectives toward ecosystem services have been analyzed, targeting maritime environments [18], the aquatic ecosystem of an area [19], and mangroves [20]. However, prior ecosystem service studies using Q methodology were limited to categorizing perception groups, which is the most basic analysis method; thus, they simply identified various perspectives toward ecosystem services regarding each ecological resource and failed to present detailed alternative plans for cooperation.
This study aimed to use variance analysis in Q methodology combined with correlation analysis among Q statements in order to identify alternative plans of cooperation among ecosystem service stakeholders with varying perspectives. Variance analysis in Q methodology can organize items with different perspectives and items with similar perspectives [21,22], whereas correlation analysis among Q statements is useful in seeking mutually shared solutions and presenting measures for cooperation. This methodology is useful for establishing universally agreeable alternatives for microscopic and complex issues. Overall, our main objective was to establish cooperative plans for stakeholders with constantly changing perspectives that fit the microscopic situation of the study area.
2. Methodology
2.1. Study Area
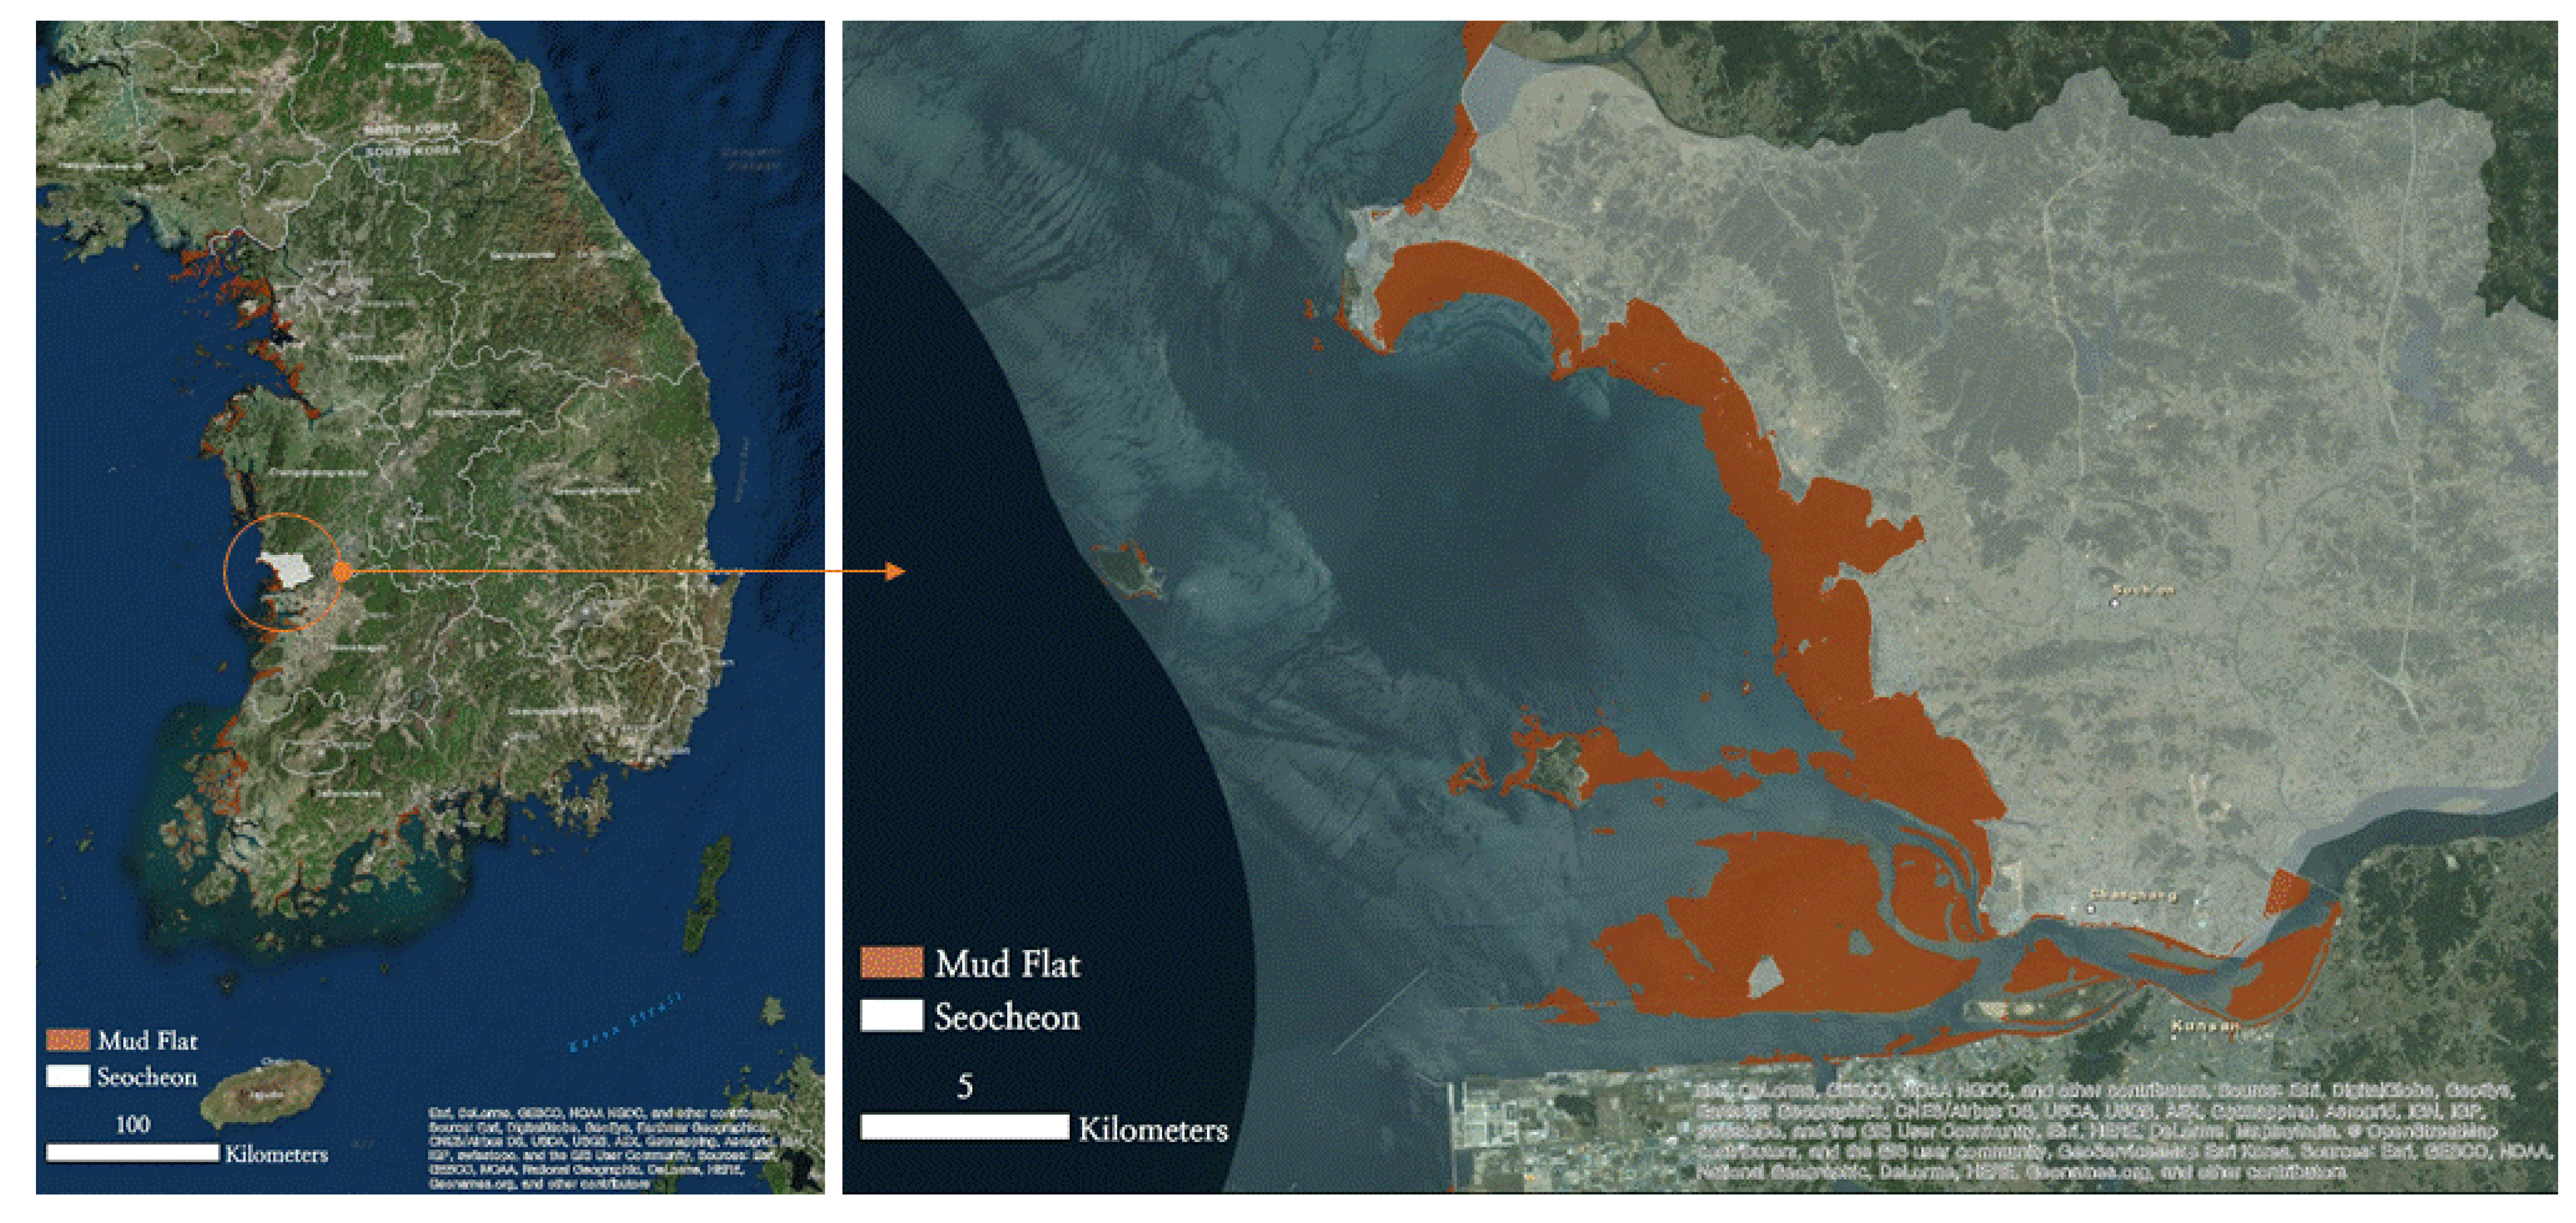
The study area is a mud flat area in Seocheon, Korea, that was designated as a Ramsar wetland in 2009 and covers 72.5 km2, including five towns. Since the coastal sand dunes and sand flats are well established, various fishery resources have been formed such as seaweed (laver and green algae), shellfish (Manila clam, Mactra veneriformis, and razor shell), and crustaceans (jumbo shrimp, blue crab, squilla, Japanese mud shrimp, and Charybdis japonica). This area supplies abundant food to migrants such as spoonbill, blackfaced spoonbill, Chinese egret, plover, Chinese goose, and bean goose that use the mud flat as a resting place (Figure 1).
2.2. Q Methodology
This study used Q methodology to present cooperative alternatives by analyzing interests related to ecosystem services. Q methodology is an analysis method that lies between qualitative and quantitative analysis. A qualitative investigation of the subject is conducted by field trips and extensive interviews, followed by priority puzzles, including numerous local stakeholders’ perspectives, which are analyzed quantitatively [15]. First, we identified local issues of the Seochoen mud flat toward ecosystem services by field trips and extensive interviews conducted from 29 April to 4 May 2016. The interviewees were people related to the village, shops, environmental non-governmental organizations (NGOs), and administrative offices that included in the guidebook for ecotourism in Seocheon. The seven participants comprised two residents of the village, two merchants, one member of environmental NGO, and three officials. The time of interview was approximately 1 h per individual.
Second, the information collected through the interviews was organized into four categories of ecosystem services: provisioning services, such as the provision of resources; regulating services, such as regulating the function of the ecosystem; supporting services, such as providing habitat for various organisms; and cultural services, such as supporting human activity through the ecosystem [1]. Subsequently, information regarding the seafood and food resources produced in the mud flat was classified under the provisioning service category, information regarding regulating climate change and erosion through the mud flat under the regulating service category, information regarding the mud flat provision of habitat for living creatures, including migrant birds, under the supporting service category, and information regarding ecotourism and aesthetic function of the mud flat under the cultural service category. Based on this categorization, 25 statements were created regarding the ecosystem service of the mud flat as shown in Table 1.
Lastly, for the quantitative study, a P sample was set, including numerous stakeholders towards ecosystem services in the Seocheon mud flat. An additional 19 subjects were selected using the snowball extraction method in addition to the seven stakeholders that participated in the previous interviews. A survey was conducted on the total of 26 participants, including residents, merchants, environmental NGO members, officials, and researchers from 2 to 5 August 2016. The survey used a questionnaire in which statements were arranged into a forced normal distribution in line with Q methodology that allowed us to verify the maximized interests. All analyses were performed using SPSS 22 (IBM Corp., Armonk, NY, USA).
3. Q Analysis
The Q factor analysis of stakeholders’ perspectives indicated six factors with an eigenvalue of 1 or higher. Each factor in Q methodology can be interpreted as a stakeholder group. The high number of groups secures diversity but decreases the clarity of interpretation [18]. The number of factors is settled by the eigenvalue, a distinguishing statement, and the number of stakeholders [23]. Factors that rapidly decreased to an eigenvalue of 2 or lower were excluded, and the study was conducted based on three factors (Table 2 and Table 3).
4. Results
4.1. Interpretation of the Group
Factor 1 included five researchers, four residents, two environmental NGO members, one official, and one merchant. They all focused on the ecological function of the mud flat and had a negative opinion about human activity. Hence, they were named the “ecological function” factor. They had a strong positive opinion about the regulating and supporting services for the mud flat, providing a +4 (Strongly Agree) for Statement 12 (Seocheon mud flat plays a role in global warming reduction by absorbing carbon), a +3 (Agree) for Statement 10 (Seocheon mud flat plays a role in pollution reduction), and a +3 (Agree) for Statement 17 (Seocheon mud flat supplies habitat for numerous organisms). However, they had a strong negative opinion about provisioning and cultural services, providing a −4 (Strongly Disagree) for Statement 6 (Seocheon mud flat provides resources for producing handicraft souvenirs), a −3 (Disagree) for Statement 19 (Seocheon mud flat is a travel experience for tourists), and a −3 (Disagree) for Statement 23 (Seocheon mud flat inspires religious activity) (Table 4).
Factor 2 included six officials, two researchers, one resident representative, and one merchant. They all thought that the mud flat was a beneficial location for ecotourism. Hence, they were named the “ecotourism” factor. They had a strong positive opinion about cultural services, supporting services, and provisioning services, providing a +4 (Strongly Agree) for Statement 19 (Seocheon mud flat is a travel experience for tourists), a +3 (Agree) for Statement 15 (Seocheon mud flat provides a resting place to migrants), and a +3 (Agree) for Statement 2 (Seocheon mud flat produces shellfish, including clam and oyster). However, they had a strong negative opinion about regulating services and cultural services not based on ecological resources, providing a −3 (Disagree) for Statement 9 (Seocheon mud flat has a disaster-regulating function for tsunamis or typhoons), a −3 (Disagree) for Statement 22 (Seocheon mud flat inspires artistic activity), and a −4 (Strongly Disagree) for Statement 23 (Seocheon mud flat inspires religious activity) (Table 4).
Factor 3 included one official and one researcher. They both had numerous concerns about cultural services associated with human activity. Hence, they were named the “human activity” factor. They had a strong positive opinion about the ecological, educational, and cultural value of the area, proving a +4 (Strongly Agree) for Statement 21 (Seocheon mud flat is beautiful), a +3 (Agree) for Statement 24 (Seocheon mud flat helps educational activity), and a +3 (Agree) for Statement 25 (Seocheon mud flat reflects the tradition of the area). However, they had a strong negative opinion about provisioning, air purification function, and carbon reduction, providing a −4 (Strongly Disagree) for Statement 4 (Seocheon mud flat is a food source), a −3 (Disagree) for Statement 7 (Seocheon mud flat has an air purification function), and a −3 (Disagree) for Statement 12 (Seocheon mud flat plays a role in global warming reduction by absorbing carbon) (Table 4).
4.2. Variation Analysis
Variation analysis was conducted to identify differences among the three factors, comparing statements between common and distinct perspectives. The results showed that Statements 12 (Seocheon mud flat plays a role in global warming reduction by absorbing carbon), 19 (Seocheon mud flat is a travel experience for tourists), 25 (Seocheon mud flat reflects the tradition of the area), 9 (Seocheon mud flat has a disaster regulating function for tsunamis or typhoons), and 21 (Seocheon mud flat is beautiful) had a large variation among the factors, revealing that the assessment methods and policies regarding regulating services and cultural services might cause some conflicts. Thus, a more accurate investigation from ecological researchers as well as proper publicity and education are necessary for reducing the variation level (Table 5).
Additionally, the results revealed that, regarding supporting services, Statements 16 (Seocheon mud flat supplies food to numerous organisms), 17 (Seocheon mud flat provides a habitat to numerous organism), and 15 (Seocheon mud flat provides a resting place to migrants) showed little variation among the factors. Regarding provisioning services, Statement 5 (Seocheon mud flat provides resources for producing cosmetics or medicines) showed a negative score with little variation. In addition, regarding cultural services, Statement 22 (Seocheon mud flat inspires artistic activity) showed a negative score with little variation, whereas Statement 24 (Seocheon mud flat helps educational activity) showed a positive score with little variation (Table 5).
4.3. Correlation Analysis of Q Statements
Correlation analysis revealed that the majority of Q statements were negatively correlated, whereas some of them were positively correlated within the same service category (regulating service and supporting service). Statement 18 (Seocheon mud flat supplies abundant soil to organisms) under the supporting service category was positively correlated with Statements 3 (Seocheon mud flat produces Webfoot octopus), 5 (Seocheon mud flat provides resources for producing cosmetics or medicines), and 6 (Seocheon mud flat provides resources for producing handicraft souvenirs) under the provisioning service category, whereas Statement 6 (Seocheon mud flat provides resources for producing handicraft souvenirs) was strongly positively correlated with Statement 19 (Seocheon mud flat is a travel experience for tourists). Therefore, many people have a positive opinion about managing the land of the mud flat to manufacture handicraft souvenirs for tourists. In addition, Statement 9 (Seocheon mud flat has a disaster-regulating function for tsunamis or typhoons) was positively related to Statement 23 (Seocheon mud flat inspires religious activity), showing that some people relate religion and natural disasters (Table 6).
5. Discussion
Using demographic information, this study concluded that human activity was a strong concern among relatively new residents in the area, whereas ecological function and ecotourism were a strong concern among long-term residents in the area, which comprised the majority of the population. Additionally, the ecological function factor included more researchers, residents, and environmental NGO members, whereas the ecotourism factor included more officials. Thus, officials focus both on the use and conservation of ecological resources, whereas researchers, residents, and environmental NGO members are more concerned about the original functions of ecological resources and their conservation (Table 7).
The results revealed the point where the interests toward ecosystem services arise. The process of identifying such points and establishing mutual understanding is necessary for ecosystem service cooperation [4]. Otherwise, conflicts will not be reduced because each stakeholder will keep their original opinion. This study showed that long-term residents mostly focus on the ecological and ecotourism function of the mud flat, whereas relatively new residents focus on the cultural service. However, all participants agreed on the importance of education under the supporting service and cultural service categories, indicating that supporting services should be strengthened in order to bridge differing opinions and establish ecosystem service cooperation in the area. In addition, more research on regulating services is required to identify practical measures to foster cooperation by increasing the production of mud flat products through a better management of land and producing souvenirs for experience-based tourists [24]. Our results provided specific alternatives to encourage cooperation in improving ecosystem services in the area.
6. Conclusions
In this study, we aimed to analyze different stakeholders’ perspectives regarding ecosystem services and identify appropriate cooperation alternatives. To this end, we used Q methodology for cooperative planning towards ecosystem services to limit the size of the representative sample from a large population. Q methodology pre-determines the number of stakeholders and aims to reveal the process of cooperative alternatives rather than identifying typical characteristics. Although our results cannot be generalized, this study was significant because it explored the process of seeking alternatives for the cooperative planning process of ecosystem services, which could be applied to other areas. Overall, further empirical research on the measures and steps of ecosystem service cooperation may improve ecosystem services under a broad consensus.
Acknowledgments
This work was supported by the National Institute of Ecology in Korea (Project number: NIE-Strategy research-2016-04).
Author Contributions
Jae-hyuck Lee designed and structured the article, and Moohan Kim, Byeori Kim, Hong-Jun Park conducted the interpretations of results. Hyuck-soo Kwon provided expertise in discussing the design proposals and conclusions. Co-authors improved this article at various stages of the writing process.
Conflicts of Interest
The authors declare no conflict of interest.
References
- Millennium Ecosystem Assessment (MEA). Ecosystems and Human Well-Being Synthesis; Island Press: Washington, DC, USA, 2005. [Google Scholar]
- Costanza, R.; D’Arge, R.; De Groot, R.; Faber, S.; Grasso, M.; Hannon, B.; Limburg, K.; Naeem, S.; O’Neill, R.V.; Paruelo, J.; et al. The value of the world’s ecosystem services and natural capital1997. Nature 1997, 387, 253–260. [Google Scholar] [CrossRef]
- Chen, Z.M.; Chen, G.Q.; Chen, B.; Zhou, J.B.; Yang, Z.F.; Zhou, Y. Net ecosystem services value of wetland: Environmental economic account. Commun. Nonlinear Sci. Numer. Simul. 2009, 14, 2837–2843. [Google Scholar] [CrossRef]
- Seppelt, R.; Dormann, C.F.; Eppink, F.V.; Lautenbach, S.; Schmidt, S. A quantitative review of ecosystem service studies: Approaches, shortcomings and the road ahead. J. Appl. Ecol. 2011, 48, 630–636. [Google Scholar] [CrossRef]
- Plieninger, T.; Dijks, S.; Oteros-Rozas, E.; Bieling, C. Assessing, mapping, and quantifying cultural ecosystem services at community level. Land Use Policy 2013, 33, 118–129. [Google Scholar] [CrossRef]
- De Groot, R.S.; Alkemade, R.; Braat, L.; Hein, L.; Willemen, L. Challenges in integrating the concept of ecosystem services and values in landscape planning, management and decision making. Ecol. Complex. 2010, 7, 260–272. [Google Scholar] [CrossRef]
- Paudyal, K.; Baral, H.; Burkhard, B.; Bhandari, S.P.; Keenan, R.J. Participatory assessment and mapping of ecosystem services in a data-poor region: Case study of community-managed forests in central Nepal. Ecosyst. Serv. 2015, 13, 81–92. [Google Scholar] [CrossRef]
- Hein, L.; Van Koppen, K.; De Groot, R.S.; Van Ierland, E.C. Spatial scales, stakeholders and the valuation of ecosystem services. Ecol. Econ. 2006, 57, 209–228. [Google Scholar] [CrossRef]
- De Juan, S.; Gelcich, S.; Fernandez, M. Integrating stakeholder perceptions and preferences on ecosystem services in the management of coastal areas. Ocean Coast. Manag. 2017, 136, 38–48. [Google Scholar] [CrossRef]
- Cebrián-Piqueras, M.A.; Karrasch, L.; Kleyer, M. Coupling stakeholder assessments of ecosystem services with biophysical ecosystem properties reveals importance of social contexts. Ecosyst. Serv. 2017, 23, 108–115. [Google Scholar] [CrossRef]
- Garrido, P.; Elbakidze, M.; Angelstam, P.; Plieninger, T.; Pulido, F.; Moreno, G. Stakeholder perspectives of wood-pasture ecosystem services: A case study from Iberian dehesas. Land Use Policy 2017, 60, 324–333. [Google Scholar] [CrossRef]
- Hein, L.; van Koppen, C.K.; van Ierland, E.C.; Leidekker, J. Temporal scales, ecosystem dynamics, stakeholders and the valuation of ecosystems services. Ecosyst. Serv. 2016, 21, 109–119. [Google Scholar] [CrossRef]
- Koschke, L.; Fuerst, C.; Frank, S.; Makeschin, F. A multi-criteria approach for an integrated land-cover-based assessment of ecosystem services provision to support landscape planning. Ecol. Indic. 2012, 21, 54–66. [Google Scholar] [CrossRef]
- Hauck, J.; Görg, C.; Varjopuro, R.; Ratamäki, O.; Jax, K. Benefits and limitations of the ecosystem services concept in environmental policy and decision making: Some stakeholder perspectives. Environ. Sci. Policy 2013, 25, 13–21. [Google Scholar] [CrossRef]
- Watts, S.; Stenner, P. Doing Q methodology: Theory, method and interpretation. Qual. Res. Psychol. 2005, 2, 67–91. [Google Scholar] [CrossRef]
- Brown, S.R. Q methodology and qualitative research. Qual. Health Res. 1996, 6, 561–567. [Google Scholar] [CrossRef]
- Lee, J.-H.; Son, Y.-H. Stakeholder Subjectives toward Ecotourism Development using Q methodology: The Case of Maha Ecotourism Site in Pyeongchang, Korea. Asia Pac. J. Tour. Res. 2016, 21, 931–951. [Google Scholar] [CrossRef]
- Pike, K.; Wright, P.; Wink, B.; Fletcher, S. The assessment of cultural services in the marine environment using Q methodology. J. Coast. Conserv. 2015, 19, 667–675. [Google Scholar] [CrossRef]
- Armatas, C.A.; Venn, T.J.; Watson, A.E. Applying Q-methodology to select and define attributes for non-market valuation: A case study from Northwest Wyoming, United States. Ecol. Econ. 2014, 107, 447–456. [Google Scholar] [CrossRef]
- Simpson, S.; Brown, G.; Peterson, A.; Johnstone, R. Stakeholder perspectives for coastal ecosystem services and influences on value integration in policy. Ocean Coast. Manag. 2016, 126, 9–21. [Google Scholar] [CrossRef]
- Zabala, A. Qmethod: A package to explore human perspectives using Q methodology. R J. 2014, 6, 163–173. [Google Scholar]
- Akhtar-Danesh, N.; Valaitis, R.; O’Mara, L.; Austin, P.; Munroe, V. Viewpoints about collaboration between primary care and public health in Canada. BMC Health Serv. Res. 2013, 13, 311. [Google Scholar] [CrossRef] [PubMed]
- Herrington, N.; Coogan, J. Q methodology: An overview. Res. Second. Teach. Educ. 2011, 1, 24–28. [Google Scholar]
- Frantzeskaki, N.; Kabisch, N. Designing a knowledge co-production operating space for urban environmental governance—Lessons from Rotterdam, Netherlands and Berlin, Germany. Environ. Sci. Policy 2016, 62, 90–98. [Google Scholar] [CrossRef]
Figure 1.
Study area.


Table 1.
Q statements and stakeholders for the Q survey.
| Q Statement of Ecosystem Services | |||
| No. | Division | Q Statement | No. of Q Statement |
| 1 | Provisioning Services | (1) Laver, (2) Shellfish, (3) Webfoot octopus, (4) Food source, (5) Cosmetics, (6) Handicraft | 6 |
| 2 | Regulating Services | (7)Air purification, (8) Water purification, (9) Tsunamis or typhoons, (10) Pollution reduction, (11) Erosion reduction, (12) Global warming education, (13) Damage to farm, (14) Seawater inflow | 8 |
| 3 | Supporting Services | (15)Resting to migrants, (16) Food to organisms, (17) Habitat to organisms, (18) Abundant soil | 4 |
| 4 | Cultural Services | (19)Travel, (20) Recreation, (21) Scenic Quality, (22) Art, (23) Religion, (24) Education, (25) Tradition | 7 |
| Total | 25 | ||
| Types and Number of Stakeholders Included in This Study | |||
| No. | Type | Detailed Information | No. of People |
| 1 | Resident | Representative of Mud-Flat Experience Village, Local Ecotourism Interpreter | 5 |
| 2 | Merchant | Pension Operator, Personal Museum Operator | 3 |
| 3 | NGO * | Sustainable Development Committee | 2 |
| 4 | Official | Tourism Team in Local Government, Ministry of Environment | 7 |
| 5 | Researcher | National Institute of Ecology, National Marine Biodiversity Institute of Korea | 8 |
| Total | 25 | ||
* NGO: non-governmental organization.
Table 2.
Eigenvalue and cumulative percentage of stakeholders in each factor.
| Factor | 1 | 2 | 3 | 4 | 5 | 6 |
|---|---|---|---|---|---|---|
| Eigenvalue | 11.346 | 2.967 | 2.204 | 1.331 | 1.249 | 1.081 |
| Cumulative % | 43.638 | 55.051 | 63.527 | 68.647 | 73.450 | 77.609 |
Table 3.
Results of Q factor analysis.
| No. | Status | Factor 1 | Factor 2 | Factor 3 | Age | Gender | Residence | Duration of Residence | Educational Level |
|---|---|---|---|---|---|---|---|---|---|
| 1 | Researcher | 0.817 | −0.008 | −0.271 | 30s | Female | Other city | Less than 1 year | University |
| 2 | NGO | 0.815 | 0.068 | −0.294 | 40s | Female | Seocheon | Over 10 years | High school |
| 3 | Resident | 0.808 | 0.100 | 0.238 | 40s | Female | Seocheon | Over 10 years | University |
| 4 | Researcher | 0.784 | 0.401 | 0.013 | 30s | Female | Other city | 2–5 years | Graduate school |
| 5 | Researcher | 0.743 | 0.027 | 0.292 | 20s | Male | Other city | 1–2 years | University |
| 6 | Official | 0.725 | 0.334 | 0.323 | 40s | Female | Seocheon | Over 10 years | University |
| 7 | Resident | 0.694 | 0.387 | −0.044 | 40s | Male | Seocheon | Over 10 years | University |
| 8 | Researcher | 0.667 | 0.115 | 0.360 | 40s | Female | Seocheon | 2–5 years | Graduate school |
| 9 | Merchant | 0.653 | 0.377 | 0.127 | 30s | Male | Seocheon | Over 10 years | University |
| 10 | Researcher | 0.651 | 0.040 | 0.379 | 30s | Male | Other city | 1–2 years | Graduate school |
| 11 | Resident | 0.624 | 0.484 | 0.177 | 40s | Female | Seocheon | Over 10 years | College |
| 12 | Resident | 0.617 | 0.388 | 0.302 | 50s | Female | Seocheon | Over 10 years | College |
| 13 | NGO | 0.503 | 0.198 | 0.416 | 40s | Male | Seocheon | Over 10 years | University |
| 14 | Official | 0.220 | 0.814 | −0.154 | 50s | Male | Seocheon | Over 10 years | University |
| 15 | Researcher | 0.445 | 0.755 | −0.064 | 20s | Female | Other city | Over 10 years | University |
| 16 | Researcher | 0.234 | 0.714 | 0.331 | 30s | Male | Other city | Less than 1 year | Graduate school |
| 17 | Official | 0.175 | 0.702 | 0.152 | 30s | Female | Seocheon | Over 10 years | University |
| 18 | Official | 0.340 | 0.676 | 0.418 | 40s | Female | Seocheon | Over 10 years | College |
| 19 | Official | 0.275 | 0.624 | −0.029 | 40s | Female | Seocheon | Over 10 years | High school |
| 20 | Resident | −0.059 | 0.622 | 0.250 | 30s | Female | Seocheon | 1–2 years | High school |
| 21 | Official | −0.351 | 0.549 | −0.097 | 40s | Female | Seocheon | Over 10 years | College |
| 22 | Official | 0.493 | 0.503 | 0.480 | 40s | Male | Seocheon | Over 10 years | University |
| 23 | Merchant | 0.451 | 0.480 | 0.309 | Over 60s | Male | Seocheon | Over 10 years | High school |
| 24 | Merchant | 0.130 | 0.214 | −0.745 | 40s | Female | Seocheon | Over 10 years | University |
| 25 | Official | 0.160 | 0.481 | 0.657 | 20s | Male | Seocheon | 1–2 years | University |
| 26 | Researcher | 0.353 | 0.294 | 0.653 | 30s | Female | Other city | 1–2 years | Graduate school |
| % of Var. | 43.638 | 11.413 | 8.476 | Total | 63.527 | ||||
Note: The number in shading parts means the significant lording in each factor.
Table 4.
Q statements of the three factors used in this study.
| Factor 1: Ecological Function | |||
| No. | Service | Q Statement | Z Value * |
| 12 | Regulating | Seocheon mud flat plays a role in global warming reduction by absorbing carbon | +4 (Strongly Agree) |
| 17 | Supporting | Seocheon mud flat provides a habitat to numerous organisms | +3 (Agree) |
| 10 | Regulating | Seocheon mud flat plays a role in pollution reduction | +3 (Agree) |
| 19 | Cultural | Seocheon mud flat is a travel experience for tourists | −3 (Disagree) |
| 23 | Cultural | Seocheon mud flat inspires religious activity | −3 (Disagree) |
| 6 | Provisioning | Seocheon mud flat provides resources for producing handicraft souvenirs | −4 (Strongly Disagree) |
| Factor 2: Ecotourism | |||
| No. | Service | Q Statement | Z Value |
| 19 | Cultural | Seocheon mud flat is a travel experience for tourists | +4 (Strongly Agree) |
| 15 | Supporting | Seocheon mud flat provides a resting place to migrants | +3 (Agree) |
| 2 | Provisioning | Seocheon mud flat produces shellfish, including clam and oyster | +3 (Agree) |
| 9 | Regulating | Seocheon mud flat has a disaster regulating function for tsunamis or typhoons | −3 (Disagree) |
| 22 | Cultural | Seocheon mud flat inspires artistic activity | −3 (Disagree) |
| 23 | Cultural | Seocheon mud flat inspires religious activity | −4 (Strongly Disagree) |
| Factor 3: Human Activity | |||
| No. | Service | Q Statement | Z Value |
| 21 | Cultural | Seocheon mud flat is beautiful | +4 (Strongly Agree) |
| 24 | Cultural | Seocheon mud flat helps educational activity | +3 (Agree) |
| 25 | Cultural | Seocheon mud flat reflects the tradition of the area | +3 (Agree) |
| 7 | Regulating | Seocheon mud flat has an air purification function | −3 (Disagree) |
| 12 | Regulating | Seocheon mud flat plays a role in global warming reduction by absorbing carbon | −3 (Disagree) |
| 4 | Provisioning | Seocheon mud flat is a food source | −4 (Strongly Disagree) |
* Z values of +3 and +4 were interpreted as a “strong positive opinion”, whereas those of −4 and −3 were interpreted as a “strong negative opinion”.
Table 5.
Statements with the highest variance and the lowest variance among the three factors used in this study.
Table 5.
Statements with the highest variance and the lowest variance among the three factors used in this study.
| Highest Variance among Factors | ||||||
| No. | Service | Q Statement | F1 | F2 | F3 | Var. |
| 12 | Regulating | Seocheon mud flat plays a role in global warming reduction by absorbing carbon | 4 | −2 | −3 | 14.33 |
| 19 | Cultural | Seocheon mud flat is a travel experience for tourists | −3 | 4 | 0 | 12.33 |
| 25 | Cultural | Seocheon mud flat reflects the tradition of the area | −2 | −2 | 3 | 8.33 |
| 9 | Regulating | Seocheon mud flat has a disaster regulating function for tsunamis or typhoons | 2 | −3 | 1 | 7.00 |
| 21 | Cultural | Seocheon mud flat is beautiful | −1 | 0 | 4 | 7.00 |
| Lowest Variance among Factors | ||||||
| No. | Service | Q Statement | F1 | F2 | F3 | Var. |
| 16 | Supporting | Seocheon mud flat supplies food to numerous organisms | 1 | 1 | 2 | 0.33 |
| 17 | Supporting | Seocheon mud flat provides a habitat to numerous organisms | 3 | 2 | 1 | 1.00 |
| 15 | Supporting | Seocheon mud flat provides a resting place to migrants | 1 | 3 | 1 | 1.33 |
| 5 | Provisioning | Seocheon mud flat provides resources for producing cosmetics or medicines | −2 | 0 | −2 | 1.33 |
| 22 | Cultural | Seocheon mud flat inspires artistic activity | −2 | −3 | 0 | 2.33 |
| 24 | Cultural | Seocheon mud flat helps educational activity | 0 | 1 | 3 | 2.33 |
Table 6.
Correlation analysis of Q statements.
| Correlation among Q Statement | Provisioning Service | Regulating Service | ||||||||||||||||
| (1) Laver | (2) Shellfish | (3) Webfoot Octopus | (4) Food Source | (5) Cosmetics | (6) Handicraft | (7) Air Purification | (8) Water Purification | (9) Tsunamis or Typhoons | (10) Pollution Reduction | (11) Erosion Reduction | (12) Global Warming Reduction | (13) Damages to Farm | (14) Seawater Inflow | |||||
| Provisioning service | (1) Laver | 1 | 0.153 | 0.339 | 0.336 | 0.276 | −0.074 | 0.026 | −0.401 | 0.052 | −0.174 | 0.159 | −0.081 | −0.468 * | −0.085 | |||
| (2) Shellfish | 1 | 0.051 | −0.105 | 0.010 | 0.120 | −0.386 | −0.184 | −0.203 | −0.272 | −0.341 | −0.210 | −0.259 | −0.163 | |||||
| (3) Webfoot octopus | 1 | 0.199 | 0.303 | 0.252 | 0.026 | −0.317 | −0.285 | 0.005 | −0.334 | −0.011 | 0.039 | −0.048 | ||||||
| (4) Food source | 1 | 0.318 | −0.004 | 0.353 | −0.092 | −0.003 | 0.260 | −0.037 | 0.197 | 0.043 | 0.055 | |||||||
| (5) Cosmetics | 1 | 0.307 | 0.119 | −0.326 | −0.288 | −0.280 | −0.256 | −0.067 | −0.001 | |||||||||
| (6) Handicraft | 1 | 0.018 | −0.270 | −0.458 * | −0.023 | 0.223 | −0.240 | |||||||||||
| Regulating service | (7) Air purification | 1 | 0.241 | 0.281 | 0.205 | −0.046 | 0.308 | 0.135 | −0.131 | |||||||||
| (8) Water purification | 1 | 0.433 * | 0.352 | 0.182 | 0.159 | −0.129 | 0.144 | |||||||||||
| (9) Tsunamis or typhoons | 1 | 0.172 | 0.270 | 0.198 | 0.054 | |||||||||||||
| (10) Pollution reduction | 1 | −0.043 | 0.475 * | −0.114 | −0.119 | |||||||||||||
| (11) Erosion reduction | 1 | 0.093 | 0.075 | 0.059 | ||||||||||||||
| (12) Global warming reduction | 1 | 0.113 | −0.343 | |||||||||||||||
| (13) Damages to farm | 1 | 0.083 | ||||||||||||||||
| (14) Seawater inflow | 1 | |||||||||||||||||
| Supporting services | (15) Resting to migrants | |||||||||||||||||
| (16) Food to organism | ||||||||||||||||||
| (17) Habitat to organism | ||||||||||||||||||
| (18) Abundant soil | ||||||||||||||||||
| Cultural service | (19) Travel | |||||||||||||||||
| (20) Recreation | ||||||||||||||||||
| (21) Scenic Quality | ||||||||||||||||||
| (22) Art | ||||||||||||||||||
| (23) Religion | ||||||||||||||||||
| (24) Education | ||||||||||||||||||
| (25) Tradition | ||||||||||||||||||
| Correlation among Q Statement | Supporting Services | Cultural Service | ||||||||||||||||
| (15) Resting to Migrants | (16) Food to Organisms | (17) Habitat to Organisms | (18) Abundant Soil | (19) Travel | (20) Recreation | (21) Scenic Quality | (22) Art | (23) Religion | (24) Education | (25) Tradition | ||||||||
| Provisioning service | (1) Laver | −0.088 | −0.187 | −0.194 | 0.061 | −0.010 | −0.033 | −0.333 | −0.025 | 0.127 | −0.253 | −0.079 | ||||||
| (2) Shellfish | 0.004 | −0.066 | 0.041 | 0.321 | 0.229 | 0.157 | −0.007 | −0.430 * | 0.063 | 0.233 | 0.143 | |||||||
| (3) Webfoot octopus | −0.297 | −0.265 | −0.488 * | 0.454 * | 0.321 | 0.020 | −0.213 | −0.053 | −0.383 | −0.259 | −0.225 | |||||||
| (4) Food source | −0.341 | −0.477 * | −0.126 | 0.011 | −0.208 | 0.106 | −0.469 * | 0.135 | 0.083 | −0.484 * | ||||||||
| (5) Cosmetics | −0.057 | −0.218 | −0.286 | 0.434 * | 0.154 | −0.120 | 0.025 | 0.290 | −0.198 | −0.334 | −0.229 | |||||||
| (6) Handicraft | −0.160 | −0.218 | −0.342 | 0.447 * | 0.293 | −0.037 | 0.208 | −0.408 * | −0.017 | −0.248 | ||||||||
| Regulating service | (7) Air purification | −0.103 | −0.367 | −0.118 | −0.364 | −0.148 | −0.039 | −0.331 | 0.018 | 0.158 | −0.369 | |||||||
| (8) Water purification | 0.044 | 0.131 | 0.230 | −0.343 | −0.135 | 0.171 | −0.057 | 0.096 | 0.005 | −0.020 | ||||||||
| (9) Tsunamis or typhoons | −0.250 | −0.047 | −0.056 | −0.414 * | −0.152 | −0.054 | −0.344 | 0.389 * | 0.059 | 0.135 | ||||||||
| (10) Pollution reduction | 0.126 | −0.085 | 0.204 | −0.042 | −0.435 * | −0.188 | −0.337 | −0.108 | 0.043 | −0.066 | −0.256 | |||||||
| (11) Erosion reduction | −0.115 | 0.281 | 0.118 | −0.425 * | −0.399 * | −0.315 | 0.025 | −0.045 | 0.087 | 0.154 | 0.073 | |||||||
| (12) Global warming reduction | −0.188 | −0.027 | 0.168 | −0.126 | −0.199 | −0.289 | −0.090 | 0.000 | −0.367 | −0.228 | ||||||||
| (13) Damages to farm | −0.386 | −0.129 | −0.070 | −0.022 | −0.084 | −0.004 | 0.059 | −0.155 | −0.124 | −0.031 | 0.094 | |||||||
| (14) Seawater inflow | −0.274 | 0.007 | −0.262 | −0.254 | −0.004 | 0.098 | 0.052 | 0.270 | 0.173 | −0.050 | 0.267 | |||||||
| Supporting services | (15) Resting to migrants | 1 | 0.187 | 0.089 | −0.109 | 0.015 | 0.155 | −0.200 | −0.042 | 0.328 | 0.165 | |||||||
| (16) Food to organism | 1 | 0.332 | 0.037 | −0.104 | −0.497 ** | 0.131 | 0.225 | −0.056 | 0.288 | 0.166 | ||||||||
| (17) Habitat to organism | 1 | −0.082 | −0.443 * | −0.191 | −0.002 | −0.206 | 0.146 | 0.094 | 0.099 | |||||||||
| (18) Abundant soil | 1 | 0.181 | 0.016 | 0.010 | −0.064 | −0.297 | 0.118 | −0.288 | ||||||||||
| Cultural service | (19) Travel | 1 | 0.415 * | 0.007 | 0.235 | −0.250 | 0.132 | −0.002 | ||||||||||
| (20) Recreation | 1 | −0.105 | −0.128 | −0.014 | −0.074 | −0.018 | ||||||||||||
| (21) Scenic Quality | 1 | 0.034 | −0.062 | 0.281 | 0.272 | |||||||||||||
| (22) Art | 1 | −0.046 | −0.177 | −0.214 | ||||||||||||||
| (23) Religion | 1 | −0.142 | 0.075 | |||||||||||||||
| (24) Education | 1 | 0.247 | ||||||||||||||||
| (25) Tradition | 1 | |||||||||||||||||
* Significance at p < 0.05. ** Significance at p < 0.01. Red: positive correlation. Blue: negative correlation.
Table 7.
Factor distribution per stakeholder type.
| Per Stakeholder Status | ||||||
| Factor | Official | Researcher | Resident | NGO | Merchant | Total |
| Factor 1 | 1 | 5 | 4 | 2 | 1 | 13 |
| Factor 2 | 6 | 2 | 1 | 10 | ||
| Factor 3 | 1 | 1 | 2 | |||
| Total | 8 | 8 | 5 | 2 | 2 | 25 |
| Per Time of Residence | ||||||
| Factor | Less than 1 Year | 1–2 Years | 2–5 Years | 5–10 Years | Over 10 Years | Total |
| Factor 1 | 1 | 2 | 2 | 8 | 13 | |
| Factor 2 | 1 | 1 | 8 | 10 | ||
| Factor 3 | 2 | 2 | ||||
| Total | 2 | 5 | 2 | 16 | 25 | |
© 2017 by the authors. Licensee MDPI, Basel, Switzerland. This article is an open access article distributed under the terms and conditions of the Creative Commons Attribution (CC BY) license (http://creativecommons.org/licenses/by/4.0/).
Share and Cite
MDPI and ACS Style
Lee, J.-h.; Kim, M.; Kim, B.; Park, H.-J.; Kwon, H.-s. Performing Ecosystem Services at Mud Flats in Seocheon, Korea: Using Q Methodology for Cooperative Decision Making. Sustainability 2017, 9, 769. https://doi.org/10.3390/su9050769
AMA Style
Lee J-h, Kim M, Kim B, Park H-J, Kwon H-s. Performing Ecosystem Services at Mud Flats in Seocheon, Korea: Using Q Methodology for Cooperative Decision Making. Sustainability. 2017; 9(5):769. https://doi.org/10.3390/su9050769
Chicago/Turabian StyleLee, Jae-hyuck, Moohan Kim, Byeori Kim, Hong-Jun Park, and Hyuck-soo Kwon. 2017. "Performing Ecosystem Services at Mud Flats in Seocheon, Korea: Using Q Methodology for Cooperative Decision Making" Sustainability 9, no. 5: 769. https://doi.org/10.3390/su9050769
Note that from the first issue of 2016, this journal uses article numbers instead of page numbers. See further details here.