
Analysis of the Relative Sustainability of Land Devoted to Bioenergy: Comparing Land-Use Alternatives in China

1
School of Geography and the Environment, University of Oxford, Oxford OX1 3QY, UK
2
Institute for New Economic Thinking at the Oxford Martin School, University of Oxford, Oxford OX2 6ED, UK
3
Environmental Change Institute, Oxford University Centre for the Environment, South Parks Road, Oxford OX1 3QY, UK
4
St Antony’s College, University of Oxford, Oxford OX2 6JF, UK
5
School of Business, Sichuan University, Chengdu 610064, China
6
School of Business, Guangdong University of Finances and Economics, Guangzhou 510320, China
7
Faculty of Human, Social and Political Science, University of Cambridge, Cambridge CB2 3RQ, UK
8
Downing College, University of Cambridge, Cambridge CB2 1DQ, UK
*
Author to whom correspondence should be addressed.
Sustainability 2017, 9(5), 801; https://doi.org/10.3390/su9050801
Submission received: 3 December 2016
/
Revised: 22 March 2017
/
Accepted: 1 April 2017
/
Published: 11 May 2017
Abstract
:When developing land to meet various human needs, conducting assessments of different alternatives regarding their sustainability is critical. Among different alternatives of land-use, devoting land to bioenergy is relatively novel, in high demand, and important for addressing the energy crisis and mitigating carbon emissions. Furthermore, the competition and disputes among limited land-use for bioenergy and the combination of food production and housing are tense. Thus, which alternative of land-use is more sustainable is an important question, yet it is still under-investigated. The main purposes of this study are to investigate the merits and problems of land-use for bioenergy and to compare the relative sustainability of land-use for bioenergy, food production, and housing based on habitants’ perceptions. Multi-criteria analysis is applied to the case study in the context of China, evaluating multiple criteria in economic, environmental, and social dimensions. Therefore, this study presents a comprehensive assessment of different scenarios of land-use designed to be implemented and some implications for optimum land-use policies.
1. Introduction
In the past three centuries, over half of the land surface on the earth has been impacted by various anthropogenic activities [1]. Land is regarded as an essential natural resource for the survival and prosperity of humanity. Meanwhile, land is also a key component of the environmental resources for the maintenance of all terrestrial ecosystems. As a resource, which is usually used for exploitation, land has become increasing scarce, and thus competition for land uses is becoming frequent, acute, and complex [2,3]. Inappropriate land uses can lead to economic losses, social disruption, and environmental degradation and can cause problems that hurt future generations [4,5]. Therefore, sustainable land-uses are prominent on development agendas of both developed and developing countries. To facilitate the long-term benign and favourable development of land, it is crucial to evaluate the sustainability of land-use for different purposes on economic, environmental, and social dimensions [6,7].
Among different types of land-use, including conventional food production, housing, and relatively novel bioenergy production, land devoted to bioenergy development is attracting unprecedented attention worldwide [8,9,10]. Nations are developing land for bioenergy programmes to improve energy security, reduce carbon emissions, and promote regional development. However, the tension between land-use for bioenergy and that for food production and housing has triggered considerable public concerns [11].
Despite the increasing global demand for bioenergy because of its multiple impacts, land area devoted to bioenergy production is limited due to relatively scarce land resources [12]. For developing bioenergy, land resources are pivotal, so it is claimed that more land devoted to food production and housing should yield to bioenergy production, which may bring more benefits. However, the question of whether it is relatively more sustainable to devote land to bioenergy is still under-examined. The comprehensive sustainability of land-use deserves further assessment, which is the focus of this study.
There are various factors and dimensions that are engaged in different land-use alternatives evaluations. However, most current approaches have failed to explore the multiple criteria of sustainability. Moreover, although many scholars argue that their studies will provide policy implications for government, it is a common issue that government officials cannot understand their incredibly over-complicate results presented with their too technical and sophisticated methods. To solve these puzzles, this study employs a concise and effective approach, multi-criteria analysis (MCA), to examine a full range of economic, environmental, and social sustainability criteria by comparing land-use in bioenergy, agriculture, and housing. The results presented in this study are straightforward and intuitive, which could be easily used for policy suggestions in considering the sustainability of land-uses. Moreover, the holistic assessment framework presented in this study could be easily applied more widely to policy practices in the sustainability evaluation on many other land use–related projects.
This paper is structured as follows: Section 2 discusses the merits and problems of land-use for bioenergy. Section 3 takes China as a case for investigation and conducts an assessment through a multi-criteria analysis method. The results of land-use sustainability for bioenergy, compared with land-use for food production and housing are shown in Section 4. Conclusions and implications are presented in Section 5.
2. Merits and Problems of Land-Use for Bioenergy
More land is demanded because there are several key merits of using land for bioenergy production. These merits include positive impact on promoting economic development (especially in rural areas), reducing greenhouse gas emissions, and meeting energy demand across the world [13]. Many countries, especially Brazil, the US, and China, have made significant progress on developing land for the bioenergy industry [11].
However, using land for bioenergy production can be a double-edged sword, having triggered a series of controversial issues. Criticisms on using land for bioenergy revolving around large scale biofuel plantation have been reported, including the risks posed on private sectors, the environment, and food security in developing countries. As listed below, three key disputes regarding the merits and problems of land-use for bioenergy stand out among those addressed by the Food and Agriculture Organisation of the United Nations and other extant literature [14,15,16].
2.1. Promoting Agricultural and Rural Development vs. Challenges for Private Sectors
With the improvement of technologies, it is cheaper to produce agricultural output, and the prices for agricultural necessities are dropping. As the real prices of agricultural commodities experience a long-term declining trend, the development of agriculture and rural areas faces difficulties in attracting investment from public and private sectors in many developing countries [14]. Against this backdrop, with the increasing demand for bioenergy and thus the promotion of biofuel plantation, agricultural and rural development are presented with great opportunities. First, increasing feedstock production for producing bioenergy will boost the development of the agricultural sector in terms of employment and local income. As agricultural activities are still labour-intensive, more demand for production work requires larger labour force and may correspondingly raise wages. Furthermore, due to the significant transportation cost, collection and conversion facilities could be constructed and operated locally, which would further boost local economic activities and rural development. The aforementioned positive impacts on agricultural and rural development could further attract investment in rural infrastructure, healthcare, and education [17].
However, developing bioenergy as a new industry presents challenges for the private sector. The return of initial investments may have to wait until the demand and production of bioenergy grows to a large scale. Before achieving such scale, the cost of bioenergy may remain high and thus bioenergy prices may not be as competitive as oil, which is a high potential risk for the private sector in the new industry of bioenergy.
2.2. Reducing Carbon Emissions vs. Environmental Threats
Most life-cycle studies have found that substituting bioenergy for fossil fuels can help mitigate some of the detrimental greenhouse gas effects [18]. Governments worldwide have also implemented environmental policies to encourage a transition from petrol to bioenergy because it would reduce carbon accumulation.
However, biofuel plantations are a driver of deforestation [19]. Several major hotspots of bioenergy, including Latin America, Sub-Saharan Africa, and South-East Asia, are experiencing deforestation problems resulting from inappropriate land-use by private bioenergy operators and producers [20]. In addition, the biodiversity conservation issue is another substantial ecological and environmental threat.
2.3. Meeting Energy Demand vs. Food Insecurity
As a renewable energy source that competes with and can replace fossil fuels in energy markets, bioenergy is already substantially making contributions to meeting the world’s energy demand and is estimated to meet approximately a quarter to a third of worldwide primary energy demand in 2050 [21]. However, as increasing production of bioenergy requires larger scale land-use, food insecurity becomes one of the biggest concerns. The competition between bioenergy and food is twofold. (1) Competition with food and food related demand: Among the two biggest bioenergy countries, 45.9% of corn produced domestically were taken for bioethanol use in the US, and more than half of the total sugarcane production has been used for bioethanol since 1990 [22]. (2) Competition with agricultural resources: More bioenergy production demand requires more land and water, fertiliser, pesticides, and other agricultural resources. In Southeast Asia, especially Malaysia, Indonesia, and Thailand, land-use has changed greatly because of demand from bioenergy, competing with land and basic resources for the cultivation of rice and other food crops, which leads to food insecurity issues [23].
3. Analysis of the Sustainability of Land-Use for Three Alternatives
As there are both merits and problems as discussed above, it is necessary to explore the comprehensive sustainability of land-use in a specific context from different dimensions. A typical developing country with tense dispute over land and bioenergy is chosen for investigation through multi-criteria analysis.
3.1. Case: China
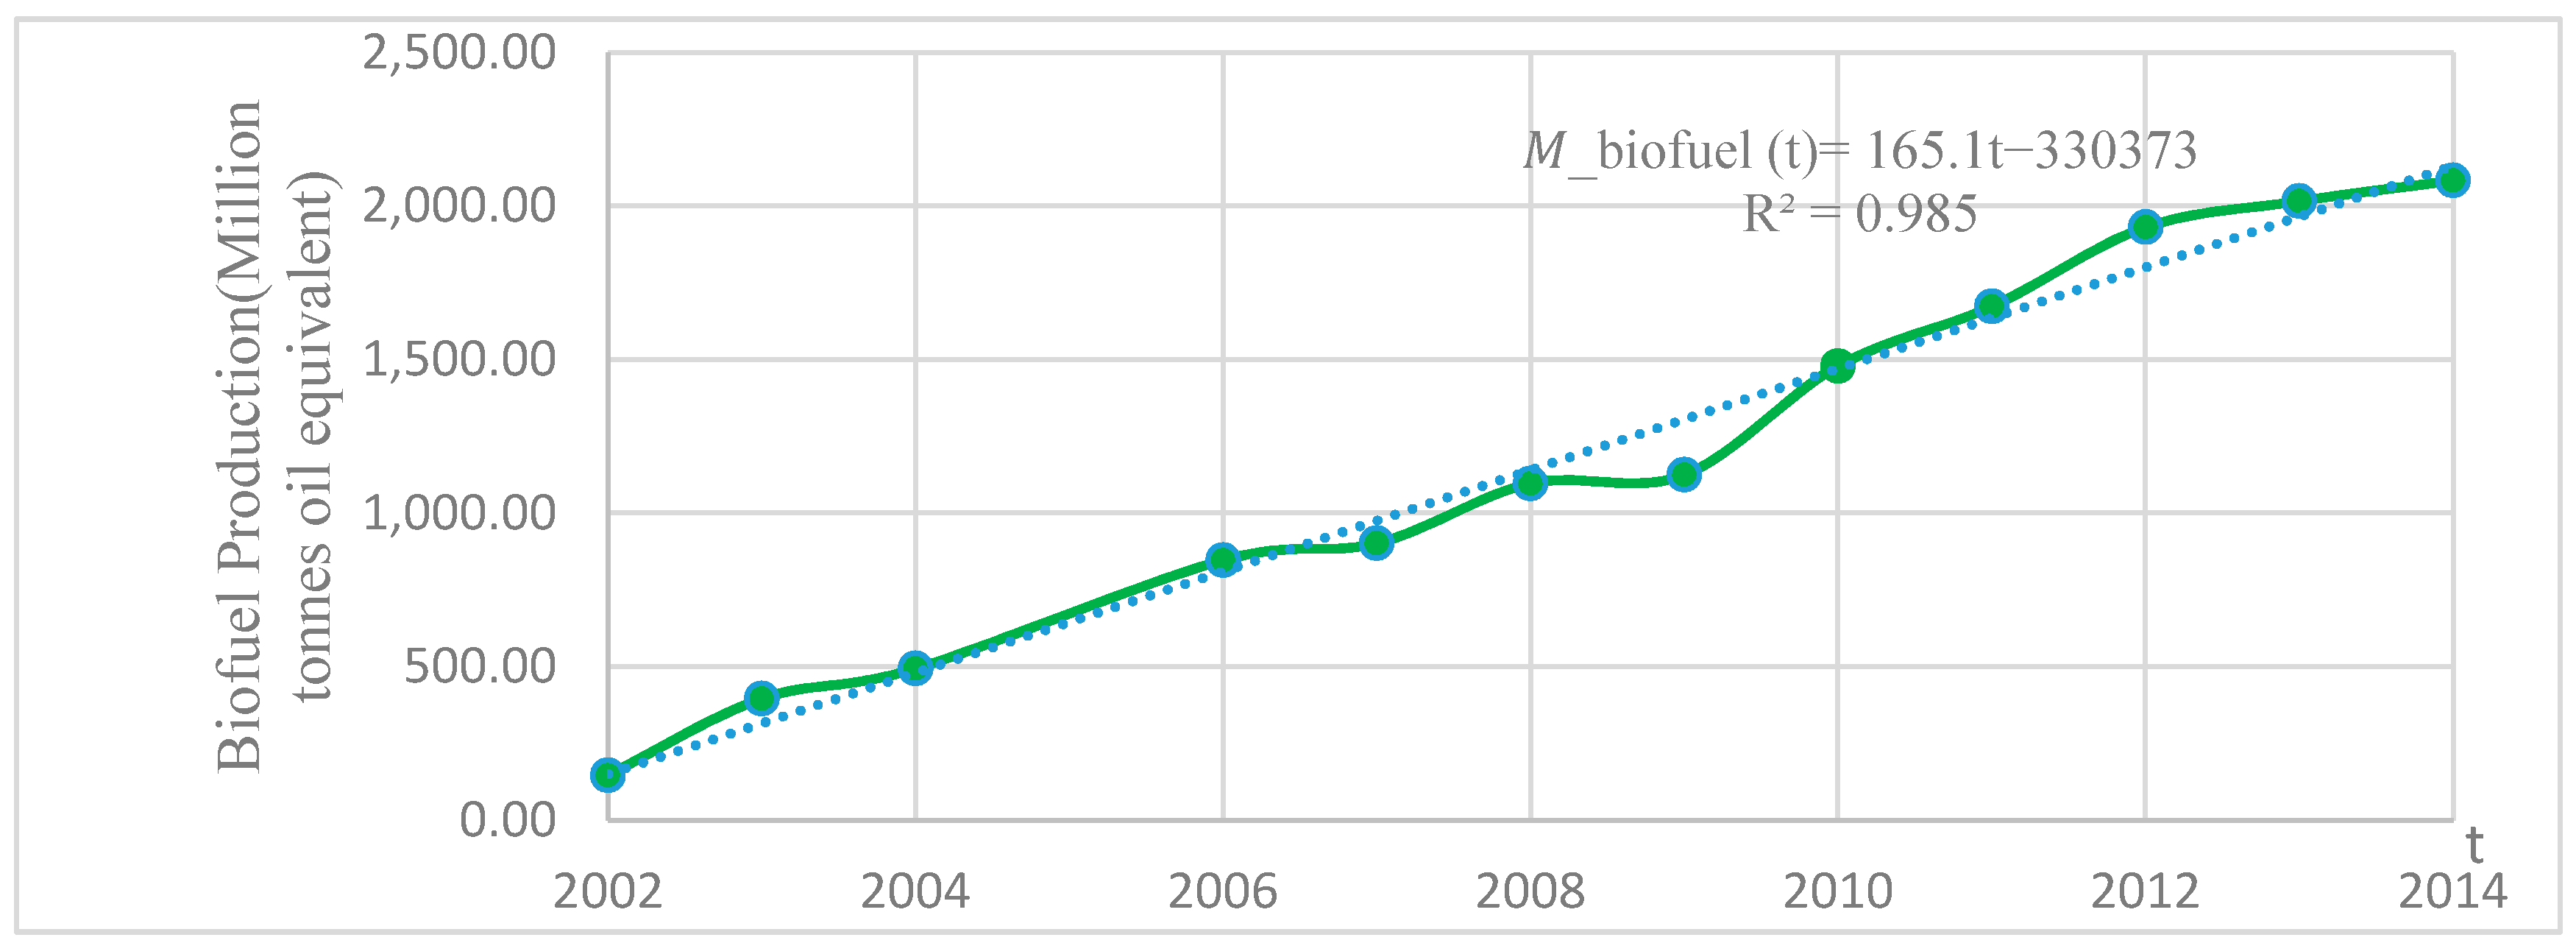
This study focuses on the sustainability of land devoted to bioenergy in the largest developing country, China, where land for bioenergy production is in highly demand. China is developing bioenergy to address energy security problems and decrease dependency on fossil fuels in order to sustain its economic development. With heavy and continuously rising energy demands, China overtook the US to become the largest oil importer in 2015. As energy is a driver of industrial development, since 2000 the Chinese government has actively launched a series of bioenergy projects and subsequently listed bioenergy industry as one of the seven national strategic emerging industries in 2010. According to the Statistical Review of World Energy (2015), after rapid ascents, the amount of biofuel production peaked at 2083.42 million tonnes oil equivalent in 2014. The relationship between the amount of bioenergy production Mbiofuel(t) and Year t can be predicted as , where R2 = 0.985, illustrating that time (t) has a goodness of fit that well fits the set of observation. There is a linear relationship between Mbioenergy(t) and t, showing a linear growth potential in the volume of bioenergy production (see Figure 1).
Furthermore, as China has become the global top carbon dioxide producer, this novel type of energy is important for the mitigation of greenhouse gas emissions [18]. The relationship between the amount of carbon dioxide Mcarbon(t) and Year t could be predicted as: , R2 = 0.9663. There is an exponential relationship between Mcarbon(t) and t, showing an exponential growth potential in the amount of carbon dioxide (see Figure 2). To mitigate the negative effect caused by the exponential growth of carbon emissions, China must urgently start to use more environmental-friendly energies, such as bioenergy.
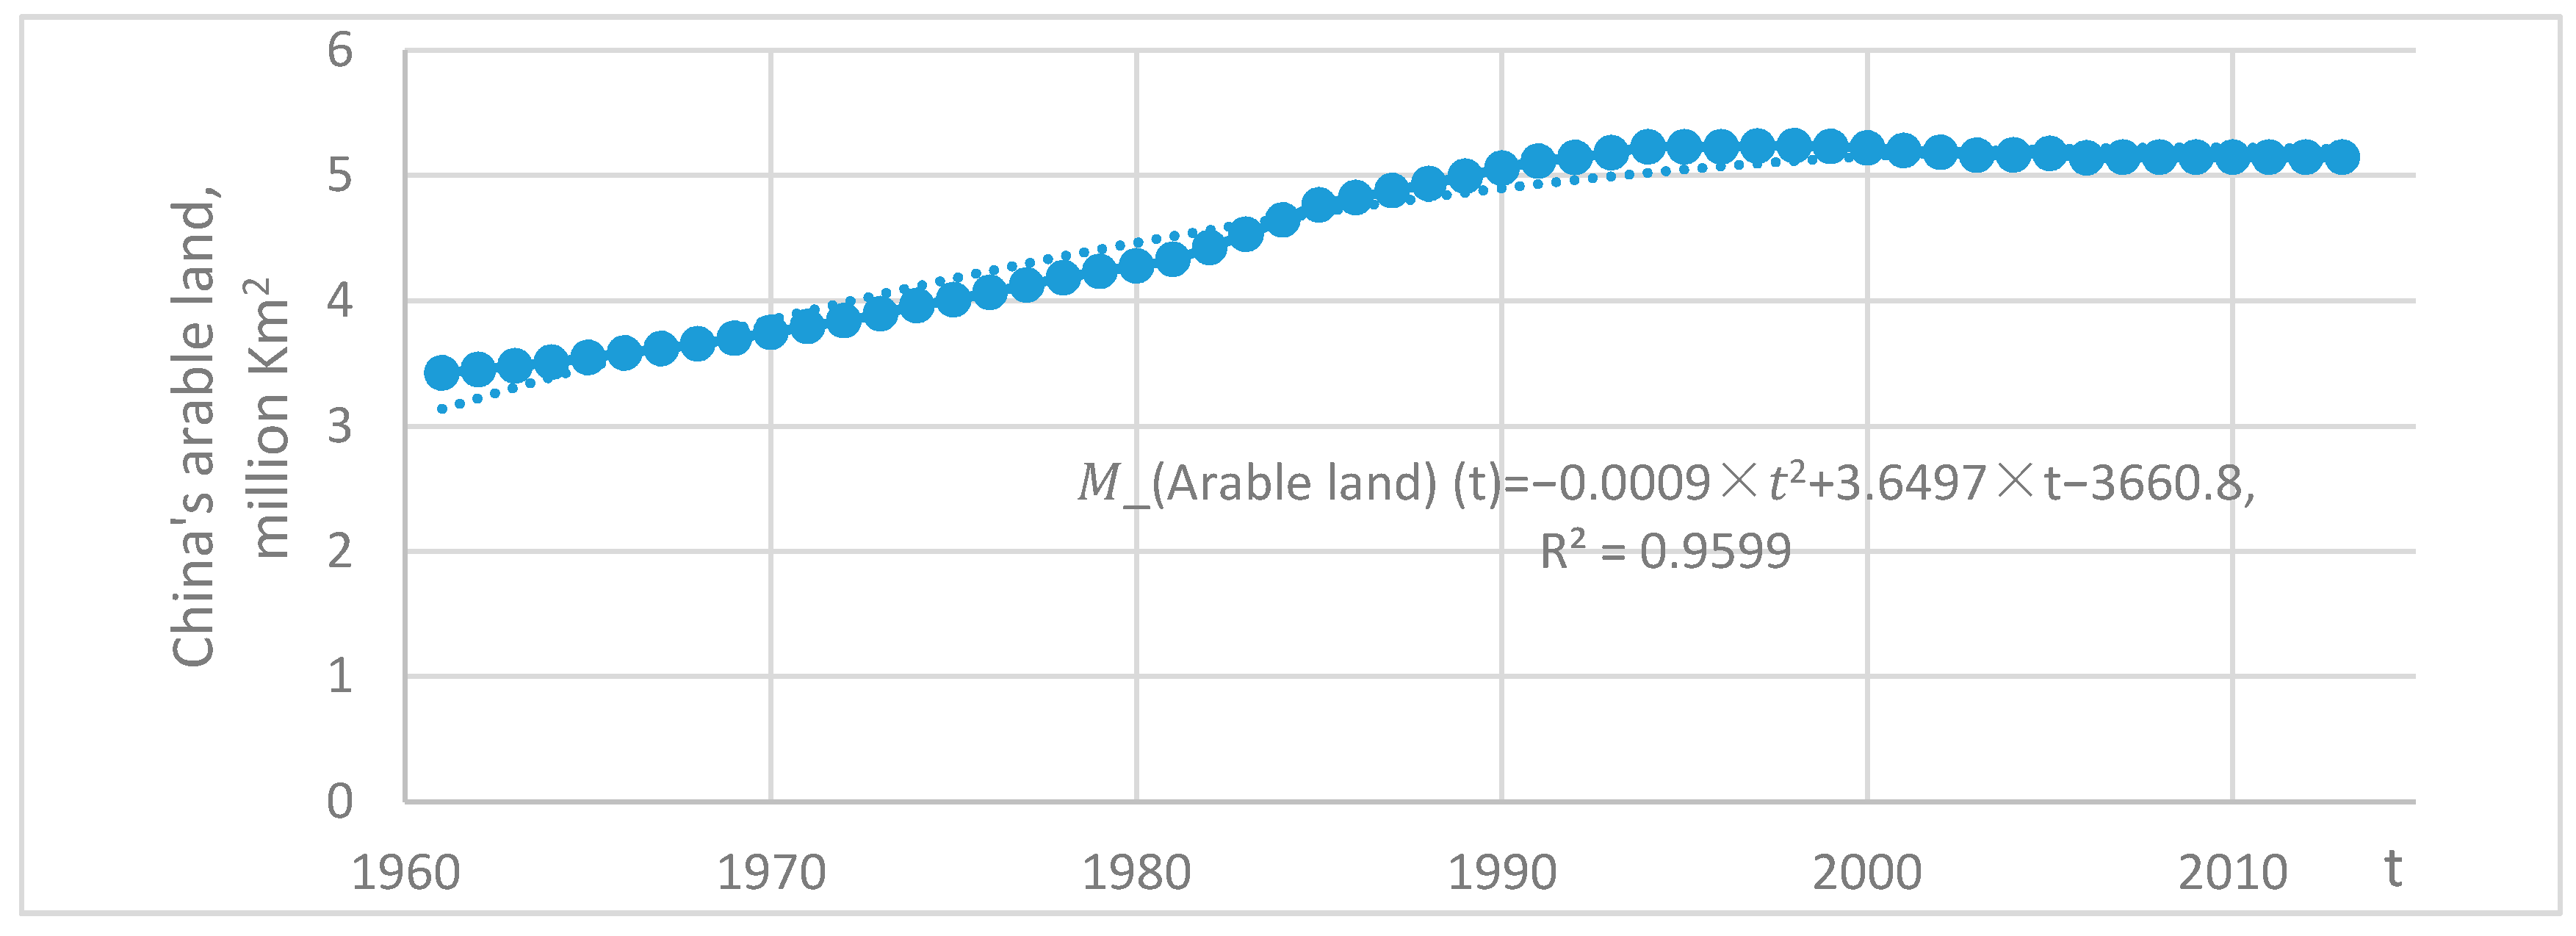
Nonetheless, in China, bioenergy production is proposed to be developed on marginal, degraded, or residual lands in remote areas to avoid competing with food production and housing. Yet, prescriptions for harvesting bioenergy crops on marginal land encounter issues such as low productivity, ecological threats, multiprocessing difficulties, and transportation costs. For instance, underutilised lands tend to demand more water and nutrients to maintain productivity [24]. For developing bioenergy, land resources are pivotal. The relationship between the amount of arable land Mcarbon(t) and Year t could be predicted as: , where R2 = 0.9599. There is an inverse quadric function relationship between Marable land(t) and t, showing a slightly downward trend in the amount of arable land since the year of 2000 (see Figure 3). Consequently, given the fact that there is decreasing amount of arable land, bioenergy must compete fiercely with food and housing for limited land resources in China. The question of whether it is relatively more sustainable to devote land to bioenergy must be assessed comprehensively.
3.2. Methodology: Using the Multi-Criteria Analysis
To examine the sustainability of land development, this study adopts multi-criteria analysis (MCA) due to the multiple criteria and different alternatives involved in evaluation and decision making in this case. This method is actively used as both a quantitative and qualitative approach to comprehensive sustainability assessment and policy evaluation in a variety of studies [25,26]. MCA enables decision makers to examine a full range of dimensions, including social, economic, technical, environmental, and financial dimensions [27,28]. Moreover, MCA is advantageous for measuring several different alternatives. As this study assesses land-use sustainability for three alternatives (bioenergy, food production, and housing) at multiple dimensions, after comparing with other potential methods, such as Cost Benefit Analysis (CBA), Environmental Impact Assessment (EIA), Social Impact Assessment (SIA), it is more suitable to use MCA because of its unique strengths [27].
The major steps of MCA in this study are as follows: specifying dimensions and attributes of sustainability, identifying indicators for each attribute, deciding the importance of and assigning weight to each indicator, giving scores to each indicator, calculating the weighted score of each indicator and overall sustainability scores, and finally comparing the sustainability of the three alternatives.
3.3. Specifying Criteria of Sustainability
The main sustainable land development criteria considered in this study are from three dimensions: economic, environmental and social, as frequently adopted in the mainstream sustainability studies [29,30].
To specify the attributes at these three dimensions, with reference to Erzurumlu and Erzurumlu’s [31] resource policy study, 12 main attributes are selected and adopted from the fourth generation of Sustainability Reporting Guidelines released in May 2013 by the Global Reporting Initiative (GRI, website: www.globalreporting.org). The GRI Sustainability Reporting Guidelines is one of the most widely used comprehensive sustainability reporting standards, providing the world’s most universally applicable reporting and disclosure to assist the decision-making of academia, industrial circles, governments, civil society groups, and individuals. Under the 12 attributes, this study identifies 20 indicators referring to the principle of the GRI and the existing literature (see Table 1).
3.4. Weighting Indicators
Another key step of MCA is to decide how important of each indicator. Each of these indicators may not have the same effect on sustainability. In reality, each indicator has varying the weights in different attributes under economic, environmental and social dimensions are various. For example, economic indicators like Profits could have larger weights than social indicators like Poverty Alleviation or vice versa [35]. In order to assign the weights of indicators, as group judgments are more valid than individual judgments, decisions from a structured group of individuals on the weights of indicators will be more accurate [36]. To have a scientific result, according to the widely-used Delphi method and the analytic hierarchy process (AHP) method in multiple criteria decision making, a group of experts were invited for deciding the weights of each indicator [37,38,39]. In this study, ten experts in eight related fields participated, including four researchers, a CEO, an investor, and two senior government officials (see Table 2).
Experts assigned weights to three dimensions, 12 attributes, and 20 indicators respectively according to their judgments. The weight of each indicator , is ranging from 0 to 1 with the sum of weights of 20 indicators as 1 (, where the sequence of indicator is i and the sequence of expert is e. If some expert considers some attributes and indicators to be irrelevant, zero weight would be assigned. After collecting experts’ weighting results, the mean of each indicator is calculated as the final approved weight of each indicator (Wi) via the formula: , The results of the final approved weights of the 20 indicators are listed below (see Table 3). In terms of the distribution of responses, most standard deviations of indicators are from 0.73 to 2.41, indicating the weights assigned by the ten experts to each indicators do not have much dispersion.
3.5. Survey and Data
The relationship between land-use and its sustainability is complex. After examining the existing literature and data sources, there is not sufficient effective data for measuring the multiple criteria, especially at the social dimension, indicating that it is difficult to find corresponding data to directly score the indicators. Due to limited data availability, this study designs a questionnaire to collect relevant data and scores indicators from stakeholders to support the empirical study via a survey in order to overcome the general difficulty of MCA in quantitative evaluation [25]. The engagement of the stakeholders in MCA methods is a practical approach in collecting data measuring sustainability. For example, two recent studies assess the sustainability of electrokinetic bioremediation and the sustainability of common types of roadside noise barriers by involving the support of stakeholders [40,41]. The survey uses the Likert scale for grading, with the score ranging from −3 to 3, representing from not sustainable to sustainable. It is a straightforward way to get information about the sustainability of different land-use alternatives.
Among 600 questionnaires sent to the relevant Chinese stakeholders nationwide, 154 questionnaires were completed and returned with a return rate of 25.67%. After excluding invalid questionnaires, there are 140 valid questionnaires, covering stakeholders from 27 provinces of China, with 55% from rural areas, which has a relatively high representativeness for assessing China’s case of land-use. 54.29% of samples are from East China, 45.71% of them are from West and Central China. Of the valid questionnaires, 53% of them are from male respondents, and 47% of them are from female respondents. Among them, most of the stakeholders are in financial investment and real estate activities, agriculture, and energy.
After collecting the data and scores of indicators given by stakeholders for each alternative of land-use, in order to testify the results of this survey, this study used reliability and validity tests for further analysis.
(1) Reliability test
The scale reliability of the results can be tested by calculating the interitem Cronbach , which is widely used for measuring each interitem covariance and scale reliability coefficient. This study uses STATA 14.1 software to calculate the interitem covariance. As indicated in Table 4, the values of alpha are higher than 0.8, which are higher than the normal acceptable value (0.7) [42,43]. The Cronbach’s alpha indicates good internal consistency in the scale and they measure the same thing. Therefore, the Cronbach α confirms the scale reliability in this study [44,45].
(2) Validity test
The validity of this survey can be analysed through construct validity. As shown in Table 5, the overall KMO value is 0.852, and the value of each item is higher than the normal acceptable value (0.7) [46], indicating that this survey is suitable for factor analysis. Moreover, using Bartlett’s test of sphericity, as each p value is 0 with statistical significance, it illustrates that this survey conforms to unit matrix and can be used for factor analysis. Combining the results of KMO and Bartlett’s test, this survey is practical and suitable for factor analysis with relatively high construct validity.
4. Results
4.1. Scores of Indicators
Based on the data collected, the means of the scores of the 20 sustainability indicators for bioenergy, food production, and housing are calculated via the formula: The score of each indicator , ranges from −3 to 3 (, where the sequence of indicator is i, the sequence of stakeholders is j. , t , represents the alternatives of land-use.
The results of the means of the 20 indicators are shown in Figure 4 below. (1) Economic dimension: Land-use for housing is more sustainable regarding profits, government revenues and infrastructure promotion and local industrial development. Compared with food, the economic performance of bioenergy is much higher in most of the economic indicators, including profits, land productivity, government revenues, promotion on infrastructure and local industrial development. (2) Environmental dimension: The environmental performance of bioenergy is the most outstanding, and food production scores slightly lower, while housing contributes little to sustainability of land use. (3) Social dimension: In terms of employment opportunity, poverty alleviation, wellbeing, and satisfaction in local area, land use for housing scores higher than bioenergy and food production, while overall, bioenergy has a good performance in the social dimension.
4.2. Overall Sustainability Scores of Three Alternatives
In order to calculate weighted score of indicators and overall sustainability score of three alternatives, the scores and weights of indicators were acquired through questionnaires on stakeholders’ opinions and from experts respectively, and their means and are used to calculate the final overall score , as shown in the formula: ; , .
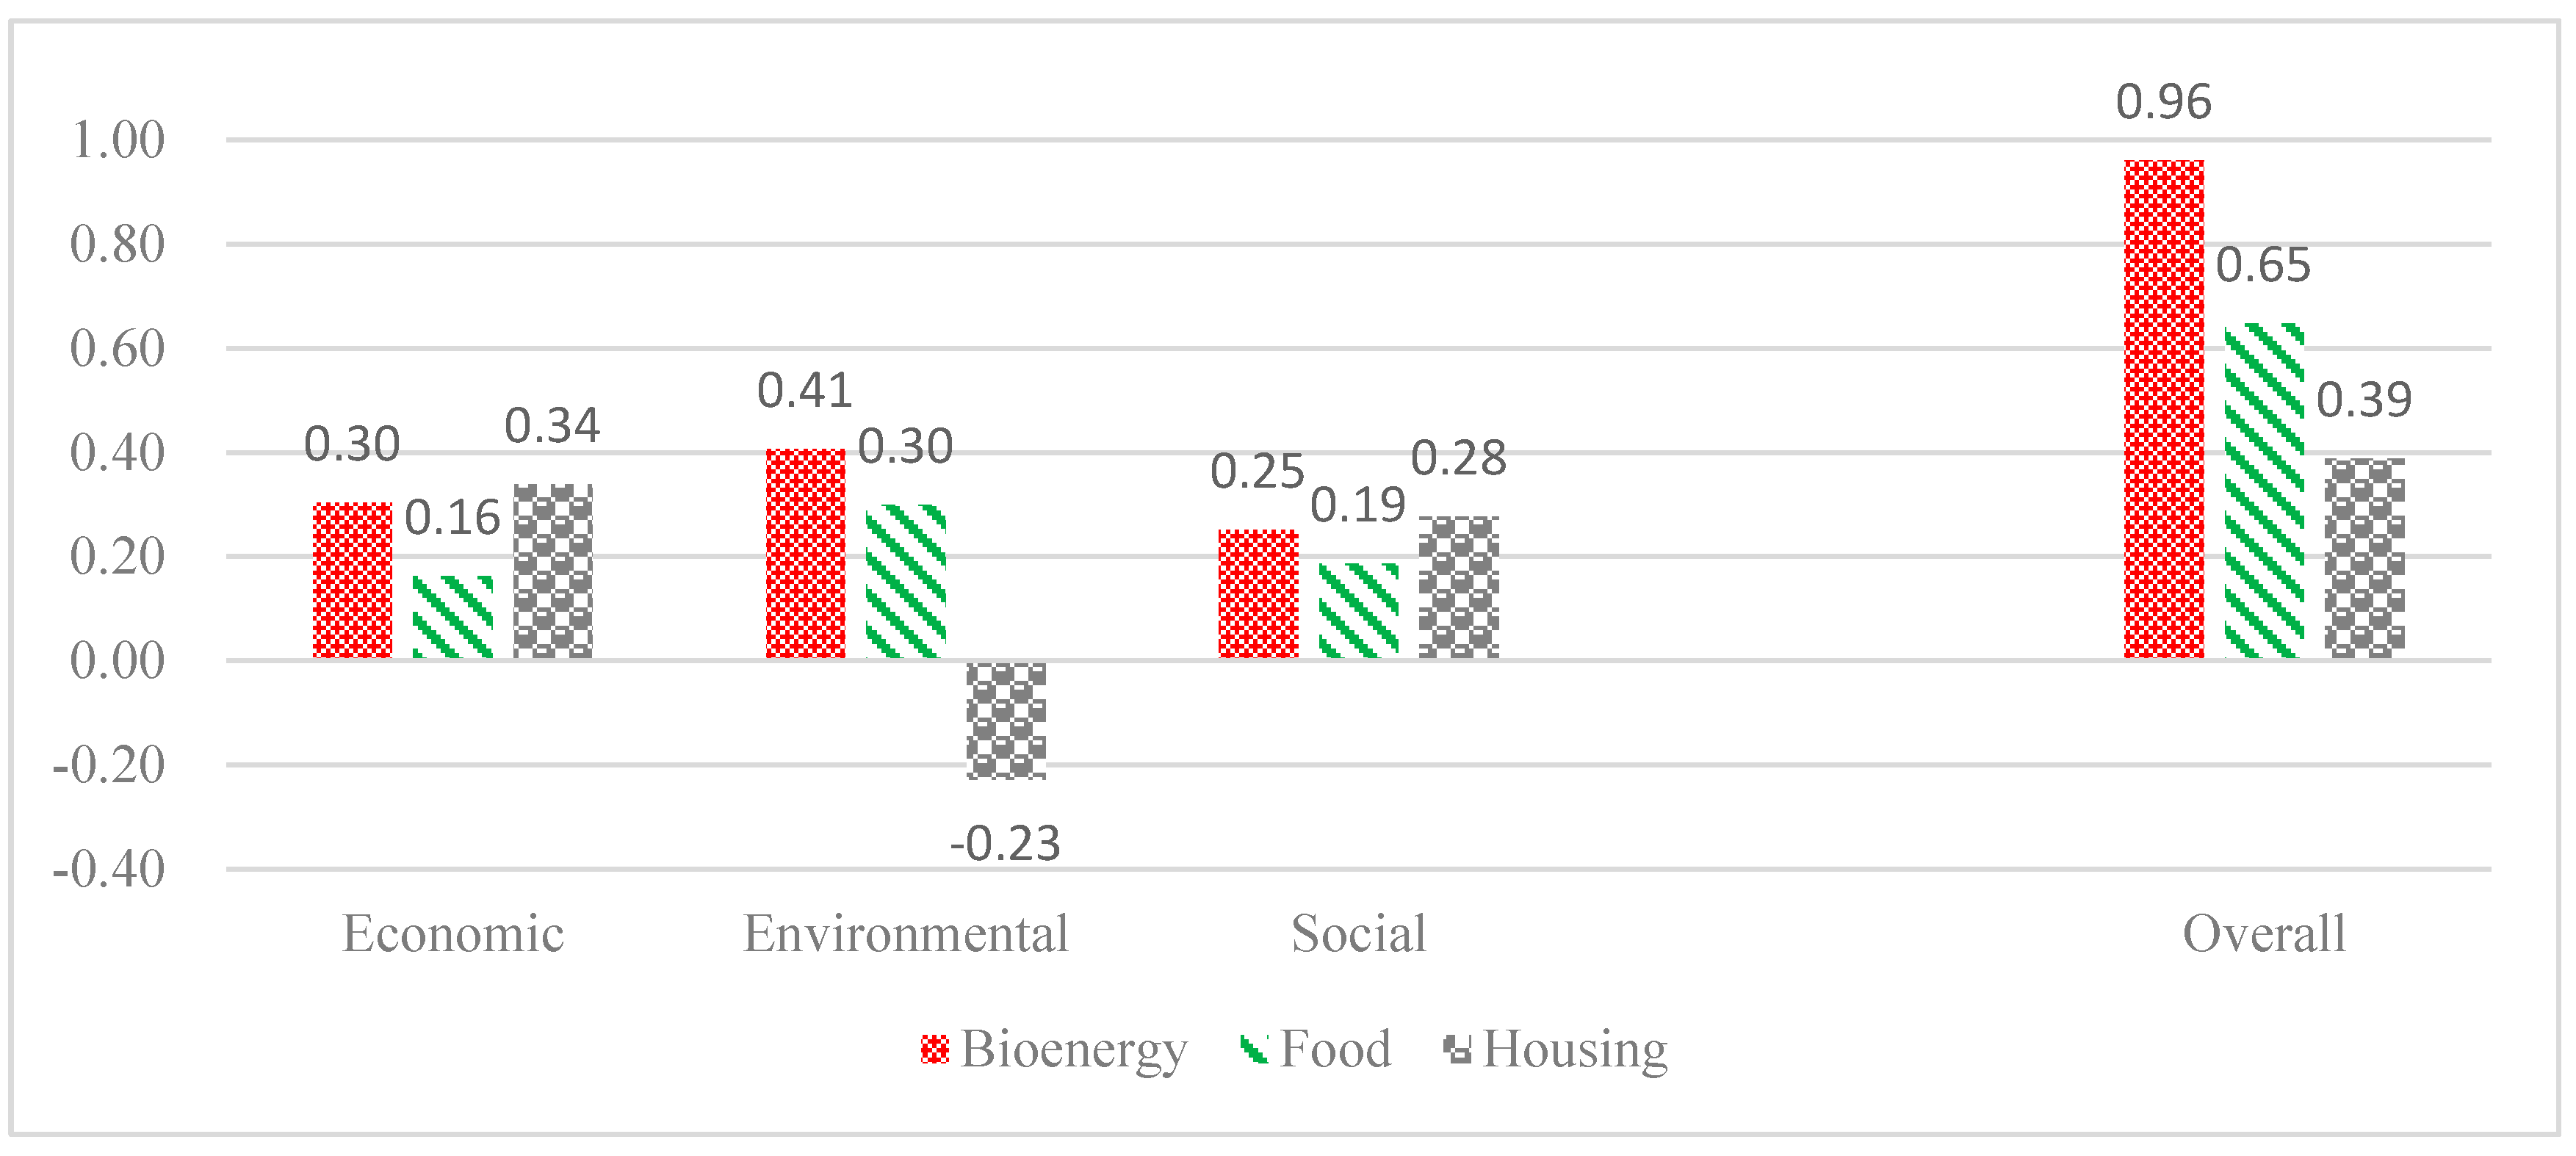
After calculating the total weighted scores, the overall sustainability scores of land-use for three alternatives are Sbioenergy (0.96) > Sfood (0.65) > Shousing (0.39). This result indicates that the overall sustainability score of land-use for bioenergy is the highest, and that land-use for housing is the lowest. As shown in Figure 5, bioenergy scores are slightly lower than housing in the economic dimension, but are almost doubles that of food production. In the environmental dimension, bioenergy shows the highest sustainability, followed by food production, while housing has a negative impact on the environment. With regard to sustainability in the social dimension, bioenergy ranks lower than housing and higher than food production.
5. Conclusions and Implication
This study quantitatively examines the sustainability of land-use in a holistic manner. After investigating the merits and problems of land-use for bioenergy, this study evaluates the comprehensive sustainability of land-use for bioenergy, food production, and housing by comparing the relative sustainability in the economic, environmental, and social dimensions. Due to multiple criteria and different alternatives involved in evaluating the comprehensive sustainability of land-use, most current methods and data sources cannot be applied in addressing this problem. This study mainly adopts an approach that is both quantitative and qualitative: multi-criteria analysis (MCA), with support from Delphi method, the AHP method, and surveys, to examine a full range of sustainable indicators of three land-use alternatives. The results of this study show that bioenergy is one of the most sustainable land-use alternatives for the public. Land-use for food production is also sustainable. However, traditional agricultural land-use is less sustainable than bioenergy, to a certain extent.
To conclude, through an investigation of the case in China, the result of this study indicates that developing bioenergy is relatively more sustainable. Thus, from a sustainability point of view, land-use for bioenergy should be encouraged, which could be referenced as a support for policy evaluation in land allocation issues.
Although the result of the land-use sustainability is straightforward from a methodological perspective, certain constraints and limitations remain in this study. When using MCA, for instance, weights of indicators measured by experts are based on their preference, which has a probability of being relatively subjective. Moreover, due to data unavailability in multiple factors, the scores of indicators are surveyed by questionnaires rather than official statistical data. The case study is also limited by the number of stakeholders and geographical distribution. Stakeholders from the general public may inaccurately estimate essential options without adequate appropriate knowledge.
Acknowledgments
The authors would like to acknowledge the experts who participated in this project and all the survey participants. The authors would like to thank the editors and the three anonymous reviewers for their valuable comments and suggestions. The authors would like to thank Douglas Crawford-Brown, Yuandi Wang, Andreas Kontoleon and Dariusz Wójcik for their kind support. We also appreciate the kind advice from the colleagues when Jiashun Huang presented this study at the Institute for New Economic Thinking at the Oxford Martin School. Finally, the authors would like to thank the Swire Educational Trust, Shenzhen Universiade International Scholarship Foundation, and the St Antony’s College.
Author Contributions
All the authors contributed adequately to this manuscript and approved the final version of the manuscript.
Conflicts of Interest
The authors declare no conflicts of interest.
References
- Harris, Z.M.; Spake, R.; Taylor, G. Land use change to bioenergy: A meta-analysis of soil carbon and ghg emissions. Biomass Bioenergy 2015, 82, 27–39. [Google Scholar] [CrossRef]
- Lin, G.C.S.; Ho, S.P.S. China’s land resources and land-use change: Insights from the 1996 land survey. Land Use Policy 2003, 20, 87–107. [Google Scholar] [CrossRef]
- Burkholder, S. The new ecology of vacancy: Rethinking land use in shrinking cities. Sustainability 2012, 4, 1154–1172. [Google Scholar] [CrossRef]
- Foley, J.A.; DeFries, R.; Asner, G.P.; Barford, C.; Bonan, G.; Carpenter, S.R.; Chapin, F.S.; Coe, M.T.; Daily, G.C.; Gibbs, H.K.; et al. Global consequences of land use. Science 2005, 309, 570–574. [Google Scholar] [CrossRef] [PubMed]
- Kalnay, E.; Cai, M. Impact of urbanization and land-use change on climate. Nature 2003, 423, 528–531. [Google Scholar] [CrossRef] [PubMed]
- Wuelser, G. Towards adequately framing sustainability goals in research projects: The case of land use studies. Sustain. Sci. 2014, 9, 263–276. [Google Scholar] [CrossRef]
- Apollonio, C.; Balacco, G.; Novelli, A.; Tarantino, E.; Piccinni, A.F. Land use change impact on flooding areas: The case study of cervaro basin (Italy). Sustainability 2016. [Google Scholar] [CrossRef]
- Skevas, T.; Hayden, N.J.; Swinton, S.M.; Lupi, F. Landowner willingness to supply marginal land for bioenergy production. Land Use Policy 2016, 50, 507–517. [Google Scholar] [CrossRef]
- Searchinger, T.; Heimlich, R.; Houghton, R.A.; Dong, F.; Elobeid, A.; Fabiosa, J.; Tokgoz, S.; Hayes, D.; Yu, T.-H. Use of us croplands for biofuels increases greenhouse gases through emissions from land-use change. Science 2008, 319, 1238–1240. [Google Scholar] [CrossRef] [PubMed]
- SooHoo, W.M.; Wang, C.Z.; Li, H.X. Geospatial assessment of bioenergy land use and its impacts on soil erosion in the us midwest. J. Environ. Manag. 2017, 190, 188–196. [Google Scholar] [CrossRef] [PubMed]
- Wu, F.; Zhang, D.; Zhang, J. Will the development of bioenergy in china create a food security problem? Modeling with fuel ethanol as an example. Renew. Energy 2012, 47, 127–134. [Google Scholar] [CrossRef]
- Colantoni, A.; Delfanti, L.; Recanatesi, F.; Tolli, M.; Lord, R. Land use planning for utilizing biomass residues in tuscia romana (central Italy): Preliminary results of a multi criteria analysis to create an agro-energy district. Land Use Policy 2016, 50, 125–133. [Google Scholar] [CrossRef]
- Kumar, B.; Hiremath, R.B.; Balachandra, P.; Ravindranath, N.H. Bioenergy and food security: Indian context. Energy Sustain. Dev. 2009, 13, 265–270. [Google Scholar] [CrossRef]
- Hazell, P.; Pachauri, R. Bioenergy and Agriculture: Promises and Challenges; IFPRI: Washington, WA, USA, 2006; Volume 2020. [Google Scholar]
- Rosegrant, M.W.; Msangi, S.; Sulser, T.B. Bioenergy and Agriculture: Promises and Challenges: Biofuels and the Global Food Balance; International Food Policy Research Institute: Washington, WA, USA, 2014. [Google Scholar]
- Organization, A. The State of Food and Agriculture 2008: Biofuels: Prospects, Risks and Opportunities; Food & Agriculture Organization: Rome, Italy, 2008. [Google Scholar]
- De La Torre Ugarte, D.G. Developing Bioenergy Economic and Social Issues: Bioenergy and Agriculture Promises and Challenges; International Food Policy Research Institute (IFPRI): Washington, WA, USA, 2006. [Google Scholar]
- Farrell, A.E.; Plevin, R.J.; Turner, B.T.; Jones, A.D.; O’Hare, M.; Kammen, D.M. Ethanol can contribute to energy and environmental goals. Science 2006, 311, 506–508. [Google Scholar] [CrossRef] [PubMed]
- Arevalo, J.; Ochieng, R.; Mola-Yudego, B.; Gritten, D. Understanding bioenergy conflicts: Case of a jatropha project in kenya’s tana delta. Land Use Policy 2014, 41, 138–148. [Google Scholar] [CrossRef]
- Gao, Y.; Skutsch, M.; Drigo, R.; Pacheco, P.; Masera, O. Assessing deforestation from biofuels: Methodological challenges. Appl. Geogr. 2011, 31, 508–518. [Google Scholar] [CrossRef]
- Bioenergy, I. Bioenergy—A Sustainable and Reliable Energy Source; International Energy Agency Bioenergy: Paris, France, 2009. [Google Scholar]
- Koizumi, T. Biofuel and food security in china and japan. Renew. Sustain. Energy Rev. 2013, 21, 102–109. [Google Scholar] [CrossRef]
- Mukherjee, I.; Sovacool, B.K. Palm oil-based biofuels and sustainability in southeast asia: A review of indonesia, malaysia, and thailand. Renew. Sustain. Energy Rev. 2014, 37, 1–12. [Google Scholar] [CrossRef]
- Miyake, S.; Smith, C.; Peterson, A.; McAlpine, C.; Renouf, M.; Waters, D. Environmental implications of using ‘underutilised agricultural land’ for future bioenergy crop production. Agric. Syst. 2015, 139, 180–195. [Google Scholar] [CrossRef]
- Huang, I.B.; Keisler, J.; Linkov, I. Multi-criteria decision analysis in environmental sciences: Ten years of applications and trends. Sci. Total Environ. 2011, 409, 3578–3594. [Google Scholar] [CrossRef] [PubMed]
- Gamper, C.D.; Turcanu, C. On the governmental use of multi-criteria analysis. Ecol. Econ. 2007, 62, 298–307. [Google Scholar] [CrossRef]
- Morimoto, R. Incorporating socio-environmental considerations into project assessment models using multi-criteria analysis: A case study of sri lankan hydropower projects. Energy Policy 2013, 59, 643–653. [Google Scholar] [CrossRef]
- Popiolek, N.; Thais, F. Multi-criteria analysis of innovation policies in favour of solar mobility in france by 2030. Energy Policy 2016, 97, 202–219. [Google Scholar] [CrossRef]
- Fontana, V.; Radtke, A.; Fedrigotti, V.B.; Tappeiner, U.; Tasser, E.; Zerbe, S.; Buchholz, T. Comparing land-use alternatives: Using the ecosystem services concept to define a multi-criteria decision analysis. Ecol. Econ. 2013, 93, 128–136. [Google Scholar] [CrossRef]
- Park, D.; Kim, Y.; Um, M.-J.; Choi, S.-U. Robust priority for strategic environmental assessment with incomplete information using multi-criteria decision making analysis. Sustainability 2015, 7, 10233–10249. [Google Scholar] [CrossRef]
- Erzurumlu, S.S.; Erzurumlu, Y.O. Sustainable mining development with community using design thinking and multi-criteria decision analysis. Resour. Policy 2015, 46, 6–14. [Google Scholar] [CrossRef]
- Buchholz, T.; Rametsteiner, E.; Volk, T.A.; Luzadis, V.A. Multi criteria analysis for bioenergy systems assessments. Energy Policy 2009, 37, 484–495. [Google Scholar] [CrossRef]
- Clo, S.; Battles, S.; Zoppoli, P. Policy options to improve the effectiveness of the eu emissions trading system: A multi-criteria analysis. Energy Policy 2013, 57, 477–490. [Google Scholar] [CrossRef]
- Klein, S.J.W.; Whalley, S. Comparing the sustainability of us electricity options through multi-criteria decision analysis. Energy Policy 2015, 79, 127–149. [Google Scholar] [CrossRef]
- Billig, E.; Thrän, D. Evaluation of biomethane technologies in europe—Technical concepts under the scope of a delphi-survey embedded in a multi-criteria analysis. Energy 2016, 114, 1176–1186. [Google Scholar] [CrossRef]
- Bolger, F.; Wright, G. Use of expert knowledge to anticipate the future: Issues, analysis and directions. Int. J. Forecast. 2017, 33, 230–243. [Google Scholar] [CrossRef]
- Di Zio, S.; Maretti, M. Acceptability of energy sources using an integration of the delphi method and the analytic hierarchy process. Qual. Quant. 2014, 48, 2973–2991. [Google Scholar] [CrossRef]
- Dalkey, N.; Helmer, O. An experimental application of the delphi method to the use of experts. Manag. Sci. 1963, 9, 458–467. [Google Scholar] [CrossRef]
- Cho, S.; Kim, J.; Heo, E. Application of fuzzy analytic hierarchy process to select the optimal heating facility for korean horticulture and stockbreeding sectors. Renew. Sustain. Energy Rev. 2015, 49, 1075–1083. [Google Scholar] [CrossRef]
- Oltean-Dumbrava, C.; Miah, A. Assessment and relative sustainability of common types of roadside noise barriers. J. Clean. Prod. 2016, 135, 919–931. [Google Scholar] [CrossRef]
- Gill, R.T.; Thornton, S.F.; Harbottle, M.J.; Smith, J.W.N. Sustainability assessment of electrokinetic bioremediation compared with alternative remediation options for a petroleum release site. J. Environ. Manag. 2016, 184, 120–131. [Google Scholar] [CrossRef] [PubMed]
- Brazier, J.E.; Harper, R.; Jones, N.; O’cathain, A.; Thomas, K.; Usherwood, T.; Westlake, L. Validating the sf-36 health survey questionnaire: New outcome measure for primary care. BMJ 1992, 305, 160–164. [Google Scholar] [CrossRef] [PubMed]
- Antonovsky, A. The structure and properties of the sense of coherence scale. Soc. Sci. Med. 1993, 36, 725–733. [Google Scholar] [CrossRef]
- Western, J.; Stimson, R.; Baum, S.; Van Gellecum, Y. Measuring community strength and social capital. Reg. Stud. 2005, 39, 1095–1109. [Google Scholar] [CrossRef]
- Hassan, L.M.; Shiu, E.; Walsh, G. A multi-country assessment of the long-term orientation scale. Int. Mark. Rev. 2011, 28, 81–101. [Google Scholar] [CrossRef]
- Roweis, S.T.; Saul, L.K. Nonlinear dimensionality reduction by locally linear embedding. Science 2000, 290, 2323–2326. [Google Scholar] [CrossRef] [PubMed]
Figure 1.
The amount of biofuel production in China, 2002–2014. Note: Data source: Statistical Review of World Energy (http://datacatalog.worldbank.org/).
Figure 1.
The amount of biofuel production in China, 2002–2014. Note: Data source: Statistical Review of World Energy (http://datacatalog.worldbank.org/).

Figure 2.
The amount of carbon dioxide emission in China, 1960–2011. Note: Data source: The World Bank’s Open Data (http://datacatalog.worldbank.org/).
Figure 2.
The amount of carbon dioxide emission in China, 1960–2011. Note: Data source: The World Bank’s Open Data (http://datacatalog.worldbank.org/).
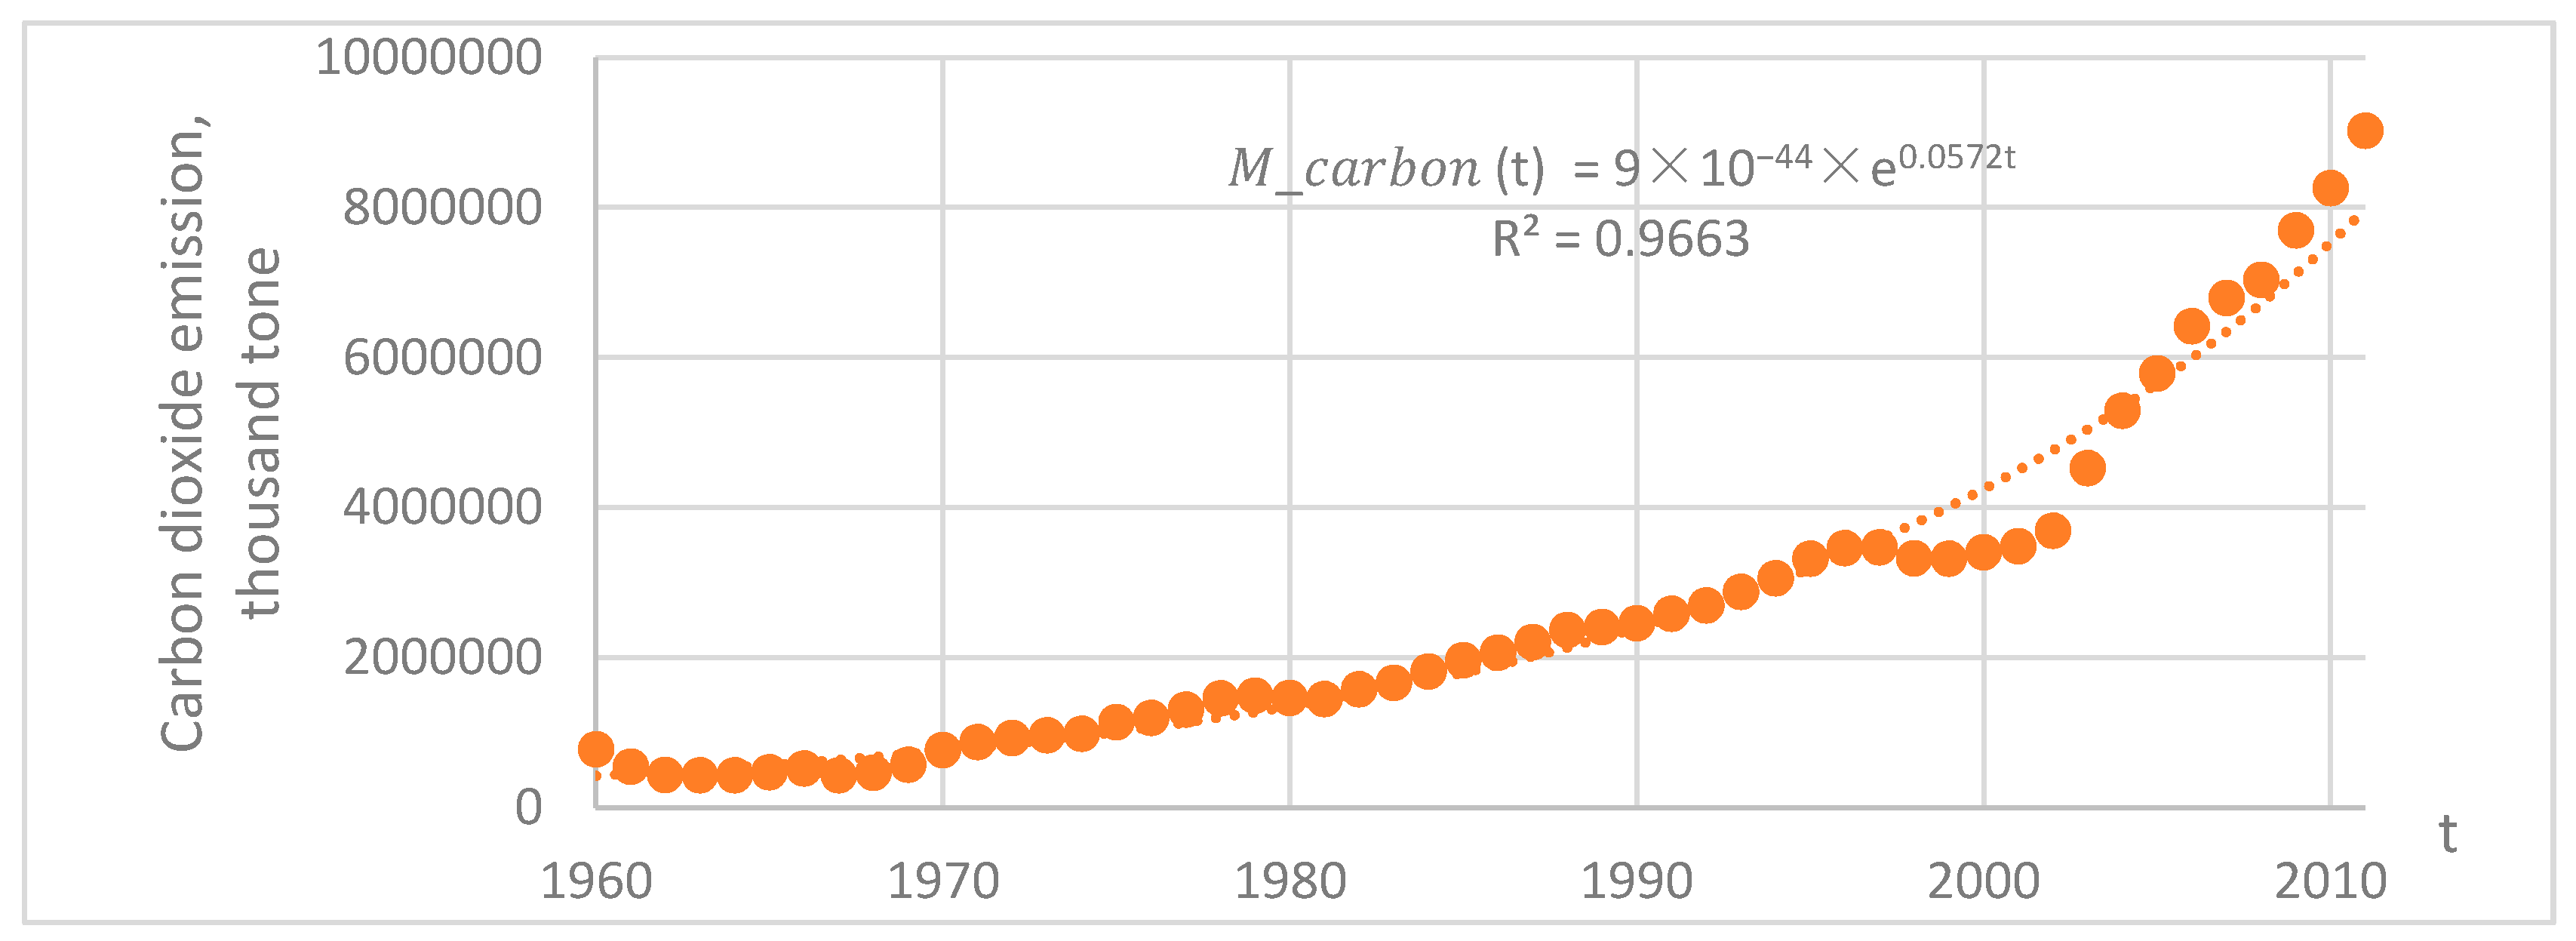
Figure 3.
The amount of arable land in China, 1960–2011. Note: Data source: The World Bank’s Open Data (http://datacatalog.worldbank.org/).
Figure 3.
The amount of arable land in China, 1960–2011. Note: Data source: The World Bank’s Open Data (http://datacatalog.worldbank.org/).

Figure 4.
Scores of indicators.
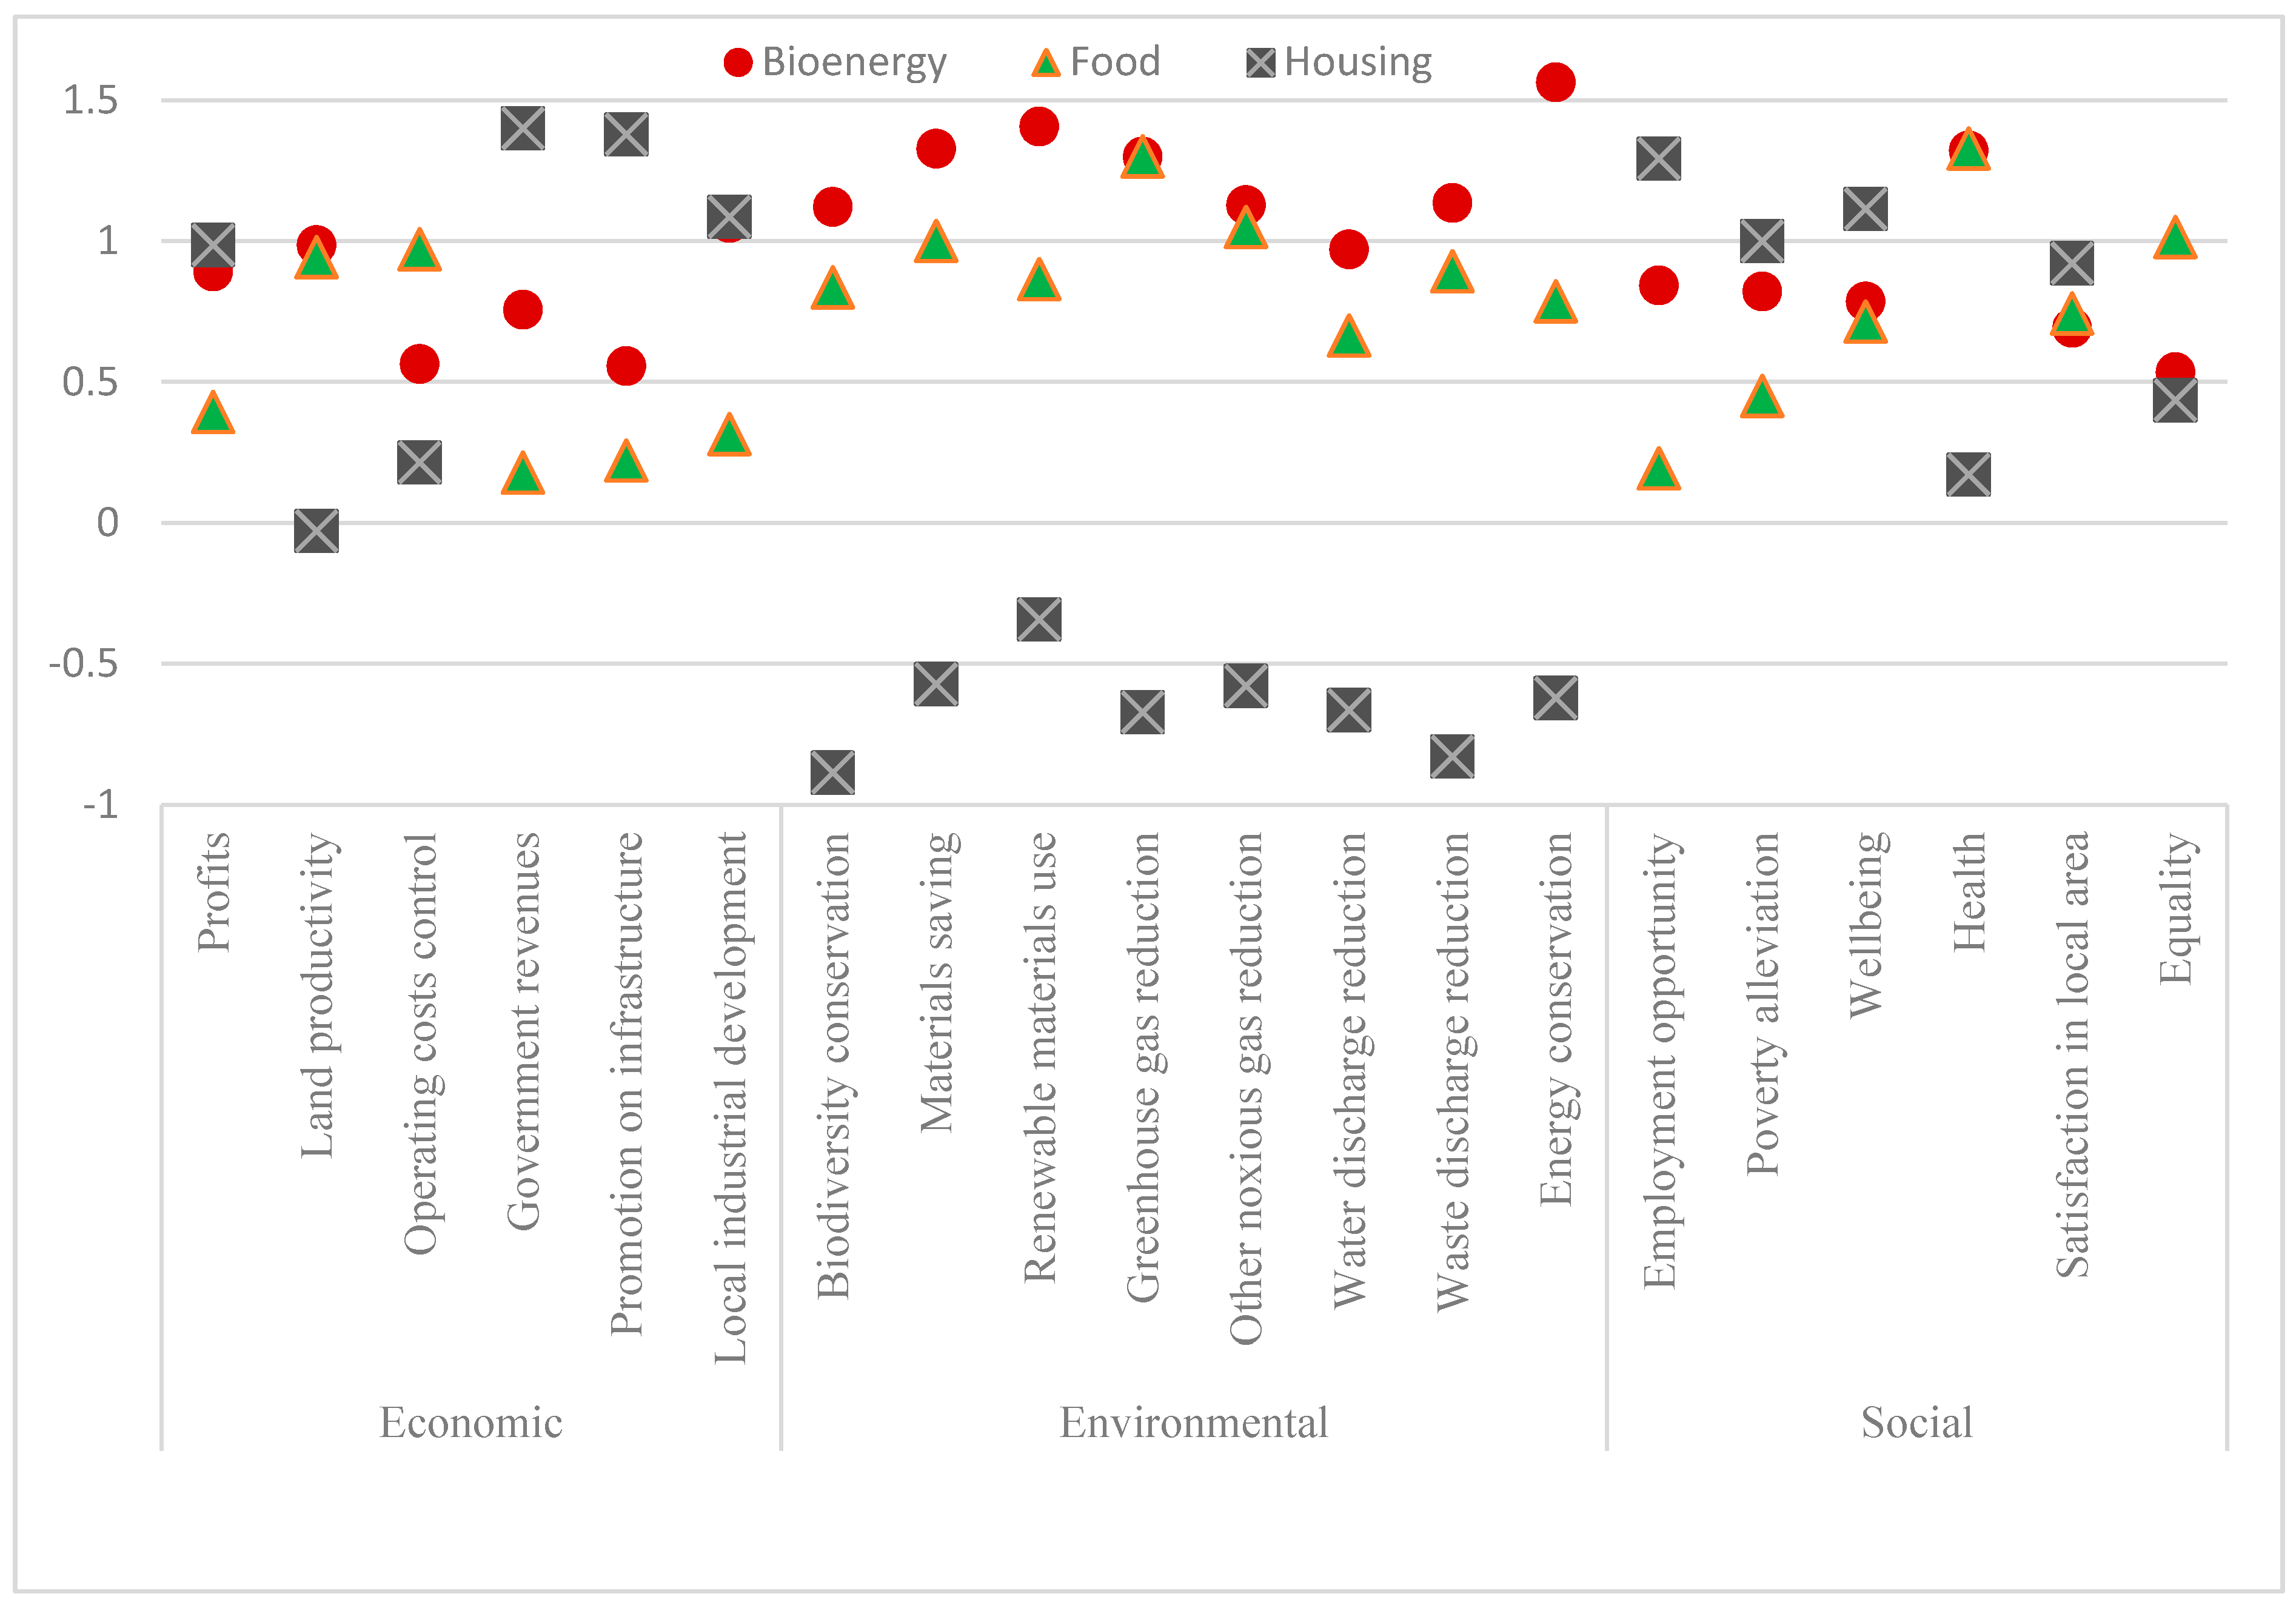
Figure 5.
The sustainability of land-use for three alternatives.


Table 1.
Criteria of sustainability.
| Dimension | Attributes | Indicators | References |
|---|---|---|---|
| Economic | Economic performance | Profits | [29,31,32,33] |
| Land productivity | |||
| Operating costs control | |||
| Government revenues | |||
| Indirect economic impacts | Promotion on infrastructure | ||
| Local industrial development | |||
| Environmental | Biodiversity | Biodiversity conservation | [29,30,31,32,33] |
| Resource use | Materials saving | ||
| Renewable materials use | |||
| Emissions | Greenhouse gas reduction | ||
| Other noxious gas reduction | |||
| Effluents | Water discharge reduction | ||
| Waste | Waste discharge reduction | ||
| Energy | Energy conservation | ||
| Social | Employment | Employment opportunity | [27,31,32,34] |
| Societal living standard | Poverty alleviation | ||
| Wellbeing | |||
| Social responsibility | Health | ||
| Satisfaction in local area | |||
| Human rights | Equality |
Table 2.
Experts for weighting the factors.
| Fields | Number | Brief Introduction of the Experts |
|---|---|---|
| Agriculture | 2 | A CEO of an agricultural company and a researcher in Agriculture in China |
| Bioenergy | 1 | A Chinese researcher in Bioenergy at a UK university |
| Housing | 1 | A director in a Chinese real estate company |
| Land Planning | 1 | A Chinese researcher in Land Economy at a UK university |
| Environment | 1 | A researcher in Environmental Policy at a UK university |
| Investment | 1 | A founder of a financial company in China |
| Sociology | 1 | A researcher in Sociology at a Chinese university |
| Government | 2 | Two senior government officials in China |
Table 3.
Indicators and weights.
| Dimension | Wd | Attributes | Wa | Indicators | Wi (Std. Dev.) |
|---|---|---|---|---|---|
| Economic | 36.50 | Economic performance | 22.03 | Profits | 9.14 (1.94) |
| Land productivity | 3.98 (1.93) | ||||
| Operating costs control | 4.29 (1.64) | ||||
| Government revenues | 4.62 (2.13) | ||||
| Indirect economic impacts | 14.48 | Promotion on infrastructure | 6.14 (2.17) | ||
| Local industrial development | 8.34 (2.41) | ||||
| Environmental | 33.50 | Biodiversity | 6.00 | Biodiversity conservation | 6.00 (2.12) |
| Resource use | 5.35 | Materials saving | 2.70 (1.09) | ||
| Renewable materials use | 2.65 (0.73) | ||||
| Emissions | 7.30 | Greenhouse gas reduction | 3.92 (3.08) | ||
| Other noxious gas reduction | 3.39 (1.91) | ||||
| Effluents | 6.00 | Water discharge reduction | 6.00 (2.35) | ||
| Waste | 4.75 | Waste discharge reduction | 4.75 (1.62) | ||
| Energy | 4.10 | Energy conservation | 4.10 (1.43) | ||
| Social | 30 | Employment | 9.95 | Employment opportunity | 9.95 (3.31) |
| Societal living standard | 10.07 | Poverty alleviation | 5.23 (2.27) | ||
| Wellbeing | 4.85 (2.37) | ||||
| Social responsibility | 6.00 | Health | 3.81 (1.93) | ||
| Satisfaction in local area | 2.19 (0.84) | ||||
| Human rights | 3.98 | Equality | 3.98 (1.91) |
Table 4.
Scale reliability test.
| Group | Average Interitem Covariance | Number of Items | Scale Reliability Coefficient |
|---|---|---|---|
| Total | 0.600 | 60 | 0.961 |
| Bioenergy-Economic | 0.741 | 6 | 0.825 |
| Food-Economic | 0.870 | 6 | 0.814 |
| Housing-Economic | 0.646 | 6 | 0.703 |
| Bioenergy-Environmental | 1.146 | 8 | 0.918 |
| Food-Environmental | 1.012 | 8 | 0.911 |
| Housing-Environmental | 2.037 | 8 | 0.955 |
| Bioenergy-Social | 0.989 | 6 | 0.872 |
| Food-Social | 1.024 | 6 | 0.874 |
| Housing-Social | 1.024 | 6 | 0.874 |
Table 5.
Bartlett’s test of sphericity.
| Group | Det | Chi-Square | Degree of Freedom | p-Value | KMO |
|---|---|---|---|---|---|
| Total | 0.000 | 7026.399 | 1770 | 0 | 0.852 |
| Bioenergy-Economic | 0.152 | 256.907 | 15 | 0 | 0.871 |
| Food-Economic | 0.158 | 251.051 | 15 | 0 | 0.837 |
| Housing-Economic | 0.247 | 190.470 | 15 | 0 | 0.724 |
| Bioenergy-Environmental | 0.006 | 687.250 | 28 | 0 | 0.900 |
| Food-Environmental | 0.011 | 608.366 | 28 | 0 | 0.918 |
| Housing-Environmental | 0.000 | 1065.263 | 28 | 0 | 0.936 |
| Bioenergy-Social | 0.056 | 393.325 | 15 | 0 | 0.857 |
| Food-Social | 0.042 | 430.255 | 15 | 0 | 0.844 |
| Housing-Social | 0.042 | 430.255 | 15 | 0 | 0.844 |
© 2017 by the authors. Licensee MDPI, Basel, Switzerland. This article is an open access article distributed under the terms and conditions of the Creative Commons Attribution (CC BY) license (http://creativecommons.org/licenses/by/4.0/).
Share and Cite
MDPI and ACS Style
Huang, J.; Li, W.; Huang, X.; Guo, L. Analysis of the Relative Sustainability of Land Devoted to Bioenergy: Comparing Land-Use Alternatives in China. Sustainability 2017, 9, 801. https://doi.org/10.3390/su9050801
AMA Style
Huang J, Li W, Huang X, Guo L. Analysis of the Relative Sustainability of Land Devoted to Bioenergy: Comparing Land-Use Alternatives in China. Sustainability. 2017; 9(5):801. https://doi.org/10.3390/su9050801
Chicago/Turabian StyleHuang, Jiashun, Weiping Li, Xijie Huang, and Lijia Guo. 2017. "Analysis of the Relative Sustainability of Land Devoted to Bioenergy: Comparing Land-Use Alternatives in China" Sustainability 9, no. 5: 801. https://doi.org/10.3390/su9050801
Note that from the first issue of 2016, this journal uses article numbers instead of page numbers. See further details here.