
Examining Spatial Variation in the Effects of Japanese Red Pine (Pinus densiflora) on Burn Severity Using Geographically Weighted Regression

1
Graduate Program, Department of Environmental Science, Konkuk University, Gwangjin-gu, Seoul 05029, Korea
2
Department of Landscape Architecture, Gangneung-Wonju National University, Gangneung 25457, Korea
3
Department of Forestry and Landscape Architecture, Konkuk University, Gwangjin-gu, Seoul 05029, Korea
*
Author to whom correspondence should be addressed.
Sustainability 2017, 9(5), 804; https://doi.org/10.3390/su9050804
Submission received: 7 March 2017
/
Revised: 1 May 2017
/
Accepted: 4 May 2017
/
Published: 11 May 2017
Abstract
:Burn severity has profound impacts on the response of post-fire forest ecosystems to fire events. Numerous previous studies have reported that burn severity is determined by variables such as meteorological conditions, pre-fire forest structure, and fuel characteristics. An underlying assumption of these studies was the constant effects of environmental variables on burn severity over space, and these analyses therefore did not consider the spatial dimension. This study examined spatial variation in the effects of Japanese red pine (Pinus densiflora) on burn severity. Specifically, this study investigated the presence of spatially varying relationships between Japanese red pine and burn severity due to changes in slope and elevation. We estimated conventional ordinary least squares (OLS) and geographically weighted regression (GWR) models and compared them using three criteria; the coefficients of determination (R2), Akaike information criterion for small samples (AICc), and Moran’s I-value. The GWR model performed considerably better than the OLS model in explaining variation in burn severity. The results provided strong evidence that the effect of Japanese red pine on burn severity was not constant but varied spatially. Elevation was a significant factor in the variation in the effects of Japanese red pine on burn severity. The influence of red pine on burn severity was considerably higher in low-elevation areas but became less important than the other variables in high-elevation areas. The results of this study can be applied to location-specific strategies for forest managers and can be adopted to improve fire simulation models to more realistically mimic the nature of fire behavior.
1. Introduction
Forest fires profoundly impact the temporal and spatial dynamics of forest ecosystems by altering their biotic and abiotic conditions. Among many fire characteristics, burn severity is particularly important for understanding the response of damaged forests to fire events. Many studies have found close relationships between burn severity and the various post-fire ecological and physical processes of forests such as seed source availability [1], tree regeneration and recruitment [2,3,4,5,6], tree mortality [7], soil runoff and erosion [8,9,10], soil chemical properties [11,12,13], and animal population and community dynamics [14,15,16] at both local and landscape levels [17]. Burn severity is arguably a main driving factor in determining the complex and dynamic post-fire interactions among various components of forest ecosystems [18]. The type, composition, and configuration of regenerated forests in burned areas can exhibit significant spatial variation depending on the composition and patterns of the degree of burn severity [19].
According to the literature, the degree of burn severity is largely determined by various environmental factors, including meteorological conditions [20,21,22], pre-fire forest vegetation type [19,23,24], fuel moisture [25,26], tree stand density [27,28], composition and configuration of pre-fire forest [19,29,30,31,32,33], tree characteristics [34], and topography [19,20,21,22,23,24,28,30,33], as well as the interactions among relevant variables [22,24]. Considering that meteorological conditions and topological characteristics are not manageable factors, controlling susceptible fuels might be the only practical tool for lowering burn severity. Therefore, improving our understanding of the relationships between burn severity and susceptible forests in a given area may provide significant insights that can be used to assist prescribed burning, silviculture, and management of fire-resilient forests.
When examining the relationship between susceptible forest cover type and burn severity, most studies have adopted conventional ordinary least squares (OLS)-based statistical techniques such as Spearman’s rank correlation or regression analysis. A fundamental assumption of these techniques is that the effect of the independent variable (i.e., forest cover type) on the dependent variable (i.e., burn severity) is stationary, suggesting that the effects of forest cover type on burn severity are constant over space. Therefore, these conventional approaches can only capture the average effects of forest cover types on burn severity within the study area. However, this assumption has been challenged because it does not consider spatial characteristics or unique local settings and therefore cannot explain the unique burn mosaics that result from spatial variations in burn severity. The effects of certain forest cover types on burn severity are spatially heterogeneous because the complex and dynamic interactions among relevant variables are spatially heterogeneous, and these can alter the relationship between forest cover type and burn severity. Ultimately, these processes result in unique mosaics of burn severity. Using a conventional OLS approach to assess the relationship between susceptible forests and burn severity ignores local variations in burn severity, and it is limited in its ability to explain the formation of unique burn severity mosaics. Furthermore, the OLS approach only captures the average effects of forest type on burn severity over an entire study area. However, forest managers may need local information on the effects of forest cover type on burn severity to make area-specific management plans, manage fire-resilient forests, and reduce the degree of damage caused by fire on a local scale.
One of the most effective tools for examining localized effects is geographically weighted regression (GWR) [35,36]. GWR has been applied widely to various spatially oriented issues, including water quality [37,38], forestry [39], economics [40,41], remote sensing [42], and urban studies [43]. According to Nunes et al. [44], GWR can improve forest fire regime predictions by considering regression as a non-stationary spatial process. GWR can capture the spatial variability of the driving factors of wildfires and quantify their contributions [45]. Therefore, GWR modeling is becoming increasingly common in forest fire studies [44,46,47].
In this study, we examined the presence of non-stationary effects of Japanese red pine (Pinus densiflora) on burn severity. Studies in Korea have found that Japanese red pine is the forest cover type most susceptible to fire [19]. Lee et al. [19] reported a strong association between the percentage of Japanese red pine trees and burn severity (r = 0.58); indeed, the percentage of Japanese red pine trees within a grid was the most significant variable in explaining burn severity variation in regression trees. Their study suggested the presence of spatial variations in the relationship between red pine trees and burn severity. Therefore, we examined the non-stationary effects of red pine trees on burn severity. Many variables and their interactions are involved in determining burn severity at specific locations. However, it was beyond the scope of this study to examine all possible variables that affect the relationship between red pine trees and burn severity. Among the many relevant variables, we focused on elevation and slope as driving factors of the non-stationary effects of red pine trees on burn severity over space. Elevation and slope are the most common and simple measures of topographic characteristics, being associated with variables such as fuel and soil moisture, forest cover type, tree productivity, vegetation density, and fuel accumulation [22]. In this study, we aimed to (1) examine the presence of non-stationary effects of Japanese red pine trees on burn severity and (2) investigate variations in the relationship of different characteristics with burn severity.
The underlying rationale of these objectives is that the presence of Japanese red pine trees escalates the severity of burning due to their high susceptibility to fire. However, the effects of Japanese red pine on burn severity are not spatially constant (i.e., non-stationary) because various factors can alter the burning conditions in Japanese red pine among locations. This non-stationary effect of Japanese red pine on burn severity is due, in part, to topographic characteristics; elevation and slope can affect fuel moisture, available fuel, tree density, and forest cover type. Despite the utility of OLS approaches, they have been criticized for their inability to capture localized (i.e., non-stationary) relationships. Compared to OLS modeling (i.e., global modeling), GWR modeling (i.e., local modeling) can provide site-specific localized relationships between Japanese red pine and burn severity. Understanding the spatial variation in the influence of Japanese red pine on burn severity and the role of topographic characteristics in these relationships is particularly important to effectively practice prescribed burning and silviculture and to manage fire-resilient forests, particularly in forests dominated by Japanese red pine.
2. Methods and Data
2.1. Samcheok Fire and Site Characteristics
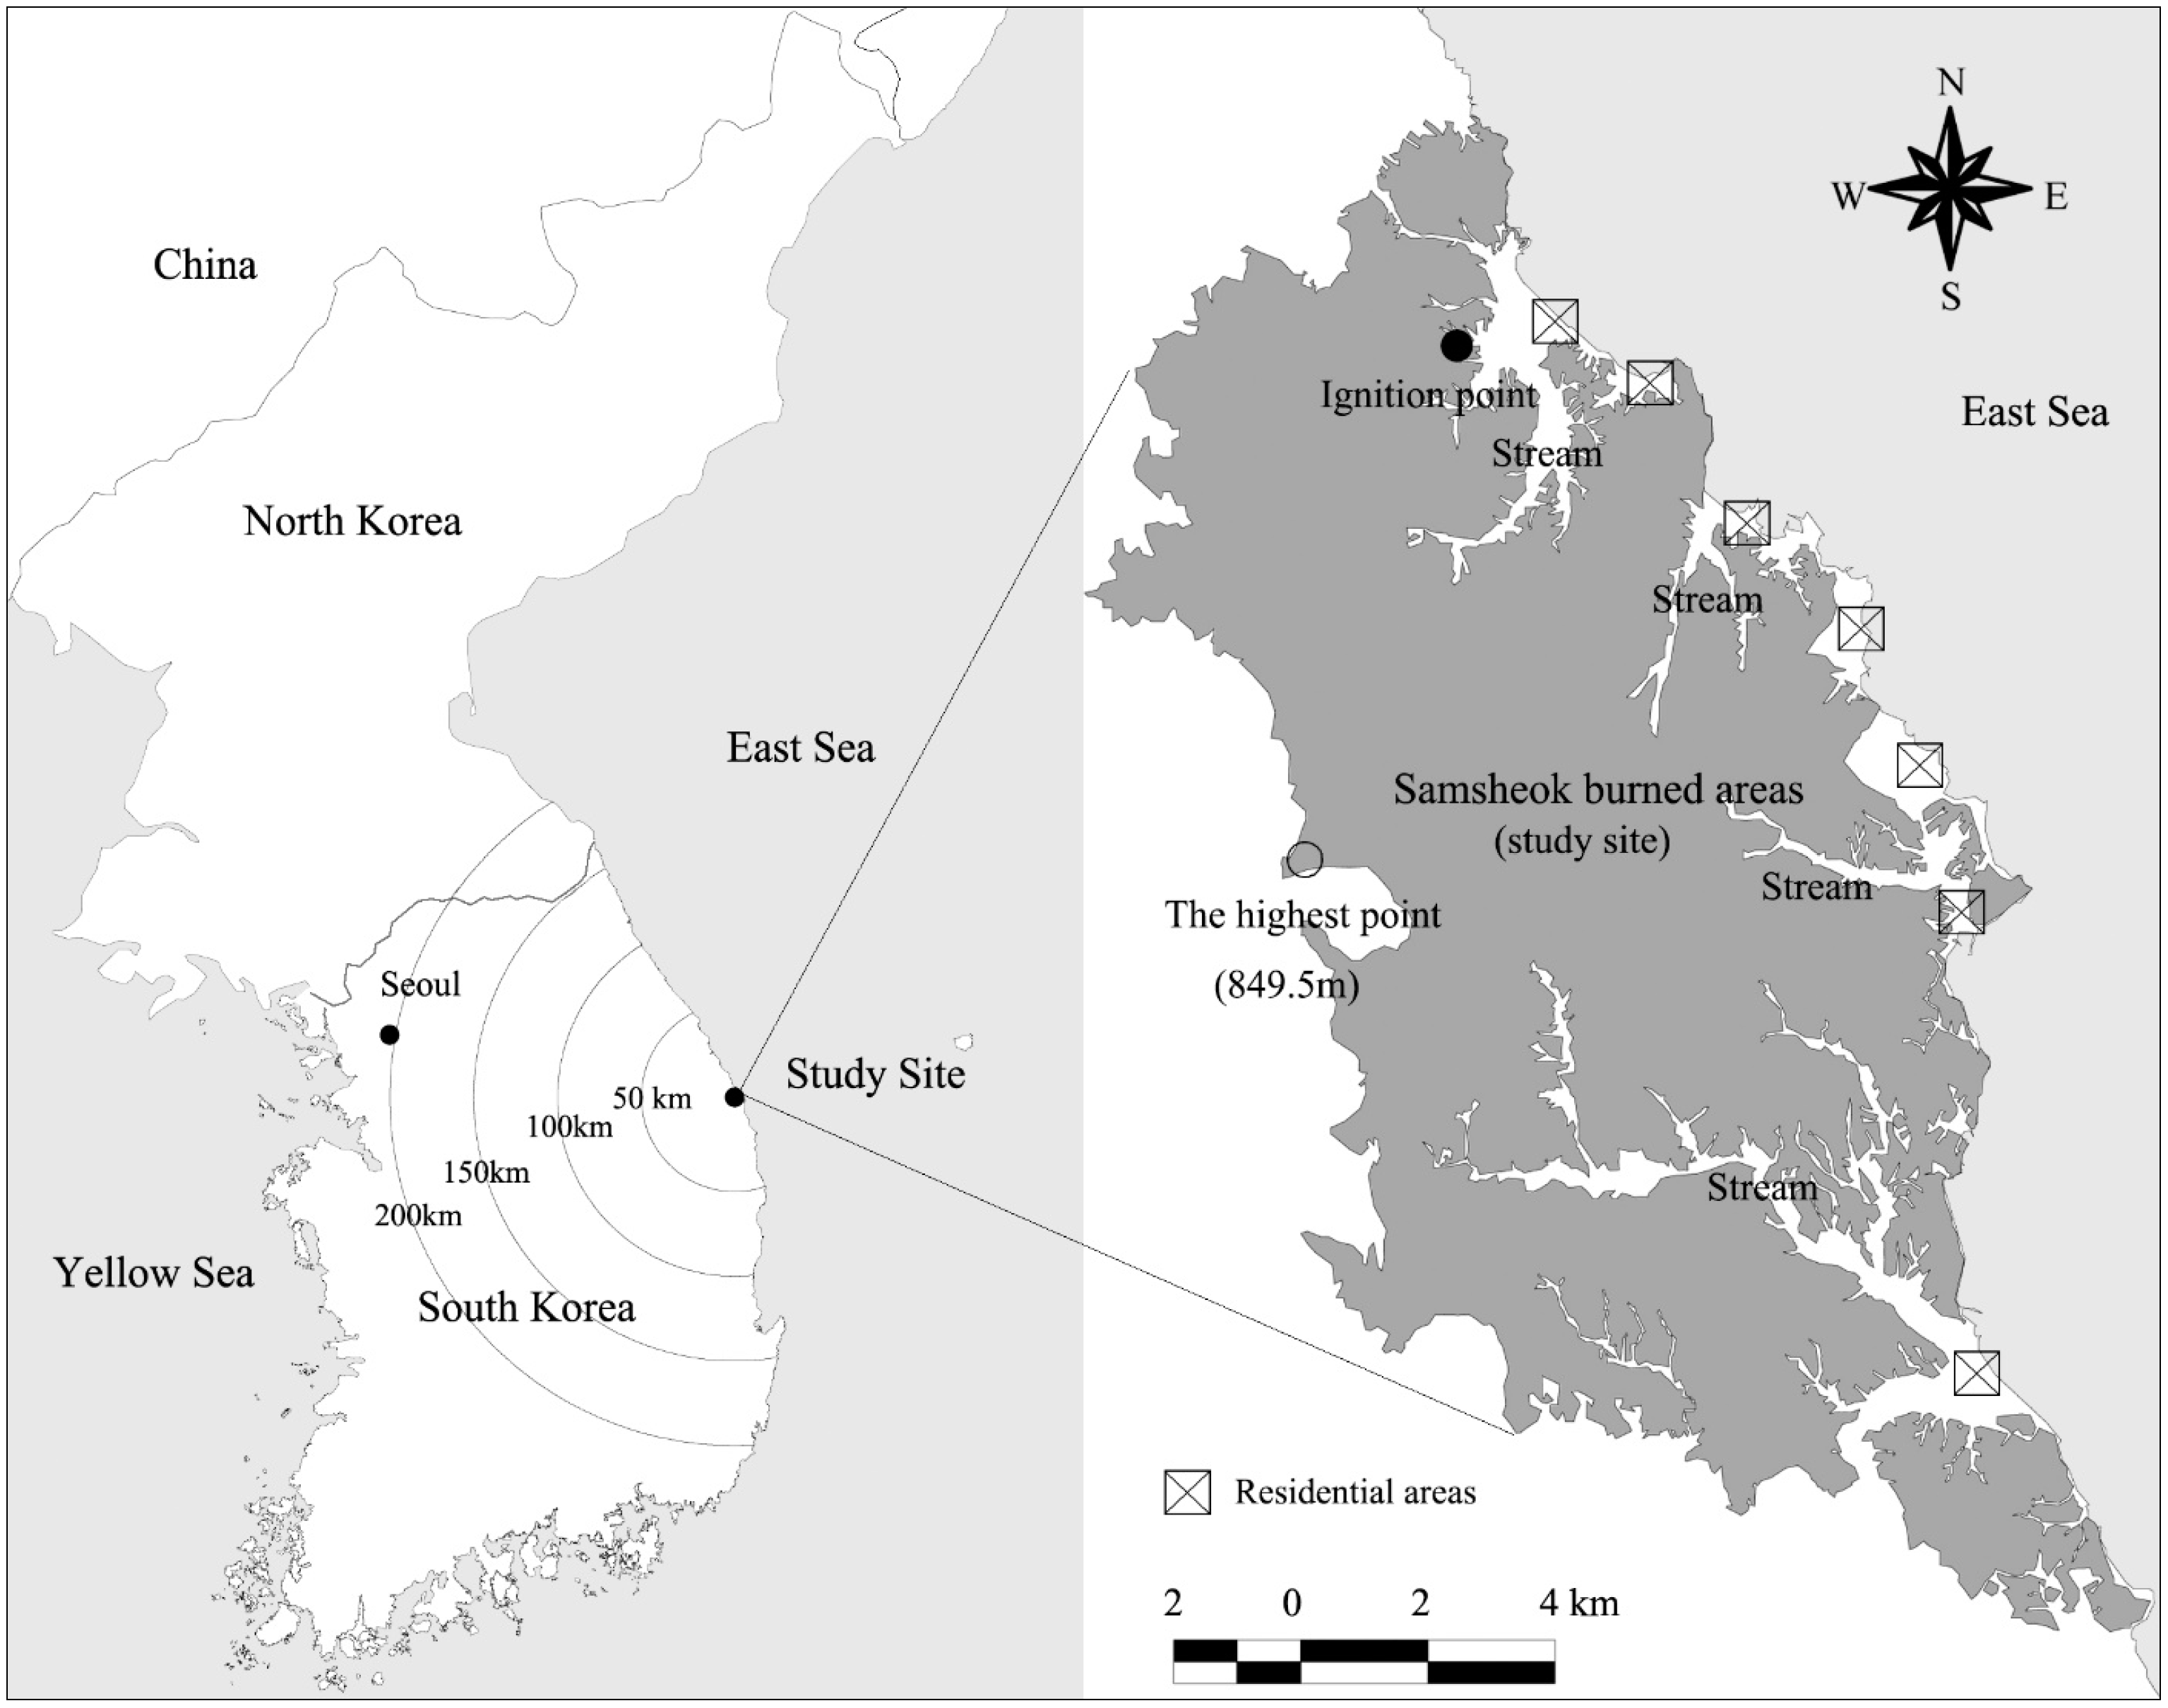
The study site in Samcheok, Korea, is located in the southeastern corner of the Korean Peninsula (Figure 1), which experiences a typical monsoon climate zone. The average annual temperature and precipitation are 12.1 °C and 1342 mm, respectively, although there are large seasonal variations in temperature and precipitation. In particular, two-thirds of the annual precipitation is concentrated in summer (June–August), and precipitation is scarce in spring (March–May), which is when most forest fires occur.
According to the Korean Forest Service [48], the Samcheok fire began on 7 April 2000 at a garbage-burning site and burned 16,151 ha of forest over nine consecutive days. According to the records, it is the largest forest fire to have occurred in Korea. During the event, the maximum wind speed was high (26.8 m/s) and the minimum relative humidity was considerably low (7%) [48]. The main pre-fire forest was dominated by Japanese red pine (Pinus densiflora Siebold and Zucc.). Other tree stands occupying the area included Korean pine (Pinus koraiensis Siebold and Zucc.), pitch pine (Pinus rigida Mill.), larch (Larix leptolepis Gordon), sawtooth oak (Quercus acutissima Carruth.), Mongolian oak (Quercus mongolica Fisch. ex Ledeb.), cork oak (Quercus variabilis Blume), Japanese chestnut (Castanea crenata Y. Z. Qi and Zucc.), and Japanese alder (Alnus japonica (Thunb.) Steud) [48].
Due to the magnitude of the damaged area and economic losses, various government agencies, including Korean Forest Service and the Ministry of Environment, as well as several private institutions, have been operating a number of long-term ecological research sites in the burned area to investigate various aspects of forest fires and post-fire responses of burned areas. The complex and dynamic topological characteristics of the site have been recognized in the official report of the KFS (2001) [48] and several previous studies [19].
2.2. Analysis Spatial Unit
Many studies use 1-km grid cells to effectively capture environmental characteristics and burn severity [6,19,49,50,51]. However, 1-km grid cells may be too large to capture the complex and dynamic topographic characteristics of the study area; therefore, we used 500-m grid cells as the spatial analysis unit in this study to capture the topographic characteristics and burn severity at a finer scale. This spatial analysis unit was effectively used in a previous study of landscape variables affecting edge formation in the same area [51]. We generated 826 grid cells (500 m), covering the entire burned area using AutoCAD [52], and converted the cells into a Geographic Information Systems (GIS) polygon file in ArcMap 10 [53].
2.3. Computing the Percentage of Japanese Red Pine and Topographic Characteristics
The KFS releases a National Forest Classification Digital Map (NFCDM) every year. We overlaid the NFCDM released by KFS in 2000 over the grid cells (i.e., polygon shape file), and the proportion of red pines within 826 grid cells (500 m) was computed for analysis in GIS. Furthermore, the elevation and slope grid files were overlaid on the grid cell polygon file to capture the average elevation and slope of each grid cell.
2.4. Mapping Burn Severity
In the literature on fire ecology, ‘burn severity’ often refers to the degree of environmental change caused by fire [33,54,55]. The measurement of burn severity is not constrained to one particular indicator; rather, burn severity can be measured with many different environmental variables such as physical and chemical changes in soil, tree mortality, conversion of vegetation and fuels to inorganic carbon, and structural or compositional transformations [54,55,56,57]. One of the most common indicators of burn severity is the pre- to post-fire change in surface reflectance [19,56,58,59]. Therefore, in this study, we defined burn severity as the degree of change in vegetation reflectance captured in pre- and post-fire satellite images [19].
Charring or removal of vegetation by fire can considerably reduce the visibility of near-infrared reflectance in satellite images taken pre- and post-fire [58]. Therefore, burn severity can be measured by computing the reduction in reflectance captured in satellite images taken before and after a fire. Specifically, numerous studies have effectively used the delta normalized burn ratio (dNBR) to map burn severity [58,59,60]. In addition, studies have reported a strong association between ground-based data and the dNBR derived from satellite imagery [61,62]. We applied the dNBR technique using two LandSat images (30 m), taken on 7 May 1999 (i.e., pre-fire) and 5 May 2000 (i.e., post-fire), to compute the burn severity for each grid. This approach has been shown to be effective in determining burn severity in the study area [19]. The dNBR values derived from the satellite images were validated with a composite burn index assessed from 25 long-term ecological research plots (r = 0.832, p < 0.01). The burn severities computed with dNBR were classified into six categories: extreme (6), very high (5), high (4), moderate (3), low (2), and unburned (1) [63].
2.5. Estimating the Global (OLS) and Local (GWR) Models
OLS models assume that the effect of an independent variable on a dependent variable is constant over space (i.e., stationary effect). In contrast, GWR models can show the effects of an independent variable on a dependent variable that varies over space due to interactions with other environmental variables (i.e., non-stationary effect). The GWR considers non-stationary relationships when estimating parameters for all sample points (i.e., grid cells) in a dataset, whereas the OLS model does not consider the spatial location of sample points. Thus, in the GWR model, the relationship between the proportion of Japanese red pine and burn severity within a grid might not be the same over the entire study area. A unique characteristic of GWR is that it estimates parameters for all sampling points (i.e., local model), while the OLS method estimates only the average parameters for all sampling points (i.e., global model). The standard OLS model used to measure the effects of Japanese red pine on burn severity is expressed as:
where y is the burn severity, β0 is the intercept, β1 is the coefficient of the variable xi (i.e., the proportion of red pine trees, elevation, or slope within grid i), n is the number of grids, and ε is the error term.
Based on the OLS model, the location term must be integrated into the model to estimate spatial variations in the effects of Japanese red pine on burn severity.
where Ci is the location (i.e., coordinates) for each grid cell, β0(Ci) is the local intercept for grid cell at location i, and β1(Ci) is the local coefficient of red pine trees, elevation, and slope at location i.
The OLS model (Equation (1)) can be considered a special case of the GWR model (Equation (2)) in which the parameter surface is assumed to be constant over space [36,37,38,50,51,52]. Equation (2) is not a single equation; rather, it comprises an array of equations corresponding to different grid cells. Thus, each grid cell can have different coefficients for independent variables (i.e., percentage of red pine trees, elevation, and slope) depending on the location of the cell. In GWR, an observation is weighted according to its proximity to grid location i. The GWR model is calibrated by weighting all observations around a grid using a distance decay function. The exponential function is the most common distance decay function (for more details on distance decay functions, see [36,64,65]).
2.6. Estimation and Comparison of the Regression Models
The burn severity, proportion of Japanese red pine trees, elevation, and slope within each grid cell were computed in GIS. The grid polygon file was converted into a point file as the OLS and GWR models in the ArcMap toolbox use a point data format to estimate spatial regressions. We generated points for all grid cells at the center of each grid cell using the same identification code with the polygon file, and the attribute table of the polygon file was joined to the point file to estimate the OLS and GWR models.
We used the ArcMap to estimate GWR-derived and OLS-derived models for the burn severity models with three independent variables; the percentage of red pine trees, elevation, and slope. To estimate the GWR model in ArcMap, we used the ‘Adaptive’ kernel-type option and the ‘Akaike Information Criterion for small samples (AICc)’ bandwidth method option. Before the GIS analysis, a preliminary analysis, such as Spearman Rank correlation and conventional regression, was performed to refine the variables significantly related to burn severity. We used the coefficient of determination (R2), spatial autocorrelation of residuals (Moran’s I), and AICc [36] to compare the performance of the estimated OLS and GWR models. Greater R2 values indicate that variance in the percentage of Japanese red pine trees, elevation, and slope explains a larger proportion of the variance in burn severity in the damaged areas. Moran’s I-values for the residuals of the estimated OLS or GWR models that were close to 0 suggested that the residuals are spatially independent, which is a fundamental assumption of conventional statistical analysis techniques. When I is close to −1 or 1, the residuals of the estimated OLS and GWR models are strongly spatially dependent [66], which violates a fundamental assumption of statistical analysis. Lower AICc values indicate a closer approximation of the model to the actual nature of the relationships of dependent variables (i.e., percentage of Japanese red pine trees, elevation, and slope) with a dependent variable (i.e., burn severity) within a grid [37]. ArcMap GIS was used to compute Moran’s I-values and visualize the localized variation in the effects of Japanese red pine on burn severity over the study area.
3. Results
3.1. Spatial Distribution of Burn Severity and Percentage of Japanese Red Pine
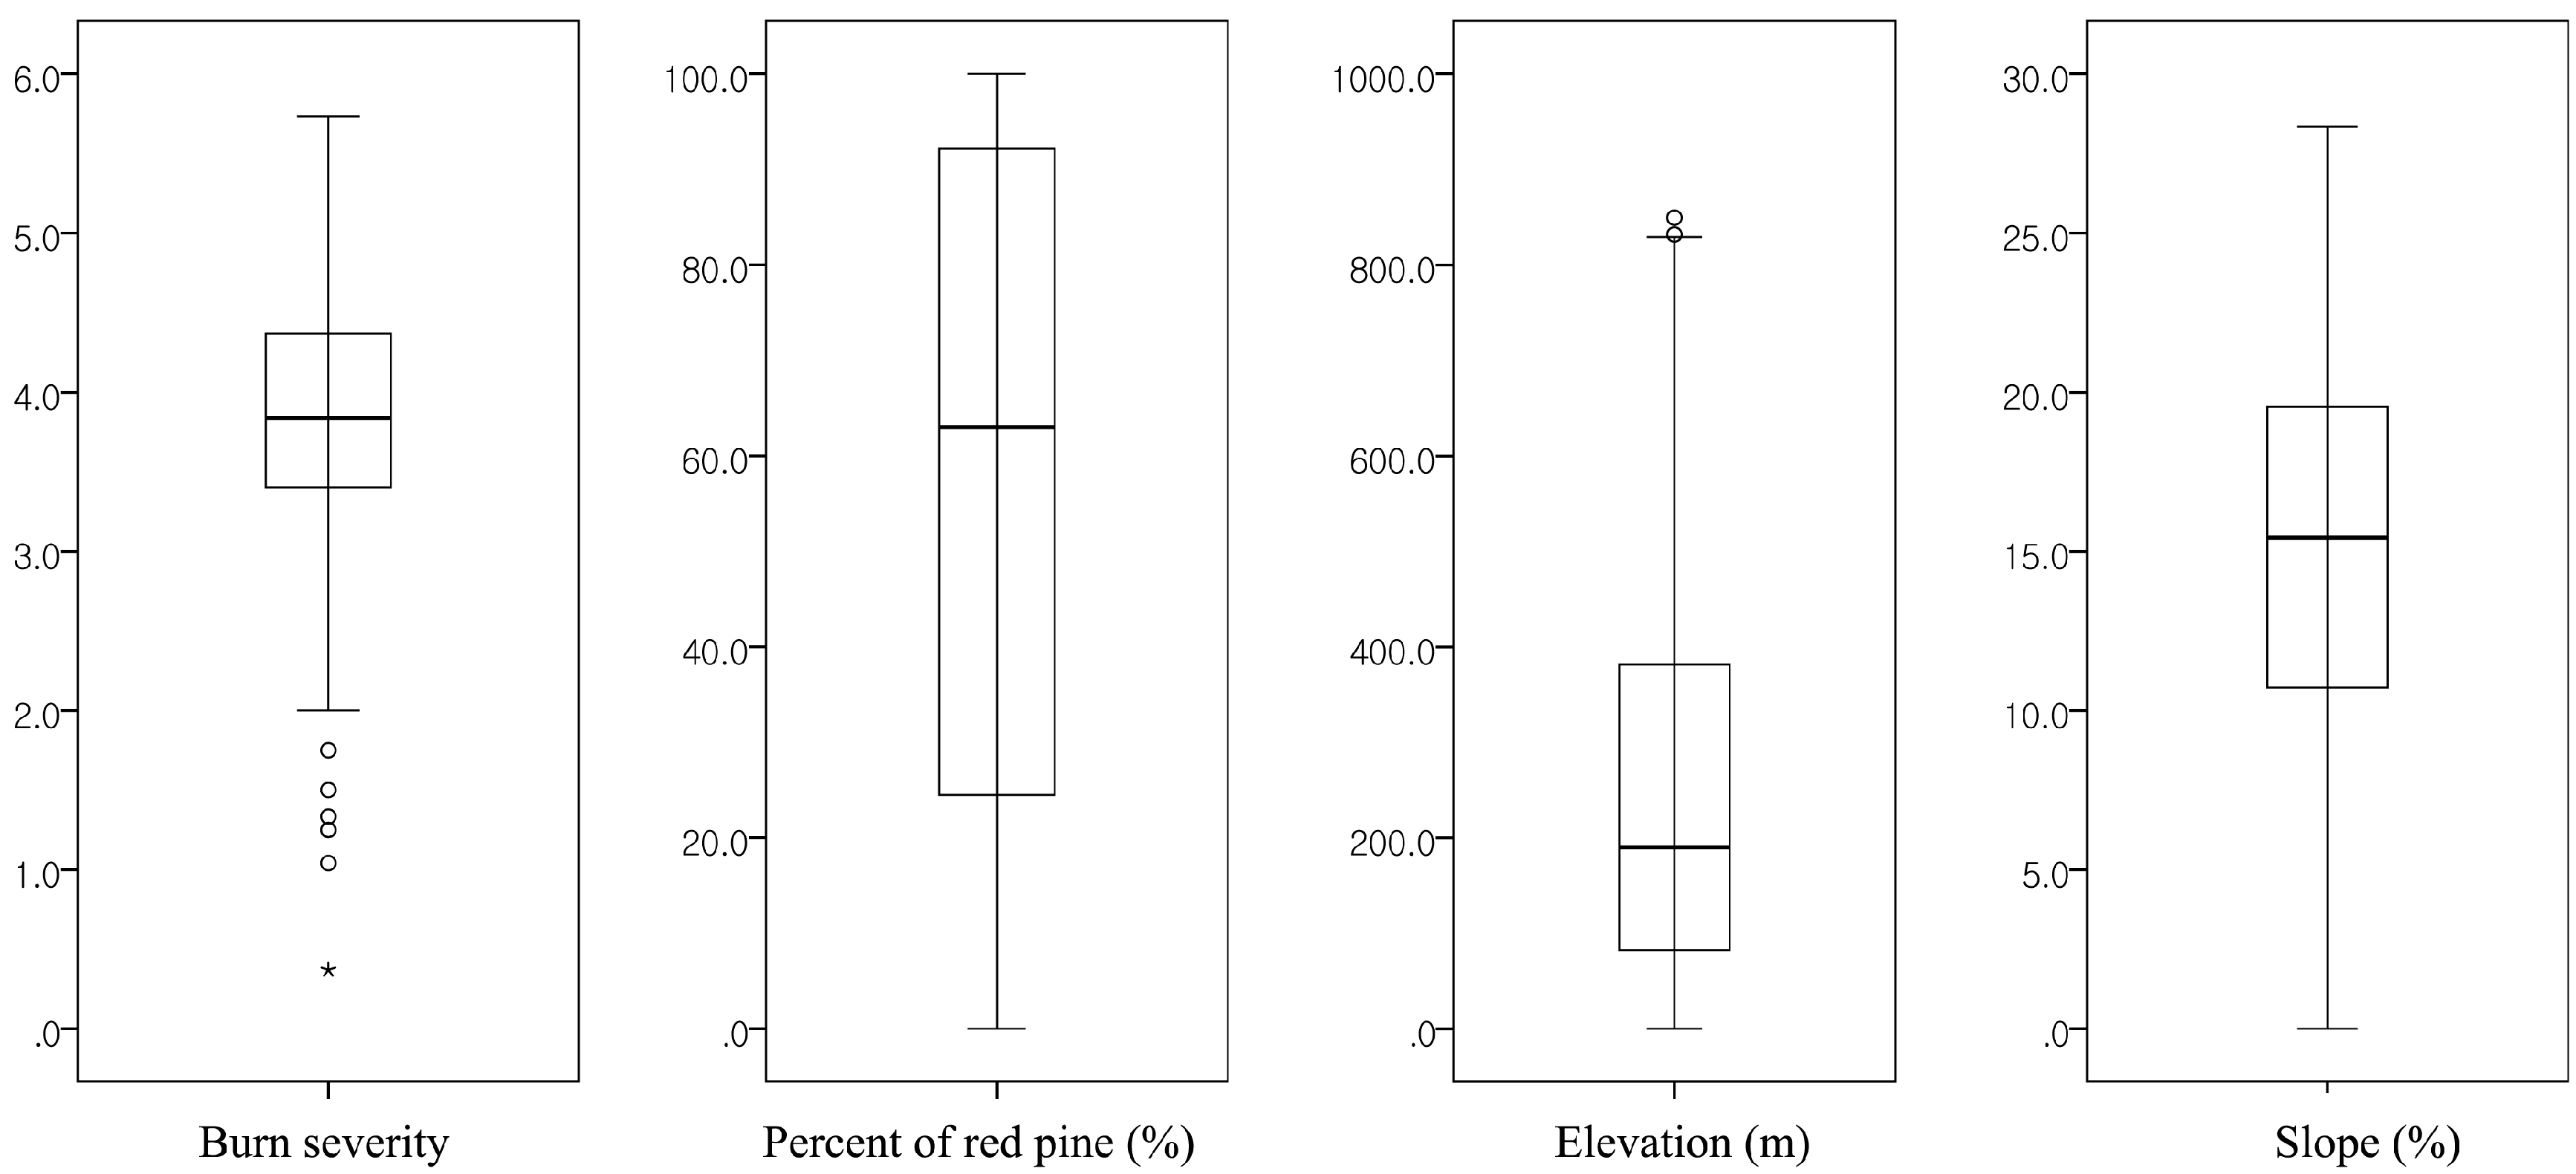
The measured burn severity, percentage of red pine trees, elevation, and slope showed some variability in their distribution patterns (Figure 2). The burn severity (mean: 3.84, range: 0.36–5.73) is more condensed around the median than the other variables are. The box plot of burn severity suggests a left-skewed asymmetric distribution (mean = 3.72). The elongated box shape of the proportion of red pine trees within a grid suggests widely dispersed distribution patterns (mean = 51.8). The mean elevation and slope were 249.17 m and 14.99%, respectively. Figure 3 shows the spatial distributions of the measured variables, including burn severity, the percentage of red pine, elevation, and slope. Severely burned areas were observed in the east side of the study area, which was similar to the red pine spatial pattern. The spatial distribution patterns of burn severity and percentage of red pine trees were almost identical, implying a spatial association between these variables. The spatial distribution of elevation revealed a gradual increase in elevation from east (low) to west (high), which was somewhat the opposite of the spatial distribution pattern of the percentage of red pine trees, implying that red pine trees might be less likely to grow at high elevations. The spatial distribution of the slope suggested that steeper slopes occurred at high elevations, whereas the low areas on the east side had milder slopes.
3.2. Relationships of Burn Severity with Japanese Red Pine and Topographic Variables
A preliminary test was performed to control for outliers. We used ±3 standardized residuals of the estimated regression model and omitted 27 observations. Thus, 799 observations were included in the analysis of the relationships of burn severity with the percentage of red pine trees, elevation, and slope.
Burn severity was strongly associated with the percentage of Japanese red pine trees (r = 0.48, p < 0.01) within a grid (Table 1) and was also correlated with elevation (r = −0.22, p < 0.01). Thus, in a given area, burn severity is likely to be high if the area is dominated by Japanese red pine. The percentage of red pine trees within a grid was negatively correlated with elevation (r = −0.41, p < 0.01), suggesting that there were more Japanese red pine trees in low-elevation than in high-elevation areas. Overall, burn severity was significantly associated with the percentage of red pine trees and elevation, and the percentage of red pine trees was strongly associated with elevation. A significant positive relationship between elevation and slope was observed (r = 0.69, p < 0.01), indicating that steeper slopes occurred in areas with higher elevations.
3.3. Comparison of the Estimated OLS and GWR Models
The estimated global model (OLS model) explained about 28% and the GWR model about 57% of the variance in burn severity (Table 2). In the estimated OLS model, both the percentage of red pine trees and the slope escalated burn severity. In other words, forests with more red pine trees and those with steep slopes were more likely to experience severe burning. In contrast, high-elevation areas seemed to experience lower burn severity. The comparison of β values among the dependent variables revealed that the percentage of red pine trees was the most significant variable in explaining the variance in burn severity.
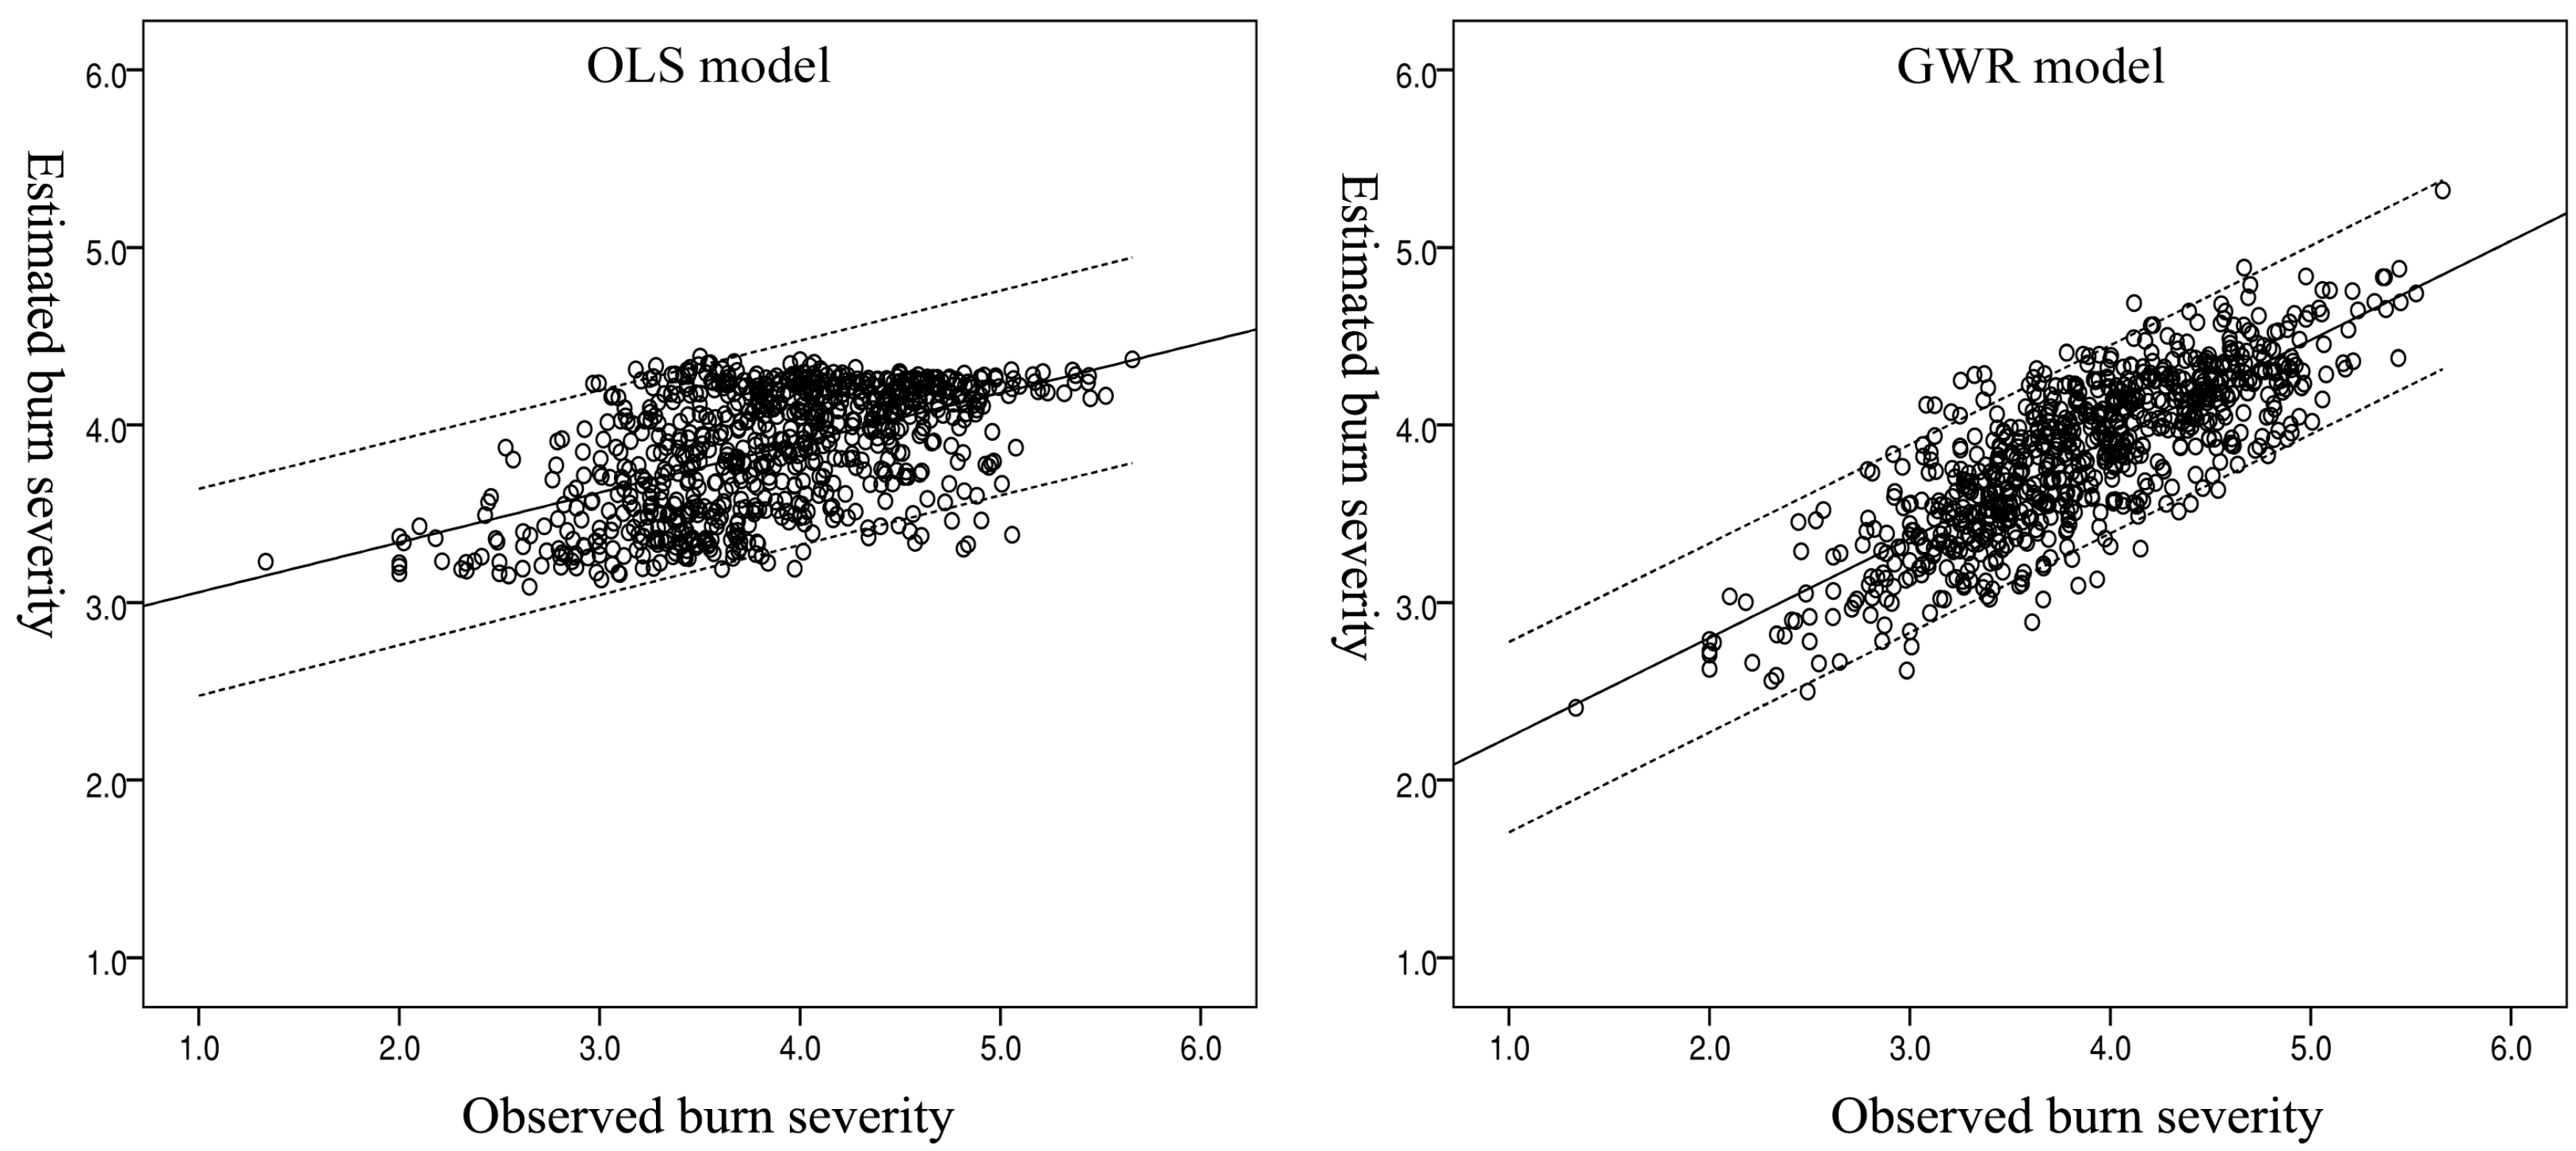
The adjusted R2 values for the OLS and GWR models were 0.28 and 0.57, respectively, indicating better performance by the GWR model in explaining the variance in burn severity compared to the OLS model. The lower AICc value of the GWR model (AICc = 950.46) indicated a closer approximation of the model to the actual nature of the relationship between the proportion of Japanese red pine and burn severity than that achieved by the OLS model (AICc = 1330.45). The GWR model had a significantly lower Moran’s I-value (0.28) than did the OLS (0.5). All three criteria indicated that the estimated GWR model performed better in explaining the variance in burn severity than the estimated OLS model did, suggesting that there might be non-stationarity effects between red pine trees and burn severity. Scatter plots of observed and estimated burn severities showed that both the OLS and GWR models over-estimated low burn severity, and the OLS model also under-estimated high burn severity (Figure 4). Compared to the GWR model, the fit line of the OLS model was flatter, suggesting an under- or over-estimation of unburned or high burn severity areas in the OLS model. This tendency resulted in a regression of all estimated burn severity values toward the mean burn severity in the OLS model.
3.4. Spatial Variation in the Non-Stationary Effects of Japanese Red Pine
Although the overall spatial patterns of the observed (Figure 3) and estimated burn severity (Figure 5) look similar, the spatial distribution of the predicted burn severity by the GWR model showed more unburned and low-severity areas in the western part of the study area. At the same time, areas of greater predicted extreme burn severity in the GWR model were observed in the northern and southern areas. There were high spatial variations in the R2 values of multiple variables (Figure 5). In particular, high R2 values were observed in areas in the north, east, and west. In contrast, areas in the northwest and southwest showed relatively lower R2 values. Furthermore, high variation in the effects of Japanese red pine on burn severity was observed. The northern and central areas showed the greatest such effects, while the western region appeared to demonstrate the lowest effects of red pine on burn severity. Both the distributions of the R2 values and the coefficients of red pine trees in the GWR model seemed to be spatially aggregated throughout the study area. Figure 5 shows the random distribution of residuals of the estimated GWR model over the study area. In some parts in the study area, burn severity was explained well by the percentage of Japanese red pine trees, but this did not explain the variance in burn severity in other areas.
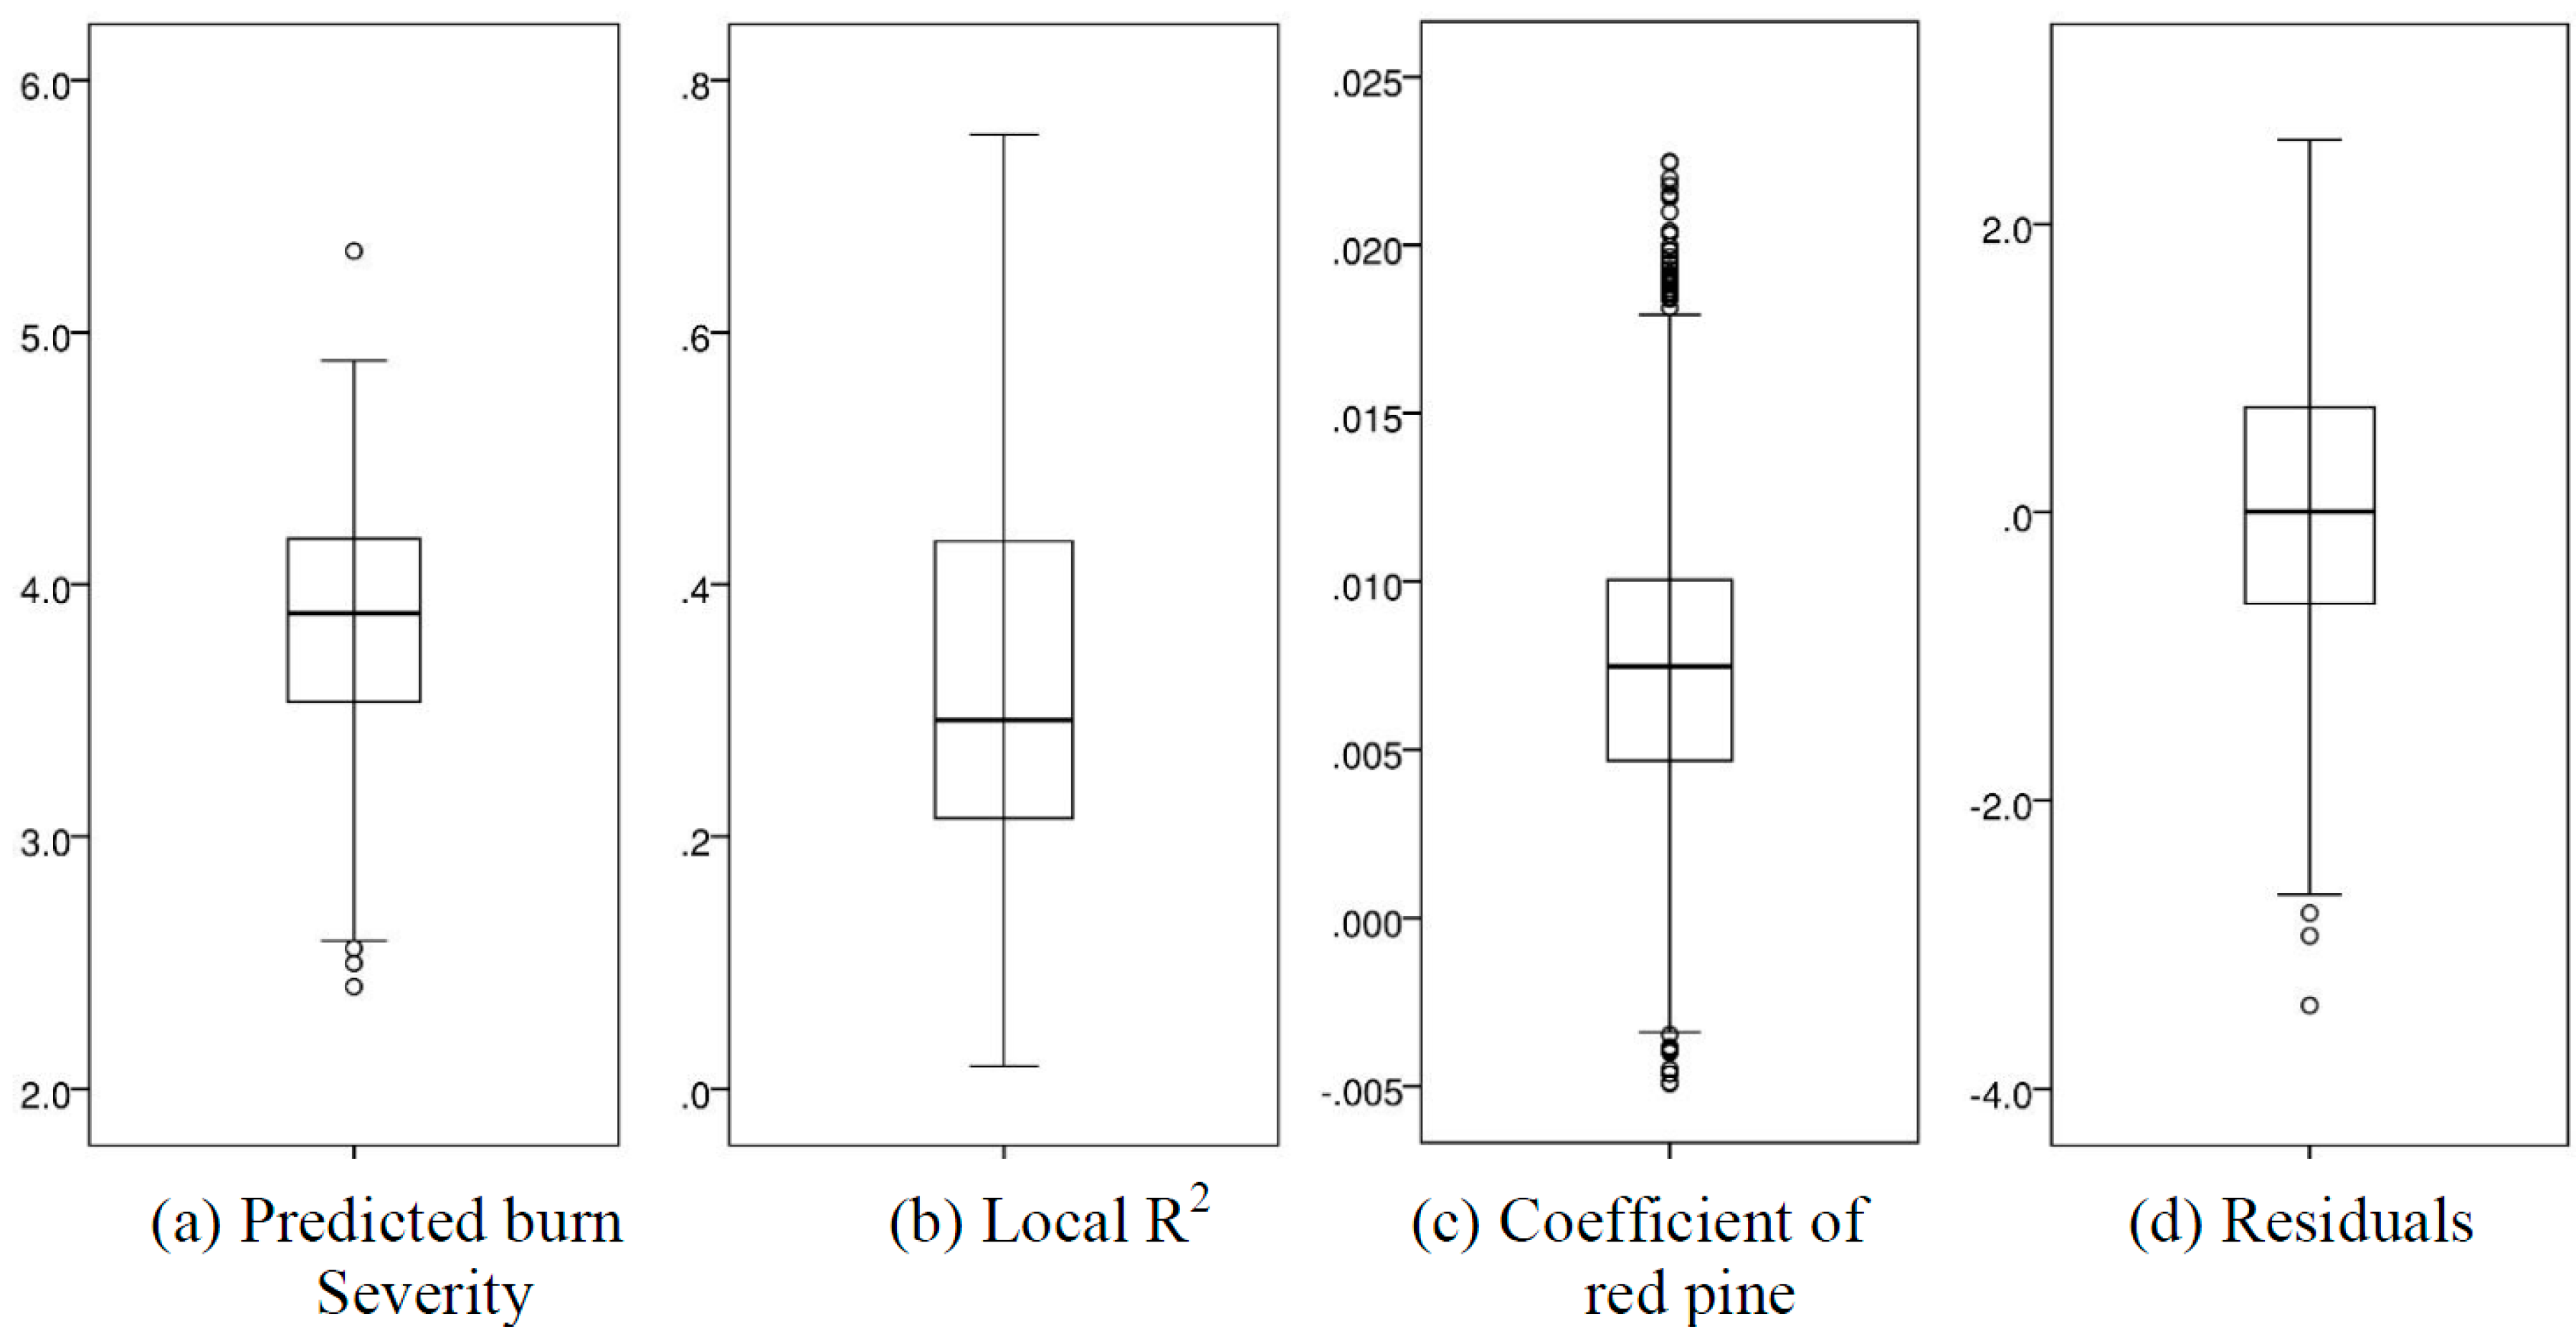
The box plots of the variables used in the GWR model suggested large variations in local R2 values, coefficients of red pine trees, and residuals of the estimated model. The range in local R2 values in the estimated GWR model was 0.01–0.75, and the range of the coefficient of red pine trees in the estimated model was −0.004 to 2.588. Both spatial distribution maps (Figure 5) and box plots (Figure 6) strongly indicate the presence of non-stationary effects of red pine on burn severity. Thus, the effects of Japanese red pine on burn severity were not constant over space; rather, they varied throughout the study area.
3.5. Topographic Characteristics and Parameters of the Estimated GWR Model
A simple correlation analysis was performed to examine the role of the topographic characteristics in the non-stationary relationship between red pine trees and burn severity in the estimated GWR model. In Table 3, the negative relationships of elevation and slope with the R2 values of the estimated GWR model suggest that variables other than red pine trees and elevation (e.g., meteorological conditions, fuel characteristics, and pre-fire forest structure) might play more significant roles in areas with high elevations and steep slopes. Elevation (r = −0.45) showed a stronger relationship with the coefficient of red pine trees than did slope (r = −0.37) in the estimated GWR model. Thus, the coefficient of red pine trees in the GWR model was likely low in areas with high elevations or steep slopes, suggesting that the effects of red pine trees on burn severity are low under such topographic conditions. Elevation showed positive relationships with the intercept (r = 0.32) and coefficient of slope (r = 0.21) and negative relationships with the R2 (r = −0.12), coefficient of red pine trees (r = −0.45), and coefficient of elevation (r = −0.45) in the estimated GWR model. Slope showed similar relationships with the R2 (r = −0.21), intercept (r = 0.21), coefficient of red pine (r = −0.37), coefficient of elevation (r = −0.28), and coefficient of slope (r = 0.12).
Overall, elevation showed a stronger relationship with the coefficient of red pine trees than slope, suggesting that elevation was one of the driving factors of the non-stationary relationship between Japanese red pine and burn severity in the study area. Specifically, the effect of red pine trees on burn severity is likely low in high-elevation areas, while it is likely high in areas at low elevation.
4. Discussion
Both the estimated OLS and GWR models (Table 2) strongly indicated that the degree of dominance of Japanese red pine significantly impacted burn severity. Moreover, the results of this study confirmed previous reports that Japanese red pine trees are highly susceptible to forest fire [2,66]. The high susceptibility of red pine trees is due to their heavy crown fuel load and highly flammable needles, which contain high concentrations of essential oils [67]. More importantly, the results of this study strongly indicated the presence of non-stationary effects of red pine trees on burn severity. Compared with the OLS model, the GWR model performed considerably better in explaining the spatial variance in burn severity. The estimated GWR model strongly suggested that the impacts of red pine trees on burn severity were not constant over space; rather, the effects varied among locations (i.e., non-stationary effects). The effect of red pine might not be the same across the entire study area; rather, it could vary among sites depending on complex environmental factors, meteorological conditions, and individual tree characteristics [19,31,68,69,70]. However, the cause of this non-stationary effect of red pine trees on burn severity is unclear. In the literature, numerous variables are involved in determining the burn severity at certain locations during fire events, such as meteorological conditions [21,22], pre-fire forest structure [19,28,31], fuel type and characteristics [25,26] and topography [21,22]. On a broader level, the presence of non-stationary effects of red pine trees on burn severity is due to the dynamics and complexity of the interactions of these relevant variables. Due to the dynamic and complex nature of interactions among relevant variables and the limited available data, it is difficult to investigate all the possible interactions of red pine trees with all relevant variables to determine the main driving factors of the non-stationary effects of red pine on burn severity in the study area. However, our results indicated that topographic characteristics represented significant driving factors of the non-stationary effects of red pine on burn severity, and elevation exerted more significant effects than did slope. A strong negative correlation between elevation and the coefficient of red pine trees in the GWR model indicated that the effects of red pine trees on burn severity was likely to be low in high-elevation areas.
Since elevation appeared as a significant factor driving the non-stationary effects of red pine trees on burn severity, understanding how the effects of red pine trees on burn severity vary over different elevation ranges can provide insights into fire-resilient forest management or the restoration of burned areas. The observations were classified into four percentile groups based on elevation, and the regression model for each group was estimated to explore differences in the effects of red pine on burn severity among the elevation groups. The mean elevations of groups 1, 2, 3, and 4 were 44.66, 140.73, 283.85, and 556.36 m, respectively. The F-values of the estimated regression models of group 1 (F-value = 36.98, p < 0.01) and group 4 (F-value = 34.22, p < 0.01) were relatively higher than those of group 2 (F-value = 6.72, p < 0.01) and group 3 (F-value = 10.74, p < 0.01) (Table 4). The R2 values of the estimated models for group 1 (adjusted R2 = 0.36) and group 4 (adjusted R2 = 0.34) were relatively higher than those of group 2 (adjusted R2 = 0.08) and group 4 (adjusted R2 = 0.13).
In the model for group 1, only the percentage of red pine trees appeared as a significant variable in explaining the variance in burn severity. In addition, the estimated model for group 1 indicated that an increased percentage of red pine trees in an area considerably increased local burn severity. Neither elevation nor slope contributed significantly to burn severity in the model of group 1. In the model for group 2, two variables, the percentage of red pine trees and slope, appeared as significant variables in explaining the variance in burn severity. However, the R2 value of this estimated model was extremely low. All variables, including the percentage of red pine trees, elevation, and slope, appeared as significant variables, but the R2 value of the estimated model of group 3 was modest at best. Interestingly, the β-values of the three variables were similar, suggesting that all three variables had almost equal influences on burn severity. In the model of group 4, elevation showed the greatest negative β-value compared to the percentage of red pine trees and slope.
Overall, we observed that the R2 values in low-elevation areas (i.e., group 1) and very high-elevation areas (i.e., group 4) were relatively high, suggesting that the percentage of red pine trees and elevation largely explained the variance in burn severity. The β-value of the percentage of red pine trees was highest in low-elevation areas (i.e., group 1), and decreased with increasing elevation. Thus, the effect of red pine trees on burn severity was presumably higher in low-elevation than high-elevation areas. The contribution of slope to burn severity was significant only in mid-elevation areas (i.e., groups 2 and 3). However, considering the very low F-values and R2 values of the models of groups 2 and 3, it was difficult to draw conclusions regarding the effect of slope on burn severity. The effects of elevation on burn severity were not consistent. In the model of group 1, elevation was not a significant variable, and it had a relatively lower β-value in mid-elevation areas (i.e., groups 2 and 3) than did the other variables. However, it was the strongest negative variable in the model of group 4, suggesting that elevation could decrease burn severity locally.
The relationship between burn severity and elevation is somewhat complicated in the literature. In general, the influence of topography on burn severity is greater on steep slopes, ridgetops, and southerly aspects [20,33,71]. Thus, it is generally assumed that burn severity is higher at higher than at lower elevations, and many studies have reported a strong positive association between burn severity and elevation. For example, Lentile et al. (2006) [33] reported that historically large and severe fires were common in high-elevation forests. Holden et al. (2009) [22] also reported a strong positive association between elevation and burn severity. In these studies, the researchers speculated that higher elevation forests burned more severely due to the drier conditions of fuels and soils compared to lower elevation areas. In contrast, several studies have reported a negative relationship between burn severity and elevation. Lee et al. (2009) [19] observed a negative correlation between burn severity and elevation. Similarly, Lentile et al. (2006) [33] reported that severe wildfires in dry and low-elevation ponderosa pine (Pinus ponderosa) forests have increased. At a local scale, forests in lower elevation areas might be wetter and more productive and have higher vegetation densities and fuel accumulation; these conditions could result in severe forest burning [22]. To some degree, the results of this study support a negative relationship between burn severity and elevation. However, a positive or negative relationship between burn severity and elevation might depend, in part, on fire frequency. For example, forests that have experienced frequent forest fires in high-elevation areas have less fuel and therefore burn less severely. In contrast, forests that have experienced forest fires less frequently in low-elevation areas may burn more severely due to the accumulation of fuel [22]. The results of this study suggest that complex relationships exist between burn severity and elevation. Lee et al. (2009) [19] reported the presence of non-linear relationships of burn severity with elevation. In their study, burn severity increased in the elevation range of 0–241.6 m but decreased at elevations above 241.6 m, suggesting that the effects of elevation on burn severity could vary depending on local setting. The results of this study strongly indicated that the effects of red pine trees on burn severity are highly variable at different elevation ranges, despite the high susceptibility to fire. In this study, the percentage of red pine trees was the most significant variable in explaining burn severity in low-elevation areas (0–91 m); however, it was less significant than elevation in explaining the variance of burn severity in high-elevation areas (388–849 m). In addition, the varying coefficients and β-values of the independent variables among the groups listed in Table 4 suggest that there might be non-linear relationships between burn severity and environmental conditions. Nonetheless, the presence of Japanese red pine always escalates burn severity, regardless of elevation.
5. Conclusions
Every forest fire creates a unique mosaic of burn severity, which has various profound impacts on the dynamic processes of post-fire forests. In part, the response of post-fire forests to fire depends on the pattern of burn severity over the burned area because burn severity limits seed sources, tree regeneration, tree recruitment, and interactions among forest ecosystem components by altering biotic and abiotic characteristics, as well as the microclimate of burned forests [1,2,5,12,14,19]. Understanding the drivers of burn severity can provide critical insights into managing fire-resilient forests and minimizing the adverse effects of forest fires on forest ecosystems. Previous studies have reported that burn severity is a function of various factors such as microclimate, topography, fuel characteristics, and pre-fire forest structure [19,21,26,28,29,34].
Although numerous studies have investigated the relationships between environmental variables and burn severity, our understanding of the relationships of burn severity with a variety of environmental conditions is limited due to the complex and dynamic nature of forest fires. One reason for this limited understanding is the common assumption that the effect of susceptible forest cover on burn severity is constant over space. The results of studies performed under this assumption might be misleading, as this approach does not consider the spatial dimensions and therefore cannot fully explain unique burn mosaics.
In this regard, we examined the non-stationary effects of Japanese red pine on burn severity using a GWR model, a highly effective tool for analyzing the localized effects of independent variables on a dependent variable. Compared to the OLS model, the estimated GWR model performed better in explaining the variance of burn severity, and we found significant evidence for non-stationary effects of Japanese red pine on burn severity. Our results strongly suggest that the effects of red pine on burn severity were not constant but varied over the study area. Furthermore, we found that topographic characteristics influenced the non-stationary relationship between red pine and burn severity. Specifically, elevation had a more significant role in the non-stationary effects of red pine than did slope. The effects of red pine on burn severity were considerably higher in low-elevation areas, whereas the influences of topographic characteristics (i.e., elevation and slope) were modest. The effects of red pine became gradually less significant with increasing elevation, and elevation was a more significant variable than red pine for explaining the variance of burn severity. Susceptible forest cover may be more important in explaining burn severity than are meteorological conditions, topographic characteristics, and fuel characteristics in low-elevation areas; however, these factors might be more important in explaining burn severity than is the presence of susceptible forest cover in ridge areas. The results of this study provide insights that can be used to improve location-specific management strategies to minimize the adverse effects of forest fires and to substantially improve fire simulation models to better delineate the nature of fire behavior.
In this study, we were unable to integrate meteorological conditions and fuel characteristics into the GWR model due to a lack of available data. These limitations leave several questions unanswered regarding the impacts of the complex interactions among meteorological conditions, fuel characteristics, and topography on burn severity. Without comprehensive datasets on these variables, the results of this study only provide insight into a small part of the complex nature of the relationships among and spatial variations in burn severity and various environmental variables during burning events. Finally, the scale used in this study was finer and smaller than that of most studies conducted in North America and Europe. Therefore, caution should be taken when comparing the findings of this study with the results of studies performed at different scales.
Acknowledgments
This paper was supported by Konkuk University in 2014.
Author Contributions
All authors have contributed to the intellectual content of this paper. The first author, Hyun-Joo Lee, designed the study and gathered data, including satellite images and GIS data. She was also responsible for all statistical analyses and the satellite image analysis. Eujin-Julia Kim substantially contributed to estimating the GWR models in the GIS. The corresponding author, Sang-Woo Lee, wrote the manuscript and contributed to the statistical interpretation.
Conflicts of Interest
The authors declare no conflict of interest.
References
- Bonnet, V.H.; Schoettle, A.W.; Shepperd, W.D. Postfire environmental conditions influence the spatial pattern of regeneration for Pinus ponderosa. Can. J. For. Res. 2005, 35, 37–47. [Google Scholar] [CrossRef]
- Crotteau, J.S.; Varner, J.M.; Ritchie, M.W. Post-fire regeneration across a fire severity gradient in the southern cascades. For. Ecol. Manag. 2013, 287, 103–112. [Google Scholar] [CrossRef]
- Johnson, E.A. Fire and Vegetation Dynamics: Studies from the North American Boreal Forest; Cambridge University Press: Cambridge, UK, 1996. [Google Scholar]
- Ordóñez, J.L.; Retana, J.; Espelta, J.M. Effects of tree size, crown damage, and tree location on post-fire survival and cone production of Pinus nigra trees. For. Ecol. Manag. 2005, 206, 109–117. [Google Scholar] [CrossRef]
- Retana, J.; Maria Espelta, J.; Habrouk, A.; Luis OrdoÑEz, J.; de Solà-Morales, F. Regeneration patterns of three Mediterranean pines and forest changes after a large wildfire in northeastern Spain. Ecoscience 2002, 9, 89–97. [Google Scholar] [CrossRef]
- Turner, M.G.; Romme, W.H.; Gardner, R.H. Prefire heterogeneity, fire severity, and early postfire plant reestablishment in subalpine forests of Yellowstone national park, Wyoming. Int. J. Wildland Fire 2000, 9, 21–36. [Google Scholar] [CrossRef]
- Brown, J.K. Ecological principles, shifting fire regimes and management considerations. In Wildland Fire in Ecosystems: Effects of Fire on Flora; Brown, J.K., Smith, J.K., Eds.; RMRS-GTR-42-vol. 2; US Department of Agriculture Forest Service, Rocky Mountain Research Station: Ogden, UT, USA, 2000. [Google Scholar]
- Benavides-Solorio, J.D.; MacDonald, L.H. Measurement and prediction of post-fire erosion at the hillslope scale, colorado front range. Int. J. Wildland Fire 2005, 14, 457–474. [Google Scholar] [CrossRef]
- Cawson, J.; Sheridan, G.; Smith, H.; Lane, P. Effects of fire severity and burn patchiness on hillslope-scale surface runoff, erosion and hydrologic connectivity in a prescribed burn. For. Ecol. Manag. 2013, 310, 219–233. [Google Scholar] [CrossRef]
- Ferreira, A.; Coelho, C.D.O.; Ritsema, C.; Boulet, A.; Keizer, J. Soil and water degradation processes in burned areas: Lessons learned from a nested approach. Catena 2008, 74, 273–285. [Google Scholar] [CrossRef]
- Wan, S.; Hui, D.; Luo, Y. Fire effects on nitrogen pools and dynamics in terrestrial ecosystems: A meta-analysis. Ecol. Appl. 2001, 11, 1349–1365. [Google Scholar] [CrossRef]
- Certini, G. Effects of fire on properties of forest soils: A review. Oecologia 2005, 143, 1–10. [Google Scholar] [CrossRef] [PubMed]
- MacDonald, L.H.; Huffman, E.L. Post-fire soil water repellency. Soil Sci. Soc. Am. 2004, 68, 1729–1734. [Google Scholar] [CrossRef]
- Fontaine, J.B.; Kennedy, P.L. Meta-analysis of avian and small-mammal response to fire severity and fire surrogate treatments in us fire-prone forests. Ecol. Appl. 2012, 22, 1547–1561. [Google Scholar] [CrossRef] [PubMed]
- Roberts, S.; Van Wagtendonk, J.; Miles, A.; Kelt, D.; Lutz, J. Modeling the effects of fire severity and spatial complexity on small mammals in Yosemite national park, California. Fire. Ecol. 2008, 4, 83–104. [Google Scholar] [CrossRef]
- Smucker, K.M.; Hutto, R.L.; Steele, B.M. Changes in bird abundance after wildfire: Importance of fire severity and time since fire. Ecol. Appl. 2005, 15, 1535–1549. [Google Scholar] [CrossRef]
- Johnstone, J.F.; Chapin, F.S. Effects of soil burn severity on post-fire tree recruitment in boreal forest. Ecosystems 2006, 9, 14–31. [Google Scholar] [CrossRef]
- Knapp, E.E.; Estes, B.L.; Skinner, C.N. Ecological Effects of Prescribed Fire Season: A Literature Review and Synthesis for Managers; General Technical Report PSW-GTR-224; USDA Forest Service: Albany, CA, USA, 2009; p. 80. [Google Scholar]
- Lee, S.-W.; Lee, M.-B.; Lee, Y.-G.; Won, M.-S.; Kim, J.-J.; Hong, S.-K. Relationship between landscape structure and burn severity at the landscape and class levels in Samchuck, South Korea. For. Ecol. Manag. 2009, 258, 1594–1604. [Google Scholar] [CrossRef]
- Dillon, G.K.; Holden, Z.A.; Morgan, P.; Crimmins, M.A.; Heyerdahl, E.K.; Luce, C.H. Both topography and climate affected forest and woodland burn severity in two regions of the western us, 1984 to 2006. Ecosphere 2011, 2, 1–33. [Google Scholar] [CrossRef]
- Lecina-Diaz, J.; Alvarez, A.; Retana, J. Extreme fire severity patterns in topographic, convective and wind-driven historical wildfires of mediterranean pine forests. PLoS ONE 2014, 9, e85127. [Google Scholar] [CrossRef] [PubMed]
- Holden, Z.A.; Morgan, P.; Evans, J.S. A predictive model of burn severity based on 20-year satellite-inferred burn severity data in a large southwestern us wilderness area. For. Ecol. Manag. 2009, 258, 2399–2406. [Google Scholar] [CrossRef]
- Bigler, C.; Kulakowski, D.; Veblen, T.T. Multiple disturbance interactions and drought influence fire severity in rocky mountain subalpine forests. Ecology 2005, 86, 3018–3029. [Google Scholar] [CrossRef]
- Birch, D.S.; Morgan, P.; Kolden, C.A.; Abatzoglou, J.T.; Dillon, G.K.; Hudak, A.T.; Smith, A. Vegetation, topography and daily weather influenced burn severity in central Idaho and western Montana forests. Ecosphere 2015, 6, 1–23. [Google Scholar] [CrossRef]
- Cruz, M.G.; Butler, B.W.; Alexander, M.E. Predicting the ignition of crown fuels above a spreading surface fire. Part ii: Model evaluation. Int. J. Wildland Fire 2006, 15, 61–72. [Google Scholar] [CrossRef]
- Sikkink, P.G.; Keane, R.E. Predicting Fire Severity Using Surface Fuels and Moisture; Research Paper RMRS-RP-96; USDA Forest Service, Rocky Mountain Research Station: Fort Collins, CO, USA, 2012; p. 37. [Google Scholar]
- Amato, V.J.; Lightfoot, D.; Stropki, C.; Pease, M. Relationships between tree stand density and burn severity as measured by the composite burn index following a ponderosa pine forest wildfire in the American Southwest. For. Ecol. Manag. 2013, 302, 71–84. [Google Scholar] [CrossRef]
- Viedma, O.; Quesada, J.; Torres, I.; De Santis, A.; Moreno, J.M. Fire severity in a large fire in a Pinus pinaster forest is highly predictable from burning conditions, stand structure, and topography. Ecosystems 2015, 18, 237–250. [Google Scholar] [CrossRef]
- Alvarez, A.; Gracia, M.; Vayreda, J.; Retana, J. Patterns of fuel types and crown fire potential in Pinus halepensis forests in the western Mediterranean basin. For. Ecol. Manag. 2012, 270, 282–290. [Google Scholar] [CrossRef]
- Broncano, M.J.; Retana, J. Topography and forest composition affecting the variability in fire severity and post-fire regeneration occurring after a large fire in the Mediterranean basin. Int. J. Wildland Fire 2004, 13, 209–216. [Google Scholar] [CrossRef]
- Carlson, D.J.; Reich, P.B.; Frelich, L.E. Fine-scale heterogeneity in overstory composition contributes to heterogeneity of wildfire severity in southern boreal forest. J. For. Res. 2011, 16, 203–214. [Google Scholar] [CrossRef]
- Fernandes, P.M.; Luz, A.; Loureiro, C. Changes in wildfire severity from maritime pine woodland to contiguous forest types in the mountains of northwestern Portugal. For. Ecol. Manag. 2010, 260, 883–892. [Google Scholar] [CrossRef]
- Lentile, L.B.; Smith, F.W.; Shepperd, W.D. Influence of topography and forest structure on patterns of mixed severity fire in ponderosa pine forests of the South Dakota black hills, USA. Int. J. Wildland Fire 2006, 15, 557–566. [Google Scholar] [CrossRef]
- Scott, J.H.; Reinhardt, E.D. Assessing Crown Fire Potential by Linking Models of Surface and Crown Fire Behavior; Research Paper RMRS-RP-29; Department of Agriculture, Forest Service, Rocky Mountain Research Station: Fort Collins, CO, USA, 2001; p. 59. [Google Scholar]
- Brunsdon, C.; Fotheringham, A.S.; Charlton, M.E. Geographically Weighted Regression: A method for exploring spatial nonstationarity. Geogr. Anal. 1996, 28, 281–298. [Google Scholar] [CrossRef]
- Fotheringham, A.S.; Brunsdon, C.; Charlton, M. Geographically Weighted Regression: The Analysis of Spatially Varying Relationships; John Wiley & Sons: West Sussex, UK, 2003. [Google Scholar]
- An, K.-J.; Lee, S.-W.; Hwang, S.-J.; Park, S.-R.; Hwang, S.-A. Exploring the non-stationary effects of forests and developed land within watersheds on biological indicators of streams using geographically-weighted regression. Water 2016, 8, 120. [Google Scholar] [CrossRef]
- Tu, J. Spatially varying relationships between land use and water quality across an urbanization gradient explored by geographically weighted regression. Appl. Geogr. 2011, 31, 376–392. [Google Scholar] [CrossRef]
- Propastin, P.; Ibrom, A.; Knohl, A.; Erasmi, S. Effects of canopy photosynthesis saturation on the estimation of gross primary productivity from Modis data in a tropical forest. Remote Sens. Environ. 2012, 121, 252–260. [Google Scholar] [CrossRef]
- Lu, B.; Charlton, M.; Fotheringhama, A.S. Geographically weighted regression using a non-Euclidean distance metric with a study on London house price data. Procedia Environ. Sci. 2011, 7, 92–97. [Google Scholar] [CrossRef]
- Saphores, J.-D.; Li, W. Estimating the value of urban green areas: A hedonic pricing analysis of the single family housing market in Los Angeles, CA. Landsc. Urban Plan. 2012, 104, 373–387. [Google Scholar] [CrossRef]
- Kamarianakis, Y.; Shen, W.; Wynter, L. Real-time road traffic forecasting using regime-switching space-time models and adaptive lasso. Appl. Stoch. Models Bus. Ind. 2012, 28, 297–315. [Google Scholar] [CrossRef]
- Szymanowski, M.; Kryza, M. Application of geographically weighted regression for modelling the spatial structure of urban heat island in the city of Wroclaw (SW Poland). Procedia Environ. Sci. 2011, 3, 87–92. [Google Scholar] [CrossRef]
- Nunes, A.; Lourenço, L.; Meira, A.C. Exploring spatial patterns and drivers of forest fires in Portugal (1980–2014). Sci. Total Environ. 2016, 573, 1190–1202. [Google Scholar] [CrossRef] [PubMed]
- Rodrigues, M.; de la Riva, J.; Fotheringham, S. Modeling the spatial variation of the explanatory factors of human-caused wildfires in Spain using geographically weighted logistic regression. Appl. Geogr. 2014, 48, 52–63. [Google Scholar] [CrossRef]
- Martínez-Fernández, J.; Chuvieco, E.; Koutsias, N. Modelling long-term fire occurrence factors in Spain by accounting for local variations with geographically weighted regression. Nat. Hazards Earth Syst. 2013, 13, 311. [Google Scholar] [CrossRef]
- Oliveira, S.; Pereira, J.M.; San-Miguel-Ayanz, J.; Lourenço, L. Exploring the spatial patterns of fire density in southern Europe using geographically weighted regression. Appl. Geogr. 2014, 51, 143–157. [Google Scholar] [CrossRef]
- Korea Forest Service. Fires in Eastern Regions; Korea Forest Service: Daejoen, Korea, 2001; Volume 1, pp. 33–36. [Google Scholar]
- Lloret, F.; Calvo, E.; Pons, X.; Díaz-Delgado, R. Wildfires and landscape patterns in the eastern Iberian peninsula. Landsc. Ecol. 2002, 17, 745–759. [Google Scholar] [CrossRef]
- Gralewicz, N.J.; Nelson, T.A.; Wulder, M.A. Factors influencing national scale wildfire susceptibility in canada. For. Ecol. Manag. 2012, 265, 20–29. [Google Scholar] [CrossRef]
- Lee, S.-W.; Won, M.-S.; Lee, J.-M.; Kim, H.-G. Intermediate-scale analysis of landscape characteristics affecting edge formation in burned forests in Samcheok, Korea. J. Mt. Sci. 2014, 11, 384–397. [Google Scholar] [CrossRef]
- Autodesk. 2016. Available online: http://www.autodesk.com/products/autocad/overview (accessed on 4 October 2016).
- ESRI ArcGIS Model Builder. 2016. Available online: http://resources.arcgis.com/en/help/main/10.1/index.html#//002w00000001000000 (accessed on 4 October 2016).
- Key, C.; Benson, N. Fire Effects Monitoring and Inventory Protocol—Landscape Assessment; USDA Forest Service Fire Science Laboratory: Missoula, MT, USA, 2002; pp. 1–16. [Google Scholar]
- Morgan, P.; Hardy, C.C.; Swetnam, T.W.; Rollins, M.G.; Long, D.G. Mapping fire regimes across time and space: Understanding coarse and fine-scale fire patterns. Int. J. Wildland Fire 2001, 10, 329–342. [Google Scholar] [CrossRef]
- Miller, J.D.; Yool, S.R. Mapping forest post-fire canopy consumption in several overstory types using multi-temporal landsat TM and ETM data. Remote Sens. Environ. 2002, 82, 481–496. [Google Scholar] [CrossRef]
- White, J.D.; Ryan, K.C.; Key, C.C.; Running, S.W. Remote sensing of forest fire severity and vegetation recovery. Int. J. Wildland Fire 1996, 6, 125–136. [Google Scholar] [CrossRef]
- Wimberly, M.C.; Reilly, M.J. Assessment of fire severity and species diversity in the southern Appalachians using Landsat tm and ETM+ imagery. Remote Sens. Environ. 2007, 108, 189–197. [Google Scholar] [CrossRef]
- Cocke, A.E.; Fulé, P.Z.; Crouse, J.E. Comparison of burn severity assessments using differenced normalized burn ratio and ground data. Int. J. Wildland Fire 2005, 14, 189–198. [Google Scholar] [CrossRef]
- Collins, B.M.; Kelly, M.; van Wagtendonk, J.W.; Stephens, S.L. Spatial patterns of large natural fires in Sierra Nevada wilderness areas. Landsc. Ecol. 2007, 22, 545–557. [Google Scholar] [CrossRef]
- Epting, J.; Verbyla, D.; Sorbel, B. Evaluation of remotely sensed indices for assessing burn severity in interior Alaska using Landsat tm and ETM+. Remote Sens. Environ. 2005, 96, 328–339. [Google Scholar] [CrossRef]
- Roy, D.P.; Boschetti, L.; Trigg, S.N. Remote sensing of fire severity: Assessing the performance of the normalized burn ratio. IEEE Geosci. Remote Sens. Lett. 2006, 3, 112–116. [Google Scholar] [CrossRef]
- Remote Sensing Application Center (RSAC). Burned Area Emergency Response (BAER) Imagery Support; Department of Agriculture Forest Service, Remote Sensing Applications Center: Salt Lake City, UT, USA, 2005; Available online: http://www.fs.fed.us/eng/rsac/baer/ (accessed on 4 October 2016).
- Brunsdon, C.; Fotheringham, S.; Charlton, M. Geographically Weighted Regression. J. R. Stat. Soc. Ser. D Stat. 1998, 47, 431–443. [Google Scholar] [CrossRef]
- Fotheringham, A.S. Quantification, evidence and positivism. In Approaches to Human Geography; Aitken, S., Valentine, G., Eds.; SAGE Publications: Thousand Oaks, CA, USA, 2006; pp. 237–250. [Google Scholar]
- Fortin, M.-J.; Drapeau, P.; Legendre, P. Spatial autocorrelation and sampling design in plant ecology. Vegetatio 1989, 83, 209–222. [Google Scholar] [CrossRef]
- Lee, B.; Won, M.S.; Lee, Y.; Lee, M.B. Crown fuel characteristics and carbon emission from Japanese red pine stands burned by crown fire in Mt. Palgong, South Korea. J. Mt. Sci. 2012, 9, 656–664. [Google Scholar] [CrossRef]
- Hare, R.C. Contribution of bark to fire resistance of southern trees. J. For. 1965, 63, 248–251. [Google Scholar]
- Hengst, G.E.; Dawson, J.O. Bark properties and fire resistance of selected tree species from the central hardwood region of North America. Can. J. For. Res. 1994, 24, 688–696. [Google Scholar] [CrossRef]
- Pinard, M.A.; Huffman, J. Fire resistance and bark properties of trees in a seasonally dry forest in eastern Bolivia. J. Trop. Ecol. 1997, 13, 727–740. [Google Scholar] [CrossRef]
- Agee, J.K. Fire and Weather Disturbances in Terrestrial Ecosystems of the Eastern Cascades; General Technical Report PNW-GTR-320; USDA Forest Service Pacific Northwest Research Station: Portland, OR, USA, 1994; p. 52. [Google Scholar]
Figure 1.
Location of the Samcheok burn site. The damaged area covered 16,151 ha, and, to the east, it bordered the East Sea. Most residential areas were located along the seashore. The west side of the study site is mountainous with steep slopes, whereas the east side has relatively lower elevations and milder slopes.

Figure 2.
Box plots of the measured variables. The box plots indicate a variety of distribution patterns of burn severity, percentage of Japanese red pine, elevation, and slope. The distribution of elevation was skewed slightly left, and burn severity and slope were aggregated around the median.
Figure 2.
Box plots of the measured variables. The box plots indicate a variety of distribution patterns of burn severity, percentage of Japanese red pine, elevation, and slope. The distribution of elevation was skewed slightly left, and burn severity and slope were aggregated around the median.

Figure 3.
Spatial distribution of the measured burn severity, percentage of red pine trees, elevation (m), and slope (%). The most severely burned areas were observed in the east areas with lower elevations and milder slopes, where red pine dominated.
Figure 3.
Spatial distribution of the measured burn severity, percentage of red pine trees, elevation (m), and slope (%). The most severely burned areas were observed in the east areas with lower elevations and milder slopes, where red pine dominated.
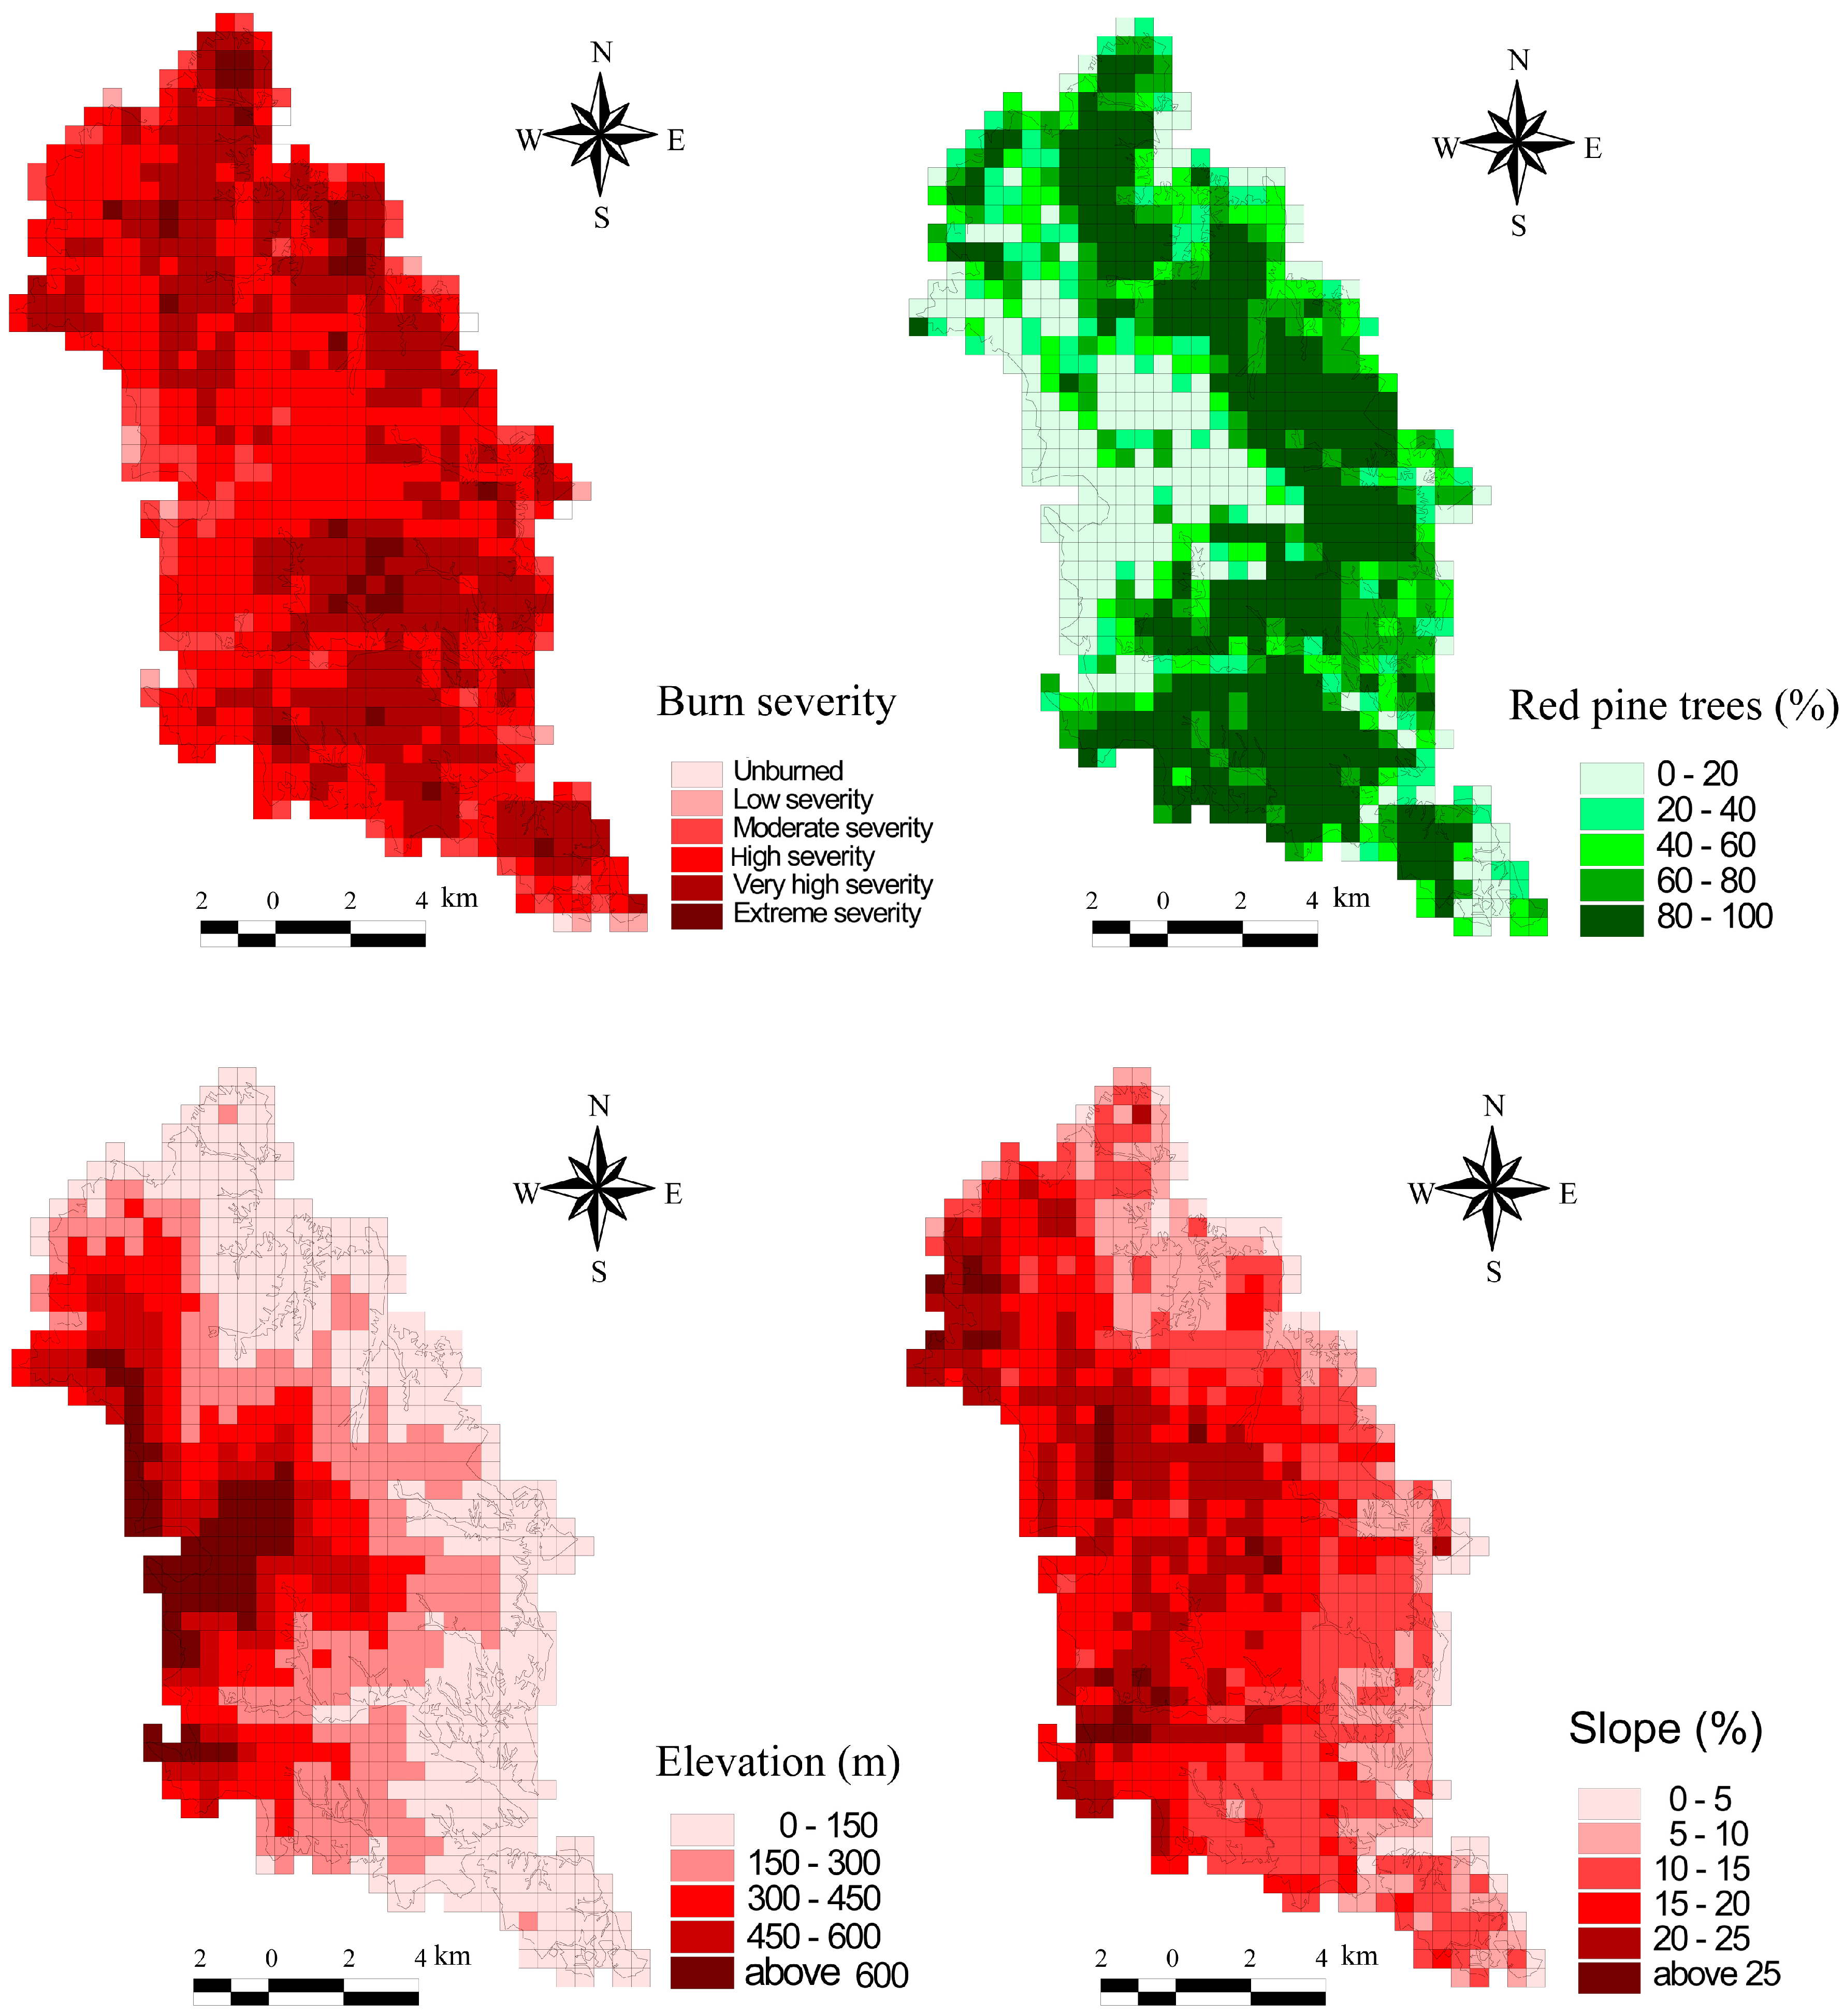
Figure 4.
Scatter plots between observed burn severity and predicted burn severity using the OLS (left) and GWR models (right). The OLS model appeared to overestimate low burn severity and under-estimate high burn severity.
Figure 4.
Scatter plots between observed burn severity and predicted burn severity using the OLS (left) and GWR models (right). The OLS model appeared to overestimate low burn severity and under-estimate high burn severity.

Figure 5.
Spatial distributions of predicted burn severity, R2, red pine coefficient, and standard residuals in the GWR model. The R2 and red pine coefficient exhibited high spatial variation. The nearly random pattern of the residuals indicated a lack of spatial autocorrelation.
Figure 5.
Spatial distributions of predicted burn severity, R2, red pine coefficient, and standard residuals in the GWR model. The R2 and red pine coefficient exhibited high spatial variation. The nearly random pattern of the residuals indicated a lack of spatial autocorrelation.
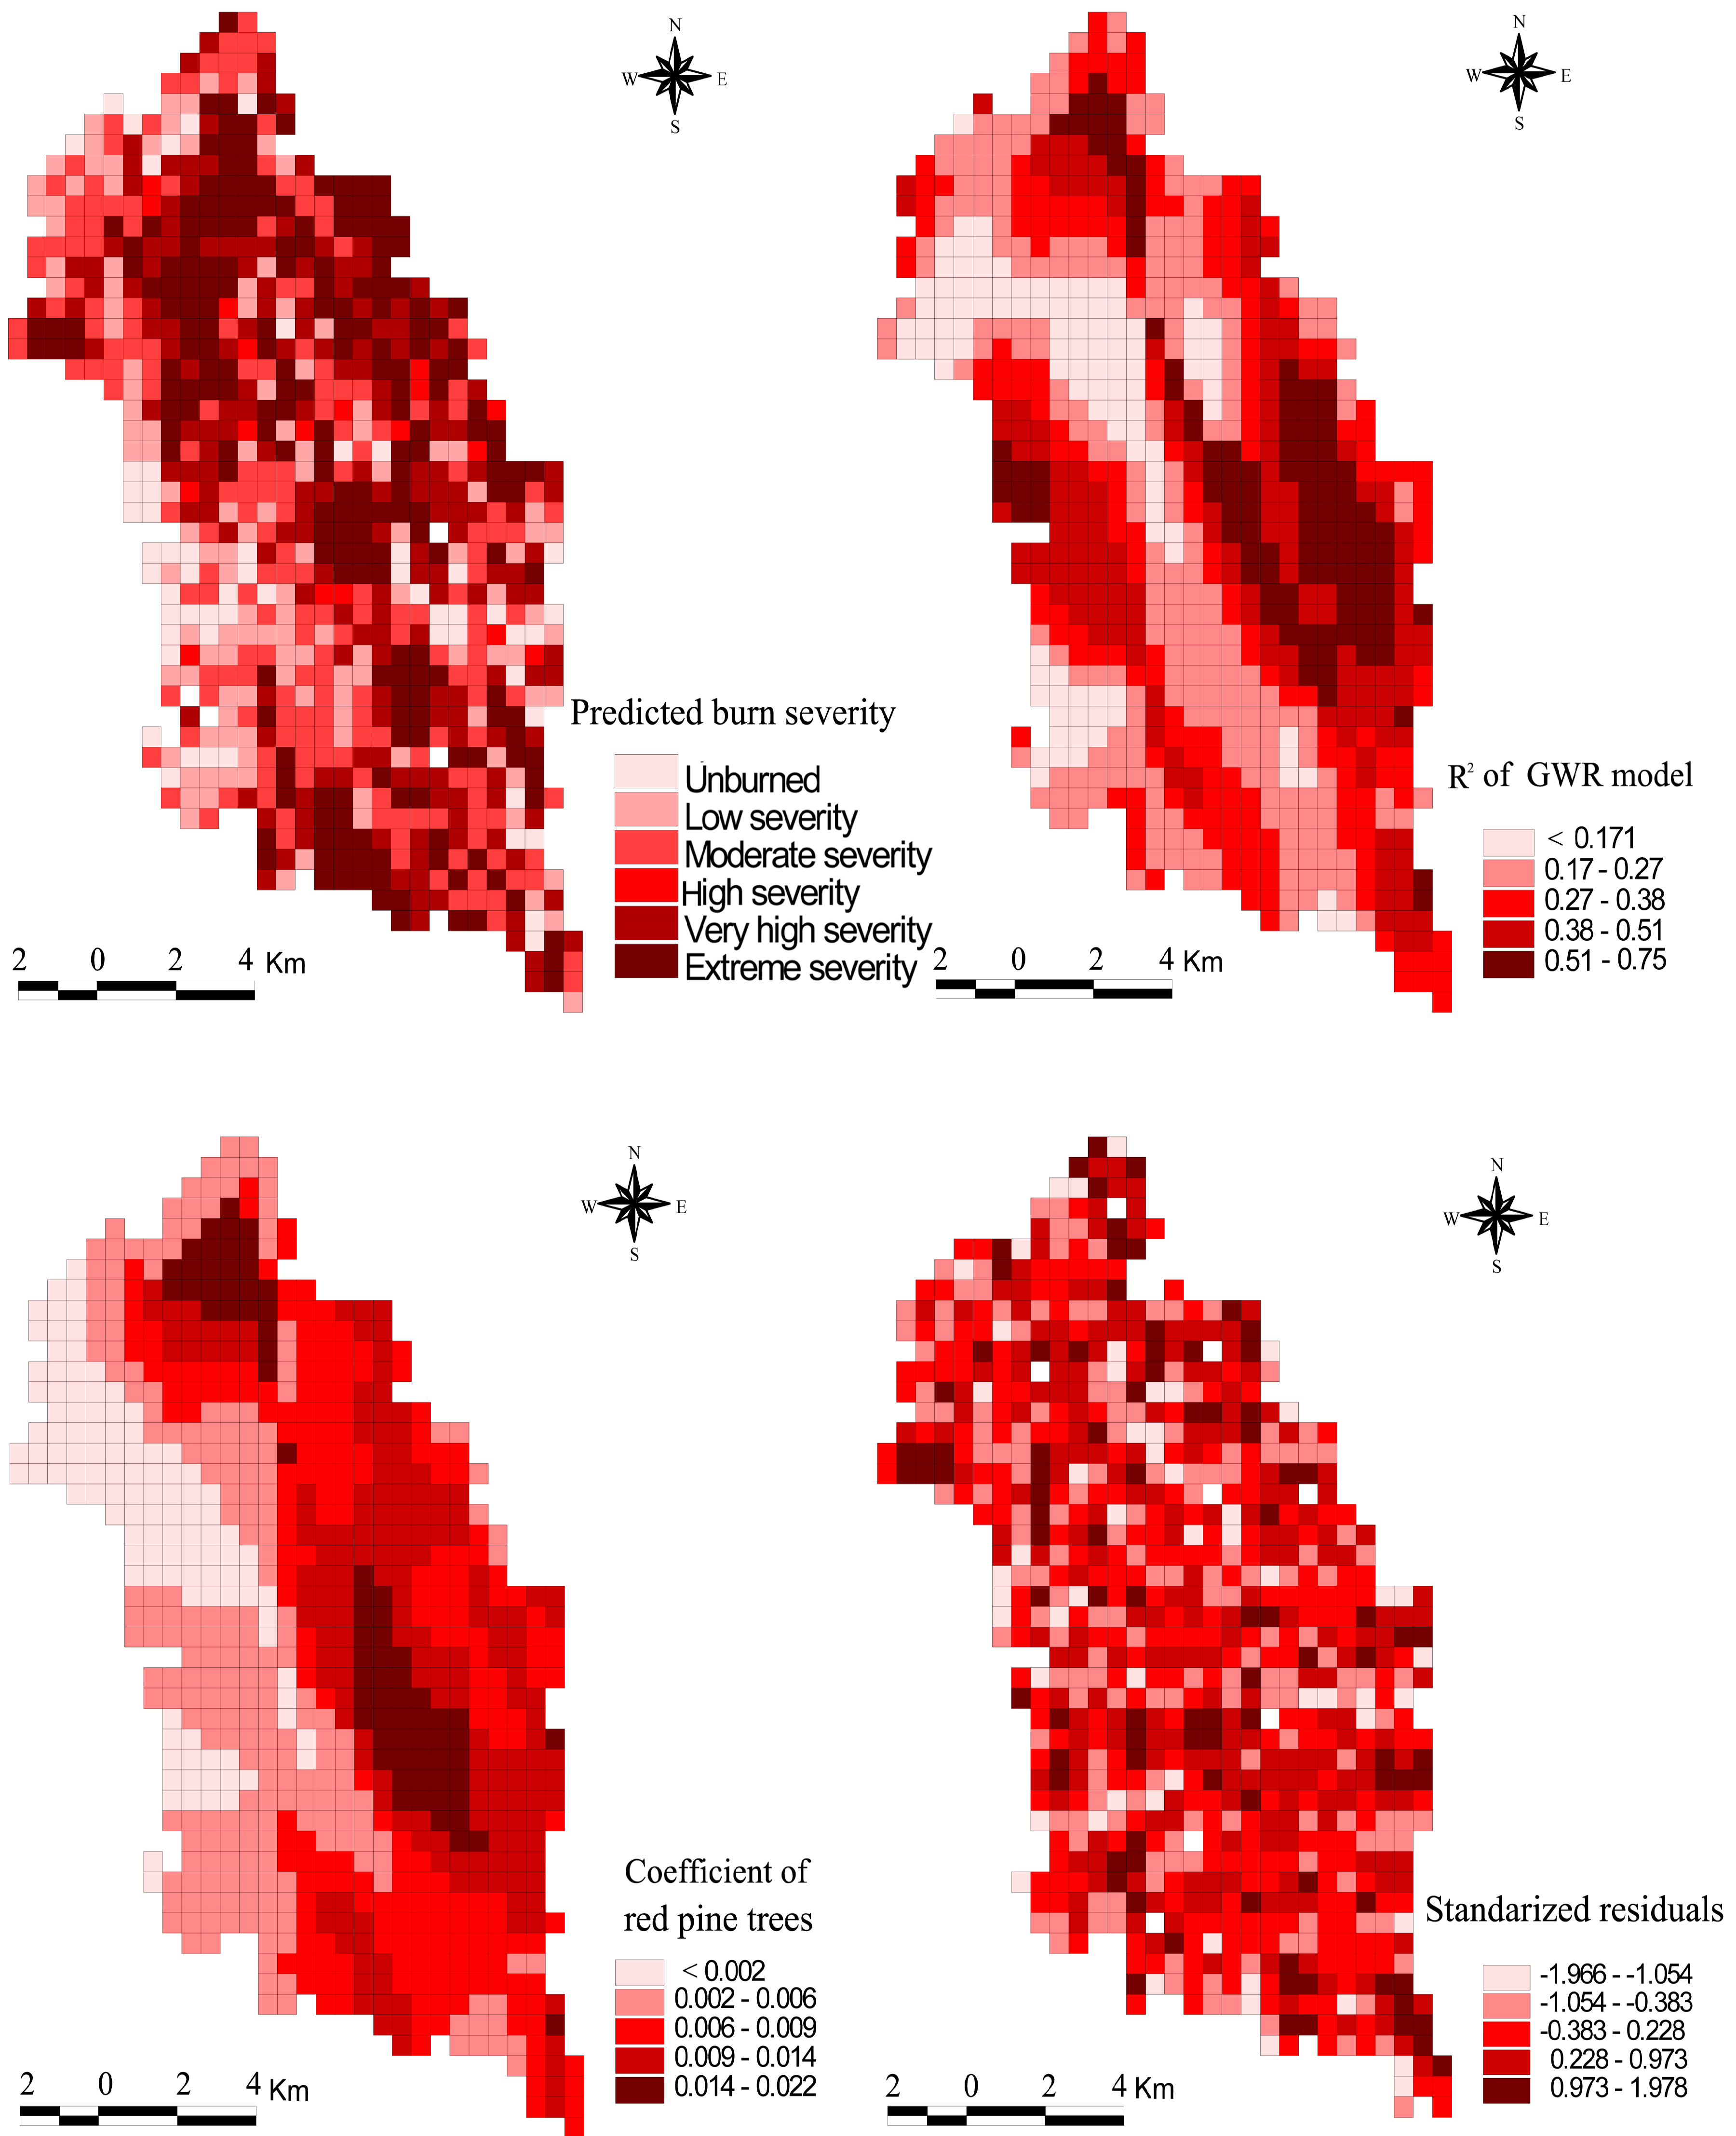
Figure 6.
Box plots of the (a) predicted burn severity, (b) local R2, (c) coefficients of red pine, and (d) residuals of the estimated GWR model. The distributions of the local R2 and coefficients of red pine showed high variance, suggesting the presence of non-stationary effects of red pine on burn severity.

Table 1.
Correlations between observed variables. There was a strong correlation between burn severity and the percentage of Japanese red pine trees and a significant negative relationship between Japanese red pine trees and elevation.
Table 1.
Correlations between observed variables. There was a strong correlation between burn severity and the percentage of Japanese red pine trees and a significant negative relationship between Japanese red pine trees and elevation.
| Red Pine Trees (%) | Slope (%) | Elevation (m) | |
|---|---|---|---|
| Burn severity | 0.48 ** | 0.01 | −0.22 ** |
| Red pine trees (%) | −0.08 * | −0.41 ** | |
| Slope (%) | 0.69 ** |
* p < 0.05, ** p < 0.01. n = 826.
Table 2.
Estimated ordinary least squares (OLS) model (global model) and geographically weighted regression (GWR) model (local model). The OLS model explained about 23% of the variance in burn severity, while the GWR model explained about 48%.
Table 2.
Estimated ordinary least squares (OLS) model (global model) and geographically weighted regression (GWR) model (local model). The OLS model explained about 23% of the variance in burn severity, while the GWR model explained about 48%.
| Variable | OLS Model (Global Model) | GWR Model 1 (Local Model) | ||
|---|---|---|---|---|
| b | β | t-Value | ||
| Intercept | 3.22 | - | 48.87 ** | - |
| Red pine (%) | 0.009 | 0.48 | 13.97 ** | - |
| Slope (%) | 0.015 | 0.14 | 3.09 * | - |
| Elevation (m) | 0.001 | −0.12 | −2.59 ** | |
| F-value | 103.36 ** | |||
| Adjusted R2 | 0.28 | 0.57 | ||
| AICc | 1330.45 | 950.46 | ||
| Moran’s I 2 | 0.5 | 0.28 | ||
1 Coefficients of the intercept and other variables in the GWR model vary among observations; 2 Spatial autocorrelation index of residuals; * p < 0.05, ** p < 0.01.
Table 3.
Correlations between observed topographic variables and parameters of the estimated GWR model. The coefficient of pine trees in the GWR model showed negative relationships with elevation and slope suggesting that the effect of red pine trees on burn severity was likely low in areas with high elevation and steep slopes.
| Topographic Characteristics | Estimated GWR Model | ||||
|---|---|---|---|---|---|
| R2 | Intercept | C_Pine | C_Elevation | C_Slope | |
| Elevation (m) | −0.12 | 0.32 ** | −0.45 ** | −0.45 ** | 0.21 * |
| Slope (%) | −0.21 | 0.21 * | −0.37 ** | −0.28 ** | 0.12 |
C_Pine, Coefficient of pine trees; C_Elevation, Coefficient of elevation; C_Slope, Coefficient of slope. * p < 0.05, ** p < 0.01. n = 826.
Table 4.
Estimated regression models of four elevation groups. The β-value of red pine was higher for group 1 than for group 2 and became non-significant at very high elevations. Elevation was not significant in low-elevation areas, even though it was the main predictor in very high-elevation areas.
| Elevation Group | F-Value | Adjusted-R2 | Coefficients (β-Value) | ||
|---|---|---|---|---|---|
| Red Pine Trees | Slope | Elevation | |||
| Group 1 | 36.98 ** | 0.36 | 0.02 ** | 0.007 | 0.001 |
| −0.56 | −0.04 | −0.03 | |||
| Group 2 | 6.72 ** | 0.08 | 0.008 ** | −0.028 * | 0.001 |
| −0.27 | (−0.16) | −0.07 | |||
| Group 3 | 10.74 ** | 0.13 | 0.004 ** | −0.041 ** | 0.002 ** |
| −0.23 | (−0.26) | −0.19 | |||
| Group 4 | 34.22 ** | 0.34 | 0.004 ** | −0.017 | −0.003 ** |
| −0.19 | (−0.08) | (−0.52) | |||
* p < 0.05, ** p < 0.01.
© 2017 by the authors. Licensee MDPI, Basel, Switzerland. This article is an open access article distributed under the terms and conditions of the Creative Commons Attribution (CC BY) license (http://creativecommons.org/licenses/by/4.0/).
Share and Cite
MDPI and ACS Style
Lee, H.-J.; Kim, E.-J.; Lee, S.-W. Examining Spatial Variation in the Effects of Japanese Red Pine (Pinus densiflora) on Burn Severity Using Geographically Weighted Regression. Sustainability 2017, 9, 804. https://doi.org/10.3390/su9050804
AMA Style
Lee H-J, Kim E-J, Lee S-W. Examining Spatial Variation in the Effects of Japanese Red Pine (Pinus densiflora) on Burn Severity Using Geographically Weighted Regression. Sustainability. 2017; 9(5):804. https://doi.org/10.3390/su9050804
Chicago/Turabian StyleLee, Hyun-Joo, Eujin-Julia Kim, and Sang-Woo Lee. 2017. "Examining Spatial Variation in the Effects of Japanese Red Pine (Pinus densiflora) on Burn Severity Using Geographically Weighted Regression" Sustainability 9, no. 5: 804. https://doi.org/10.3390/su9050804
Note that from the first issue of 2016, this journal uses article numbers instead of page numbers. See further details here.