
Climate Variability and Mangrove Cover Dynamics at Species Level in the Sundarbans, Bangladesh


1
School of Environmental and Rural Science, University of New England, Armidale, NSW 2351, Australia
2
Geography and Environmental Studies, University of Rajshahi, Rajshahi 6205, Bangladesh
*
Author to whom correspondence should be addressed.
Sustainability 2017, 9(5), 805; https://doi.org/10.3390/su9050805
Submission received: 14 February 2017
/
Revised: 3 May 2017
/
Accepted: 10 May 2017
/
Published: 11 May 2017
(This article belongs to the Special Issue Wetland Ecology, Conservation and Sustainability: Applications of Geospatial Techniques)
Abstract
:Mangrove ecosystems are complex in nature. For monitoring the impact of climate variability in this ecosystem, a multidisciplinary approach is a prerequisite. Changes in temperature and rainfall pattern have been suggested as an influential factor responsible for the change in mangrove species composition and spatial distribution. The main aim of this study was to assess the relationship between temperature, rainfall pattern and dynamics of mangrove species in the Sundarbans, Bangladesh, over a 38 year time period from 1977 to 2015. To assess the relationship, a three stage analytical process was employed. Primarily, the trend of temperature and rainfall over the study period were identified using a linear trend model; then, the supervised maximum likelihood classifier technique was employed to classify images recorded by Landsat series and post-classification comparison techniques were used to detect changes at species level. The rate of change of different mangrove species was also estimated in the second stage. Finally, the relationship between temperature, rainfall and the dynamics of mangroves at species level was determined using a simple linear regression model. The results show a significant statistical relationship between temperature, rainfall and the dynamics of mangrove species. The trends of change for Heritiera fomes and Sonneratia apelatala show a strong relationship with temperature and rainfall, while Ceriops decandra shows a weak relationship. In contrast, Excoecaria agallocha and Xylocarpus mekongensis do not show any significant relationship with temperature and rainfall. On the basis of our results, it can be concluded that temperature and rainfall are important climatic factors influencing the dynamics of three major mangrove species viz. H. fomes, S. apelatala and C. decandra in the Sundarbans.
1. Introduction
The impacts and vulnerabilities due to climate variability are becoming a growing global concern. Changes in temperature and rainfall are already evident around the world, as well as in Bangladesh [1]. Bangladesh is experiencing frequent natural hazards such as cyclones, high water events, floods and others, which have been intensified by climate change and its variability in recent years. Climate variability has profound impacts (such as change in species composition, change in phenological pattern, salinity stress, change in productivity) on mangroves, and the Sundarbans is an innocent victim of accelerated global warming and climate variability, and thereby faces a direct threat to its very existence [2]. Climate change and its variability is expected to have a substantial effect on the flow regimes of the major rivers in Bangladesh, including the Ganges. The Sundarbans could be severely affected by this change since the sustainability of the Sundarbans depends on the hydrology of the Ganges and its tributaries which supply fresh water to this ecosystem. In addition to the altered hydrology, sea level rise may also have adverse impacts on the forest [3]. Therefore, it is important to investigate the trend of climate variability and its probable impact on mangroves. Detailed information about trends in climate variability and their probable impact on mangrove species composition can be used as a supporting database to help sustainable management planners and other relevant stakeholders to develop a proper adaptation strategy for this forest for maximum sustainable yield.
Components associated with climate change that are likely to affect mangrove forests include changes in temperature, rainfall, sea-level, frequency of storms and cyclones, concentration of atmospheric CO2, high water events, and ocean circulation patterns [4,5]. Although sea level rise is considered one of the most important factors that affect the distribution of mangroves in the long run [6,7], changes in regional temperature, rainfall and catchment runoff may be more significant in the short term [5,8]. Rainfall over land has increased by about 2% in the twentieth century worldwide [5], but this increase has not been uniform either spatially or temporally. Rainfall is predicted to increase by about 25% by 2050 as a result of climate change [4], however, the distribution of rainfall will be uneven at a regional scale [9]. Growth and spatial distribution of mangroves are likely to be affected by any changes in rainfall patterns [6,10]. In coastal regions, higher rainfall helps to increase the supply of sediments and nutrients, reduces water and soil salinity and decreases exposure to sulphates; and these factors can play a vital role in increasing diversity, growth and productivity of mangrove forests. It can also play a crucial role by increasing peat production to maintain the sediment elevation [8,11,12]. On the contrary, lesser rainfall plays a vital role in increasing salinity, which is responsible for decreasing the growth, productivity and survival of seedlings, thus increasing competition for survival between mangrove species. This process can lead to reductions in mangrove area with possible increases in the extent of salt flats [4,13] and can also change the species composition and their spatial distribution in the forest [6,11].
Mangrove species also show considerable variation in their sensitivity to temperature [6]. Globally the average temperature has increased by 0.74 °C between 1906 and 2005 [14] and the linear warming trend of the last five decades is nearly twice that of the last ten decades [4]. The projections for global average temperature rise to the end of the twenty-first century is 1.1 to 6.4 °C [14]. The impact of this increasing temperature on the generative capacity of mangroves is difficult to predict. Increased temperature is expected to affect mangroves by changing phenological patterns (timing of flowering and fruiting), changing species composition, increasing mangrove productivity where temperature does not exceed an upper threshold and expanding mangroves ranges to higher latitudes where temperature only limits the range among other factors [4,6,11].
The pattern of change of the Sundarbans mangrove forest in Bangladesh is commonly associated with the change in species level composition of mangroves and seaward expansion in some parts of the forest [15]. Due to high population densities in its immediate vicinity, landward expansion of the Sundarbans are limited. Researchers have identified rainfall as a mechanism for mangroves encroachment into salt marsh (see, for example, [16,17,18,19]) around the world. According to them it can also affect the spatial distribution of mangrove species. In addition, Jagtap and Nagle [20], Field [6], Ellison [11] and Gilman and co-authors [4] found rising temperature to be one of the important factors responsible for changes in mangrove species composition. Research regarding climatic variables’ association with mangrove dynamics have only been conducted in a few areas over short time periods around the world [4]. However, in the Sundarbans, no investigation has been conducted on the relationship between climate variability and mangrove dynamics at species level so far.
The aim of this research was to investigate the relationship between climatic variables and mangrove dynamics at species level in the Sundarbans, Bangladesh, over a 38-year period from 1977 to 2015. Our specific research questions included (1) what changes in local climate (e.g., annual average maximum and minimum temperature and annual total rainfall) over the period 1977–2015, have occurred in the study area? (2) How and at what rate has the mangrove composition in the Sundarbans changed during the study period? And finally, (3) is there any relationship between change in climatic variables and change in mangrove species composition? The results of the study is expected to provide a better understanding of mangroves’ response to climate variability in the Sundarbans.
2. Method
2.1. Study Area
The Sundarbans is at the Ganges delta where the three mighty river systems: Ganges, Brahmaputra and Meghna converge [15,21,22], and is characterized by a complex pattern of tributaries [23]. The Sundarbans extends between 21°32′ to 22°40′ N latitude and 88°05′ to 89°51′ E longitude (Figure 1) and covers an area of around 10,000 km2. Approximately 62% of the Sundarbans is located in Bangladesh and the rest is in India [24]. Four main seasons, including pre-monsoon, monsoon, post-monsoon and dry winter, form the tropical climate of the area. The hot and humid pre-monsoon season with irregular rainfall ranges from March to May and is followed by a monsoon (June to September), a post-monsoon (October to November) and dry winter (December to February) [25,26]. In this study only the Bangladeshi part of the Sundarbans was considered as the study site due to the difficulties in fieldwork on the Indian side.
Climate data is available since 1948 for each of the three weather stations (Khulna, Satkhira and Bagherhat) that covers the Sundarbans mangrove forest region of the Bangladesh part. Climatic conditions of all the three stations are similar due to the close association between rainfall and temperature [22]. In this region, temperature varies between 11 °C and 37 °C, while rainfall fluctuates between 1600 mm and 2000 mm. The elevation varies between 0.9 and 2.11 m above sea level [24,25].
2.2. Data Used in This Research
Ground-based readings of temperature and rainfall, as well as satellite imagery, were used in this study. Ground-based meteorological information was obtained from Bangladesh Meteorological Department (BMD) for the period 1977 to 2015 to determine the trends of rainfall and temperature. Satellite images obtained from the US Geological Survey (USGS) Center for Earth Resources Observation and Science (EROS) website (www.glovis.usgs.gov) in four time periods were analysed to assess the dynamics of mangrove population. Due to a lack of spatial data at a relevant scale and difficulty in accessing the mangroves for field survey, monitoring of the changes in mangrove species composition has been limited [5]. In this regard, remote sensing techniques could play an important and effective role in identifying and mapping mangrove species composition changes with an acceptable accuracy and it also has advantages over traditional methods [15,27,28,29,30,31,32]. To identify mangrove forests, a number of satellite sensors have been used, including Landsat TM/ETM/OLI [15,33,34], SPOT [35,36], CBERS [37], SIR [36], ASTER [38], and IKONOS and Quick Bird [39]. According to Wang and co-authors [40], conventional satellite imagery such as Landsat and SPOT have been used for mapping mangrove species with mixed results. They also pointed out that spatial resolution is more effective than spectral resolution in discriminating different mangrove species. Green and co-authors [28] reported that airborne sensors, such as CASI, were more successful in accurate discrimination among mangrove species than conventional satellite data. From the above discussion, it is apparent that using conventional medium-resolution remote sensor data (e.g., Landsat TM, ASTER, SPOT), the identification of different mangrove species remains a challenging task. In many developing countries, the high cost of acquiring high-resolution satellite imagery excludes its routine use [41]. The free availability of archived images enables the development of useful techniques in its use, with this in mind; Landsat imagery were used in this study for mangrove species classification. Even though it has limitations, such as coarse resolution, many researchers have used this imagery successfully in mangrove mapping at species level (for example [15,33,42]). Satellite imagery used in this study includes: Landsat Multispectral Scanner (MSS) of 57 m resolution acquired on 1st February 1977, Landsat Thematic Mapper (TM) of 28.5 m resolution acquired on 5th February 1989, Landsat Enhanced Thematic Mapper (ETM+) of 28.5 m resolution acquired on 28th February 2000 and Landsat Operational Land Imager (OLI) of 30 m resolution acquired on 4th February 2015.
2.3. Trend Analysis of Climatic Variables
This analysis was carried out to verify the variation of average maximum temperature, average minimum temperature and annual total rainfall to understand the climate variability throughout the period 1977–2015. To understand the trend of annual average maximum and minimum temperature and annual total rainfall, climatic conditions of three time periods extending from 1977 to 1989, 1989 to 2000, 2000–2015 and the overall period of 1977 to 2015 were analyzed. Initially, the representation of time series (time series plot) was examined to select the appropriate trend model for the datasets. As the representation of time series exhibited a linear form, linear trend model was used for this analysis since it provides the best fit for the dataset and also provides linear unbiased estimation. Mangrove species change per district (Satkhira, Khulna and Bagherhat) was trended with climate data for that district. The entire statistical analysis was carried out using Minitab software (Version 17, Minitab Inc., State College, PA, USA).
2.4. Analysis of Satellite Images to Identify the Changes in Mangrove Cover
The supervised maximum likelihood classification algorithm (MLC) was used to classify and extract the mangrove population by species of the Sundarbans. Fieldwork and published maps were used to develop training and validation samples. Field data was used for training and validation sampling for 2015 imagery while reference map of the Sundarbans that was mapped at species level by Bangladesh Forest Department in 1985, was used for the 1989 image. Fieldwork was carried out between February–March 2016. A reference map of the Sundarbans (published by Bangladesh Forest Department), printed image of Google Earth and Landsat image data were used in this fieldwork as guides. Training and validation samples that were developed for the 1989 image were also used for the 1977 and 2000 images for training and validation sampling because reference data were not available for the corresponding years. A process called signature extension, suggested by Foody [43,44], was undertaken to use these samples, and this allowed us to use samples for unchanged areas for such purposes. The detailed methodology for this is given in Ghosh et al. [15] Training samples of between 51 and 141 for each species were randomly and carefully selected, stratified by land cover class based on true representation and distribution. These sample points were used to create sample polygons of 3 × 3 or 5 × 5 pixels depending on the class homogeneity. To include all defined mangrove species in the Sundarbans altogether 414, 429, 549 and 471 sample polygons were assessed for the images of 2015, 2000, 1989 and 1977 respectively.
The composition and distribution of the mangrove species were identified on the basis of signature-based satellite image classification. For 2015 imagery, training sets for different mangrove species were obtained using GPS during the fieldwork and, for rest of the imagery (1977, 1989 and 2000), training sets were developed from the reference map. Using these training sets, spectral signatures for different mangrove species were generated. Afterwards, extracted spectral signatures were used for the classification and identification of mangrove species. Five major mangrove species namely Heritiera fomes, Excoecaria agallocha, Ceriops decandra, Sonneratia apelatala and Xylocarpus mekongensis were mapped in this study out of 27 species present in the Sundarbans [27]. On the basis of dominance, the remaining species were classified under the five major mangrove species as those are difficult to detect using medium-resolution satellite data due to their small quantities and presence in small patches over the wide areas, as reported by Ghosh and co-authors [15]. To detect changes in mangrove species composition, post classification comparison techniques were used. Afterwards, the rate of change of different mangrove species were estimated. Overall accuracy and kappa index were calculated to estimate the accuracy of the image classification with respect to reference points. Image classification accuracy from the 1977 MSS image was lower (overall accuracy 72%, Kappa index 0.73) than that of the other TM, ETM+ and OLI images from other years. The highest overall accuracy (89%) and kappa index (0.87) were achieved from the 2015 OLI image.
2.5. Impacts of Climate Variability on Mangrove Cover Change
To investigate the relationship between the climate variability and the change in species composition in the Sundarbans, an effort was made to explore the impact of climate variability on mangrove species composition change. For this analysis, the data revealing mangrove species composition change were used to understand the trend of those changes in response to the average maximum and minimum temperature and the amount of annual total rainfall, for the period of 1977–2015. Then an attempt was made to identify any possible relationship between the trends of local climate variability and trend of change in mangrove species composition. Simple linear regression method was used to determine the relationship between climate variability and change in mangrove species composition.
3. Results
3.1. Trend of Climatic Variables
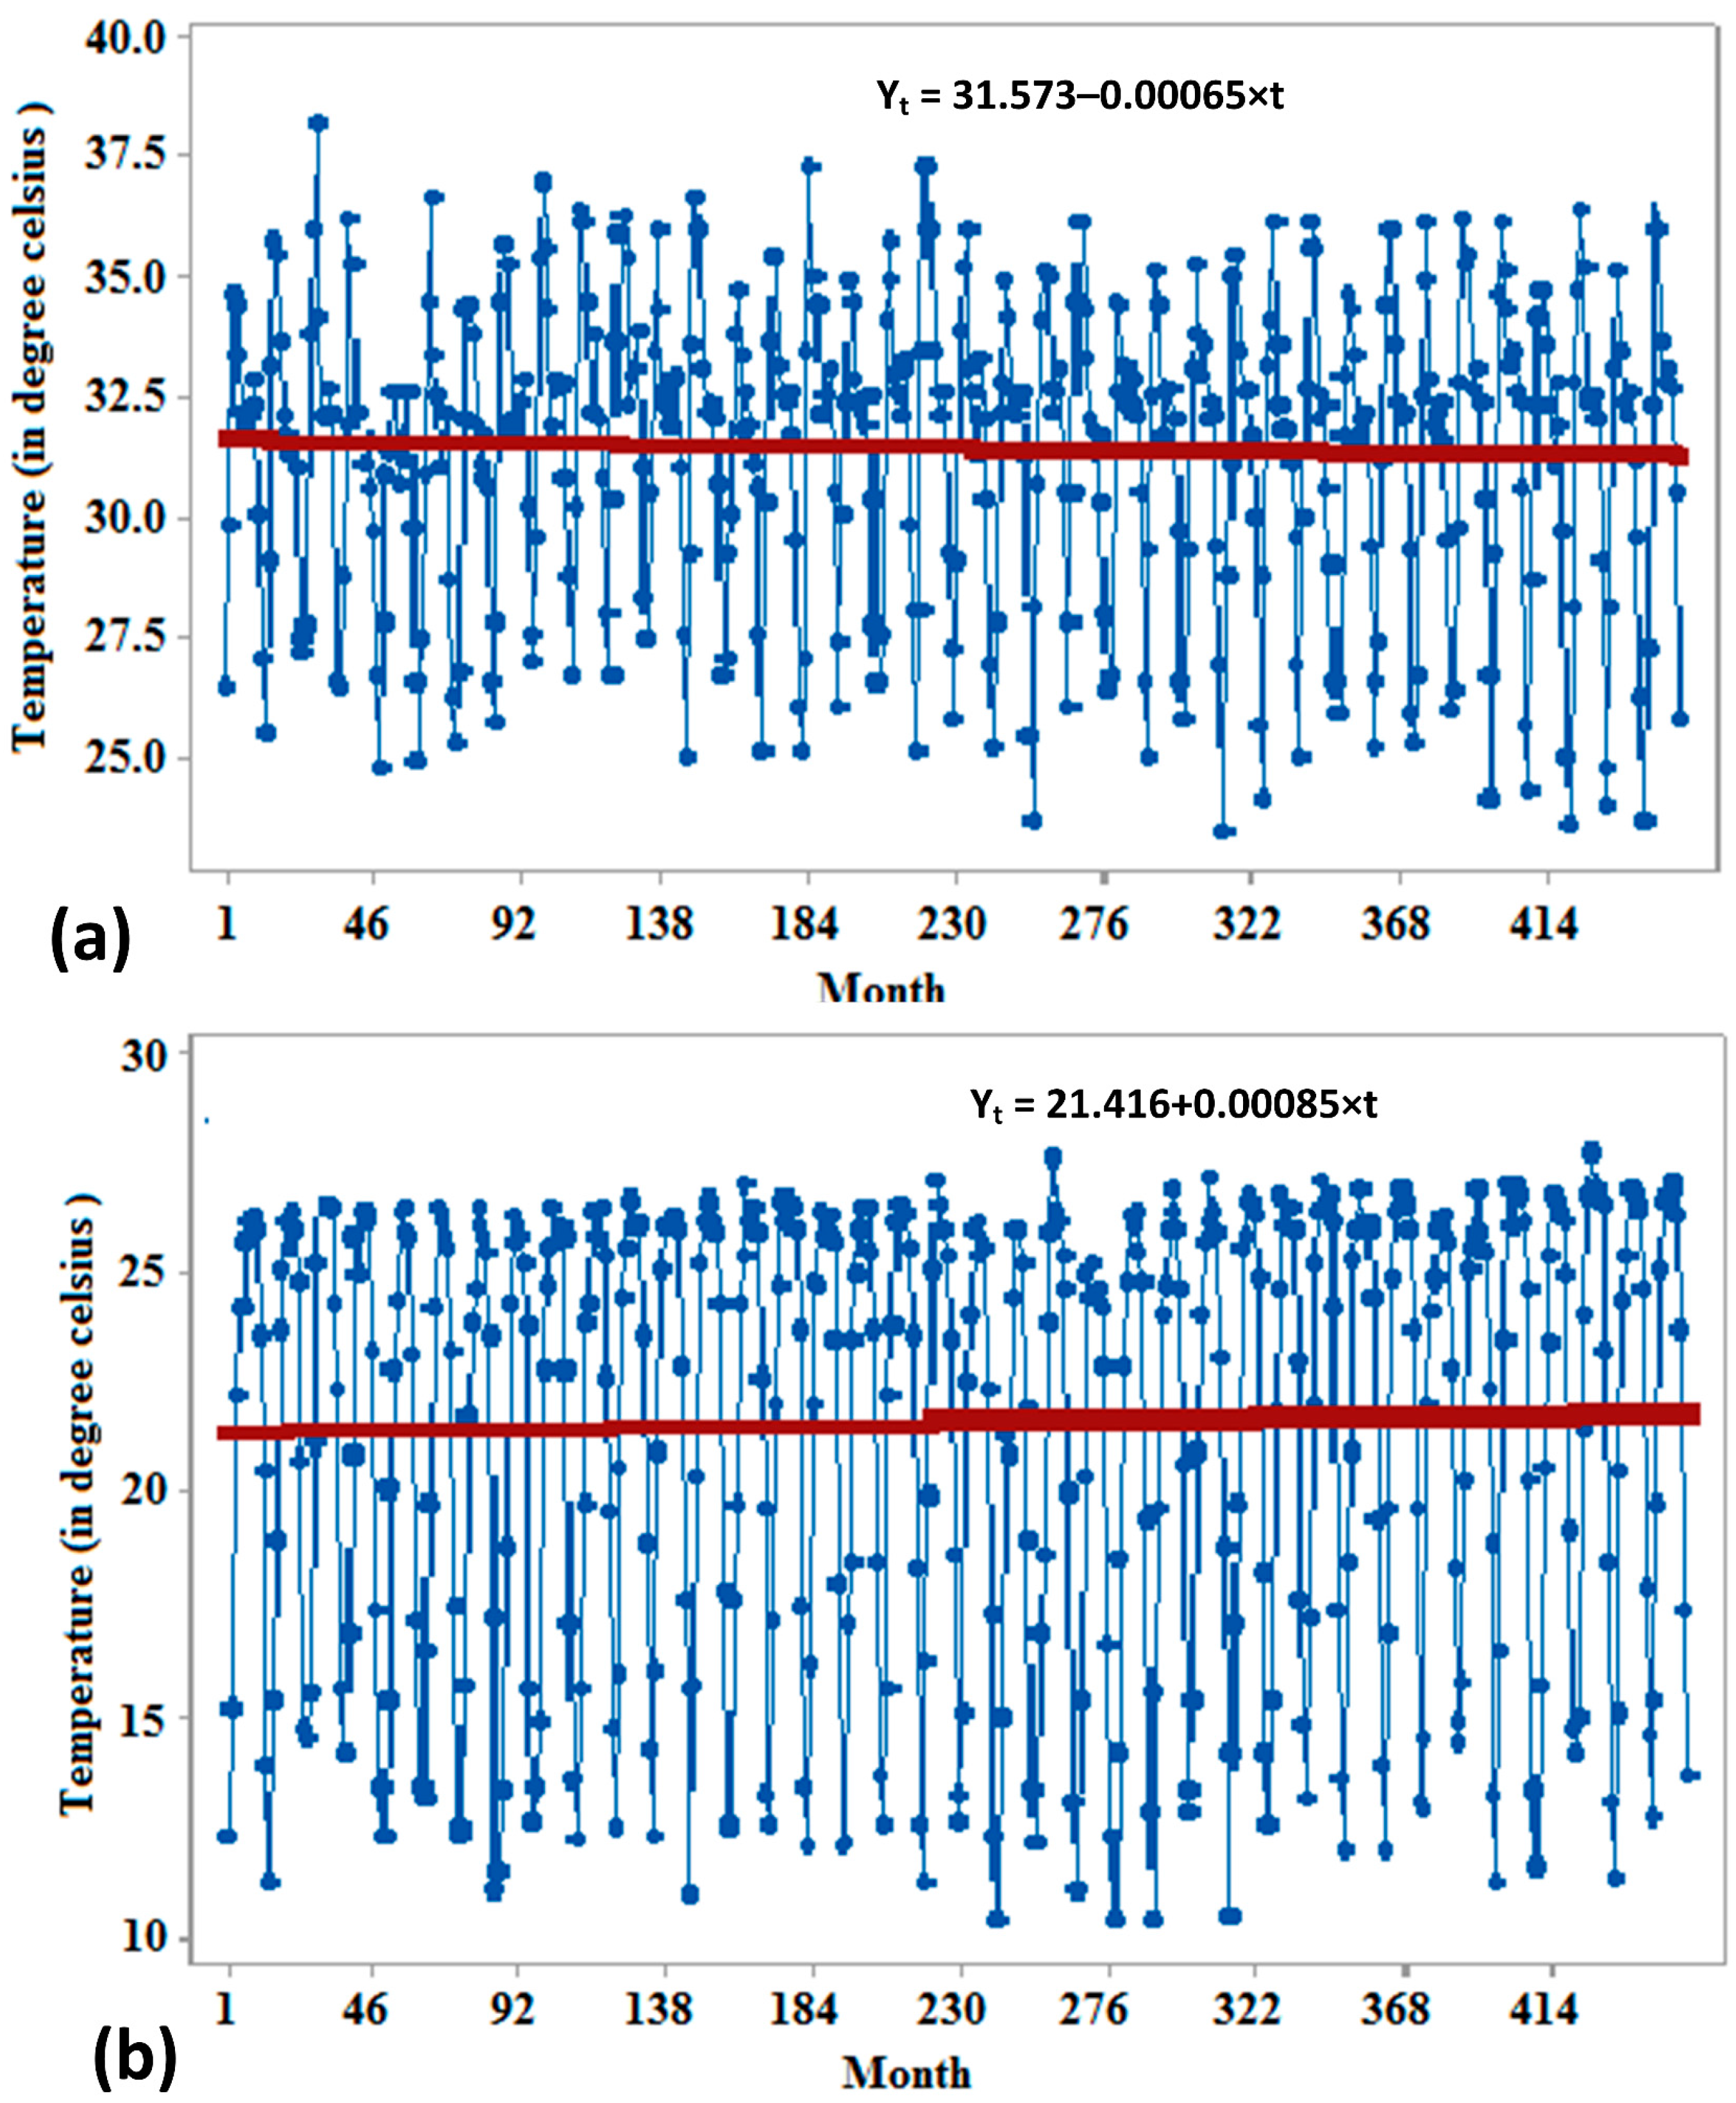
The results show that over the period 1977–2015 average maximum and minimum temperature have been increasing in the Sundarbans, while annual total rainfall has been decreasing. However, the trend of change was not similar for all the three sites. The historical trend of climatic variables, viz. average maximum and minimum temperature as well as the annual total rainfall pattern of all the three weather stations (Satkhira, Khulna and Bagherhat) that cover the Sundarbans, are shown in Figure 2, Figure 3 and Figure 4. During the study period, average maximum temperature shows an increasing trend in Khulna and Bagherhat, and a decreasing trend in Satkhira, while average minimum temperature shows an increasing trend for all the three stations. Annual total rainfall shows a decreasing trend in Satkhira and Khulna but an increasing trend in Bagherhat.
During the study period, the average maximum temperature at Satkhira has been decreasing at a rate of 0.0078 °C per year (Figure 2a), while the average minimum temperature has been increasing at a rate of 0.0102 °C per year (Figure 2b). The average maximum and minimum temperature at Khulna has been increasing at a rate of 0.0226 °C (Figure 3a) and 0.0220 °C (Figure 3b) per year, respectively. The average maximum and minimum temperature at Bagherhat has also been increasing at a rate of 0.0325 °C (Figure 4a) and 0.0043 °C (Figure 4b) per year, respectively. The total annual rainfall in Satkhira and Khulna has been decreasing at a rate of 0.1716 (Figure 2c) and 0.0204 mm (Figure 3c) per year, respectively. In contrast, the total annual rainfall in Bagherhat has been increasing at rate of 0.1200 mm per year (Figure 4c). However, the changing trend and the rate of change was not uniform during the study period between 1977 and 1989, 1989 and 2000 and 2000 and 2015. Rate of change for average maximum and minimum temperature and annual total rainfall for the different study periods and meteorological stations are shown in Table 1.
3.2. Satellite Image Analysis
Spatiotemporal changing pattern of mangrove species of the Sundarbans are shown for the years 1977, 1989, 2000 and 2015 in Figure 5 and Figure 6. According to our results, H. fomes and E. agallocha decreased by 10.7% and 4.8%, respectively, during the study period; whereas C. decandra, X. mekongensis and S. apelatala increased by 35.7%, 76.3% and 212.1%, respectively. However, the rate of change was not uniform either spatially or temporally (for instance see Table 2). For example H. fomes decreased by 1.9%, 0.4% and 0.08% per year in three different study sites Satkhira, Khulna and Bagherhat respectively during the period 1977–2015. E. agallocha showed a decreasing trend in Satkhira (0.8% per year) and an increasing trend in Khulna (0.6% per year) and Bagherhat (0.4% per year). C. decandra and X. mekongensis showed an increasing trend in Satkhira and Khulna and decreasing trend in Bagherhat. S. apelatala showed an increasing trend in all three study sites. It increased by 22.1%, 1.7% and 23.5% per year in Satkhira, Khulna and Bagherhat, respectively.
3.3. Relationship between Climate Variability and Mangrove Cover Change
The results of linear regression show climatic variables have a considerable impact on the coverage of H. fomes, S. apelatala and C. decandra; while coverage of the other two species (E. agallocha and X. mekongensis) are not much influenced by climatic variables (see Table 3 for details).
The dynamics of H. fomes and S. apelatala with response to average maximum temperature during 1977–2015 exhibited a strong relationship. The dynamics of H. fomes and S. apelatala were also strongly related to the rainfall pattern. In contrast, the dynamics of E. agallocha and X. mekongensis did not have a significant relationship with average maximum temperature or the rainfall pattern. C. decandra showed a weak relationship with average maximum temperature and rainfall pattern. The dynamics of all five mangrove species with response to average minimum temperature during 1977–2015 did not exhibit any significant relationship.
4. Discussion
An analysis of 38 years’ worth of climatological data (average maximum and minimum temperature and annual total rainfall considered for this study) shows variable trends of average maximum and minimum temperature and annual total rainfall in the Sundarbans mangrove forest in Bangladesh. Over the period 1977–2015, average maximum and minimum temperature have been increasing in the Sundarbans, while annual total rainfall has been decreasing. This local climate variability is likely to be highly important to understanding the future spatial distribution of mangrove ecosystems. Changes in regional temperature and rainfall are the two important factors, along with runoff, that affects the spatial distributions and mangrove species composition in the short term [5,8].
Noticeable relationships have been found between average maximum temperature and mangrove species dynamics in the Sundarbans during the study period. The changes in area under H. fomes has shown a negative relationship with response to average maximum temperature, while S. apelatala has shown a strong positive relationship. It has been observed that the area under H. fomes has decreased considerably with the increase of average maximum temperature. On the other hand, the area under S. apelatala has been increasing considerably in response to a rise in average maximum temperature. In the case of E. agallocha and X. mekongensis there is no significant relation between the dynamics of these mangrove species and the rise of average maximum temperature. Although the area under C. decandra has been increasing in response to the rise in average maximum temperature, only a weak relationship has been found between them. The relationship between the average maximum temperature and the dynamics of H. fomes, S. apelatala and C. decandra support Field [6] and Ellison [11], who argued that a rise in temperature can change mangrove species composition. No significant statistical relationship has been found between the average minimum temperature and dynamics of mangrove species in the study area.
A noticeable relationship has been found between annual total rainfall and mangrove species dynamics over the period 1977–2015. Area under H. fomes has decreased considerably with the decreasing total rainfall. On the other hand, an inverse relation has been found between annual total rainfall and S. apelatala, where area under S. apelatala increased with decreasing annual total rainfall. This situation is also similar for C. decandra, where it increased with decreasing annual total rainfall. No significant relationship has been found between the annual total rainfall and the dynamics of E. agallocha and X. mekongensis. The relationship between the dynamics of H. fomes, S. apelatala and C. decandra, and change in rainfall pattern support Field (1995) and Ellison (2000) who argued that rainfall patterns affect spatial distribution of mangrove species. This may also be related to higher supply of sediment, lower exposure to sulphates, increased salinity [5,6,11,15,45] and reduced discharge of freshwater flows from the upper stream [46]. In the present study, the decreasing trend of H. fomes and increasing trend of C. decandra support the suggestion that decreased rainfall and resulting higher salinity may be a factor that contributes to the observed change. In the case of E. agallocha and X. mekongensis, it should be noted that other factors, such as a ban on tree felling for newsprint paper mills, strong monitoring to reduce illegal use of timber and anthropogenic activities, may have played an influential role rather than climatic variables.
The impacts of climate variability in the Sundarbans would be considerably more critical in the future. Climate models predict a decrease in rainfall [3], which might further reduce fresh water flows and promote more water withdrawals for agriculture upstream. This reduction in freshwater inflows into the Sundarbans could be exacerbated by increased evapo-transpiration losses and water use on account of global warming, and this reduced freshwater flows would consequently further enhance the salinity levels in the Sundarbans [3]. In this situation, diseases such as die-back that is highly related to the level of salinity, will spread rapidly and affect the less salt tolerant species such as H. fomes in the Sundarbans. As a result of increasing salinity, less salt-tolerant mangrove species may be replaced by species that prefer habitats with high salinity [15]. This could change the existing mangrove species composition and affect the biodiversity of the forest.
Although this research has found a decreasing trend of H. fomes and increasing trend of S. apelatala and C. decandra in response to increasing average maximum and minimum temperatures and decreasing total annual rainfall in the Sundarbans, the rates of change varied between sites, whereas rainfall and temperature did not vary that much. Thus, changes in species composition are likely to also be related to factors outside the scope of this research, such as sea-level rise, sediment composition, salinity stress, site-specific characteristics, anthropogenic influences and reduced freshwater flows from upper stream. For instance, the imposed ban on felling E. agallocha trees has facilitated the increasing trend of this species over the period 2000–2015, which is totally opposite to its previous two periods [15]; similarly, coastal dynamics, more specifically accretion, also could have played an influential role in facilitating species composition change in the Sundarbans. Afforestation programs of salt tolerant S. apelatala trees in the newly accreted land could have played an important role in the increasing trend of this particular species, and overall species composition change during the study period; simultaneously, anthropogenic activities, such as over-exploitation of forest resources (specially the use of large woody trees like H. fomes and E. agallocha) for timber and other purposes, also could have played a vital role in the observed changes in the species composition [15], though these issues are not considered here. However, this paper finds interesting relationships between temperature, rainfall and mangrove species dynamics. A future study that incorporates these other factors could generate more realistic outcomes.
5. Conclusions
Mangrove ecosystems are complex in nature. For monitoring the impact of climate variability on this ecosystem, a multi-dimensional approach is a prerequisite. To understand the impact of climatic variables on mangroves, identification of relationships between climatic variables and the dynamics of mangrove species is essential. In this study, an effort was made to investigate the relationship between climatic variables and mangrove dynamics at species level in the Sundarbans of Bangladesh over a 38-year time period from 1977–2015. Some significant relationship have been found between temperature, rainfall and the dynamics of mangrove species.
The results reveal that over the study period, average maximum and minimum temperature have been increasing in the Sundarbans, while total annual rainfall has been decreasing. However, the trend of change was not similar for all three sites. During the study period, average maximum temperature has shown an increasing trend in Khulna and Bagherhat, and a decreasing trend in Satkhira. Similarly, average minimum temperature has shown an increasing trend for all three stations. Annual total rainfall has shown a decreasing trend in Satkhira and Khulna and an increasing trend in Bagherhat.
Five major mangrove species have been identified in the study area, which are H. fomes, E. agallocha, C. decandra, X. mekongensis and S. apelatala. According to our results, H. fomes and E. agallocha decreased by 10.7% and 4.8%, respectively, during the study period; whereas C. decandra, X. mekongensis and S. apelatala increased by 35.7%, 76.3% and 212.1%, respectively.
Linear regression results highlight a significant relationship between climate variables (maximum temperature and rainfall) and dynamics of mangrove species (especially H. fomes, S. apelatala and C. decandra) in the Sundarbans mangrove forest in Bangladesh. Over the study period, a strong relationship was found between the dynamics of H. fomes and S. apelatala with temperature and rainfall, while C. decandra showed a weak relationship. In contrast, no significant relationship has been found between the dynamics of E. agallocha and X. mekongensis and temperature or the rainfall pattern.
Identifying the importance of temperature and rainfall provides one dimension for assessing the impacts of climatic variables on mangrove species in the context of the vulnerability as a result of climate change. Continuous assessment is important to understand the impact of climatic variables on mangrove forests as well as for the development of adaptation strategies for the forest. The results obtained in this study could provide some invaluable insights for the development of proper adaptation strategies in the future.
Author Contributions
M.K.G., L.K. and C.R. conceived and designed the experiments; M.K.G. performed the experiments and analyzed the data; M.K.G. wrote the paper, with support from L.K. and C.R. L.K. edited the paper.
Conflicts of Interest
The authors declare no conflict of interest.
References
- Ahmed, A.U.; Alam, M. Development of climate change scenarios with general circulation models. In Vulnerability and Adaptation to Climate Change for Bangladesh; Huq, S., Karim, Z., Asaduzzaman, M., Mahtab, F., Eds.; Springer: Dordrecht, The Netherlands, 1999; pp. 13–20. [Google Scholar]
- Mahadevia, K.; Vikas, M. Climate Change-Impact on the Sundarbans. Available online: https://scholar.google.com.au/scholar?q=Climate+change-impact+on+the+Sundarbans&btnG=&hl=en&as_sdt=0%2C5 (accessed on 12 December 2016).
- Agrawala, S.; Ota, T.; Ahmed, A.U.; Smith, J.; Van Aalst, M. Development and Climate Change in Bangladesh: Focus on Coastal Flooding and the Sundarbans; Organization for Economic Co-operation and Development (OECOD): Paris, France, 2003. [Google Scholar]
- Gilman, E.L.; Ellison, J.; Duke, N.C.; Field, C. Threats to mangroves from climate change and adaptation options: A review. Aqua. Botany 2008, 89, 237–250. [Google Scholar] [CrossRef]
- Eslami-Andargoli, L.; Dale, P.; Sipe, N.; Chaseling, J. Mangrove expansion and rainfall patterns in Moreton Bay, southeast Queensland, Australia. Estuar. Coast. Shelf Sci. 2009, 85, 292–298. [Google Scholar] [CrossRef]
- Field, C.D. Impact of expected climate change on mangroves. Hydrobiologia 1995, 295, 75–81. [Google Scholar] [CrossRef]
- Gilman, E. Assessing and managing coastal ecosystem response to projected relative sea-level rise and climate change. In Proceedings of the Prepared for the International Research Foundation for Development Forum on Small Island Developing States: Challenges, Prospects and International Cooperation for Sustainable Development. Contribution to the Barbados, Port Louis, Mauritius, 10–14 January 2005; p. 28. [Google Scholar]
- Snedaker, S.C. Mangroves and climate change in the Florida and Caribbean region: Scenarios and hypotheses. Hydrobiologia 1995, 295, 43–49. [Google Scholar] [CrossRef]
- Houghton, J.T.; Ding, Y.; Griggs, D.J.; Noguer, M.; van der Linden, P.J.; Dai, X.; Maskell, K.; Johnson, C. Climate Change 2001: The Scientific Basis; Cambridge University Press: Cambridge, UK; New York, NY, USA, 2001; p. 881. [Google Scholar]
- Duke, N.; Ball, M.; Ellison, J. Factors influencing biodiversity and distributional gradients in mangroves. Glob. Ecol. Biogeogr. Lett. 1998, 7, 27–47. [Google Scholar] [CrossRef]
- Ellison, J.C. How South Pacific mangroves may respond to predicted climate change and sea-level rise. In Climate Change in the South Pacific: Impacts and Responses in Australia, New Zealand, and Small Island States; Gillespie, A., Burns, W., Eds.; Springer: Dordrecht, The Netherlands, 2000; pp. 289–300. [Google Scholar]
- Gilman, E.; Ellison, J.; Coleman, R. Assessment of mangrove response to projected relative sea-level rise and recent historical reconstruction of shoreline position. Environ. Monitor. Assess. 2007, 124, 105–130. [Google Scholar] [CrossRef] [PubMed]
- Lovelock, C.E.; Ellison, J. Vulnerability of mangroves and tidal wetlands of the Great Barrier Reef to climate change. In Climate Change and the Great Barrier Reef: A Vulnerability Assessment; Johnson, J.E., Marshall, P.A., Eds.; Great Barrier Reef marine park authority and Australian Greenhouse Office: Townsville, Australia, 2007; pp. 237–269. [Google Scholar]
- Solomon, S. Climate Change 2007—The Physical Science Basis; Working Group I Contribution to the Fourth Assessment Report of the IPCC; Cambridge University Press: Cambridge, UK, 2007; Volume 4. [Google Scholar]
- Ghosh, M.K.; Kumar, L.; Roy, C. Mapping Long-Term Changes in Mangrove Species Composition and Distribution in the Sundarbans. Forests 2016, 7, 305. [Google Scholar] [CrossRef]
- McTainsh, G.; Iles, B.; Saffigna, P. Spatial and Temporal Patterns of Mangroves at Oyster Point Bay, South East Queensland, 1944–1983; Royal Society of Queensland: Brisbane, Australia, 1986; pp. 83–91. [Google Scholar]
- Saintilan, N.; Williams, R.J. Mangrove transgression into saltmarsh environments in south-east Australia. Glob. Ecol. Biogeogr. 1999, 8, 117–124. [Google Scholar] [CrossRef]
- Saintilan, N.; Wilton, K. Changes in the distribution of mangroves and saltmarshes in Jervis Bay, Australia. Wetl. Ecol. Manag. 2001, 9, 409–420. [Google Scholar] [CrossRef]
- McKee, K.L. Global Change Impacts on Mangrove Ecosystems; U.S Department of Interior, U.S. Geological Survey, U.S.: Reston, VA, USA, 2004.
- Jagtap, T.G.; Nagle, V.L. Response and adaptability of mangrove habitats from the Indian subcontinent to changing climate. AMBIO A J. Hum. Environ. 2007, 36, 328–334. [Google Scholar] [CrossRef]
- Iftekhar, M. Forestry in Bangladesh: An overview. J. For. 2006, 104, 148–153. [Google Scholar]
- Bhowmik, A.K.; Cabral, P. Cyclone Sidr Impacts on the Sundarbans Floristic Diversity. Earth Sci. Res. 2013, 2, 62. [Google Scholar] [CrossRef]
- Chowdhury, M.Q.; De Ridder, M.; Beeckman, H. Climatic Signals in Tree Rings of Heritiera fomes Buch.-Ham. in the Sundarbans, Bangladesh. PLoS ONE 2016, 11, e0149788. [Google Scholar] [CrossRef] [PubMed]
- Spalding, M. World Atlas of Mangroves; Earthscan: London, UK, 2010; p. 319. [Google Scholar]
- Ghosh, A.; Schmidt, S.; Fickert, T.; Nüsser, M. The Indian Sundarban Mangrove Forests: History, Utilization, Conservation Strategies and Local Perception. Diversity 2015, 7, 149–169. [Google Scholar] [CrossRef]
- Iftekhar, M.; Islam, M. Managing mangroves in Bangladesh: A strategy analysis. J. Coast. Conserv. 2004, 10, 139–146. [Google Scholar] [CrossRef]
- Giri, C.; Pengra, B.; Zhu, Z.; Singh, A.; Tieszen, L.L. Monitoring mangrove forest dynamics of the Sundarbans in Bangladesh and India using multi-temporal satellite data from 1973 to 2000. Estuar. Coast. Shelf Sci. 2007, 73, 91–100. [Google Scholar] [CrossRef]
- Green, E.P.; Clark, C.D.; Mumby, P.J.; Edwards, A.J.; Ellis, A. Remote sensing techniques for mangrove mapping. Int. J. Remote Sens. 1998, 19, 935–956. [Google Scholar] [CrossRef]
- Hirano, A.; Madden, M.; Welch, R. Hyperspectral image data for mapping wetland vegetation. Wetlands 2003, 23, 436–448. [Google Scholar] [CrossRef]
- Kovacs, J.M. Assessing mangrove use at the local scale. Landsca. Urban Plan. 1999, 43, 201–208. [Google Scholar] [CrossRef]
- Kovacs, J.M.; Wang, J.; Flores-Verdugo, F. Mapping mangrove leaf area index at the species level using IKONOS and LAI-2000 sensors for the Agua Brava Lagoon, Mexican Pacific. Estuar. Coast. Shelf Sci. 2005, 62, 377–384. [Google Scholar] [CrossRef]
- Sader, S.A.; Ahl, D.; Liou, W.-S. Accuracy of Landsat-TM and GIS rule-based methods for forest wetland classification in Maine. Remote Sens. Environ. 1995, 53, 133–144. [Google Scholar] [CrossRef]
- Giri, S.; Mukhopadhyay, A.; Hazra, S.; Mukherjee, S.; Roy, D.; Ghosh, S.; Ghosh, T.; Mitra, D. A study on abundance and distribution of mangrove species in Indian Sundarban using remote sensing technique. J. Coast. Conserv. 2014, 18, 359–367. [Google Scholar] [CrossRef]
- Long, B.G.; Skewes, T.D. A technique for mapping mangroves with Landsat TM satellite data and geographic information system. Estuar. Coast. Shelf Sci. 1996, 43, 373–381. [Google Scholar] [CrossRef]
- Franklin, J. Discrimination of tropical vegetation types using SPOT multispectral data. Geocarto Int. 1993, 8, 57–63. [Google Scholar] [CrossRef]
- Pasqualini, V.; Iltis, J.; Dessay, N.; Lointier, M.; Guelorget, O.; Polidori, L. Mangrove mapping in North-Western Madagascar using SPOT-XS and SIR-C radar data. In Diversity and Function in Mangrove Ecosystems; Dodd, R.S., Ed.; Springer: Dordrecht, The Netherlands, 1999; pp. 127–133. [Google Scholar]
- Li, S.; Wang, H.; Jiang, X. Application of CBERS-1 CCD in the mangrove Remote Sensing Survey. Mar. Sci. Bull. 2003, 22, 30–35. [Google Scholar]
- Vaiphasa, C.; Skidmore, A.K.; de Boer, W.F. A post-classifier for mangrove mapping using ecological data. ISPRS J. Photogramm. Remote Sens. 2006, 61, 1–10. [Google Scholar] [CrossRef]
- Wang, L.; Sousa, W.P.; Gong, P.; Biging, G.S. Comparison of IKONOS and QuickBird images for mapping mangrove species on the Caribbean coast of Panama. Remote Sens. Environ. 2004, 91, 432–440. [Google Scholar] [CrossRef]
- Wang, L.; Sousa, W.; Gong, P. Integration of object-based and pixel-based classification for mapping mangroves with IKONOS imagery. Int. J. Remote Sens. 2004, 25, 5655–5668. [Google Scholar] [CrossRef]
- Kirui, K.B.; Kairo, J.G.; Bosire, J.; Viergever, K.M.; Rudra, S.; Huxham, M.; Briers, R.A. Mapping of mangrove forest land cover change along the Kenya coastline using Landsat imagery. Ocean Coast. Manag. 2013, 83, 19–24. [Google Scholar] [CrossRef]
- Myint, S.W.; Giri, C.P.; Wang, L.; Zhu, Z.; Gillette, S.C. Identifying mangrove species and their surrounding land use and land cover classes using an object-oriented approach with a lacunarity spatial measure. GISci. Remote Sens. 2008, 45, 188–208. [Google Scholar] [CrossRef]
- Foody, G.M. Thematic map comparison. Photogramm. Eng. Remote Sens. 2004, 70, 627–633. [Google Scholar] [CrossRef]
- Foody, G.M. Harshness in image classification accuracy assessment. Int. J. Remote Sens. 2008, 29, 3137–3158. [Google Scholar] [CrossRef]
- McKee, K.L. Soil physicochemical patterns and mangrove species distribution—Reciprocal effects? J. Ecol. 1993, 477–487. [Google Scholar] [CrossRef]
- Islam, S.N.; Gnauck, A. Mangrove wetland ecosystems in Ganges-Brahmaputra delta in Bangladesh. Front. Earth Sci. China 2008, 2, 439–448. [Google Scholar] [CrossRef]
Figure 1.
Location of the study area (True color composite image).
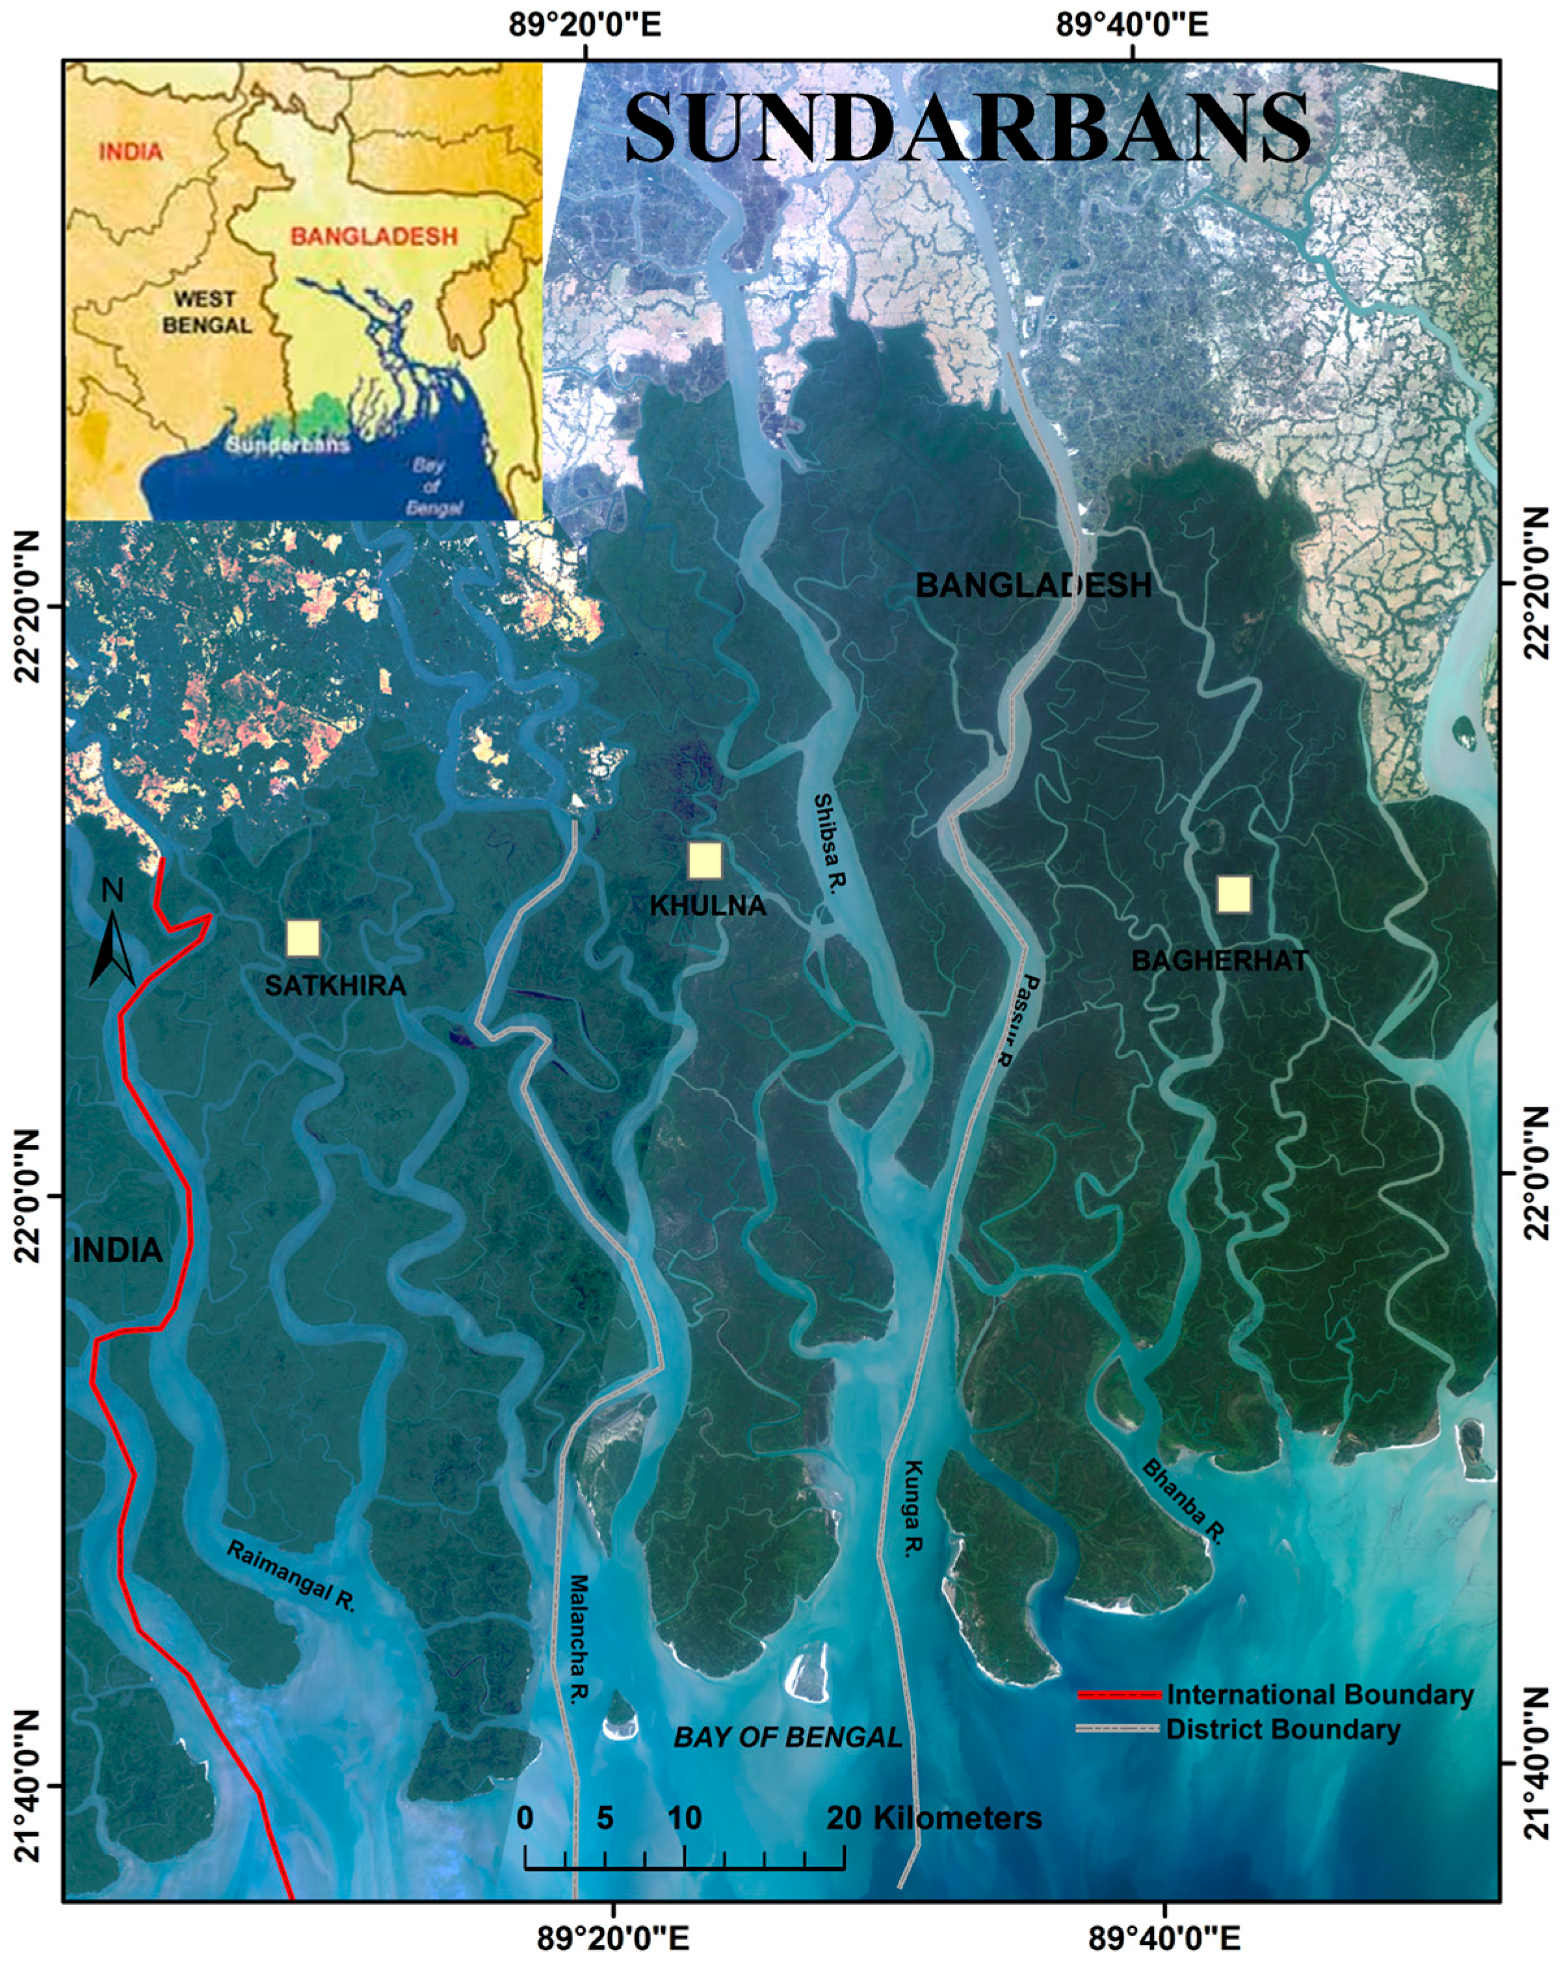
Figure 2.
Trend analysis for climatic variables over Satkhira during the period 1977–2015, (a) maximum temperature; (b) minimum temperature and (c) rainfall.
Figure 2.
Trend analysis for climatic variables over Satkhira during the period 1977–2015, (a) maximum temperature; (b) minimum temperature and (c) rainfall.

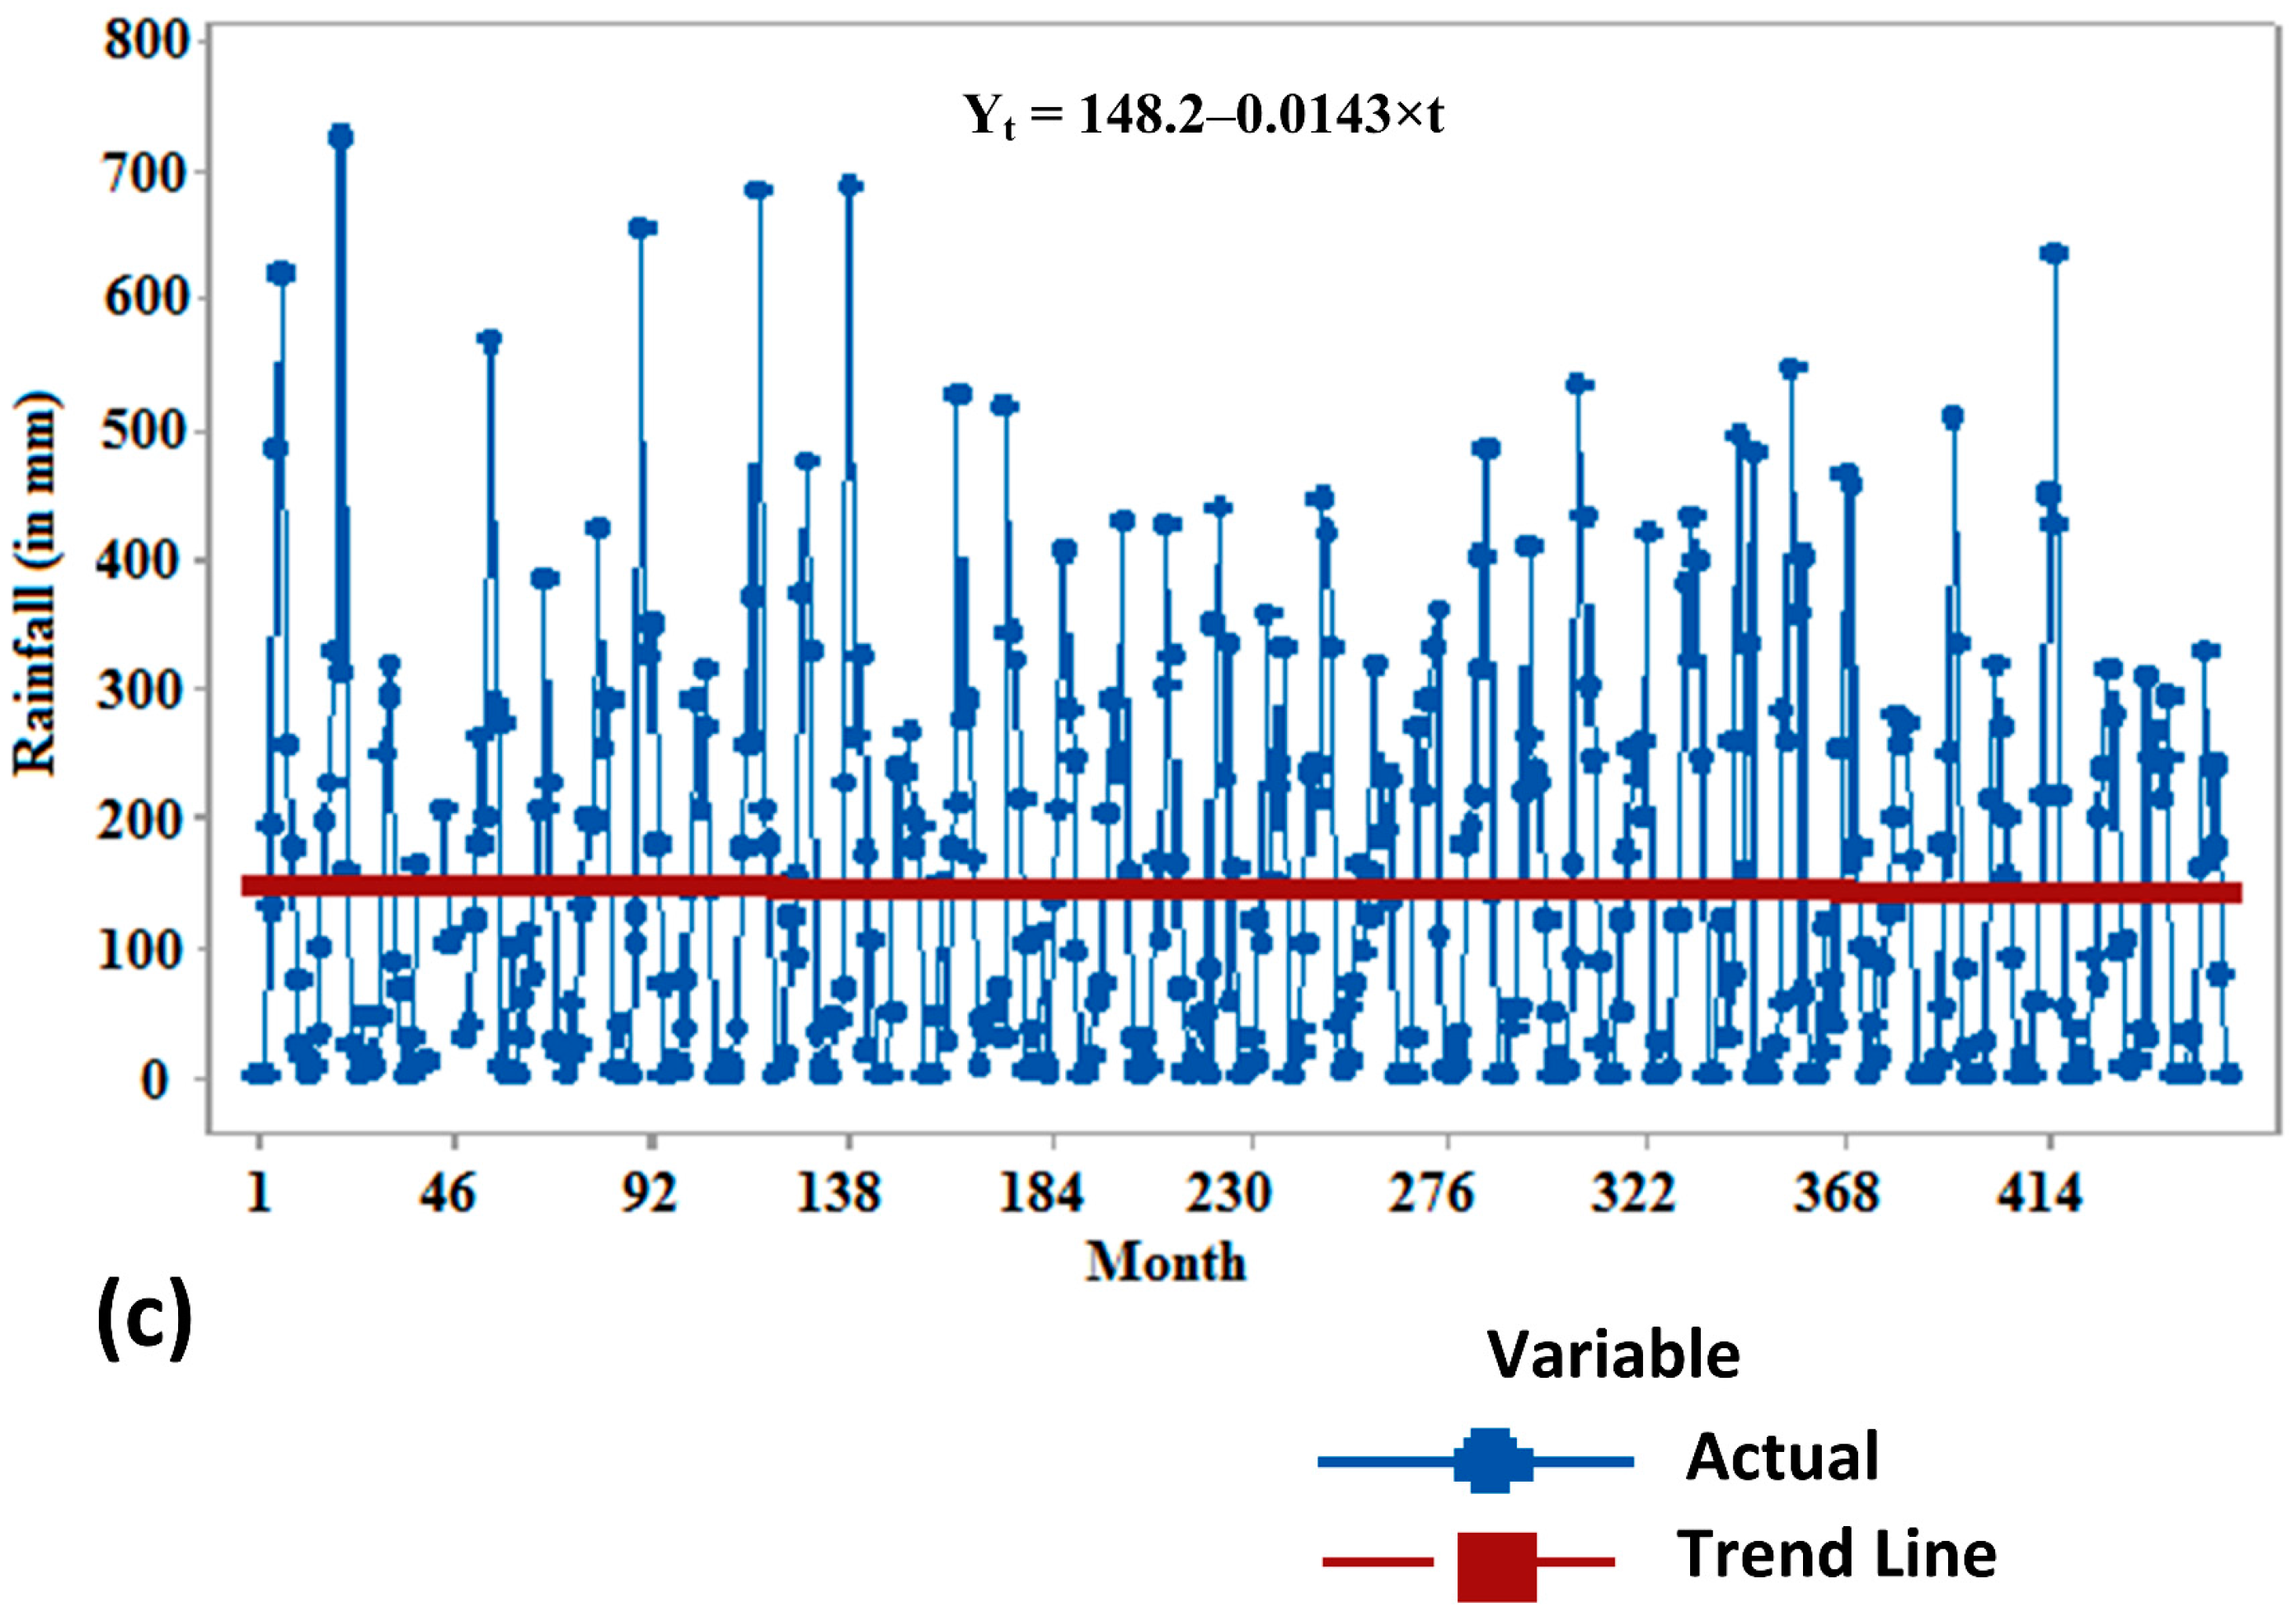
Figure 3.
Trend analysis for climatic variables over Khulna during the period 1977–2015, (a) maximum temperature; (b) minimum temperature and (c) rainfall.
Figure 3.
Trend analysis for climatic variables over Khulna during the period 1977–2015, (a) maximum temperature; (b) minimum temperature and (c) rainfall.
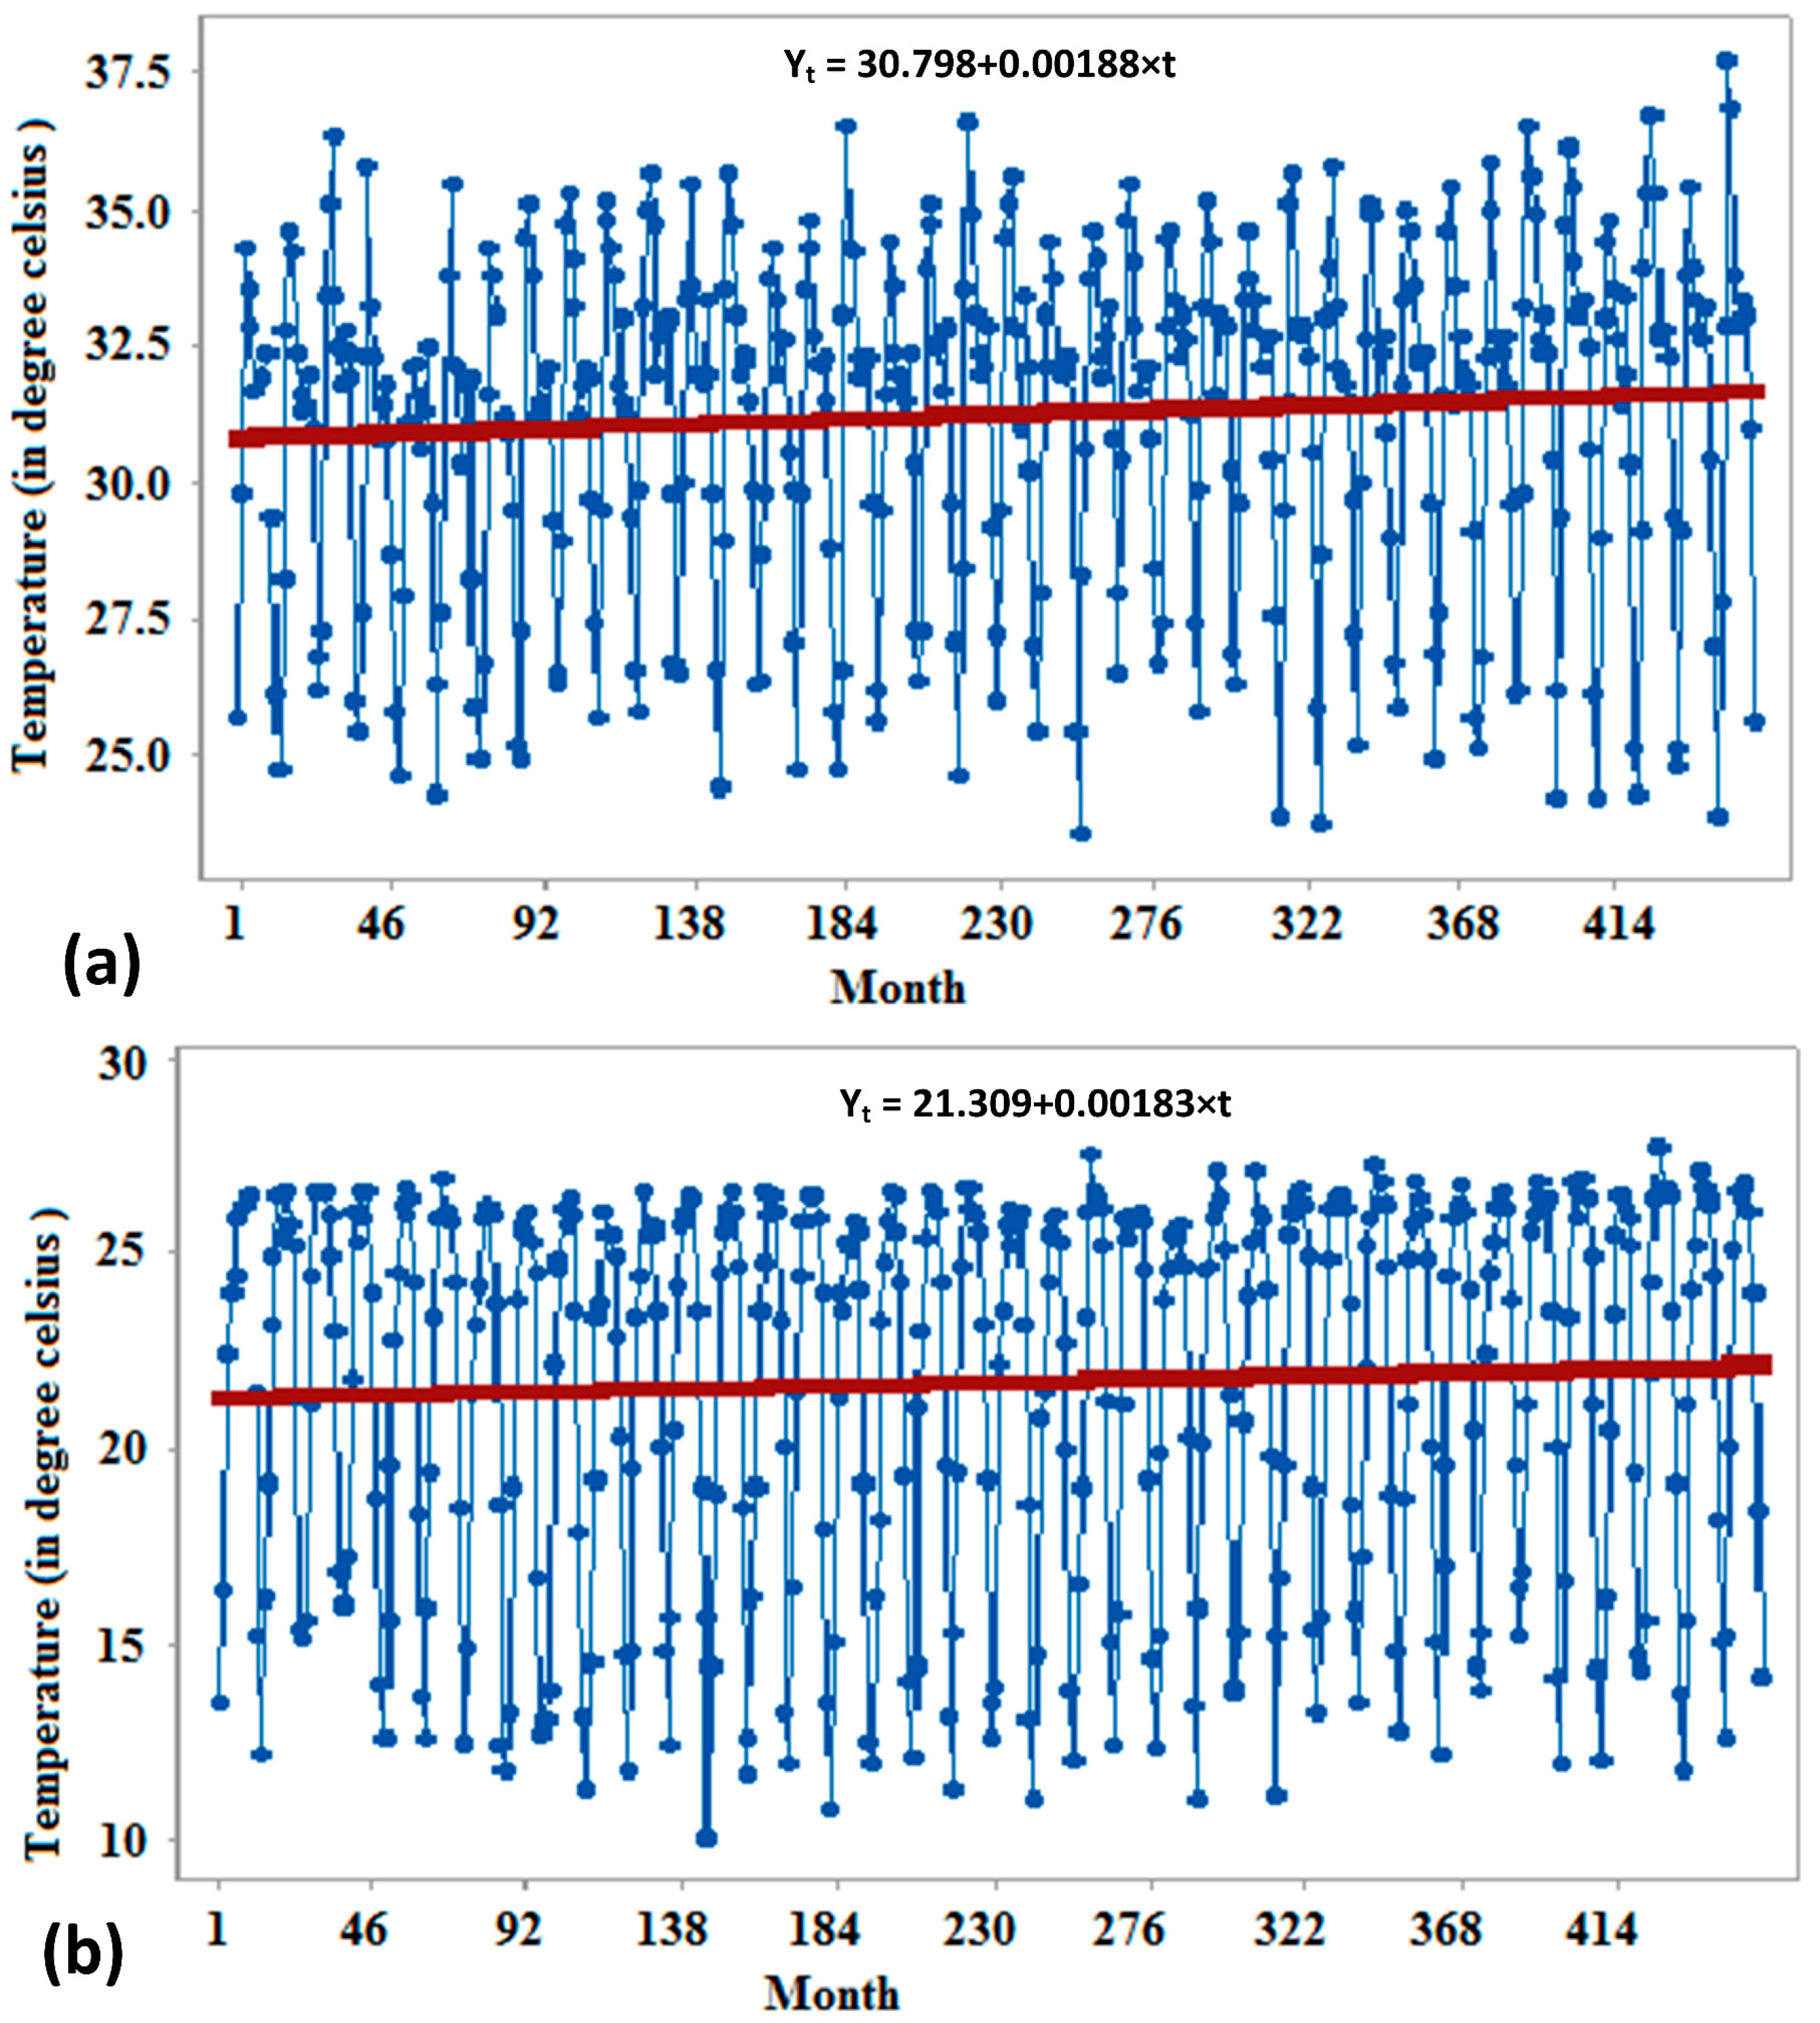
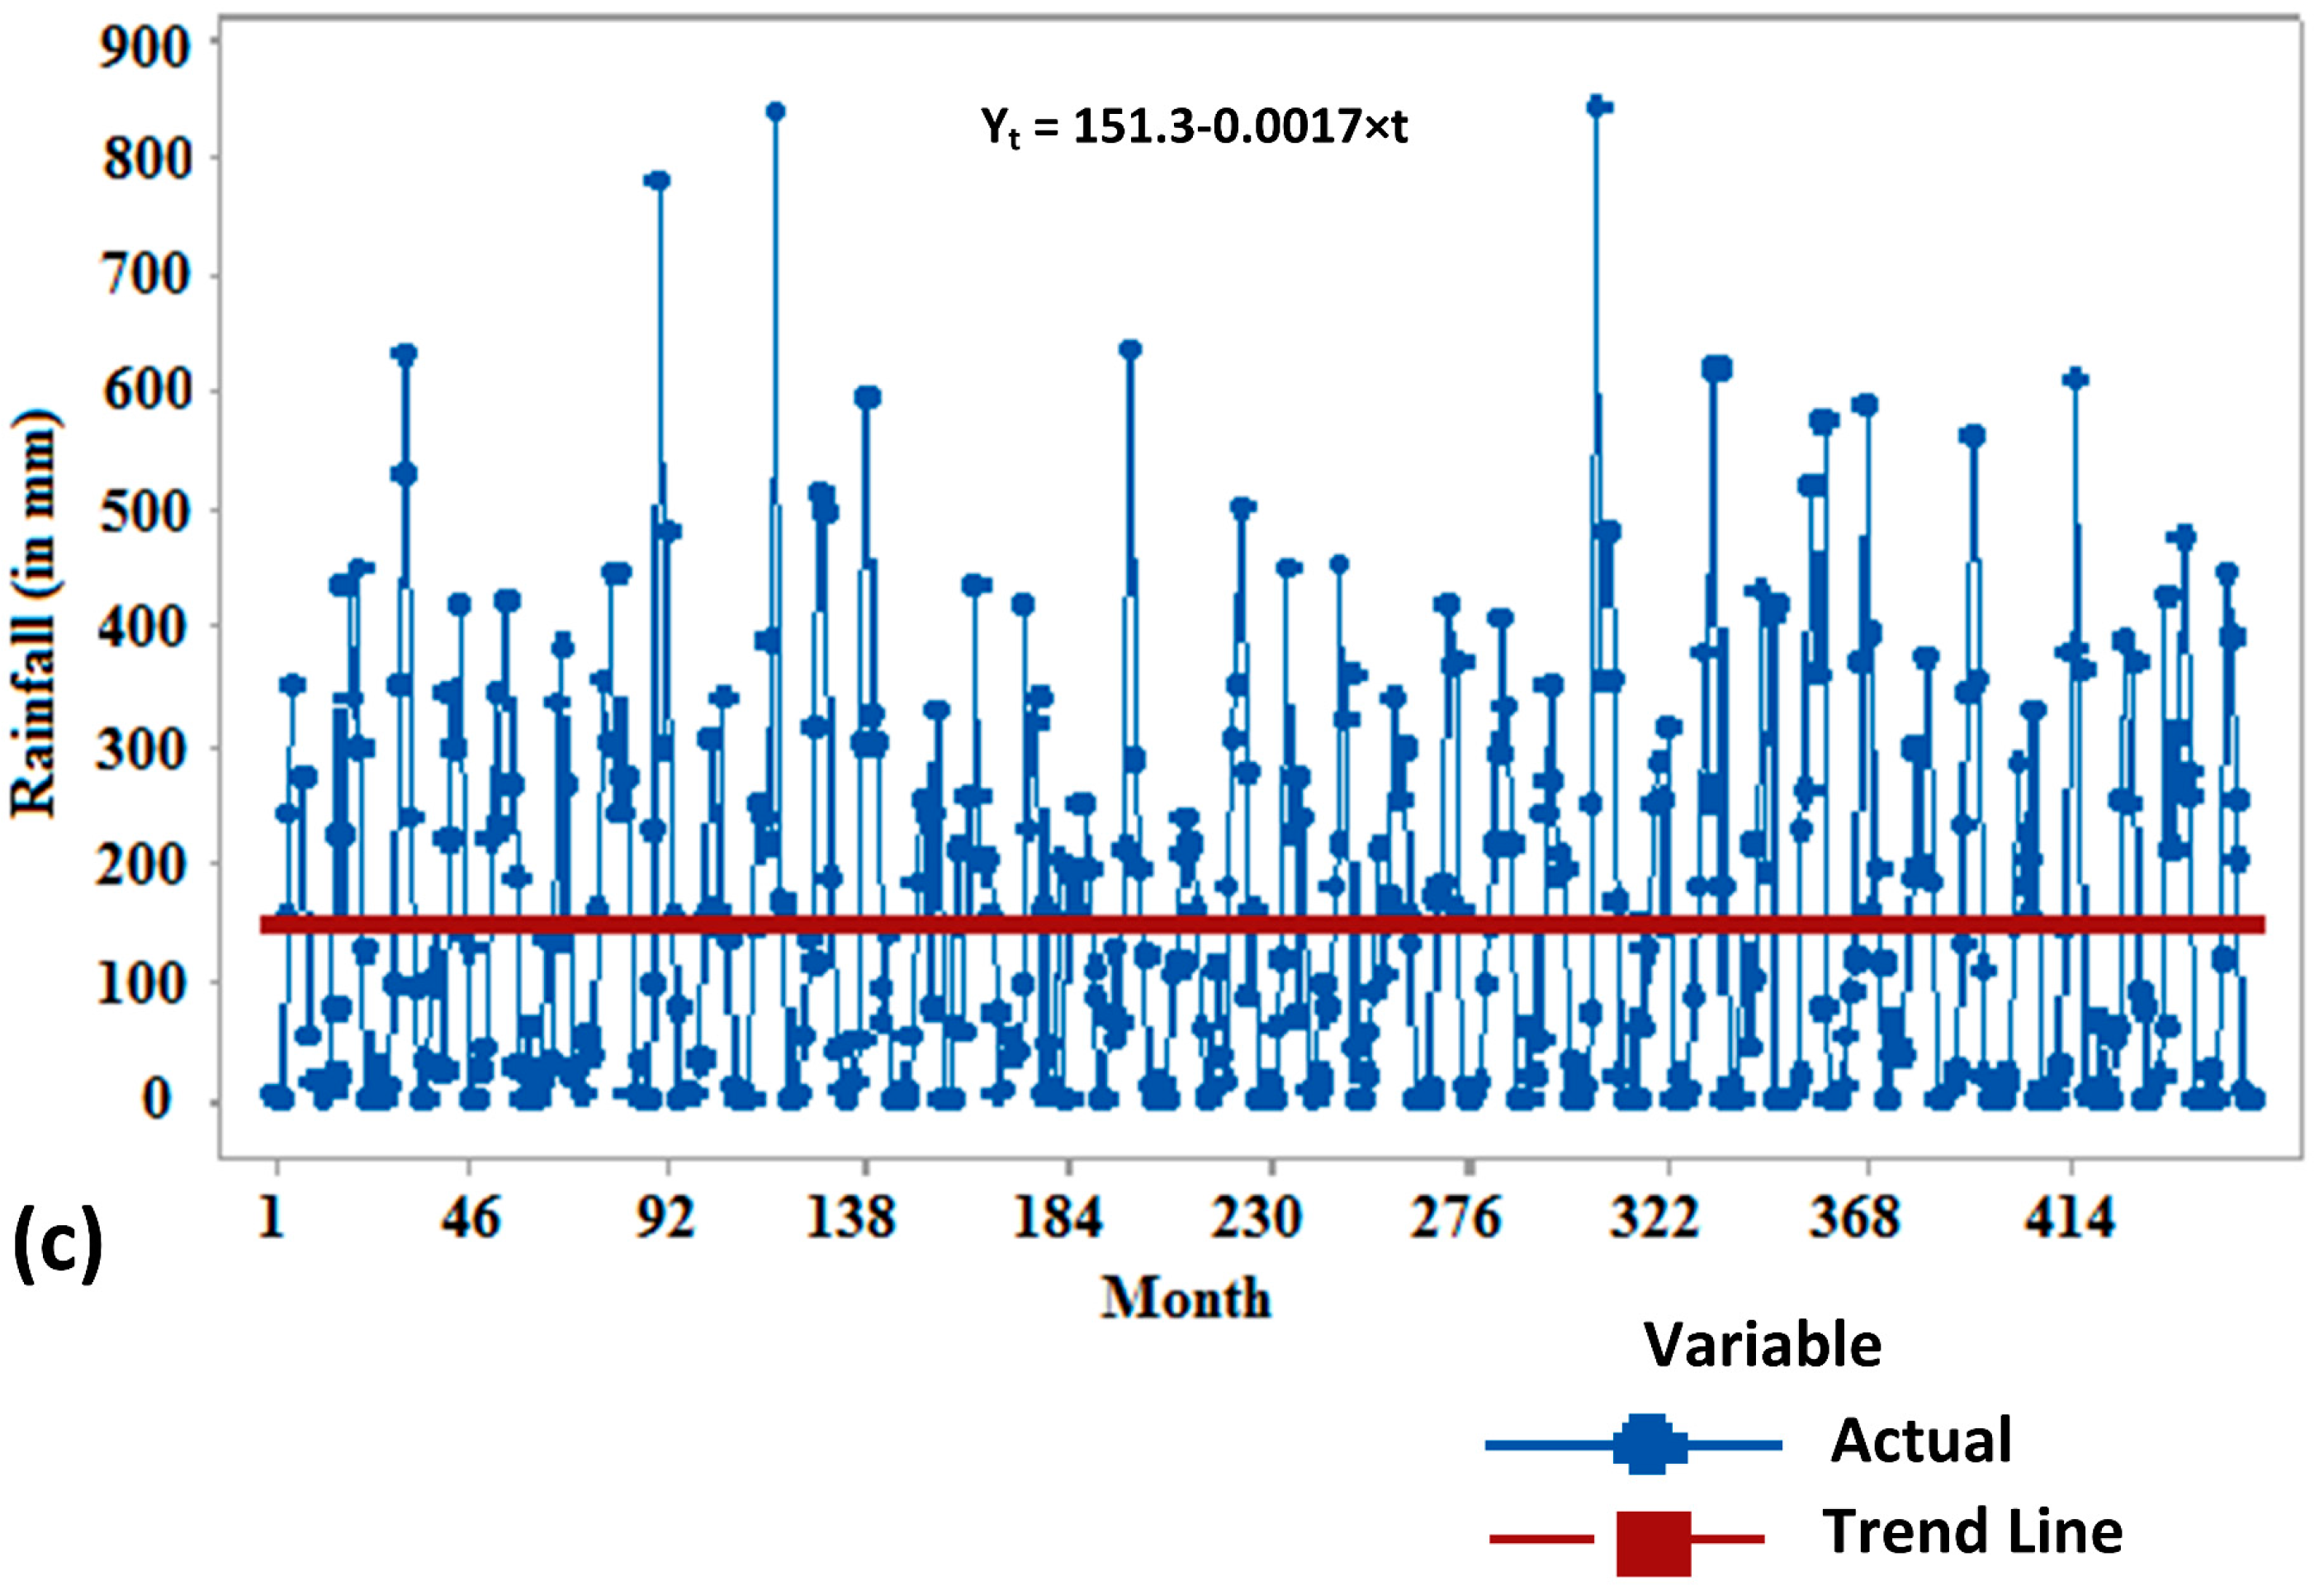
Figure 4.
Trend analysis for climatic variables over Bagherhat during the period 1989–2015, (a) maximum temperature, (b) minimum temperature and (c) rainfall.
Figure 4.
Trend analysis for climatic variables over Bagherhat during the period 1989–2015, (a) maximum temperature, (b) minimum temperature and (c) rainfall.
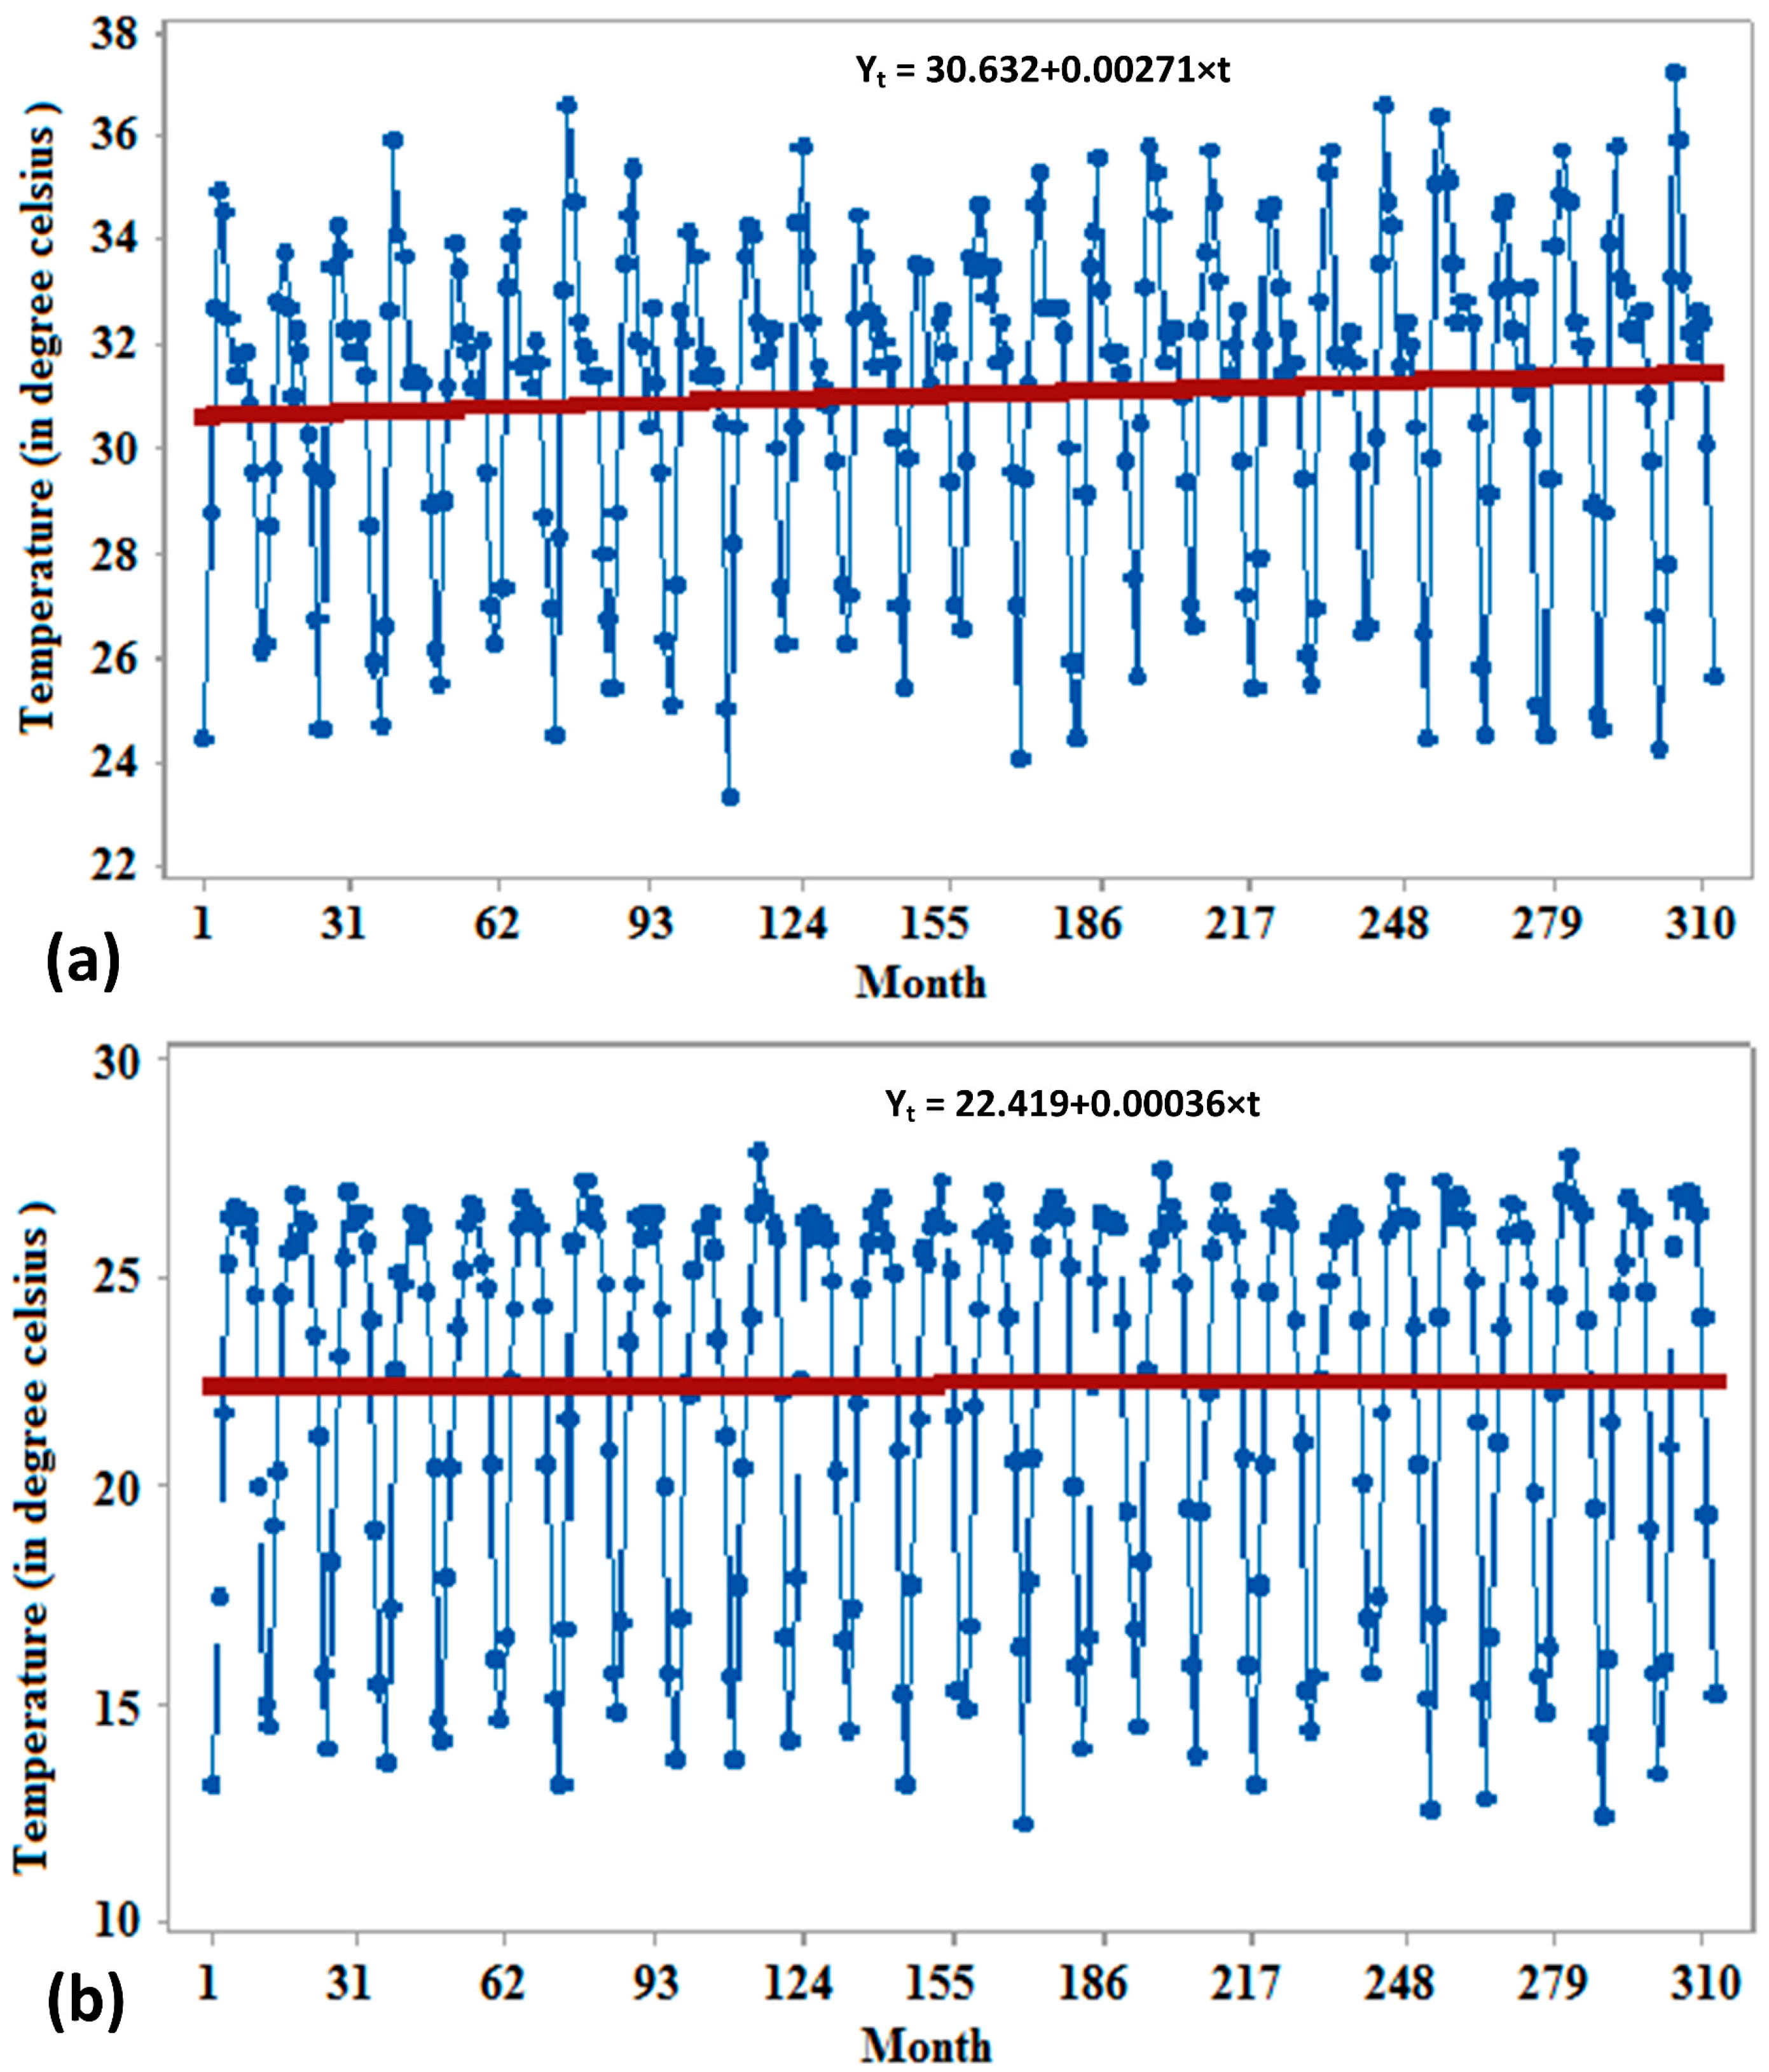
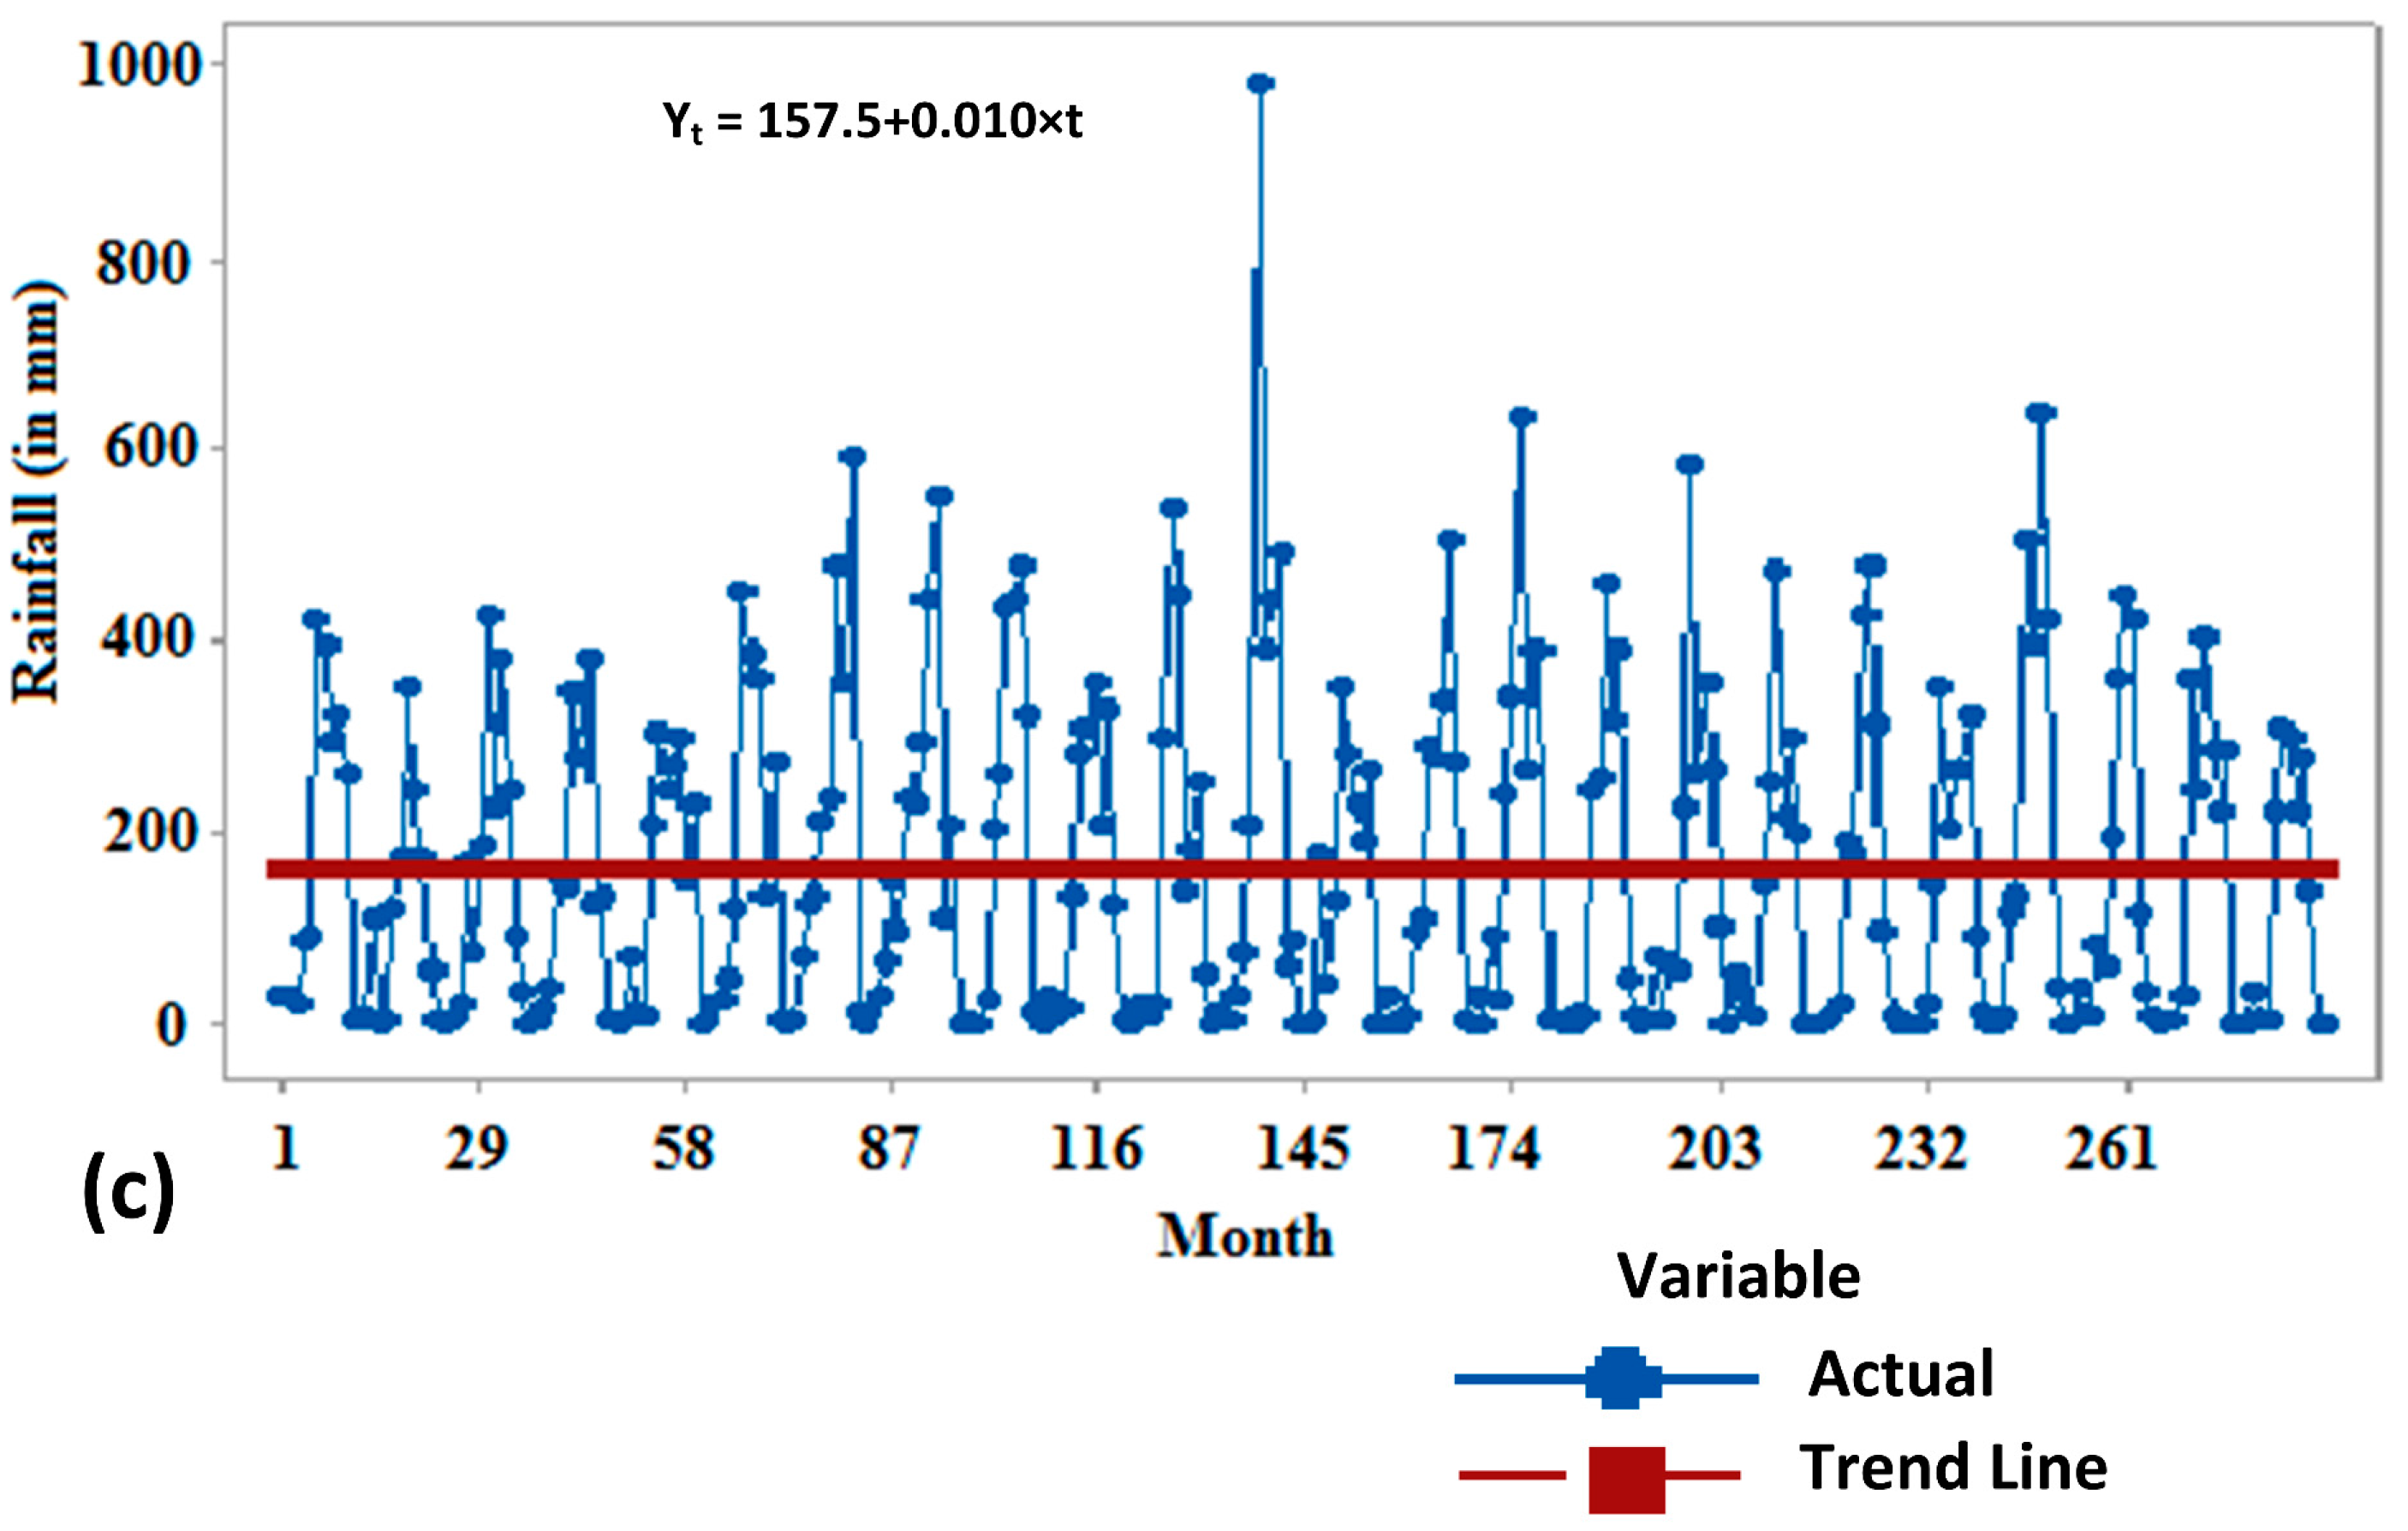
Figure 5.
Changing pattern of mangrove species composition in the Sundarbans mangrove forest, Bangladesh between 1977 and 2015.
Figure 5.
Changing pattern of mangrove species composition in the Sundarbans mangrove forest, Bangladesh between 1977 and 2015.
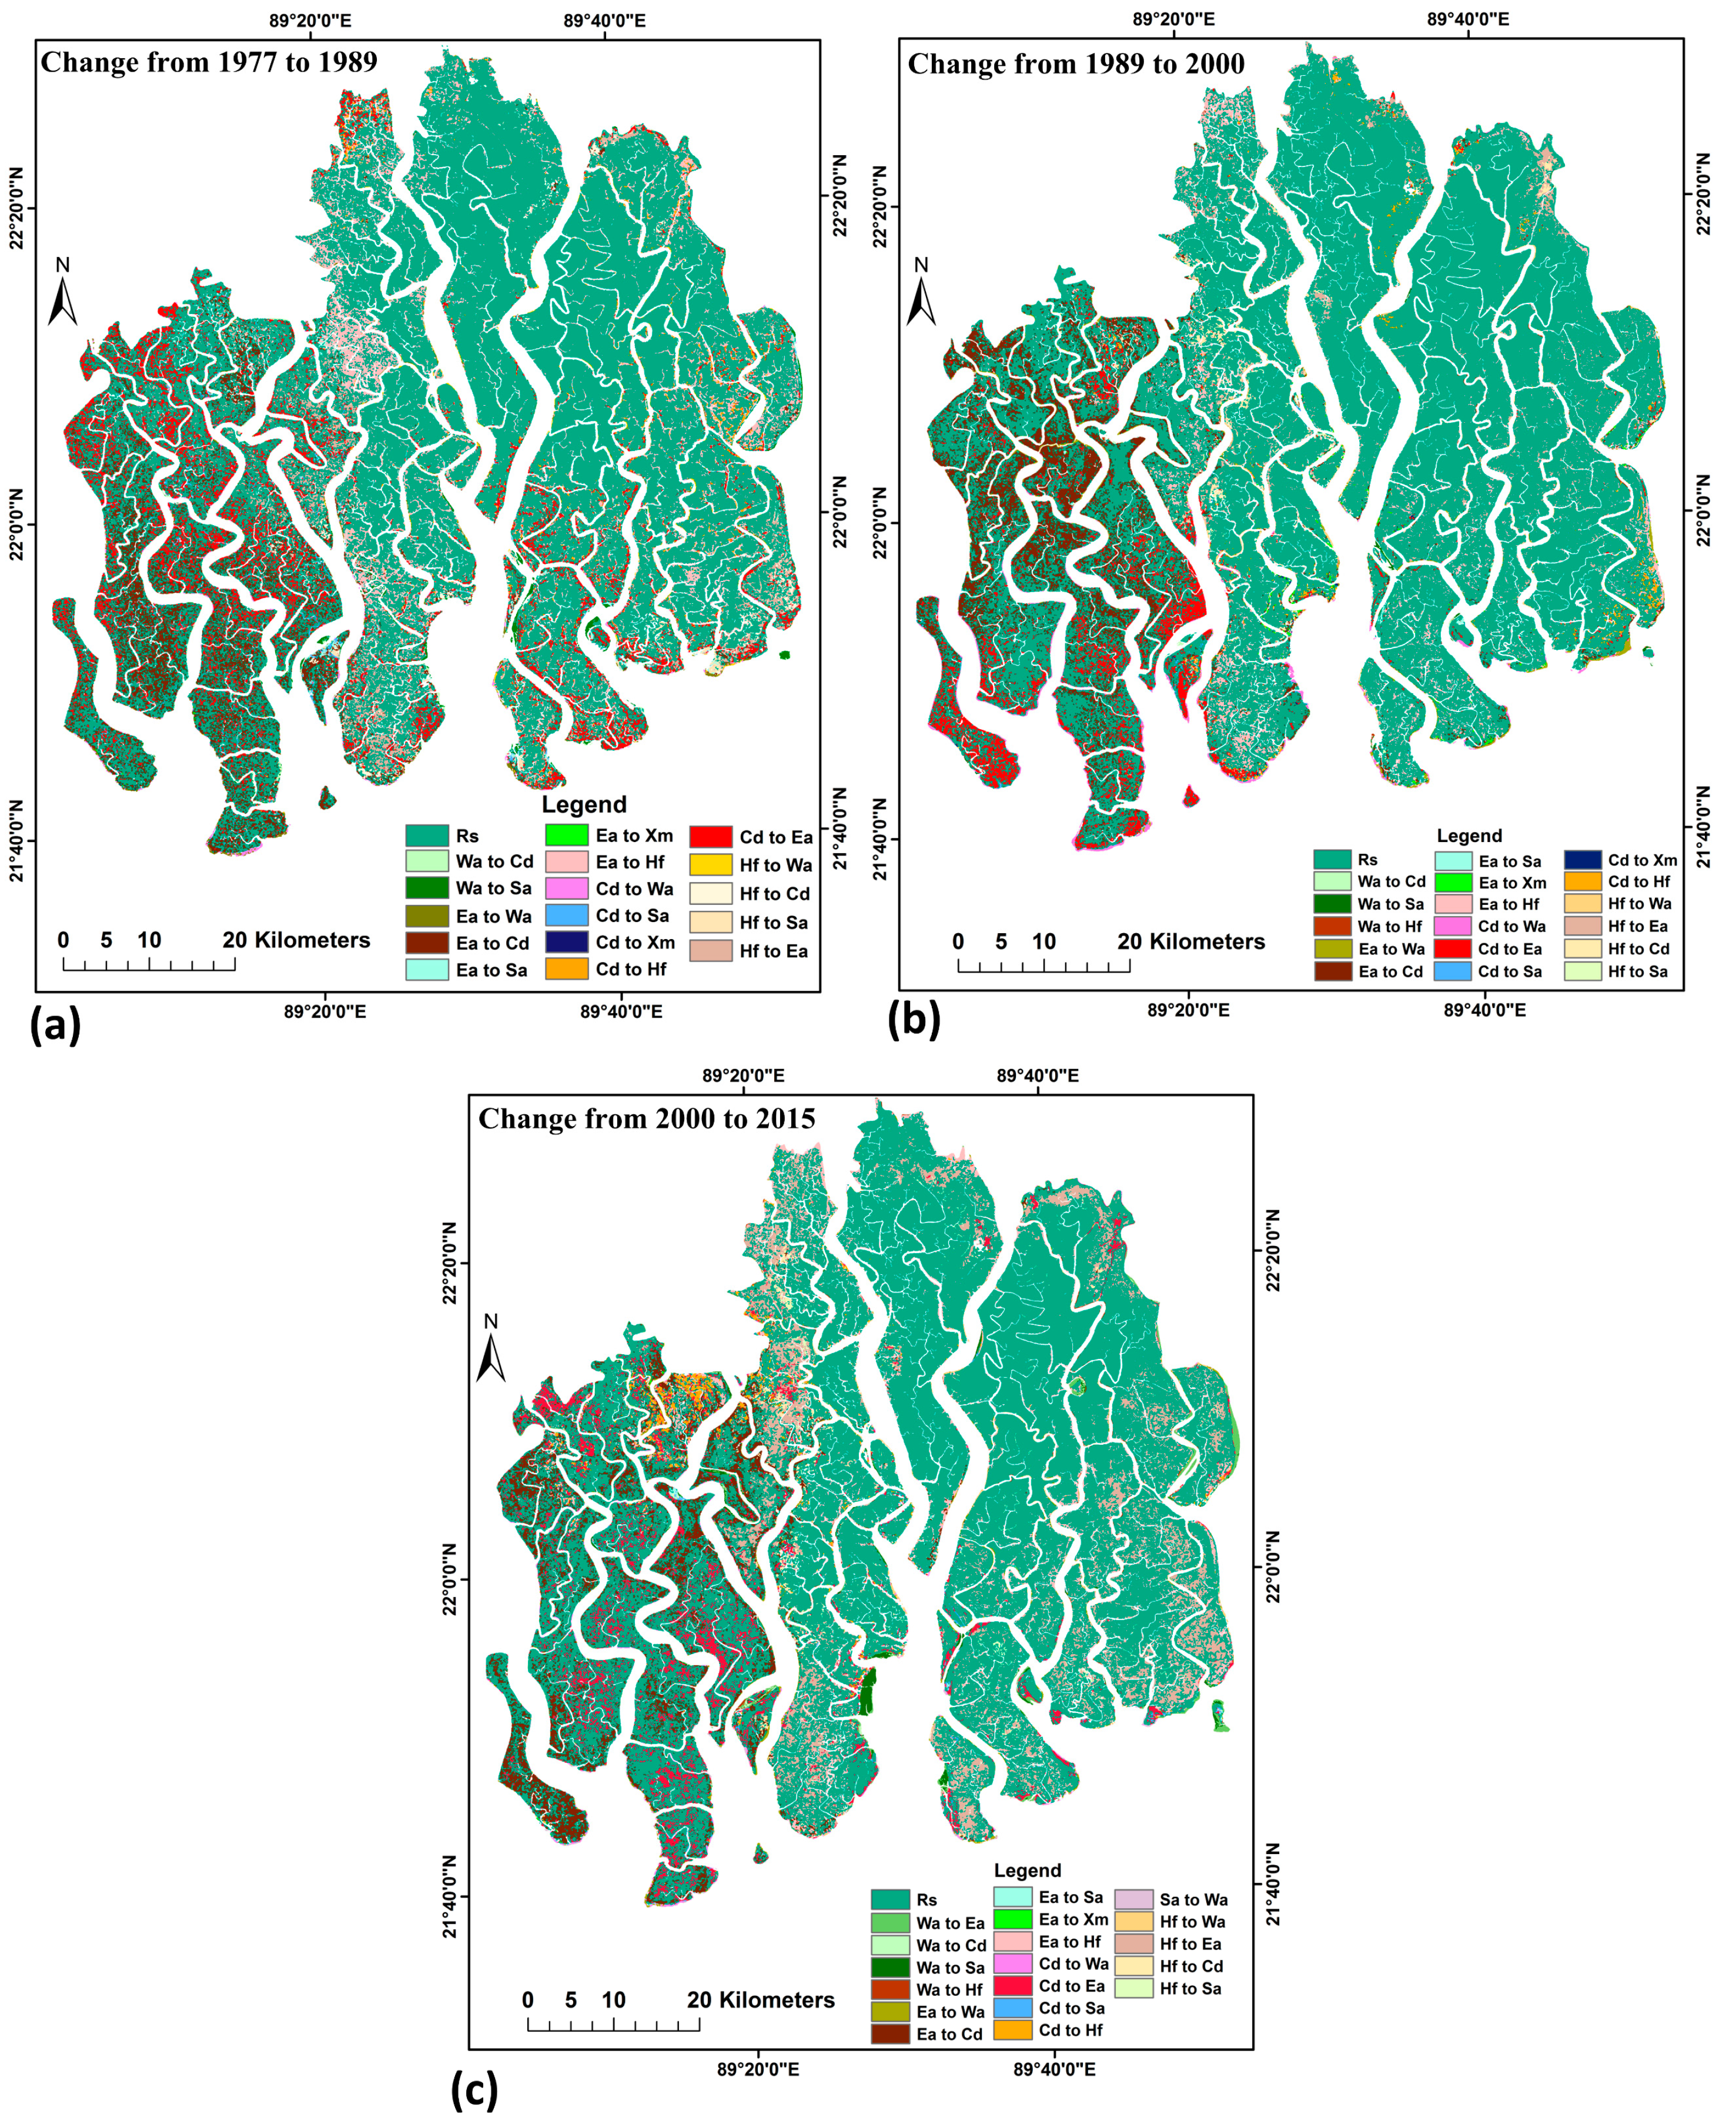
Figure 6.
Mangrove species composition change map of the Sundarbans mangrove forest, Bangladesh. Prepared on the basis of image analysis from (a) 1977 to 1989, (b) 1989 to 2000 and (c) 2000 to 2015 (Rs = Remain same, Wa = Water, Ea = Excoecaria agallocha, Cd = Ceriops decandra, Sa = Sonneratia apelatala, Xm = Xylocarpus mekongensis, Hf = Heritiera fomes).

Table 1.
Changing rate of climatic variables in the three meteorological stations in the Sundarbans during study period.
Table 1.
Changing rate of climatic variables in the three meteorological stations in the Sundarbans during study period.
| Study Site | Time Period | Change Rate of Climatic Variables | ||
|---|---|---|---|---|
| Maximum Temperature (°C Per Year) | Minimum Temperature (°C Per Year) | Rainfall (mm Per Year) | ||
| Satkhira | 1977–1989 | +0.0763 | −0.0094 | −0.444 |
| 1990–2000 | −0.009 | −0.066 | +1.392 | |
| 2001–2015 | +0.0048 | +0.0247 | −2.184 | |
| Khulna | 1977–1989 | +0.0616 | −0.0502 | +0.588 |
| 1990–2000 | +0.0594 | +0.0552 | +1.308 | |
| 2001–2015 | +0.0226 | +0.0194 | −1.632 | |
| Bagherhat | 1990–2000 | +0.0302 | +0.0402 | +5.928 |
| 2001–2015 | +0.0132 | −0.0020 | −2.436 | |
Note: (−) sign represents decreasing rate and (+) sign represents increasing rate.
Table 2.
Area and rate of change of mangrove species composition in different parts of the Sundarbans.
Table 2.
Area and rate of change of mangrove species composition in different parts of the Sundarbans.
| Study Site | Mangrove Species | Area in Hectares | Change in Area | Rate of Change % Per Year | |||||||||
|---|---|---|---|---|---|---|---|---|---|---|---|---|---|
| 1977 | 1989 | 2000 | 2015 | 1977–1989 | 1989–2000 | 2000–2015 | 1977–2015 | 1977–1989 | 1989–2000 | 2000–2015 | 1977–2015 | ||
| Satkhira | H. fomes | 4118 | 2940 | 1853 | 1114 | −1178 | −1087 | −739 | −3004 | −2.38 | −3.36 | −2.66 | −1.92 |
| E. agallocha | 58,611 | 54,956 | 45,002 | 40,270 | −3655 | −9954 | −4732 | −18,341 | −0.52 | −1.65 | −17.02 | −0.82 | |
| C. decandra | 41,760 | 45,484 | 53,343 | 59,346 | +3724 | +7859 | +6003 | +17,586 | +0.74 | +1.57 | +21.60 | +1.11 | |
| X. mekongensis | 503 | 798 | 1125 | 1134 | +295 | +327 | +9 | +631 | +4.89 | +3.73 | +0.03 | +3.30 | |
| S. apelatala | 93 | 765 | 718 | 875 | +672 | −47 | +157 | +782 | +60.22 | −0.56 | +0.56 | +22.13 | |
| Khulna | H. fomes | 106,498 | 104,366 | 98,769 | 89,486 | −2132 | −5597 | −9283 | −17,012 | −0.17 | −0.49 | −0.63 | −0.42 |
| E. agallocha | 30,086 | 28,313 | 28,590 | 36,331 | −1773 | +277 | +7741 | +6245 | −0.49 | +0.09 | +1.81 | +0.55 | |
| C. decandra | 3186 | 6017 | 6869 | 8956 | +2831 | +852 | +2087 | +5770 | +7.40 | +1.29 | +2.03 | +4.77 | |
| X. mekongensis | 206 | 250 | 355 | 280 | +44 | +105 | −75 | +74 | +1.78 | +3.82 | −1.41 | +0.95 | |
| S. apelatala | 2268 | 2385 | 2521 | 3760 | +117 | +136 | +1239 | +1492 | +0.43 | +0.52 | +3.28 | +1.73 | |
| Bagherhat | H. fomes | 109,002 | 110,143 | 112,762 | 105,490 | +1141 | +2619 | −7272 | −3512 | +0.09 | +0.22 | −0.43 | −0.08 |
| E. agallocha | 36,658 | 33,407 | 31,610 | 42,703 | −3251 | −1797 | +11,093 | +6045 | −0.74 | −0.49 | +2.34 | +0.43 | |
| C. decandra | 7103 | 7775 | 4195 | 2308 | +672 | −3580 | −1887 | −4795 | +0.79 | −4.19 | −3.00 | −1.78 | |
| X. mekongensis | 107 | 50 | 118 | 100 | −57 | +68 | −18 | −7 | −4.44 | +12.36 | −1.02 | −0.17 | |
| S. apelatala | 401 | 409 | 724 | 3986 | +8 | +315 | +3262 | +3585 | +0.17 | +7.00 | +30.04 | +23.53 | |
Note: (−) sign represents decreasing rate and (+) sign represents increasing rate.
Table 3.
Relationship between mangrove species dynamics and climatic variables (average maximum and minimum temperature and annual total rainfall) in the study area over the period (1977–2015).
Table 3.
Relationship between mangrove species dynamics and climatic variables (average maximum and minimum temperature and annual total rainfall) in the study area over the period (1977–2015).
| Mangrove Species | Maximum Temperature | Minimum Temperature | Rainfall | |||
|---|---|---|---|---|---|---|
| p Value | R-Square | p Value | R-Square | p Value | R-Square | |
| H. fomes | 0.006 | 98.81% | 0.401 | 35.87% | 0.0001 | 99.90% |
| E. agallocha | 0.936 | 0.42% | 0.352 | 42.02% | 0.993 | 0.01% |
| C. decandra | 0.147 | 72.75% | 0.128 | 76.09% | 0.116 | 78.12% |
| X. mekongensis | 0.489 | 26.12% | 0.169 | 69.09% | 0.427 | 32.86% |
| S. apelatala | 0.001 | 99.84% | 0.406 | 35.33% | 0.002 | 99.59% |
© 2017 by the authors. Licensee MDPI, Basel, Switzerland. This article is an open access article distributed under the terms and conditions of the Creative Commons Attribution (CC BY) license (http://creativecommons.org/licenses/by/4.0/).
Share and Cite
MDPI and ACS Style
Ghosh, M.K.; Kumar, L.; Roy, C. Climate Variability and Mangrove Cover Dynamics at Species Level in the Sundarbans, Bangladesh. Sustainability 2017, 9, 805. https://doi.org/10.3390/su9050805
AMA Style
Ghosh MK, Kumar L, Roy C. Climate Variability and Mangrove Cover Dynamics at Species Level in the Sundarbans, Bangladesh. Sustainability. 2017; 9(5):805. https://doi.org/10.3390/su9050805
Chicago/Turabian StyleGhosh, Manoj Kumer, Lalit Kumar, and Chandan Roy. 2017. "Climate Variability and Mangrove Cover Dynamics at Species Level in the Sundarbans, Bangladesh" Sustainability 9, no. 5: 805. https://doi.org/10.3390/su9050805
Note that from the first issue of 2016, this journal uses article numbers instead of page numbers. See further details here.