
Techno-Economic Forecasts of Lithium Nitrates for Thermal Storage Systems

1
Facultad de Ingeniería y Ciencias, Universidad Adolfo Ibáñez, Avenida Diagonal Las Torres 2640, Peñalolén, Santiago 7941169, Chile
2
Escuela de Negocios, Universidad Adolfo Ibáñez, Avenida Diagonal Las Torres 2640, Peñalolén, Santiago 7941169, Chile
*
Author to whom correspondence should be addressed.
Sustainability 2017, 9(5), 810; https://doi.org/10.3390/su9050810
Submission received: 24 March 2017
/
Revised: 26 April 2017
/
Accepted: 8 May 2017
/
Published: 12 May 2017
(This article belongs to the Special Issue 6th World Sustainability Forum - Selected Papers)
Abstract
:Thermal energy storage systems (TES) are a key component of concentrated solar power (CSP) plants that generally use a NaNO3/KNO3 mixture also known as solar salt as a thermal storage material. Improvements in TES materials are important to lower CSP costs, increase energy efficiency and competitiveness with other technologies. A novel alternative examined in this paper is the use of salt mixtures with lithium nitrate that help to reduce the salt’s melting point and improve thermal capacity. This in turn allows the volume of materials required to be reduced. Based on data for commercial plants and the expected evolution of the lithium market, the technical and economic prospects for this alternative are evaluated considering recent developments of Lithium Nitrates and the uncertain future prices of lithium. Through a levelized cost of energy (LCOE) analysis it is concluded that some of the mixtures could allow a reduction in the costs of CSP plants, improving their competitiveness.
1. Introduction
Economic growth and industrialization have increased energy demand, generating a challenge for new plants that must deal with increasing concerns about anthropogenic climate change, local environmental impacts and dependency of foreign fuels. This in turn pushes for higher costs of traditional technologies or the introduction of relatively expensive non-conventional renewable energies (NCRE). However, there are important technical and economic hurdles that must be overcome before NCREs can become a widespread alternative to traditional technologies. One of the main problems is the intermittent supply of many of these technologies that limits their applicability. Therefore, energy storage mechanisms are a key required element for these.
In the particular case of solar thermal power plants, thermal energy storage (TES) allows them to work when no radiation is available increasing their capacity factor. Without TES, this factor ranges between 20% and 28% [1]. Plants with 6–7.5 h of TES double these numbers reaching from 40% to 50%. For example, a solar thermal power plant in Chile currently under construction, with a capacity of 110 MW, equipped with a TES system of 17.5 h, will reach an estimated capacity factor above 80% [2]. Although capital expenditure increases when storage is added, the cost per energy unit is likely to decrease due to the increased capacity factor and greater utilization of the power block. Moreover, incorporating storage increases the technology’s marketability as utilities can dispatch the electricity to meet non-peak demand.
Due to the importance of TES in energy management of concentrated solar power (CSP) plants, researchers have been looking for alternative materials to enhance performance. One research field focuses on new mixtures to be used as heat storage media, and a specific novel option with important potential is lithium based nitrates. The main aim of this work, based on a review of the most recent literature and an analysis of their technical advantages for CSP plants equipped with TES, is to evaluate the economic feasibility of incorporating different mixtures based on Lithium considering the uncertain prospects of future prices of these materials. Two solar power plants, a solar tower and a parabolic trough collector, were selected for the analysis for which a detailed evaluation using the LCOE index is undertaken. To incorporate uncertainty in prices, this analysis is complemented with a review of the lithium market and its price projections and a sensitivity analysis of the results.
2. Thermal Energy Storage Systems and Materials
In this section the state of the art for TES systems is presented together with important recent advances in the use of lithium nitrates as a thermal energy storage material.
2.1. Classifications of TES Systems
Thermal energy storage is an important complement for CSP facilitating energy management in the plant. It can be classified according to its storage system in sensible heat storage (SHS), latent heat storage (LHS) and thermo-chemical heat storage (TCS) [3].Additionally, according to the location of the storage media and how the heat is transported it can be classified as active storage, passive storage or hybrid storage [3,4,5,6].
Active storage is mainly characterized by forced convection heat transfer into the heat storage medium, as this material itself circulates through a heat exchanger. Active systems are additionally subdivided into direct and indirect systems. In active direct system, the heat transfer fluid serves also as the storage medium, while in an active indirect system a second medium is used to store heat [6]. A well-known design in this category is the “2-tanks indirect system”, where the heat storage material flows between two tanks. In passive storage, the heat storage medium does not circulate through the system and always stays in the same location. A heat transfer fluid (HTF) is responsible of carrying the heat between the energy source and the heat storage medium. This type of system mainly uses solid heat storage medium such as concrete and PCMs. Finally, hybrid storage combines active and passive storages trying to improve the performance characteristics. CSP plants around the world mainly use active systems with sensible heat storage materials [7] and molten salts as heat storage media. While parabolic trough collector CSP plants typically use a 2-tanks indirect system, in solar power tower CSP plants the most widely used storage system is the active direct system.
As regards TES materials, the systems can be classified based on what is normally used in the storage mechanism categories mentioned above (SHS, LHS and TCS). SHS materials are the most studied, and usually have the lowest cost and lowest storage capacities in comparison to LHS and TCS. Nevertheless, their thermal capacity is highly dependent on their working temperature range. Higher ranges imply higher capacities, that in some cases can be higher than LHS materials.
LHS materials, also known as phase change materials (PCMs), are characterized by their stability (whereas TCS materials are unstable) and have low temperature variation during charging and discharging cycles [8]. The main disadvantage of PCMs is their low range of thermal conductivity, between 0.2 W/(m·K) and 0.6 W/(m·K) [9]. Therefore, improving PCMs’ thermal conductivity would enhance TES system efficiency by enhancing its charging/discharging processes [3]. Some methods have been studied such as inserting a metal matrix into the PCM [10], but further research is required.
TCS materials have the highest storage capacity with energy densities in the order of GJ/m3. However, thermo-chemical heat storage has not been extensively researched and has three important disadvantages: weak long-term durability, weak chemical stability and requires complicated reactors for the specific chemical reactions [7]. Within TCS, thermal energy can be stored by an absorption process or chemical reactions [11].
Currently, most CSP plants equipped with TES use the same storage mechanism and material: an SHS mechanism and the eutectic mixture of 60% NaNO3 and 40% KNO3, also known as solar salt [5]. This binary mixture has a melting point of 220 °C [12]. When the working temperature decreases it starts to crystalize at 238 °C [5], and for this reason inside the system it must be kept in its liquid phase above 238 °C. Salt solidification is a major problem in these systems because it blocks and harms the piping system, and also obstructs the heat flux. Therefore, freezing protection technologies such as heat tracing are required in these plants to avoid this risk.
The advantages of using solar salt at CSP plants are their low corrosion rate when used with common piping materials, their thermal stability in the upper temperature range required by steam Rankine cycles and their very low vapor pressures. They are also widely available and are relatively inexpensive [13].
2.2. Improving TES: The Case for Lithium-Based Nitrates
As discussed, two-tank indirect systems and solar salts are the main mechanism and heat storage material (HSM) used to store energy in solar thermal power plants, but there is significant room to reduce storing costs to increase the competitiveness of CSP technologies, specifically by introducing lithium based materials. New design concepts could help decrease the costs of the heat tracing and the self-consumed energy to avoid solidification of the salts, such as circulating fluidized bed [14], encapsulating PCMs [15], adding new structures to the TES [16] or identifying new materials with lower point of fusion. In this line, researchers have been searching for new storage media mixtures with lower fusion temperatures to reduce freezing risk and self-consumption of energy. Recent studies have proposed salt mixtures with lithium nitrate as a potential alternative [17,18,19,20] that melt at lower temperatures than the solar salt.
Energy density of the HSM should be increased since materials with higher densities and higher heat capacities reduce the required amount of storage material and the size of the tanks. A study performed by Ulloa [21] showed that using lithium nitrate as a PCM instead of solar salt allows higher energy densities. Based on previous research of [22,23,24] a comparison was performed of the internal energy stored by copper foam filled with LiNO3 in different conditions and materials. An ongoing project led by one of the authors has been using computational simulations to compare different PCMs encapsulated in copper spheres. Figure 1 shows preliminary results of the stored thermal energy of different materials during a charging cycle, where it is shown that encapsulated lithium based PCMs store more energy. Additionally, in the particular case of a LiNO3/KNO3/NaNO3 mixture, the charging process is even faster.
The benefits of using lithium mixtures have already been observed in different TES systems. For example, low temperature TES PCMs containing lithium have been identified as useful for building applications as described in [17]. In the case of high temperature TES, lithium compounds have been identified as promising candidates to be added to KNO3/NaNO3 mixtures helping to lower the solidification temperature of solar salt [17,18,19,20,25]. As a result, the working temperature range and the thermal stability of the system can be extended. Also a reduction in the use of heat tracing and self-consumed energy for its operation is expected due to lower working temperatures. The latter will allow an increase in available energy for electricity generation and savings in operation and maintenance costs for CSP plants.
These Lithium based mixtures are still under research and development, but there are some mixtures proposed in the literature such as the ones presented in Table 1. Even though the specific composition was not available for all mixtures in the literature, the main TES properties are known as well as costs. Compared to solar salt, these alternative materials provide lower melting temperatures, and in some cases higher heat capacities.
Apparently, the prices of Lithium mixtures are a problem since they double or more solar salt prices. However, this higher cost could be offset by their technical advantages. Consequently, in the next section an economic feasibility analysis of these new lithium based nitrates is undertaken. Further research is also required regarding corrosion, but according to [19], the addition of calcium or lithium nitrate to solar salt is not expected to worsen the corrosiveness of the mixture. Also, regarding the corrosion studies of steel in presence of molten nitrates performed by [25,26], some steels have excellent performance, and others do not. Corrosion products alter the composition of molten salts and consequently affect the physiochemical properties including the storage capacity [27]. The addition of other components to the nitrate mixtures, such as calcium nitrate, reduce the corrosive effect of salts.
3. Economic Evaluation of the Use of Lithium Nitrates
In this section we compare the costs of using traditional solar salt with the use of lithium based mixtures for two operating CSP plants: a solar power tower and a parabolic trough collector. The components of the investment structure of each plant are reconstructed with available data from different sources, and then their cost, considering lithium based nitrates instead of solar salts, is simulated. Finally, the levelized cost of energy is calculated to compare the economic performance of the plants, using different thermal materials.
3.1. Description of Selected Plants
The Extresol 3 and Gemasolar plants in Spain are two solar plants equipped with solar salt TES systems and with available data. The former is a 50 MWe CSP with parabolic trough technology that has operated since 2012. It has an active indirect TES module of 28,500 tons of molten solar salt, which provides 7.5 h of storage and uses synthetic oils as HTF [30,31]. Gemasolar is a 19.9 MWe solar power tower, the first of its kind to become a commercial plant equipped with solar salt as heat storage material [32,33,34]. It is equipped with an active direct TES system, which provides 15 h of storage, using 7900 tons of molten solar salts as HSM and HTF. More technical details are presented in Table 2.
3.2. Levelized Cost of Energy (LCOE)
The levelized cost of energy is the net present value of the marginal cost (unit-cost) of energy over an assumed lifetime of a generating plant [39]. The economic interpretation of the LCOE index is the energy price ($ per unit of energy output) for which the net present value of the investment is zero. In other words, the LCOE can be considered as a proxy for the average price (average revenue per unit of energy output) that the energy project must receive in a market to break even over its lifetime. This economic analysis is an assessment of the cost competitiveness of an energy-generating system that incorporates all costs over its lifetime: initial investment, operations and maintenance, cost of inputs and cost of capital. This type of analysis is critical to make an informed decision of whether to proceed with the development of an energy project (public or private) and is flexible enough to allow the comparison of different energy generation technologies (e.g., solar, natural gas, wind) of unequal life spans, project size, different capital cost, risk, return, capacities and so on.
In particular, in the context of this work the authors used the LCOE to measure cost changes produced by the lithium based nitrates. LCOE indicates the price per produced energy unit, on the basis of weighted average costs [40]. The formula behind de LCOE is the following [41,42,43]:
where I0 is the initial investment, Cn is the annual total costs for the year n, Qn is the energy output for the year n, d is the discount rate and N is the analysis period [40]. In this work I0 as the sum of two costs: (1) the cost of the tanks and the salts; (2) the total investment of the plant without the cost of the tanks and salts. The first cost will vary with the type of salt used, therefore initial investment depends critically on the mixture selected.
To compare the LCOE produced by different mixtures, a base LCOE was calculated for both selected CSP plants considering their original characteristics and costs with solar salts. Then, the LCOE was recalculated after taking into account a lithium-based mixture instead of the KNO3/NaNO3 salts. The following considerations were taken for each new LCOE:
- It was assumed that the original TES system of the plants is able to work with the lithium based mixtures and that it can be stored in similar tank technology.
- The required amount of lithium based mixtures will be able to store the same quantity of thermal energy than solar salts. Then, for each new LCOE the tons and volume of lithium based mixture that were necessary to replace solar salt were estimated. These quantities were calculated using the thermal properties of each mixture mentioned in Table 1 and the following equation:where Q is heat, m is the mass of the selected heat storage medium and Cp is the specific heat of the material. Ti and Tf are the initial and final temperature of the heat storage medium respectively.
The following steps were followed to calculate the LCOE of the lithium based mixtures:
- The maximum stored sensible heat of solar salt of each CSP plant, Q in Equation (2), was obtained taking into account the corresponding working temperature range.
- The tons of lithium based mixtures, m in Equation (2), required to store the same quantity of thermal heat (Q) than with solar salt were calculated. The working temperature range was modified depending on the nitrate salt, considering that lower melting points will allow a lower limit.
- The costs of tanks to store the required lithium based mixtures calculated in step 2 were estimated. The costs were obtained by reducing the original cost of the tank in the same proportion as the required volume of storage material was reduced in comparison with solar salt. It was assumed that the lithium based nitrates might be kept in the same type of tanks used for solar salts.
- The I0 of each plant was replaced by the sum of the original total investment of the plant without the cost of the tanks and salts, and the new cost of tanks and salts.
- In each of the lithium based nitrates scenarios an increase of 2% in generated electricity was assumed as an effect of lowering the energy use of heat trace due to lower melting point as estimated in [44].
- In every scenario an analysis period of 30 years and a discount rate of 10% and 7% were considered.
3.3. Cost Comparison: Solar Salt vs. Lithium Mixture
The total TES module costs for each materials scenario and its LCOE results of Extresol 3 and Gemasolar are presented in Table 4 and Table 5. A first conclusion is that the mixture LiNO3 + NaNO2 + NaNO3 + KNO2 + KNO3 provides the highest savings of volume for Extresol 3, a reduction of 54%. Meanwhile, for Gemasolar only the ternary mixture 53% KNO3 + 29% LiNO3 + 18% NaNO3 could allow a volume reduction of 23%. Regarding the LCOE, a reduction was obtained in both plant. In the case of Extresol 3 the quaternary mixture KNO3 + LiNO3 + NaNO3 + MgK provided the highest reduction of 3.2%. Meanwhile at Gemasolar the highest LCOE reduction was 0.7% obtained with the ternary 53% KNO3 + 29% LiNO3 + 18% NaNO3.
These results suggest that lithium based nitrates are a promising alternative to reduce the costs of parabolic trough CSP plants and improve their operation characteristics. In the case of the solar tower case, the cost reduction is almost negligible. It is interesting to note that the LCOE values could be even more promising in regions with higher solar radiation as in Chile [45]. For example, in the case of Gemasolar, one of the authors [35] had estimated an increase of 22.7% in energy generation (from 110 GWh to 135 GWh per year) if the plant is placed in the north of Chile.
4. The Impact of Uncertainty and Future Market Prospects
An important concern with the previous analysis that suggests that lithium mixtures can be an important thermal material for CSP plants, relates to the uncertainty associated with key parameters. In this section we explore the impact on results of a more detailed analysis of the lithium market and a sensitivity analysis of the prices of the main nitrates.
4.1. Sensitivity Analysis
When analyzing the LCOE index, a major driver of change is the price of the different mixtures of salts used in the TES. This is because depending on the nitrates mixture, tanks will vary their volume and depending on the price of the mixtures of salts, LCOE will be impacted positively or negatively. Consequently, to adequately incorporate this uncertainty into the evaluation, a sensitivity analysis of the prices of the different components of the mixtures was performed for both plants. Given that the LCOE index will vary depending on the price of the different nitrates used in the mixture, changes in the prices of Lithium nitrate, NaNO3 and KNO3 have been explored. The impact of both reduced values of this material and significant increases are considered, values based both on history and expert assessment. This variation in prices will affect the costs of each mixture differently. In the case of Extresol 3 the mixture 25.92% LiNO3 + 20.01% NaNO3 + 54.07% KNO3 was used for the analysis since the information on weight composition was available, allowing estimating the contribution of each component to the cost of the whole mixture. For Gemasolar the 53% KNO3 + 29% LiNO3 + 18% NaNO3 mixture has been used since it is the only one that provided a lower LCOE. The investment devoted to plant construction was considered the same whatever mixture is used. The same happens with the O&M costs, no variation was considered in the operating or maintenance costs associated with the type of nitrates used in the TES.
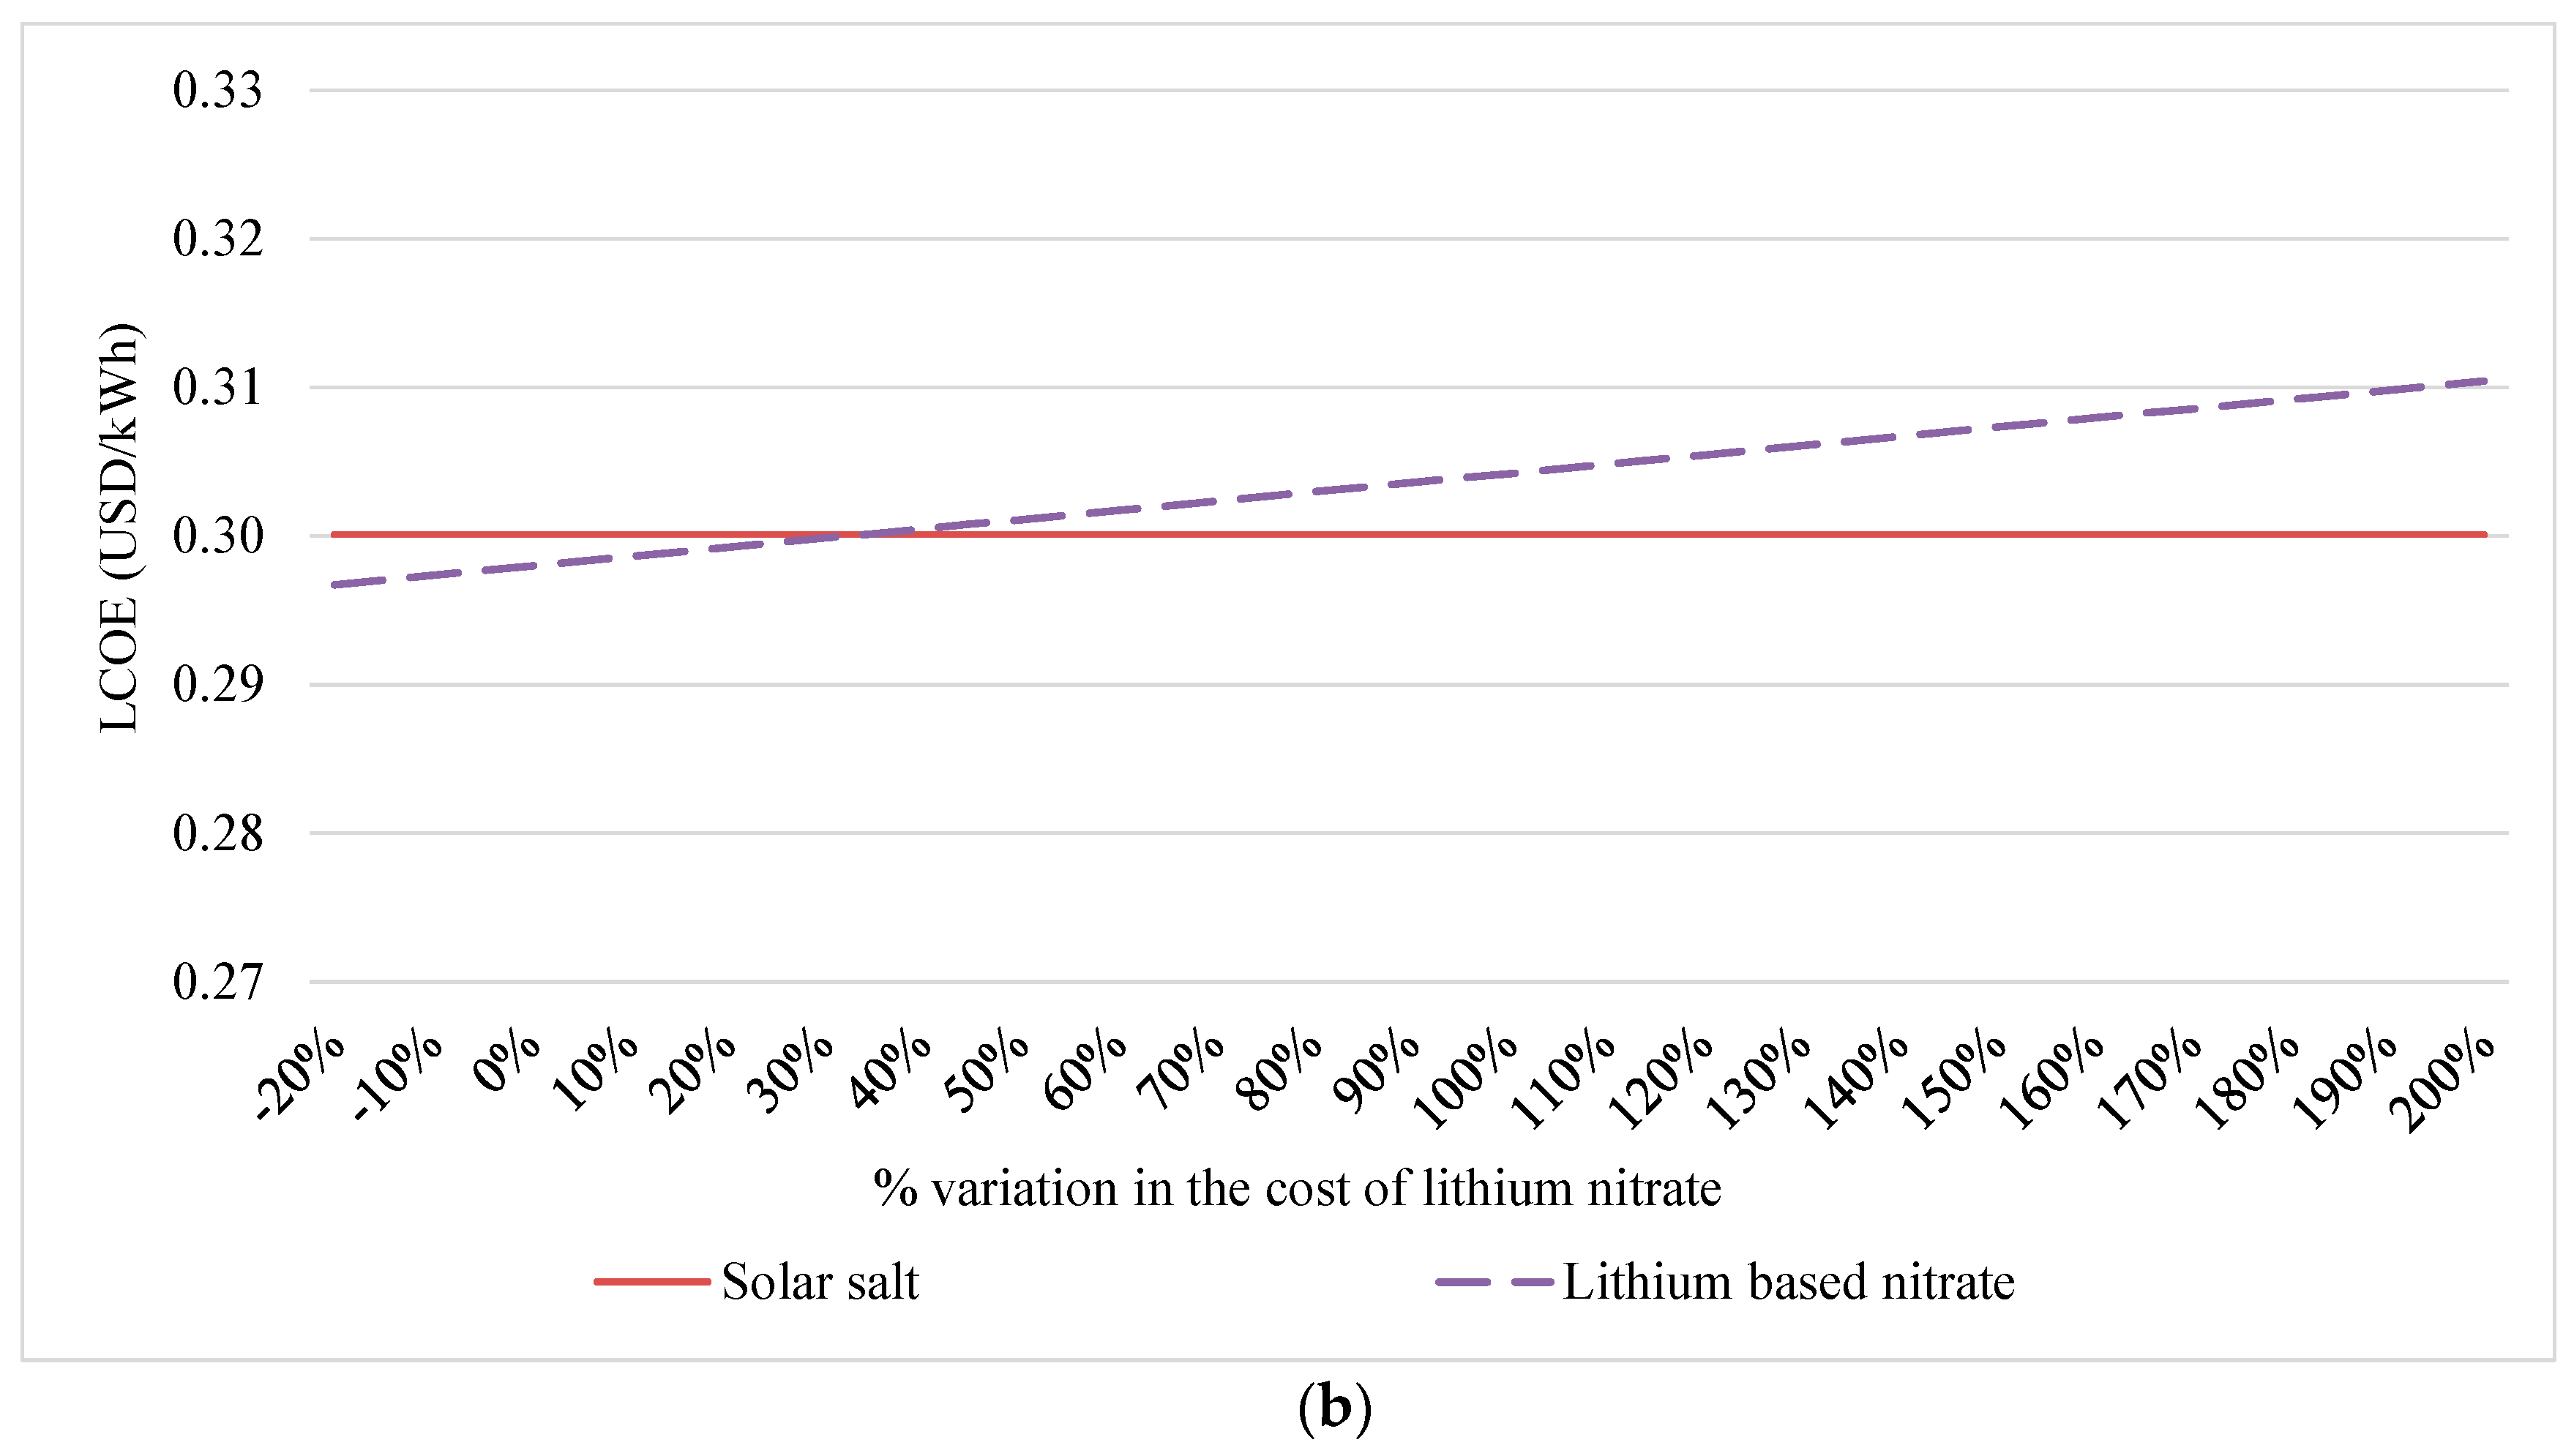
Figure 2 presents the sensitivity analysis for lithium nitrate prices. The results obtained above hold for a wide range of variation in the future prices for both plants, however it is more robust for Extresol 3. For this latter plant, the result that lithium based mixture is more convenient holds for a price increase of up to 85%. Only at this value is LCOEsolar salt equal to LCOElithium (see Figure 2a). In the case of the Gemasolar plant, using the lithium based mixture is not as robust since a 30% increase would equate both LCOE’s (see Figure 2b). The reason for this difference is that in Gemasolar the cost of tanks and salts is a lower percentage of the total cost of the plant, and consequently using the lithium mixture reduced only slightly the LCOE, so it is more susceptible to cost variation of lithium nitrate.
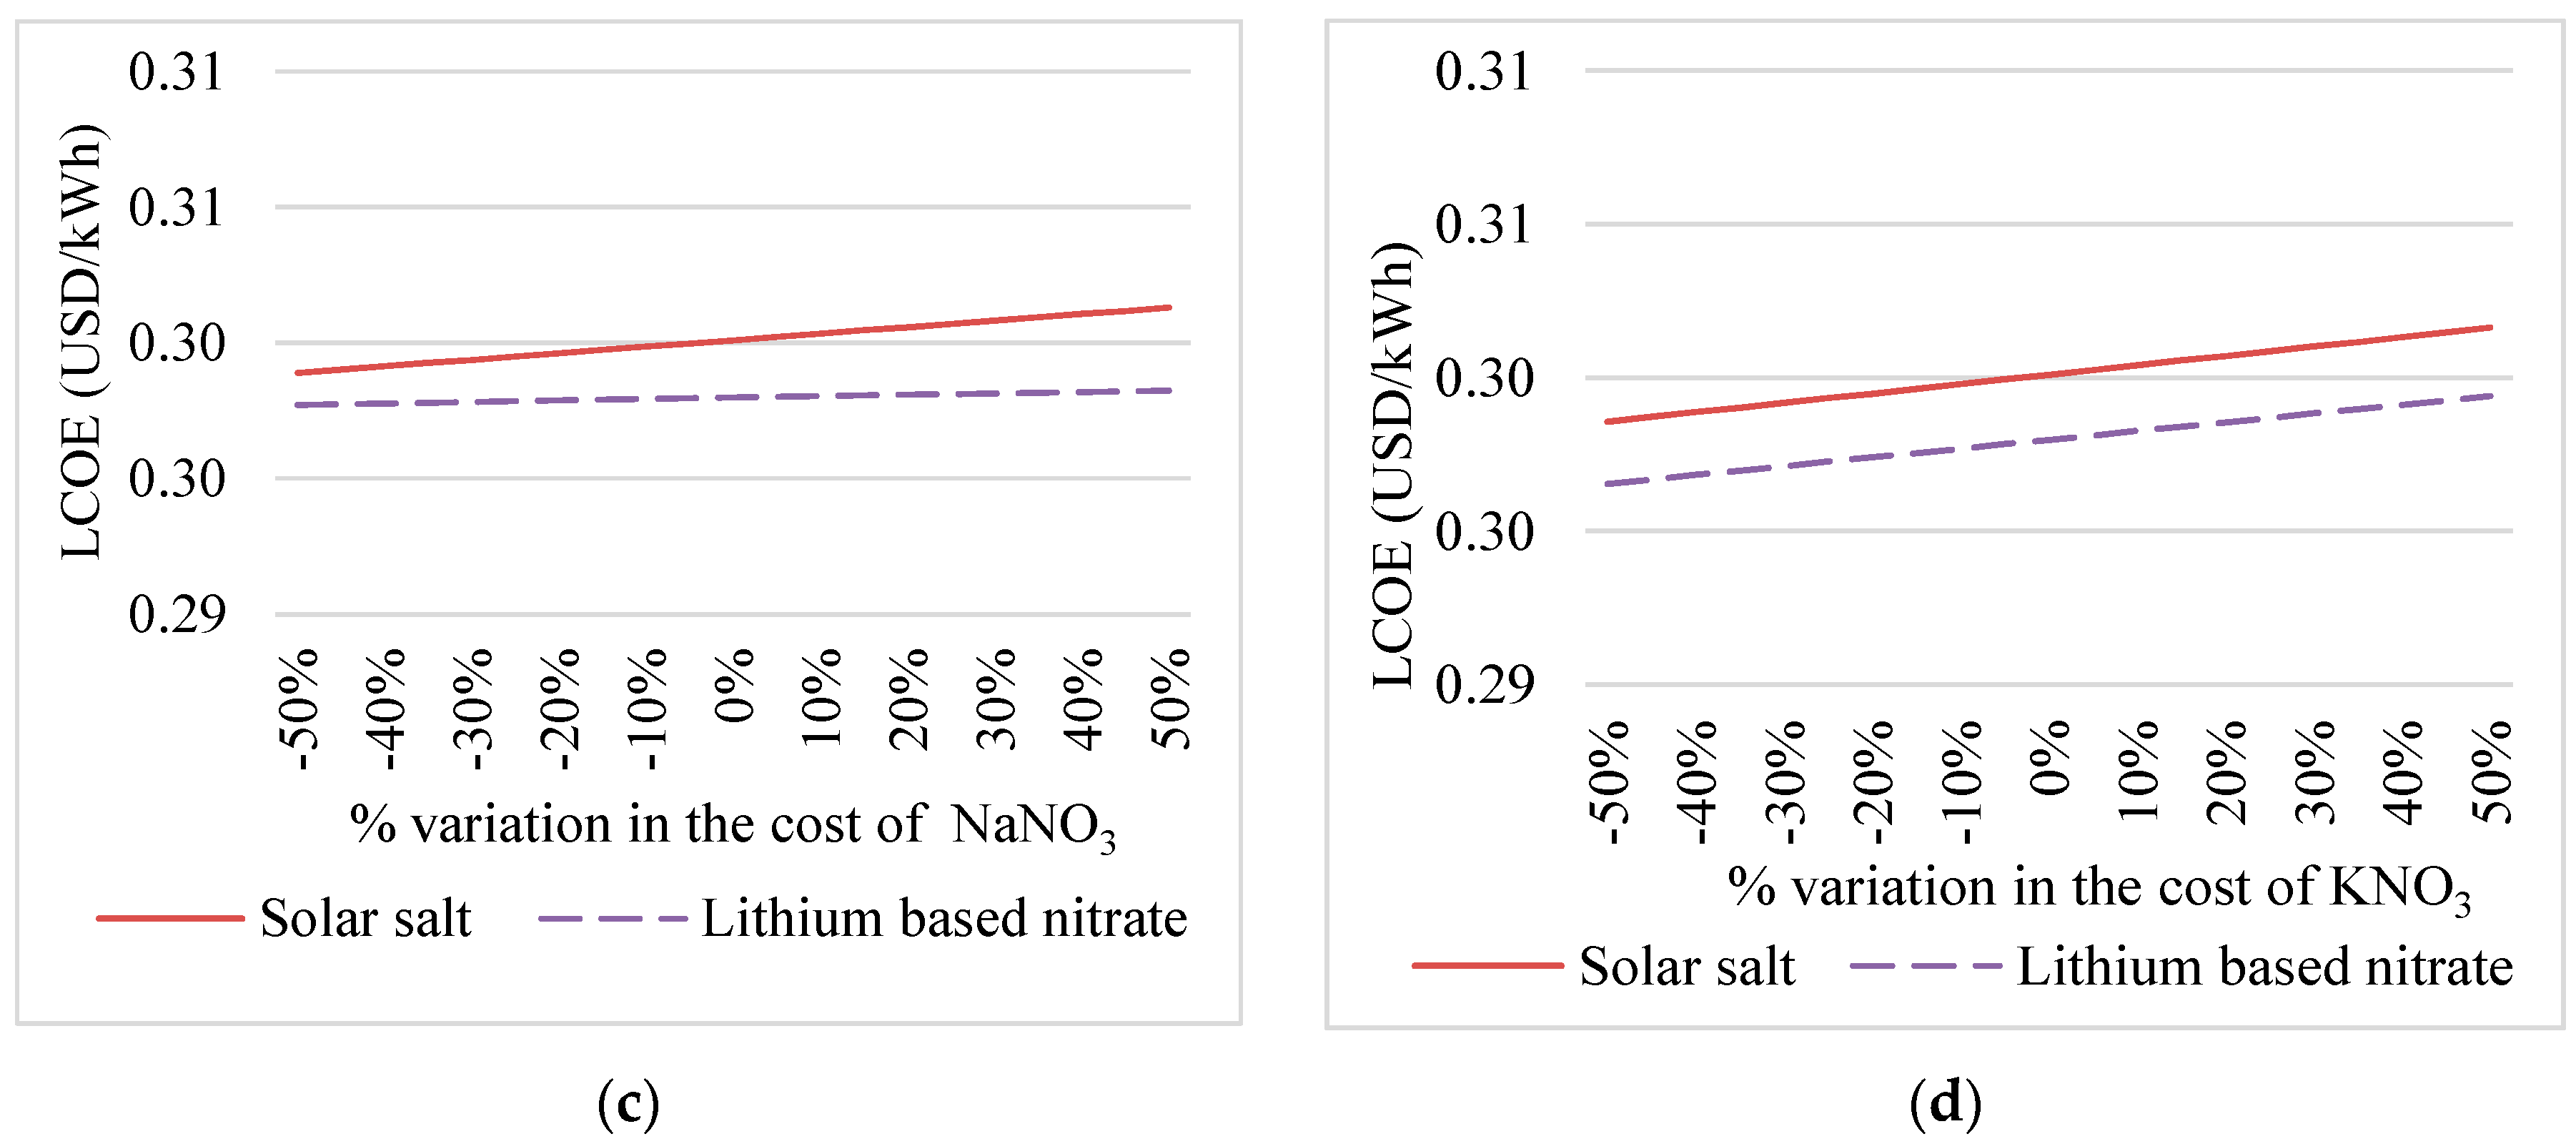
Changes in the price of the other components do not affect the main result that nitrate mixtures may be of lower cost than solar salts. As can be observed in Figure 3a–d, increases in the price of NaNO3 or KNO3 actually make a plant using lithium salts even more convenient, increasing the difference in LCOE costs. Both for Extresol 3 and Gemasolar plant, the LCOElithium is lower than LCOEsolar salt. This result is because as both components increase in price, so does the price of the alternative solar salt, that contains both. Alternatively, the impact on the mixture price as the price of both components fall, even if NaNO3 or KNO3 prices decrease by more than 50%, does not significantly affect the cost advantage of the lithium mixture. This is due to the fact that the major cost component is the lithium nitrate, not these other materials.
4.2. Lithium Market and Projections
The market for lithium has experienced enormous growth in recent years. For this reason, it is necessary to examine whether changes of the magnitude discussed in the previous section (30–85%) can be expected. Increasing applications, market structure, supply costs and demand will determine the result. The increasing demand for this material has come from its use in different applications [46]. Recently, demand has been fueled mainly by the production of rechargeable batteries, which account for 35% of the global demand of this material for end-use markets. In particular, rechargeable batteries are used for portable electronic devices, electric vehicles, electric tools and grid storage applications. Other important specific uses are: ceramics and glass, 32%; lubricating greases, 9%; air treatment and continuous casting mold flux powders, 5% each; polymer production, 4%; primary aluminum production, 1%; and other uses, 9% [47].
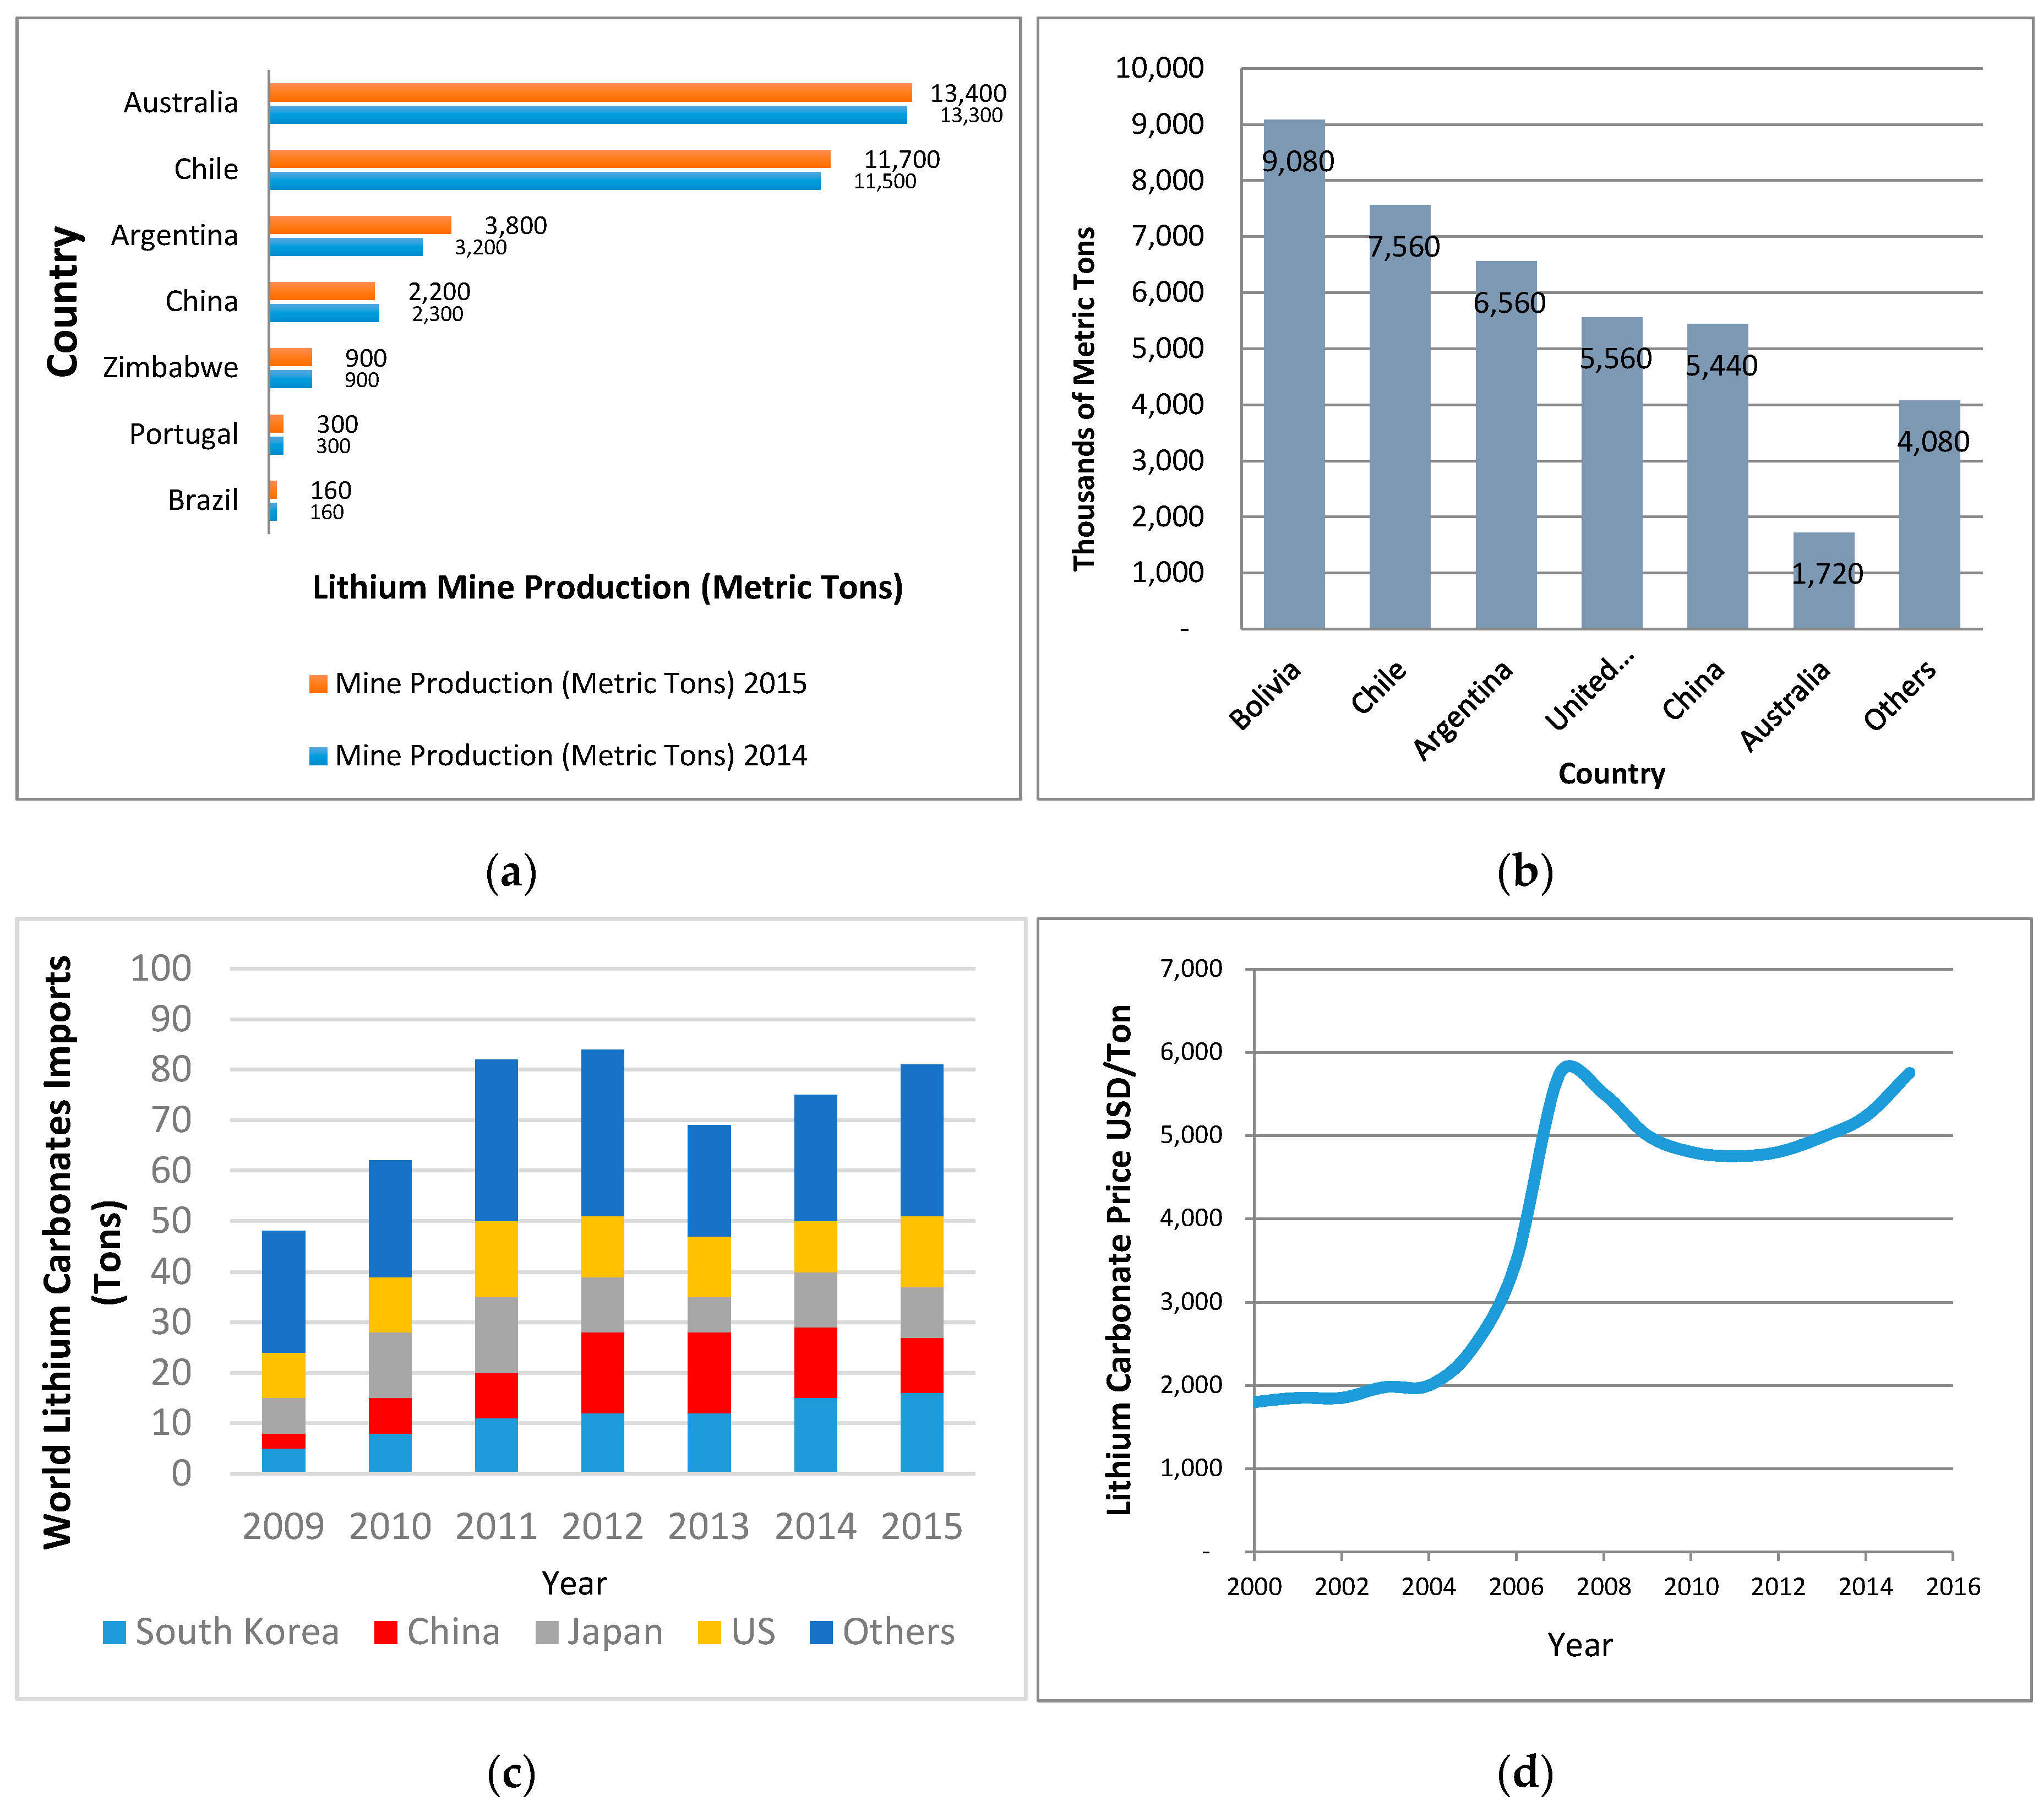
The lithium market’s economic structure is basically that of an oligopoly, in which two countries currently account for almost 80% of world mine production: Australia and Chile [48]. In 2015 Australia produced about 13,400 metric tons, 41.28% of the world total production, while Chile produced 11,700 metric tons, 36.04% of total production. In third place came Argentina with a production of 3800 metric tons, 11.71% of world production, see Figure 4a. It is interesting to note that despite the dominance of Australia and Chile in the lithium market, when comparing the percentage change of country production for the period 2014–2015 Argentina grew 19%, while Australia only 1% and Chile 2%. As a result, Argentina increased its market share in the lithium global market from 10.1% to 11.7%, while Australia’s market share was reduced from 42.0% to 41.3% and Chile´s from 36.3% to 36.0%.
According to [46], identified lithium resources in the world add up to 40 million metric tons, being Bolivia with 9.1 million metric tons, the country with the greatest reserves of this material accounting for more than the 22.7% of the world’s total. Chile comes next with 7.6 million metric tons, 18.9% of total reserves and Argentina with 6.6 million metric tons, accounts for 16.4% of total reserves, see Figure 4, panel (b). In these three countries is located what is known as the “lithium triangle”, an area of high-altitude lakes across Chile, Argentina and Bolivia which accounts for over half of the world’s known reserves of lithium.
Bolivia has the world’ s largest identified reserves of lithium in the Salar de Uyuni, the largest salt flat in the world, however Chile is better suited to lithium production, with lower costs mainly due to its dry-desert climate. At present, there are development projects under construction in Bolivia, US, Canada, Finland, Serbia and Mexico [49].
Although imports of lithium carbonates from the US have experienced rapid growth, more than 40% growth from 2014 to 2015, Asian countries are by far the main importers of this material, in particular South Korea, China and Japan, see Figure 4c. In fact for the period 2009–2015, lithium carbonates imports from South Korea has increased 220%, 267% from China and 43% from Japan. These three countries lithium carbonate consumption stems from their large electronic manufacturing production, especially from the automobile, electronics and battery industries. From Figure 4c, it can be seen that imports of lithium carbonates from Japan have decreased over time, in fact for the period 2014–2015 Japan´s consumption has diminished by a significant 9.1%. This reduction is attributed to the move of battery manufacturing plants from Japan to China and Indonesia, see [46,49]. Tesla, the car manufacturer, has built the largest battery plant in the world in Nevada, capable of producing up to 500,000 lithium-ion vehicle batteries per year. The plant is expected to produce finished battery packs from raw material by 2020 [49]. Tesla’s new battery gigafactory will need about 15,000 tons of lithium carbonate a year in order to start its operation. Considering the powerwall sector, this number could quadruple to $6 billion by 2020, implying that overall lithium demand could increase to more than double that from 2012 to 2017 [50].
This increasing demand is already putting pressure on prices allowing the incorporation of higher cost producers. Figure 4d, presents lithium carbonate prices since 2000, the price indicator usually used for Lithium derivatives. Market conditions have steadily improved and the price has an upward trend. For instance, battery grade lithium prices in China have risen from about US$7000/tonne in mid 2015 to over US$20,000/tonne at the beginning of 2016, i.e., a 286% increase. However, the price paid by companies for long-term contracts has presented a less dramatic rise than the spot Chinese lithium price. Lithium carbonate contract prices are 50% higher than in 2014 [50]. This was before Tesla’s announcements, and before it was clear that the grid, the powerwall and electric vehicles would be a success in the market place. For the first nine months of 2015 lithium carbonate averaged $5700/ton [49,50].
Looking at the current and future demand for lithium and the current supply and prospects of new projects for lithium production, it seems clear that existing operations are not enough. If supply is to keep up with the coming demand, new capacity from new players needs to emerge in the next few years [51] and Argentina, Bolivia and in part Chile are preparing for this. Future increases in lithium prices can be expected, but not as dramatic as those observed in Figure 4d. For 2017, some analysts are forecasting that lithium prices will rise about 20% driven mainly by the demand for electric cars [52]. In the longer run, different sources forecast price increases of lithium carbonate below 30% between 2015 and 2025 [53,54]. This expected increase is substantially lower than the one required for lithium nitrates to lose competitiveness against solar salt at parabolic trough plants (85%), though it is at the limit for solar tower power plants.
5. Conclusions
Based on recent technical results it has been shown that lithium nitrate-based mixtures, in particular the quaternary KNO3 + LiNO3 + NaNO3 + MgK and the ternary 53% KNO3 + 29% LiNO3 + 18% NaNO3, have both important technical properties and economic performance that should allow them to become a very important option for the increasing solar market based on CSP with thermal energy storage systems.
Due to their lower solidification point, the working temperature range of TES systems could be increased, the solidification risk of the molten salts reduced, and self-consumed energy decreased. Additionally, heat storage material volume savings could be obtained due to higher energy storage densities, up to 54% and 23% for Extresol 3 and Gemasolar respectively. This would also help reduce the environmental impact of these plants as less material could be required. Another identified advantage specifically for PTC plants is the possibility to use these melted materials as HTF and change from an active indirect system to an active direct system, potentially eliminating a heat exchanger, reducing investment and maintenance costs. In the case of Gemasolar, greater savings could be obtained if the considered salts could achieve higher thermal stabilities, or higher specific heats as in the case of 53% KNO3 + 29% LiNO3 + 18% NaNO3.
These technical properties allow important reductions in salt volumes and storage tank costs, as well as other relevant costs, such as self-energy consumption. For future CSP plants these improvements could reduce the LCOE, if applied to plants similar to the two analyzed cases: 3.2% for Extresol and 0.7% for Gemasolar.
These results are robust when future expected price increases are considered for different relevant nitrates, specifically lithium nitrate prices. According to the market analysis undertaken, for 2017, forecasts of lithium prices predict an increase of 20%, led mainly by the demand for electric cars. In the longer run, forecasts point to price increases of lithium carbonate below 30% for the period 2015–2025. Given these projections, these expected increases are substantially lower than the ones required for lithium nitrates to lose competitiveness against solar salt at parabolic trough plants. Both plants evaluated actually have lower LCOE’s with increases in prices of lithium nitrates lower than 30%. Another interesting result obtained is that the result is more robust in the case of plants like Extresol, as the cost of tanks and salt represent a higher percentage of the total cost of the plant. The results also hold if NaNO3 or KNO3 prices change by significant amounts, for example an increase or decrease of 50%.
Consequently, it can be expected that using lithium as a TES material will be an option for current solar salt technologies, and that this will be another boost—added to current demand for battery production—for lithium providers, whose demand can be expected to increase.
Acknowledgments
This work was supported in Chile by the projects CONICYT/FONDAP/15110019 (SERC-CHILE), CONICYT/FONDECYT/1151061, CONICYT/FONDAP/15110009 (CR2), by Center UAI-Earth and THEMSYS initiative (UAI). We thank María José Quinteros for her collaboration.
Author Contributions
M. Montané and G. Cáceres conceived the paper and designed the main technical aspects; M. Villena and R. O’Ryan supervised the economic and uncertainty analysis. All actively participated writing the paper.
Conflicts of Interest
The authors declare no conflict of interest.
References
- U.S. Department of Energy. 2010 Solar Technologies Market Report. Available online: http://www.nrel.gov/docs/fy12osti/51847.pdf (accessed on 19 August 2016).
- Electricidad la Revista Energética de Chile. Proyecto Solar Cerro Dominador Presenta Avance de Construcción del 9%. Available online: http://www.revistaei.cl/2014/08/14/proyecto-solar-cerro-dominador-presenta-avance-de-construccion-del-9/# (accessed on 21 January 2016). (In Spanish).
- Gil, A; Medrano, M.; Martorell, I.; Lazaro, A.; Dolado, P.; Zalba, B.; Cabeza, L.F. State of the art on high temperature thermal energy storage for power generation. Part 1—Concepts, materials and modellization. Renew. Sustain. Energy Rev. 2010, 14, 31–55. [Google Scholar] [CrossRef]
- Fernandes, D.; Pitié, F.; Cáceres, G.; Baeyens, J. Thermal energy storage: “How previous findings determine current research priorities”. Energy 2012, 39, 246–257. [Google Scholar] [CrossRef]
- Zhang, H.L.; Baeyens, J.; Degrève, J.; Cacères, G. Concentrated solar power plants: Review and design methodology. Renew. Sustain. Energy Rev. 2013, 22, 466–481. [Google Scholar] [CrossRef]
- Tamme, R. Optimized Industrial Process Heat and Power Generation with Thermal Energy Storage. Technical Report. Available online: http://www.iea-eces.org/files/annex_19_finalreport-07-2010.pdf (accessed on 19 August 2016).
- Tian, Y.; Zhao, C.Y. A Review of Solar Collectors and Thermal Energy Storage in Solar Thermal Applications. Appl. Energy 2013, 104, 538–553. [Google Scholar] [CrossRef]
- Liu, M.; Saman, W.; Bruno, F. Review on Storage Materials and Thermal Performance Enhancement Techniques for High Temperature Phase Change Thermal Storage Systems. Renew. Sustain. Energy Rev. 2012, 16, 2118–2132. [Google Scholar] [CrossRef]
- Zalba, B.; Marin, J.M.; Cabeza, L.F.; Mehling, H. Review on Thermal Energy Storage with Phase Change: Materials, Heat Transfer Analysis and Applications. Appl. Therm. Eng. 2003, 23, 251–283. [Google Scholar] [CrossRef]
- Zhang, H.L.; Baeyens, J.; Cáceres, G.; Degrève, J.; Lv, Y.Q. Thermal Energy Storage: Recent Developments and Practical Aspects. Prog. Energy Combust. Sci. 2016, 53, 1–40. [Google Scholar] [CrossRef]
- Abedin, A.H.; Rosen, M.A. A Critical Review of Thermochemical Energy Storage Systems. Open Renew. Energy J. 2011, 4, 42–46. [Google Scholar] [CrossRef]
- Vignarooban, K.; Xu, X.; Arvay, A.; Hsua, K.; Kannan, A.M. Heat Transfer Fluids for Concentrating Solar Power Systems—A review. Appl. Energy 2015, 146, 383–396. [Google Scholar] [CrossRef]
- Kearney, D.; Herrmann, U.; Nava, P.; Kelly, B.; Mahoney, R.; Pacheco, J.; Cable, R.; Potrovitza, N.; Blake, D.; Price, H. Assessment of a molten salt heat transfer fluid in a parabolic trough solar field. J. Sol. Energy Eng. 2003, 125, 170–176. [Google Scholar] [CrossRef]
- Brems, A.; Cáceres, G.; Dewil, R.; Baeyens, J.; Pitié, F. Heat transfer to the riser-wall of a circulating fluidised bed (CFB). Energy 2013, 50, 493–500. [Google Scholar] [CrossRef]
- Zhang, H.L.; Baeyens, J.; Degrève, J.; Cáceres, G.; Segal, R.; Pitié, F. Latent heat storage with tubular-encapsulated phase change materials (PCMs). Energy 2014, 76, 66–72. [Google Scholar] [CrossRef]
- Zhao, C.Y.; Lu, W.; Tian, Y. Heat transfer enhancement for thermal energy storage using metal foams embedded within phase change materials (PCMs). Sol. Energy 2010, 84, 1402–1412. [Google Scholar] [CrossRef]
- Cabeza, L.F.; Gutierrez, A.; Barreneche, C.; Ushak, S.; Fernández, A.G.; Fernández, A.I.; Grágeda, M. Lithium in termal energy storage: A state-of-the-art review. Renew. Sustain. Energy Rev. 2015, 42, 1106–1112. [Google Scholar] [CrossRef]
- Reddy, R.G. Novel Molten Salts Thermal Energy Storage for Concentrating Solar Power Generation. Solar Energy Technologies Program Peer Review. Available online: http://www1.eere.energy.gov/solar/review_meeting/pdfs/prm2010_ualabama.pdf (accessed on 29 August 2016).
- Bradshaw, R.W.; Siegel, N.P. Molten nitrate salt development for thermal energy storage in parabolic trough solar power systems. In Proceedings of the ASME 2008 2nd International Conference on Energy Sustainability, Jacksonville, FL, USA, 10–14 August 2008; pp. 631–637. [Google Scholar]
- Bauer, T.; Pfleger, N.; Laing, D.; Steinmann, W.; Eck, M.; Kaesche, S. High-Temperature Molten Salts for Solar Power Application. In Molten Salts Chemistry; Lantelme, H., Groult, F., Eds.; Elsevier Inc.: Oxford, UK, 2013; pp. 415–438. [Google Scholar]
- Ulloa, R. Technical Viability of Phase Change Materials with Metal Foams to Be Used as Thermal Energy Storage in Concentrated Solar Power Plants. Dissertation for the Title of Civil Industrial Engineering, Adolfo Ibáñez University, Santiago, Chile, June 2015. [Google Scholar]
- Lopez, J.; Caceres, G.; Palomo Del Barrio, E.; Jomaa, W. Confined melting in deformable porous media: A first attempt to explain the graphite/salt composites behaviour. Int. J. Heat Mass Tran. 2010, 53, 1195–1207. [Google Scholar] [CrossRef]
- Pit1ie, F.; Zhao, C.Y.; Caceres, G. Thermo-mechanical analysis of ceramic encapsulated phase-change-material (PCM) particles. Energy Environ. Sci. 2011, 4, 2117–2124. [Google Scholar] [CrossRef]
- Parrado, C.; Cáceres, G.; Bize, F.; Bubnovich, V.; Baeyens, J.; Degreve, J.; Zhang, H.L. Thermo-mechanical analysis of copper-encapsulated NaNO3-KNO3. Chem. Eng. Res. Des. 2015, 93, 224–231. [Google Scholar] [CrossRef]
- Fernández, A.G.; Ushak, S.; Galleguillos, H.; Pérez, F.J. Development of new molten salts with LiNO3 and Ca(NO3)2 for energy storage in CSP plants. Appl. Energ 2014, 119, 131–140. [Google Scholar] [CrossRef]
- Fernández, A.G.; Pérez, F.J. Improvement of the corrosion properties in ternary molten nitrate salts for direct energy storage in CSP plants. Sol. Energy 2016, 134, 468–478. [Google Scholar] [CrossRef]
- Fernández, A.G.; Gomez, J.; Galleguillos, H.; Fuentealba, E. Thermophysical Properties and Corrosion Characterization of Low Cost Lithium Containing Nitrate Salts Produced in Northern Chile for Thermal Energy Storage. Available online: http://aip.scitation.org/doi/pdf/10.1063/1.4949112 (accessed on 29 August 2016).
- Cáceres, G.; Montané, M.; Nasirov, S.; O’Ryan, R. Review of Thermal Materials for CSP Plants and LCOE Evaluation for Performance Improvement using Chilean Strategic Minerals: Lithium Salts and Copper Foams. Sustainability 2016, 8, 106. [Google Scholar] [CrossRef]
- Reddy, R. Novel Molten Salts Thermal Energy Storage for Concentrating Solar Power Generation. Technical Report. Available online: https://www.osti.gov/scitech/biblio/1111584/ (accessed on 27 December 2016).
- Jäger-Waldau, A.; Monforti-Ferrario, F.; Banja, M.; Lacal, R. Renewable Energy Snapshots 2013. JRC Scientific and Policy Reports. Available online: http://publications.jrc.ec.europa.eu/repository/bitstream/JRC84762/jrc%20res%20final%20snapshots%202013%20.pdf (accessed on 30 August 2016).
- Energy News. Extresol 3 Rendimiento Controlado. Available online: http://www.energynews.es/articulostecnicos/Articuloextresol.pdf (accessed on 29 August 2016).
- National Renewable Energy Laboratory. Concentrating Solar Power Projects. Available online: http://www.nrel.gov/csp/solarpaces/ (accessed on 29 August 2016).
- Torresol Energy. Available online: http://www.torresolenergy.com/TORRESOL/gemasolar-plant/en (accessed on 29 August 2016).
- Azcárraga, G. Evaluating the Effectiveness of Molten Salt Storage with Solar Plants. Available online: https://www.ises.org/fileadmin/user_upload/PDF/Molten_salt_tower_plant_GA_Azcarraga.pdf (accessed on 29 August 2016).
- Cáceres, G.; Anrique, N.; Girard, A.; Degreve, J.; Baeyens, J.; Zhang, H.L. Performance of molten salt solar power towers in Chile. J. Renew. Sustain. Energ 2013, 5. [Google Scholar] [CrossRef]
- International Renewable Energy Agency. Renewable Power Generation Costs in 2014. Available online: http://www.irena.org/documentdownloads/publications/irena_re_power_costs_2014_report.pdf (accessed on 29 August 2016).
- International Renewable Energy Agency. Renewable Energy Technologies: Cost Analysis Series, Concentrating Solar Power. Available online: http://www.irena.org/documentdownloads/publications/re_technologies_cost_analysis-csp.pdf (accessed on 19 August 2016).
- Turchi, C.; Mehos, M.; Ho, C.; Kolb, G. Current and Future Costs for Parabolic Trough and Power Tower Systems in the US Market. Available online: http://www.nrel.gov/docs/fy11osti/49303.pdf (accessed on 19 August 2016).
- International Energy Agency. Technology Roadmap, Solar Thermal Electricity. Available online: https://www.iea.org/publications/freepublications/publication/technologyroadmapsolarthermalelectricity_2014edition.pdf (accessed on 29 August 2016).
- Kost, C.; Mayer, J.; Thomsen, J.; Hartmann, N.; Senkpiel, C.; Philipps, S.; Nold, S.; Lude, S.; Saad, N.; Schlegl, T. Levelized Cost of Electricity Renewable Energy Technologies. Study. Available online: https://www.ise.fraunhofer.de/en/publications/veroeffentlichungen-pdf-dateien-en/studien-und-konzeptpapiere/study-levelized-cost-of-electricity-renewable-energies.pdf (accessed on 29 August 2016).
- Short, W.; Packey, D.J.; Holt, T. A manual for the Economic Evaluation of Energy Efficiency and Renewable Energy Technologies. Technical Report NREL/TP-462-5173. Available online: http://www.nrel.gov/docs/legosti/old/5173.pdf (accessed on 29 August 2016).
- Darling, S.B.; You, F.; Veselka, T.; Velosa, A. Assumptions and the levelized cost of energy for photovoltaics. Energy Environ. Sci. 2011, 4, 3133–3139. [Google Scholar] [CrossRef]
- Branker, K.; Pathak, M.J.M.; Pearce, J.M. A review of solar photovoltaic levelized cost of electricity. Renew. Sustain. Energ Rev. 2011, 15, 4470–4482. [Google Scholar] [CrossRef]
- Centro Nacional para la Innovación y Fomento de las Energías Sustentables. Estudio de Prefactibilidad para el Desarrollo del Litio como Elemento de Transporte y Almacenamiento Térmico de la Energía Solar. Available online: http://cifes.gob.cl/wp-content/uploads/2014/08/Informe-Prefactibilidad_Solar_Litio.pdf (accessed on 29 August 2016).
- Corral, N.; Anrique, N.; Fernandes, D.; Parrado, C.; Caceres, G. Power, placement and LEC evaluation to install CSP plants in northern Chile. Renew. Sustain. Energ Rev. 2012, 16, 6678–6685. [Google Scholar] [CrossRef]
- Fox-Davies Resources Specialist. The Lithium Market. Available online: http://doc.xueqiu.com/1497add8471193fc2e583642.pdf (accessed on 29 August 2016).
- U.S. Geological Survey. Mineral Commodity Summaries. Available online: http://minerals.usgs.gov/minerals/pubs/mcs/2016/mcs2016.pdf (accessed on 29 August 2016).
- Maxwell, P. Transparent and opaque pricing: The interesting case of lithium. Resour. Pol. 2015, 45, 92–97. [Google Scholar] [CrossRef]
- Romei, V. Lithium Price on the Rise, FT Data. Available online: http://blogs.ft.com/ftdata/2016/04/14/lithium-price-on-the-rise/ (accessed on 29 August 2016).
- Citi GPS. Lithium: The Future Is Electric. Investment Themes in 2016: New normal or No Normal. Available online: https://www.citi.com/commercialbank/insights/assets/docs/investment-themes-in-2016.pdf (accessed on 11 May 2017).
- Miedema, J.H.; Moll, H.C. Lithium Availability in the EU27 for Battery-Driven Vehicles: The Impact of Recycling and Substitution on the Confrontation between Supply and Demand until2050. Resour. Pol. 2013, 38, 204–211. [Google Scholar] [CrossRef]
- Ker, P. Lithium Prices Tipped to Rise 20 Per Cent by 2017 on Demand for Electric Cars. Available online: http://www.smh.com.au/business/mining-and-resources/lithium-prices-tipped-to-rise-by-20-per-cent-by-2017-on-demand-for-electric-cars-20151026-gkid4z.html (accessed on 29 August 2016).
- Statista. The Statistical Portal. Forecast of Annual Price Averages for Lithium Chemicals Worldwide from 2015 to 2025 (in U.S. Dollars per Kilogram). Available online: https://www.statista.com/statistics/452028/average-annual-price-projection-for-lithium-chemicals-globally/ (accessed on 29 August 2016).
- Hocking, M.; Kan, J.; Young, P.; Terry, C.; Begleiter, D. Industry Lithium 101; Deutsche Bank Markets Research; Deutsche Bank AG/Sydney: Sydney, Australia, 2016. [Google Scholar]
Figure 1.
Comparison of thermal energy store by different PCMs encapsulated in a copper sphere.
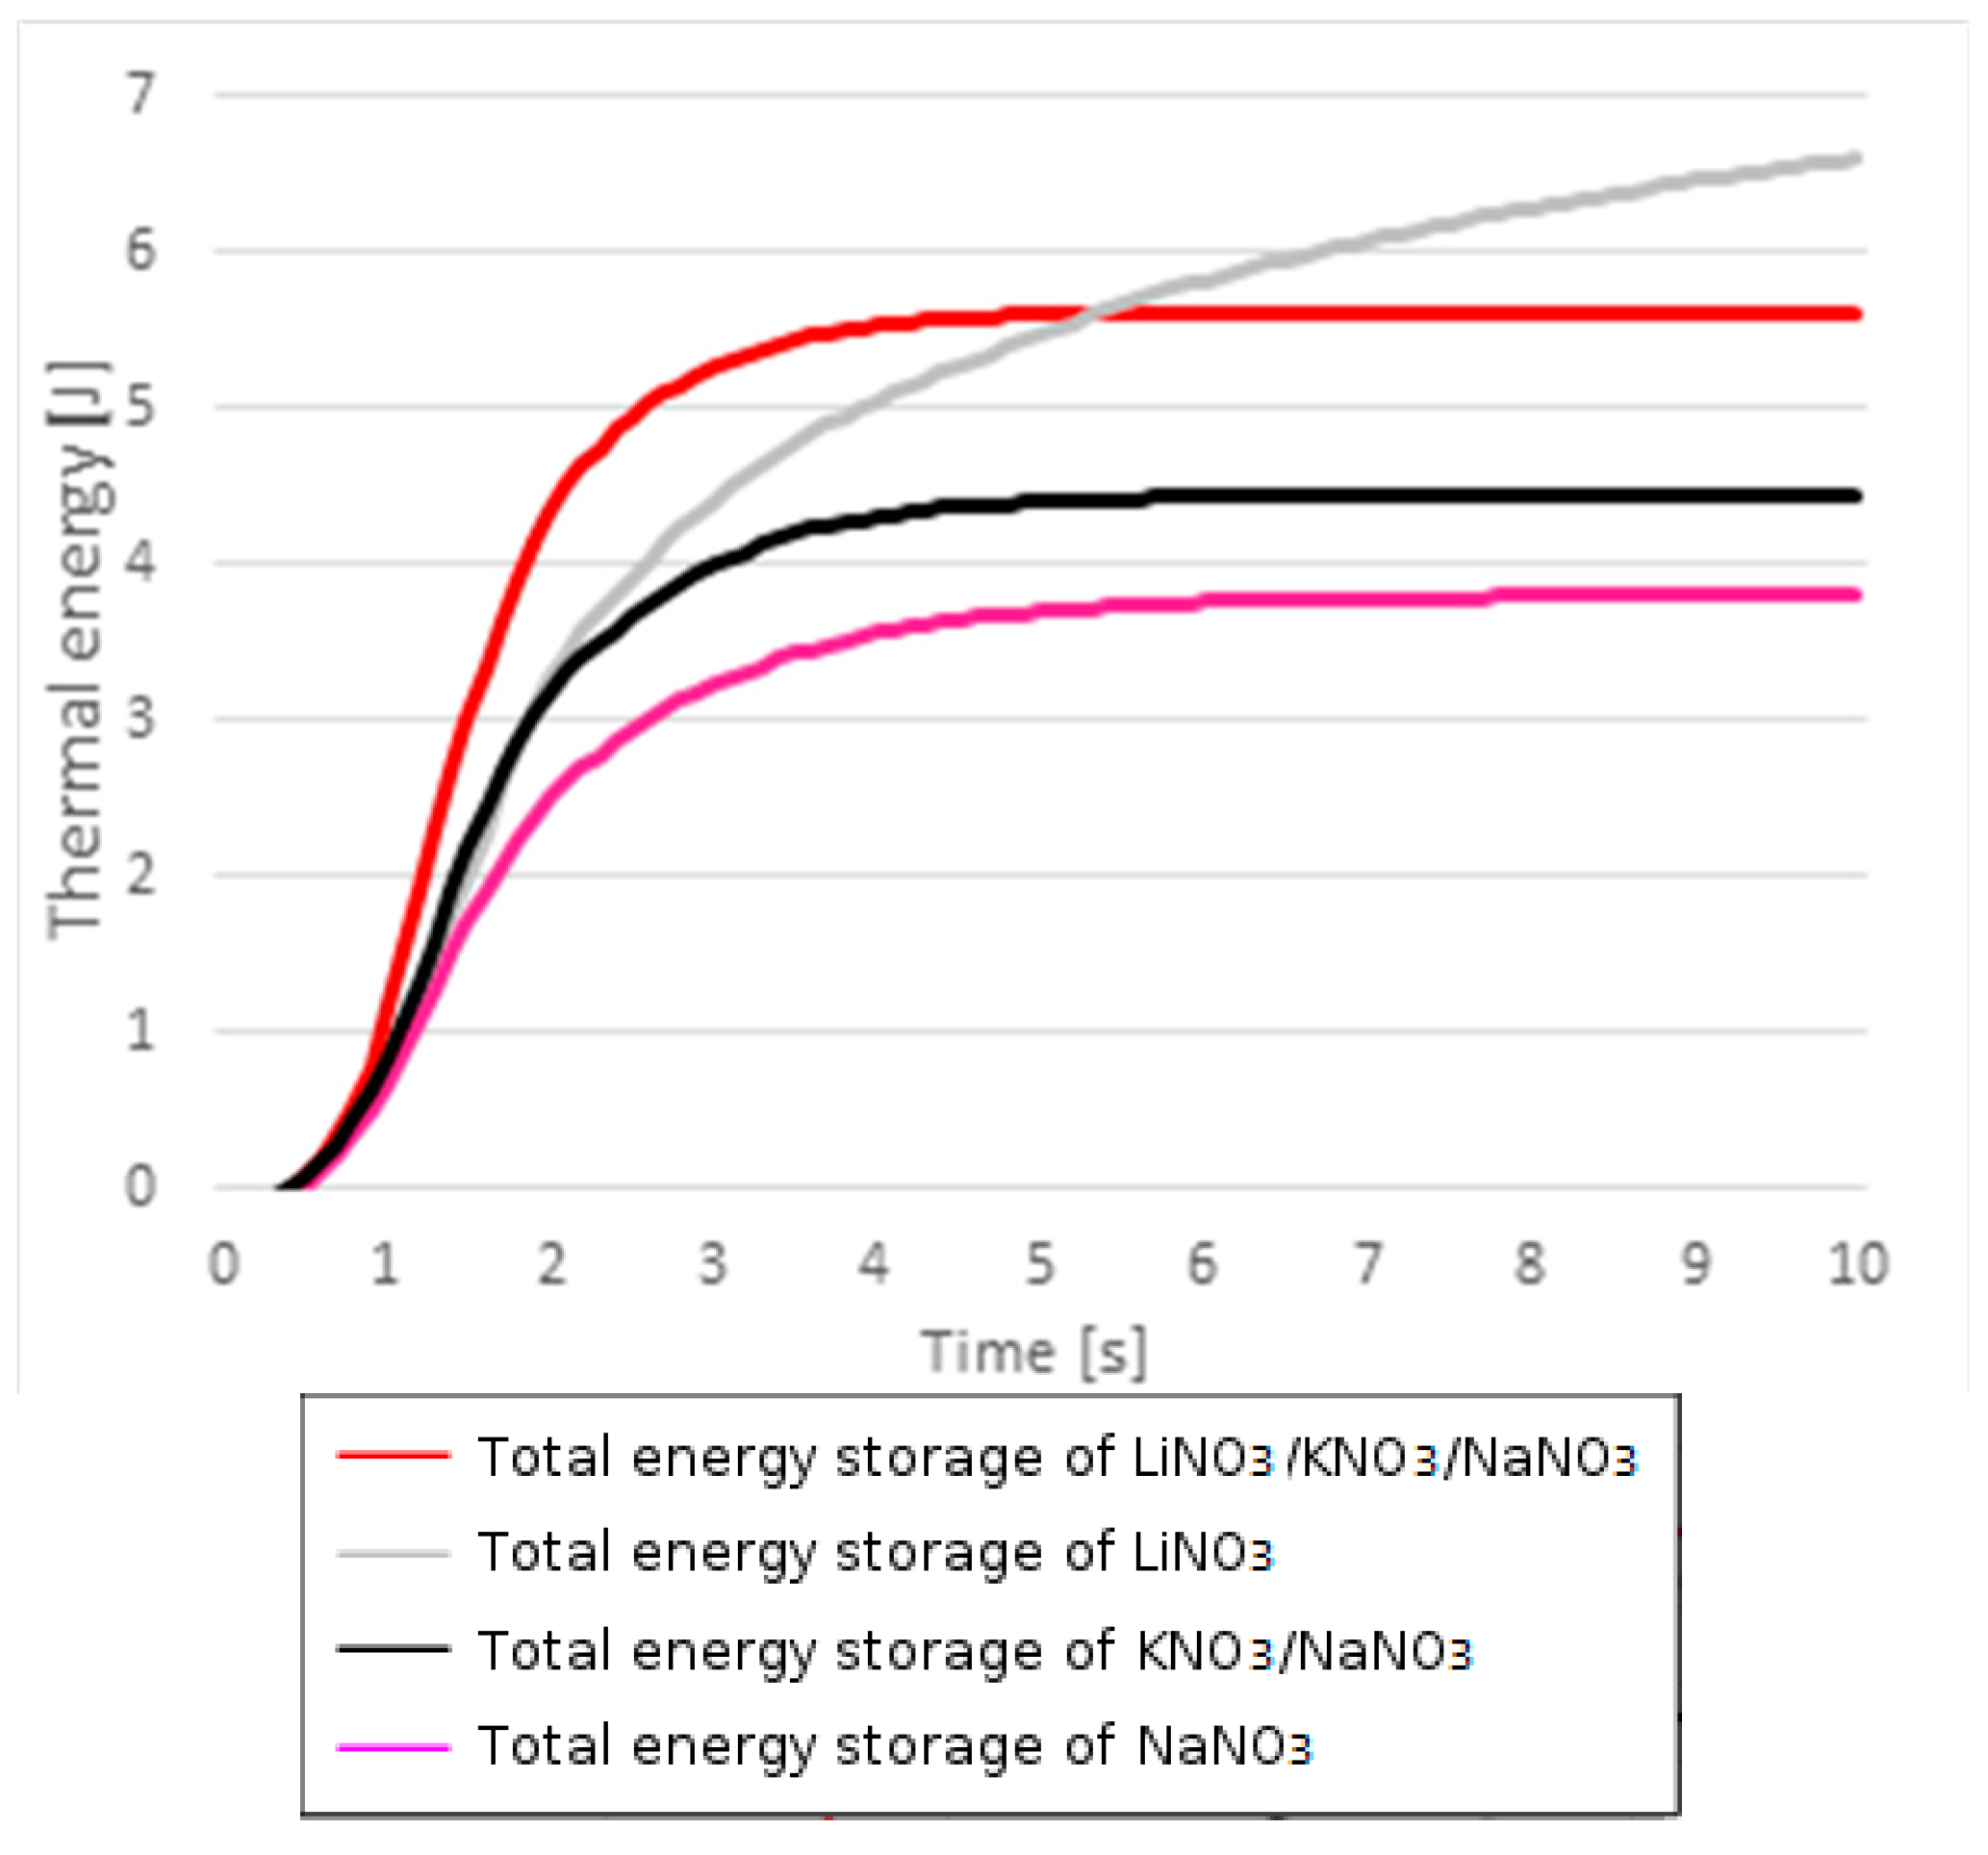
Figure 2.
Variation of LCOE with changes in lithium nitrate costs: (a) This figure registers the case of Extresol 3; (b) This figure registers the case of Gemasolar.
Figure 2.
Variation of LCOE with changes in lithium nitrate costs: (a) This figure registers the case of Extresol 3; (b) This figure registers the case of Gemasolar.
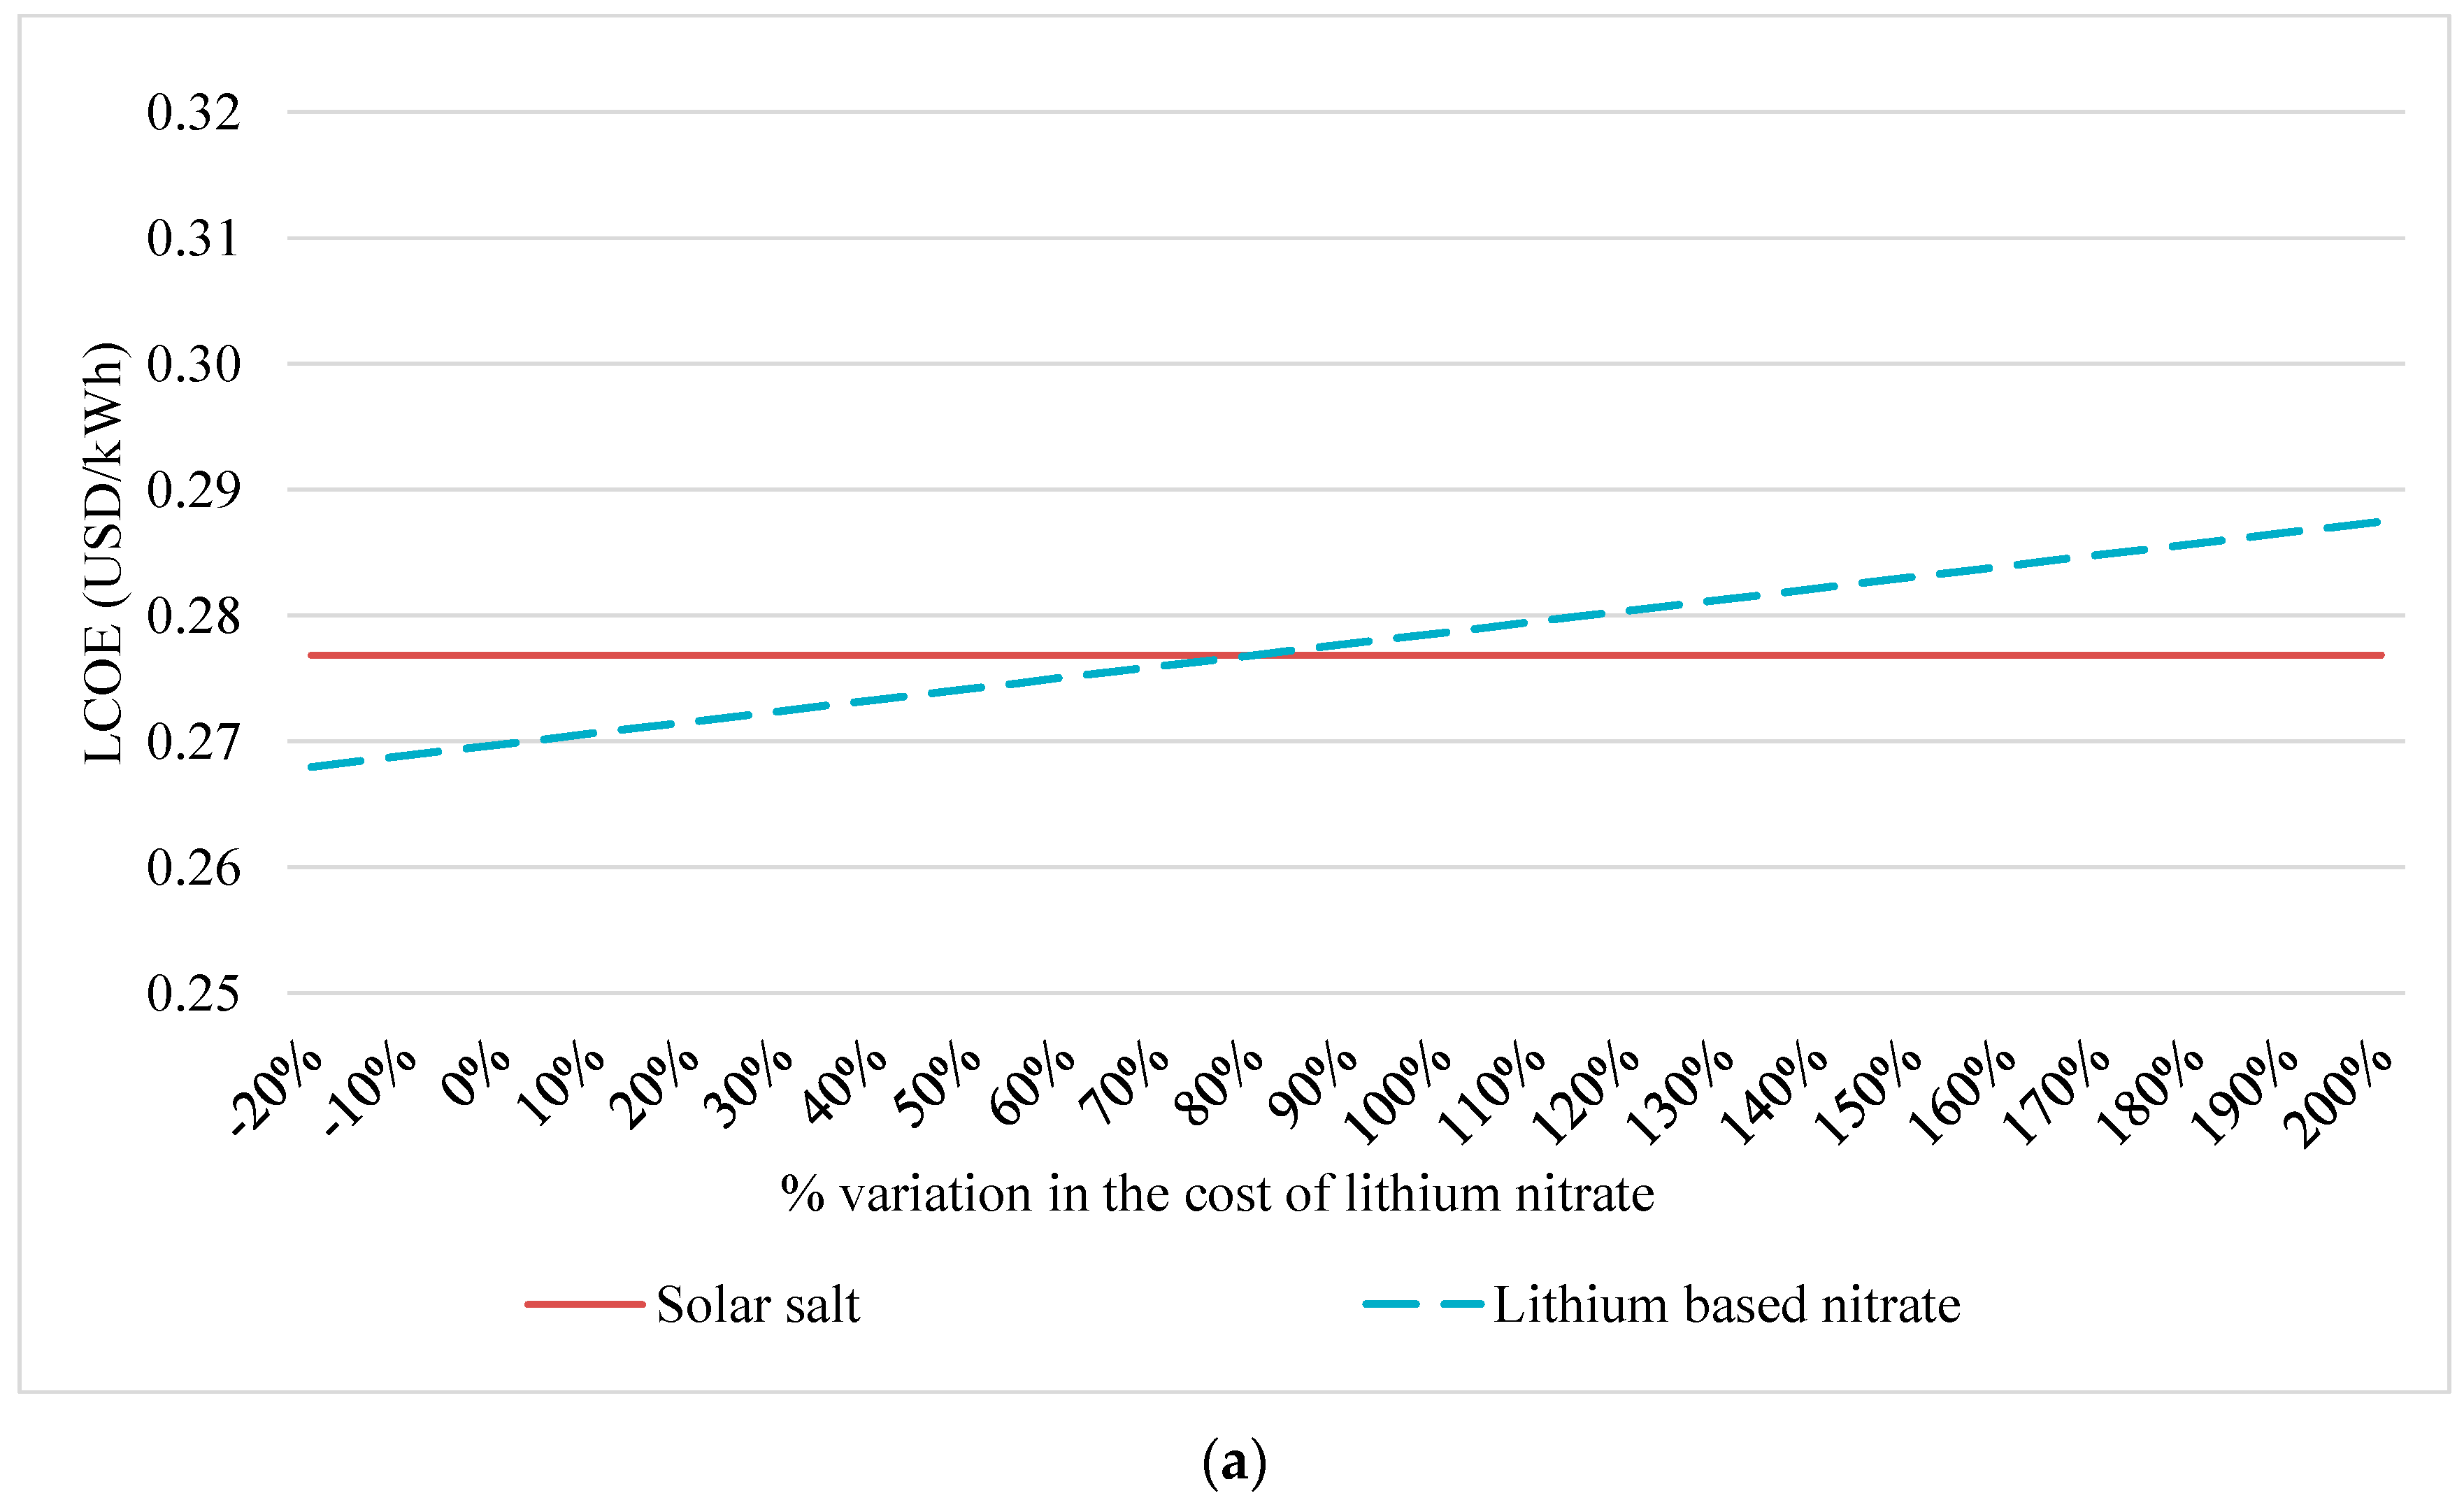

Figure 3.
Variation of LCOE with changes in NaNO3 or KNO3 Prices. (a) This figure registers the variation of Extresol 3 LCOE when the price of NaNO3 changes. (b) This figure registers the variation of Extresol 3 LCOE when the price of KNO3 changes. (c) This figure registers the variation of Gemasolar LCOE when the price of NaNO3 changes. (d) This figure registers the variation of Gemasolar LCOE when the price of KNO3 changes.
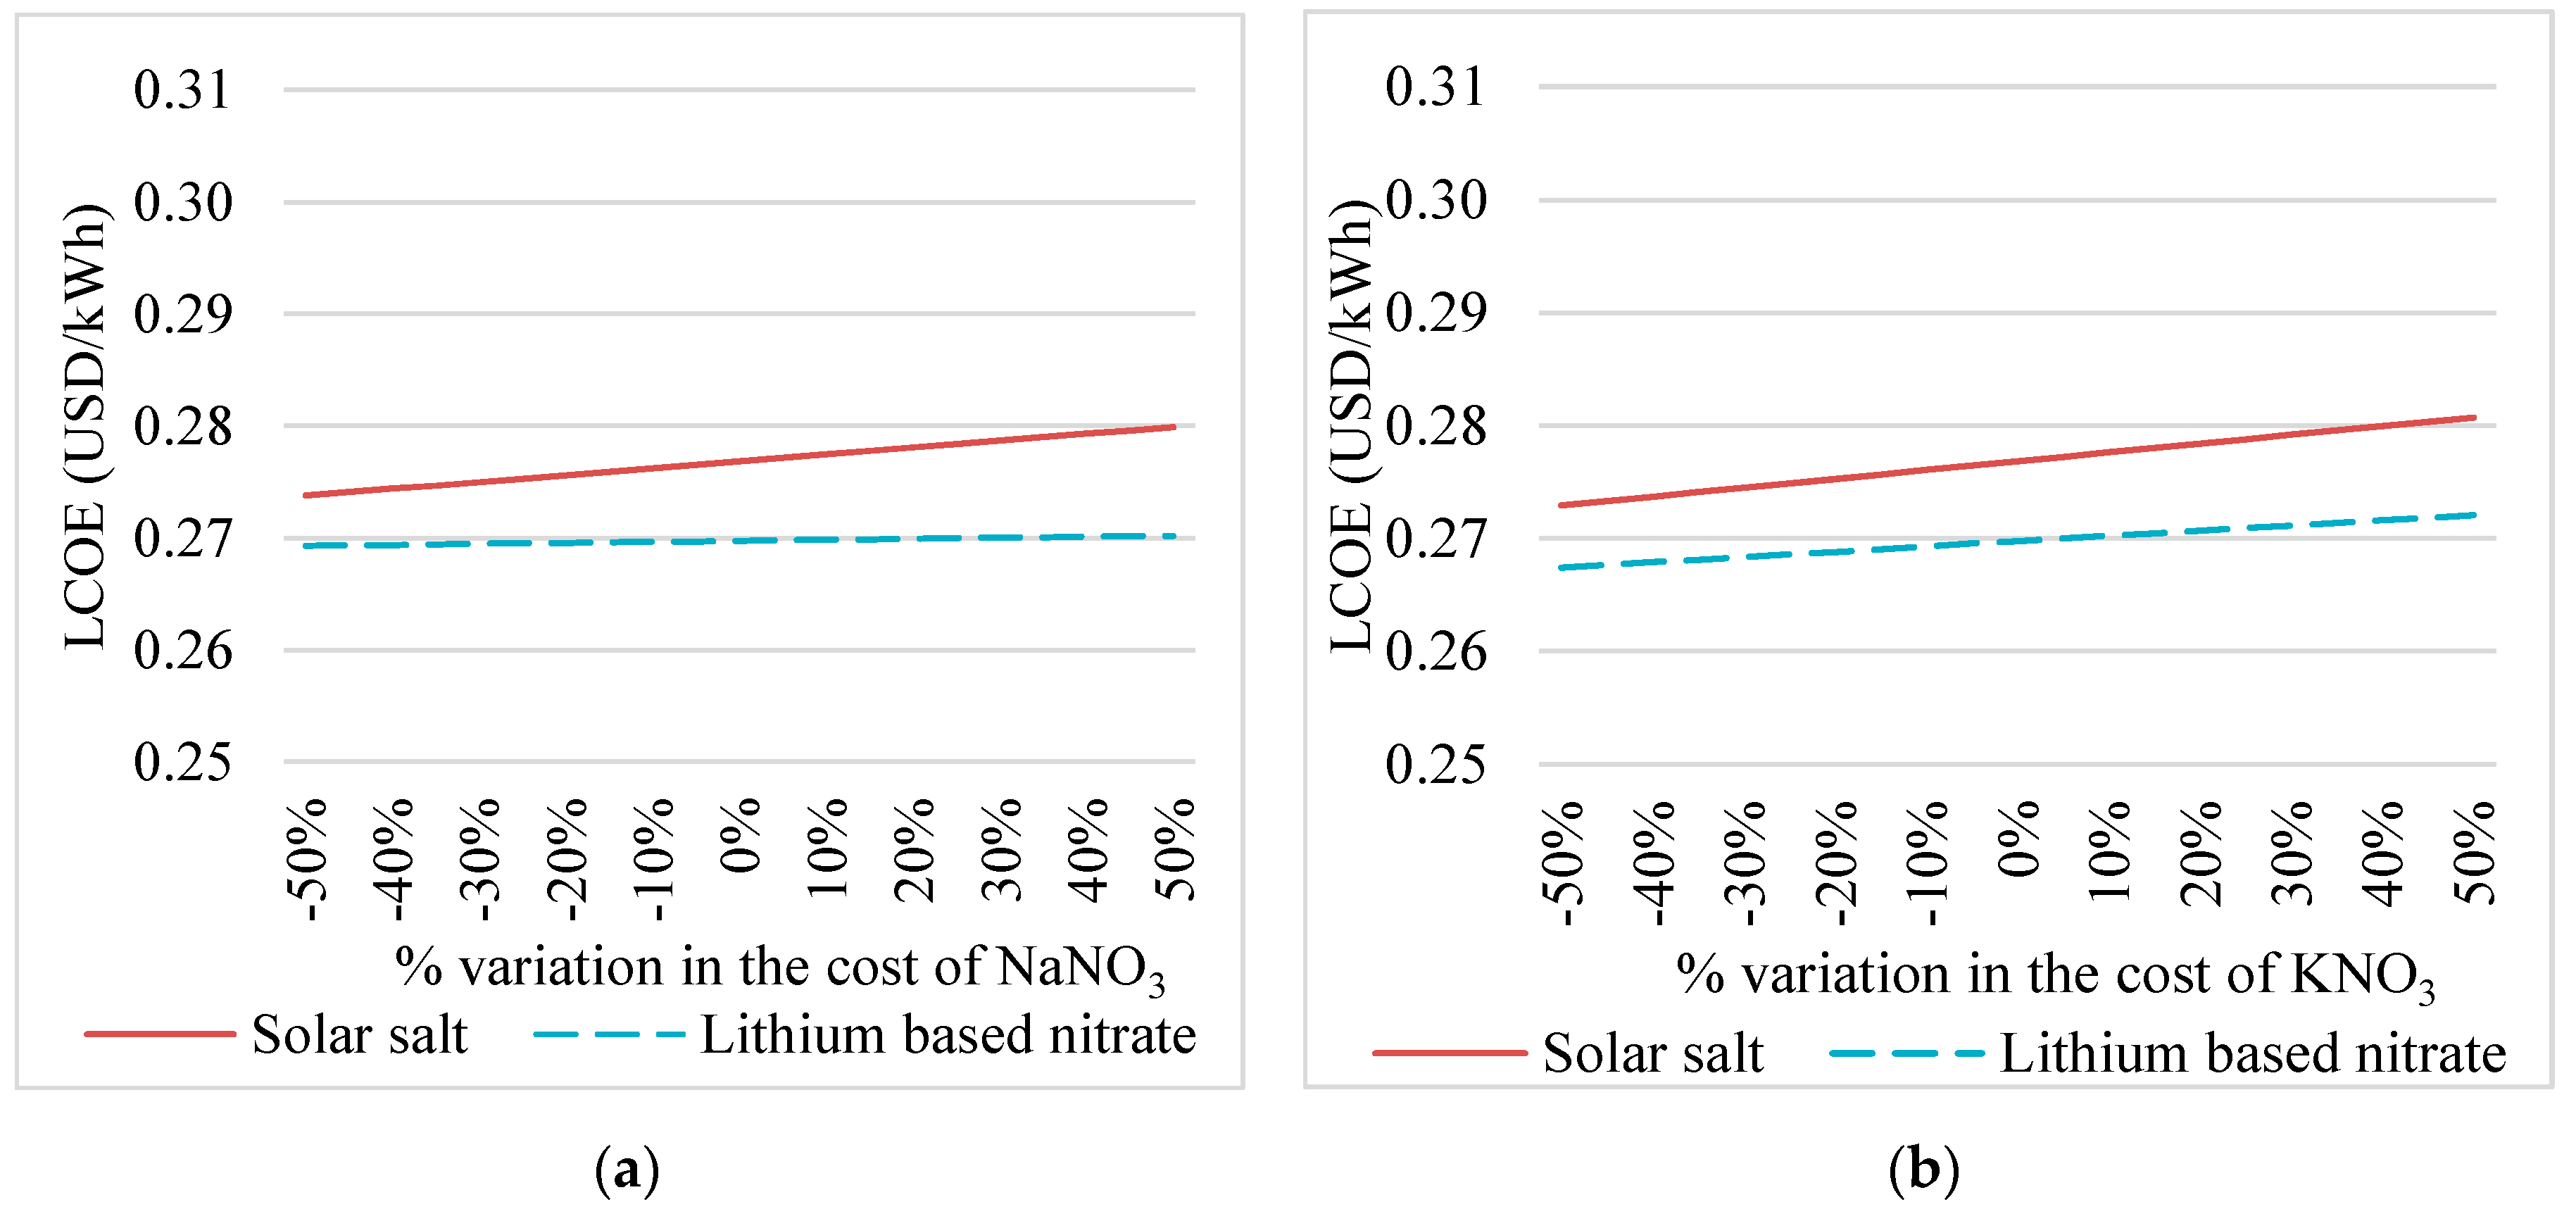

Figure 4.
Lithium Global Market [47,49,50]. (a) Lithium Mine Production (Metric Tons) (b) Lithium World Reserves (Thousands of Metric Tons) (c) World Lithium Carbonates Imports (Tons 000) (d) Lithium Carbonate Price (USD/Ton).

| Mixture | Melting Point | Thermal Stability | Heat Capacity | Density | Price |
|---|---|---|---|---|---|
| (°C) | (°C) | (kJ/kg K) | (kg/m3) | (USD/kg) | |
| 40% KNO3 + 60% NaNO3 | 222 | 588.5 | 1.50 | 1899 | 0.72 |
| 25.92% LiNO3 + 20.01% NaNO3 + 54.07% KNO3 | 117 | 435 | 1.63 | 1720 | 1.68 |
| KNO3 + NaNO2 + LiNO2 + NaNO3 | 79 | N/A | 1.50 | 1780 | 1.93 |
| KNO3 + LiNO3 + NaNO3 + MgK | 101 | 385 | 1.58 | 1710 | 1.54 |
| LiNO3 + NaNO2 + NaNO3 + KNO3 | 99 | 425 | 1.56 | 1780 | 1.81 |
| LiNO3 + NaNO2 + NaNO3 + KNO2 + KNO3 | 95.7 | 435 | 1.55 | 1780 | 1.80 |
| 30% LiNO3 + 60% KNO3 + 10% Ca(NO3)2 | 132 | 567.2 | 1.4 | 1773 | 1.83 |
| 53% KNO3 + 29% LiNO3 + 18% NaNO3 | 120 | 540 | 1.64 | 1780 | 1.79 |
| 20% LiNO3 + 52% KNO3 + 28% NaNO3 | 130 | 600.5 | 1.09 | N/A | 1.47 |
Table 2.
Extresol 3 and Gemasolar Technical parameters.
| Parameter | Extresol 3 | Gemasolar |
|---|---|---|
| Capacity (MWe) | 50 [30,32] | 19.9 [32,33,35] |
| TES concept | Active indirect [32] | Active direct [34,35] |
| TES capacity (Hours) | 7.5 [30,31] | 15 [32,33,35] |
| Type of HSM | Solar salt [31] | Solar salt [30,35] |
| Amount of HSM (tons) | 28,500 [31] | 7900 [34] |
| Diameter of TES tanks (m) | 38 [31] | 23 [34] |
| Height of TES tanks (m) | 14 [31] | 10.5 [34] |
| Annual Generation (MWhe) | 158,000 [32] | 110,000 [32,33,34,35] |
| Type of HTF | Diphenyl/Biphenyl oxide [32] | Solar salt [32,34] |
| Min. working temperature (°C) | 293 [32] | 290 [32] |
| Max. working temperature (°C) | 393 [32] | 565 [32,35] |
Table 3.
Extresol 3 and Gemasolar economic parameters.
| Parameter | Extresol 3 | Gemasolar |
|---|---|---|
| Total investment (MM USD) | 390 [30,32] | 299 [30,32] |
| Solar salts cost (MM USD) 1 | 20.8 | 5.7 |
| Tanks cost (MM USD) | 7.1 | 1.8 |
| Annual O&M (MM USD) | 2.4 [36,37] | 1.3 [36,38] |
Table 4.
Extresol 3 LCOE per scenario [28].
Table 4.
Extresol 3 LCOE per scenario [28].
| 40% KNO3 + 60% NaNO3 (Solar Salt) | 25.92% LiNO3 + 20.01% NaNO3 + 54.07% KNO3 | KNO3 + LiNO3 + NaNO3 + MgK | LiNO3 + NaNO2 + NaNO3 + KNO2 + KNO3 | 53% KNO3 + 29% LiNO3 + 18% NaNO3 | ||
|---|---|---|---|---|---|---|
| Salts volume | m3 | 15,271 | 7543 | 7266 | 6964 | 7352 |
| Total TES Module cost | MM USD | 27.86 | 25.35 | 22.46 | 25.50 | 26.78 |
| LCOE (d = 10%) | USD/kWh | 0.2768 | 0.2698 | 0.2679 | 0.2699 | 0.2707 |
| LCOE variation (d = 10%) 1 | % | - | ↓ 2.6% | ↓ 3.2% | ↓ 2.5% | ↓ 2.2% |
| LCOE (d = 7%) | USD/kWh | 0.2139 | 0.2085 | 0.2070 | 0.2085 | 0.2092 |
| LCOE variation (d = 7%) 1 | % | - | ↓ 2.5% | ↓ 3.2% | ↓ 2.5% | ↓ 2.2% |
1 This percentage is calculated by dividing the LCOE of lithium based salts with the LCOE of solar salt, both for the same discount rate. Arrows pointing down are a reduction in the LCOE corresponding to number next to the arrow.
Table 5.
Gemasolar LCOE per scenario [28].
Table 5.
Gemasolar LCOE per scenario [28].
| 40% KNO3 + 60% NaNO3 (Solar Salt) | 30% LiNO3 + 60% KNO3 + 10% Ca(NO3)2 | 53% KNO3 + 29% LiNO3 + 18% NaNO3 | ||
|---|---|---|---|---|
| Salts volume | m3 | 4160 | 3593 | 3188 |
| Total TES Module cost | MM USD | 7.77 | 13.47 | 11.75 |
| LCOE (d = 10%) | USD/kWh | 0.3001 | 0.2996 | 0.2980 |
| LCOE variation (d = 10%) 1 | % | - | ↓ 0.16% | ↓ 0.71 % |
| LCOE (d = 7%) | USD/kWh | 0.2308 | 0.2304 | 0.2291 |
| LCOE variation (d = 7%)1 | % | - | ↓ 0.19% | ↓ 0.72% |
1 This percentage is calculated by dividing the LCOE of lithium based salts with the LCOE of solar salt. Arrows pointing down are a reduction in the LCOE corresponding to number next to the arrow.
© 2017 by the authors. Licensee MDPI, Basel, Switzerland. This article is an open access article distributed under the terms and conditions of the Creative Commons Attribution (CC BY) license (http://creativecommons.org/licenses/by/4.0/).
Share and Cite
MDPI and ACS Style
Montané, M.; Cáceres, G.; Villena, M.; O’Ryan, R. Techno-Economic Forecasts of Lithium Nitrates for Thermal Storage Systems. Sustainability 2017, 9, 810. https://doi.org/10.3390/su9050810
AMA Style
Montané M, Cáceres G, Villena M, O’Ryan R. Techno-Economic Forecasts of Lithium Nitrates for Thermal Storage Systems. Sustainability. 2017; 9(5):810. https://doi.org/10.3390/su9050810
Chicago/Turabian StyleMontané, Macarena, Gustavo Cáceres, Mauricio Villena, and Raúl O’Ryan. 2017. "Techno-Economic Forecasts of Lithium Nitrates for Thermal Storage Systems" Sustainability 9, no. 5: 810. https://doi.org/10.3390/su9050810
Note that from the first issue of 2016, this journal uses article numbers instead of page numbers. See further details here.