
Multiple Criteria Decision Making (MCDM) Based Economic Analysis of Solar PV System with Respect to Performance Investigation for Indian Market


Abstract
:1. Introduction
2. Literature Review
3. Present Scenario of Solar Energy in India
4. Solar Photovoltaic (PV) System
5. Solar PV System Cost
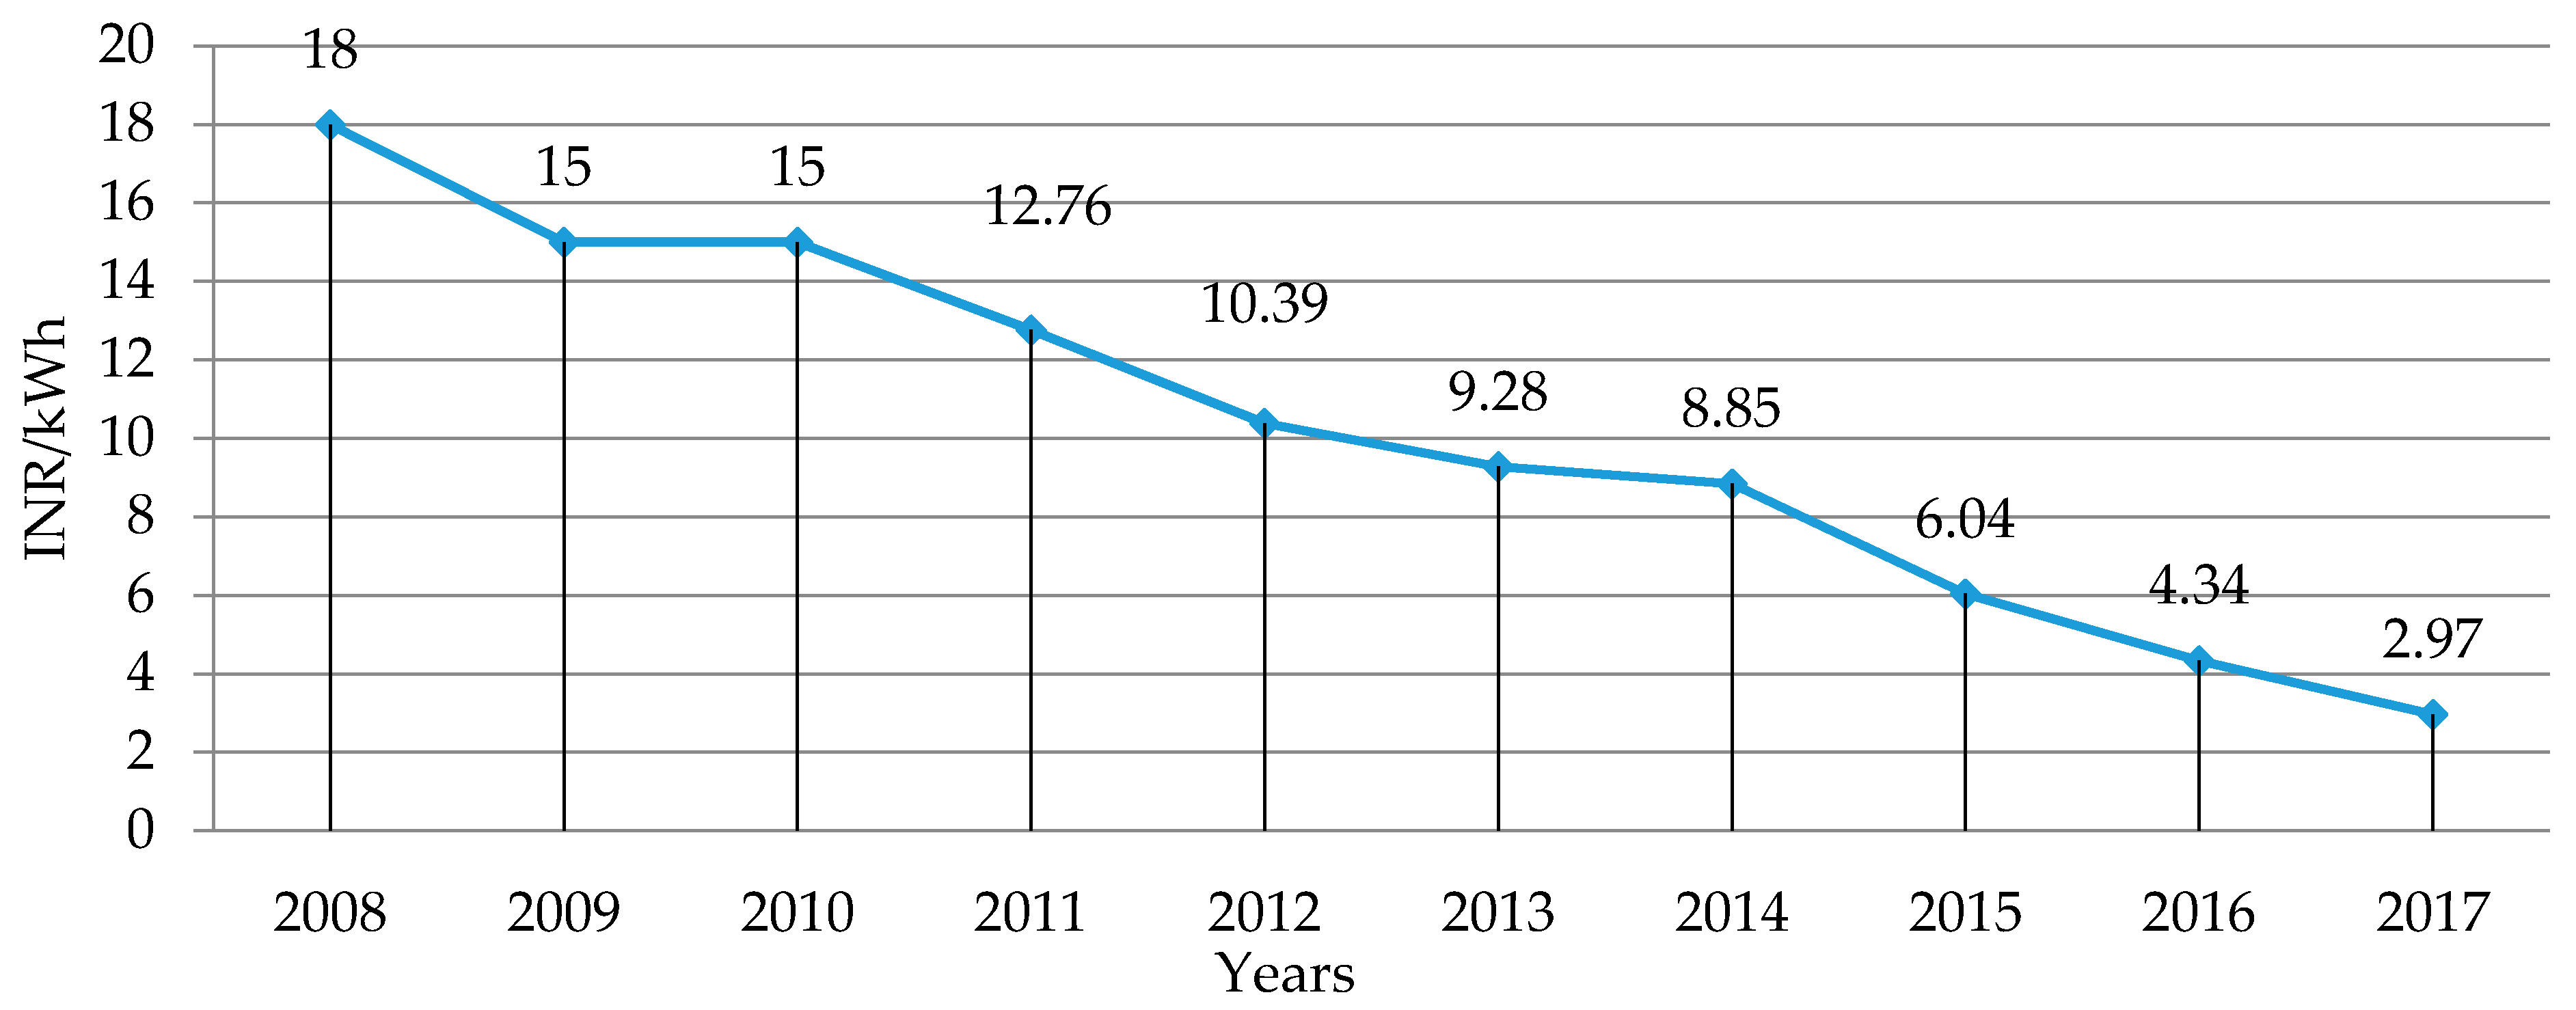
6. Electricity Tariff in India
7. Economic Analysis of Solar Tariffs in India
- (1).
- Site weather condition (e.g., daily solar insolation and sunshine hours, ambient temperature, and snow/frost duration)
- (2).
- System components (e.g., PV module, inverter cost, cables and other electrical components cost)
- (3).
- Site economic parameters (e.g., inflation in price of installation, and operation and maintenance costs)
- (4).
- Site electricity price; (local state tariff, type of connections (HT/LT), group captive tariff and Wheeling and Banking charges)
- (5).
- Government policy issues (includes tax exception and deduction, investment incentives and supports) and economic life of the system [18];
- (6).
- Architectonic aspects
- Identifying the building roof surfaces such as flat and slanted
- Estimating the number of floors for every building
- Classification of roof shapes [19]
- (7).
- Energy aspects
- Estimation of electricity produced from each floor by the PV systems
- Estimation of electricity consumed by each house
- Estimation of energy cover factor [19].
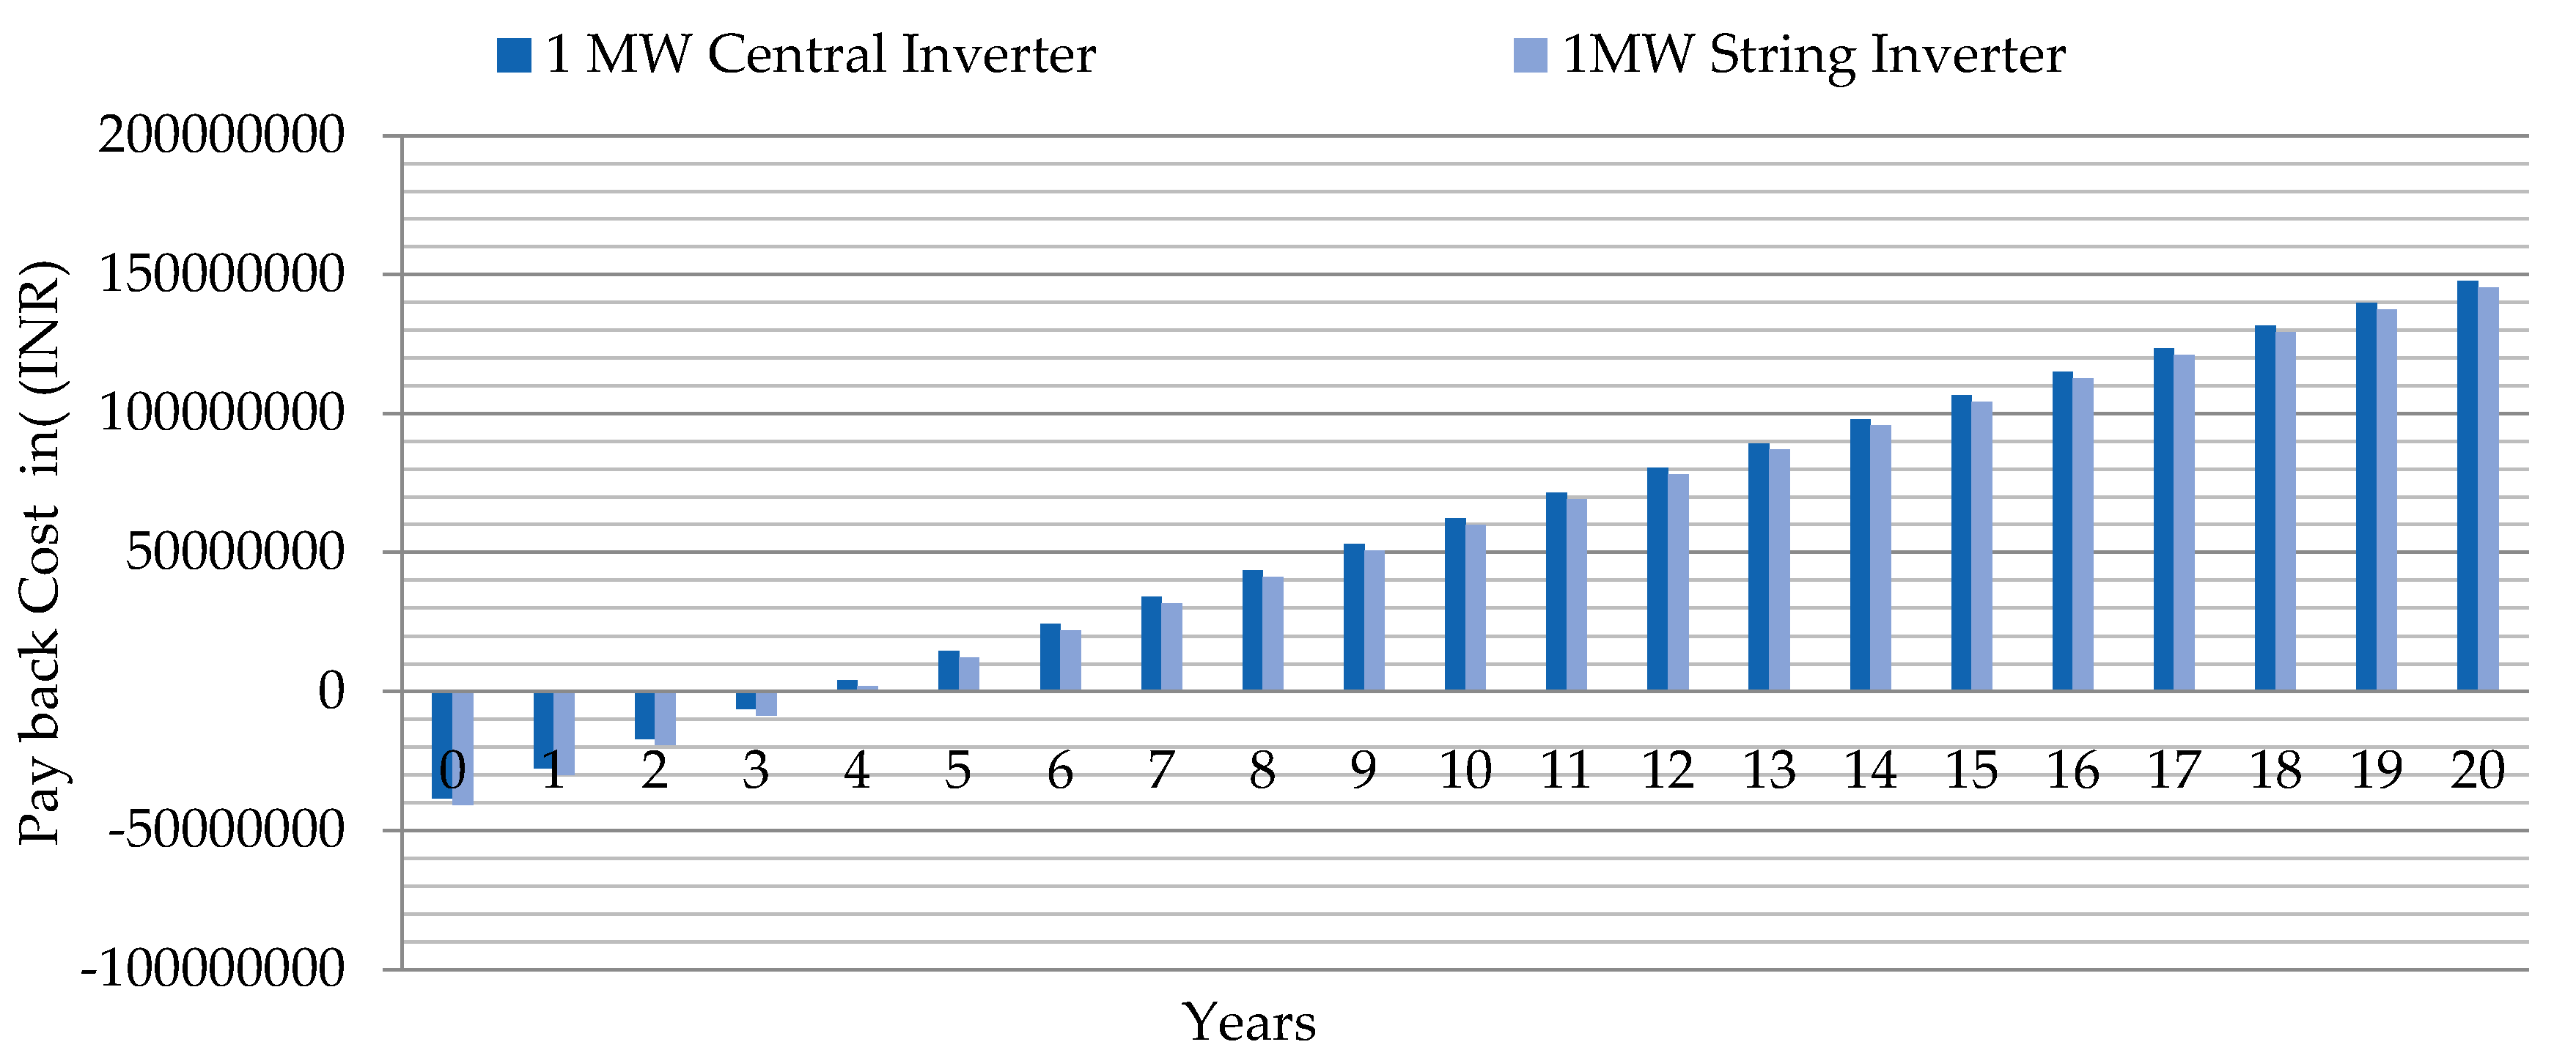
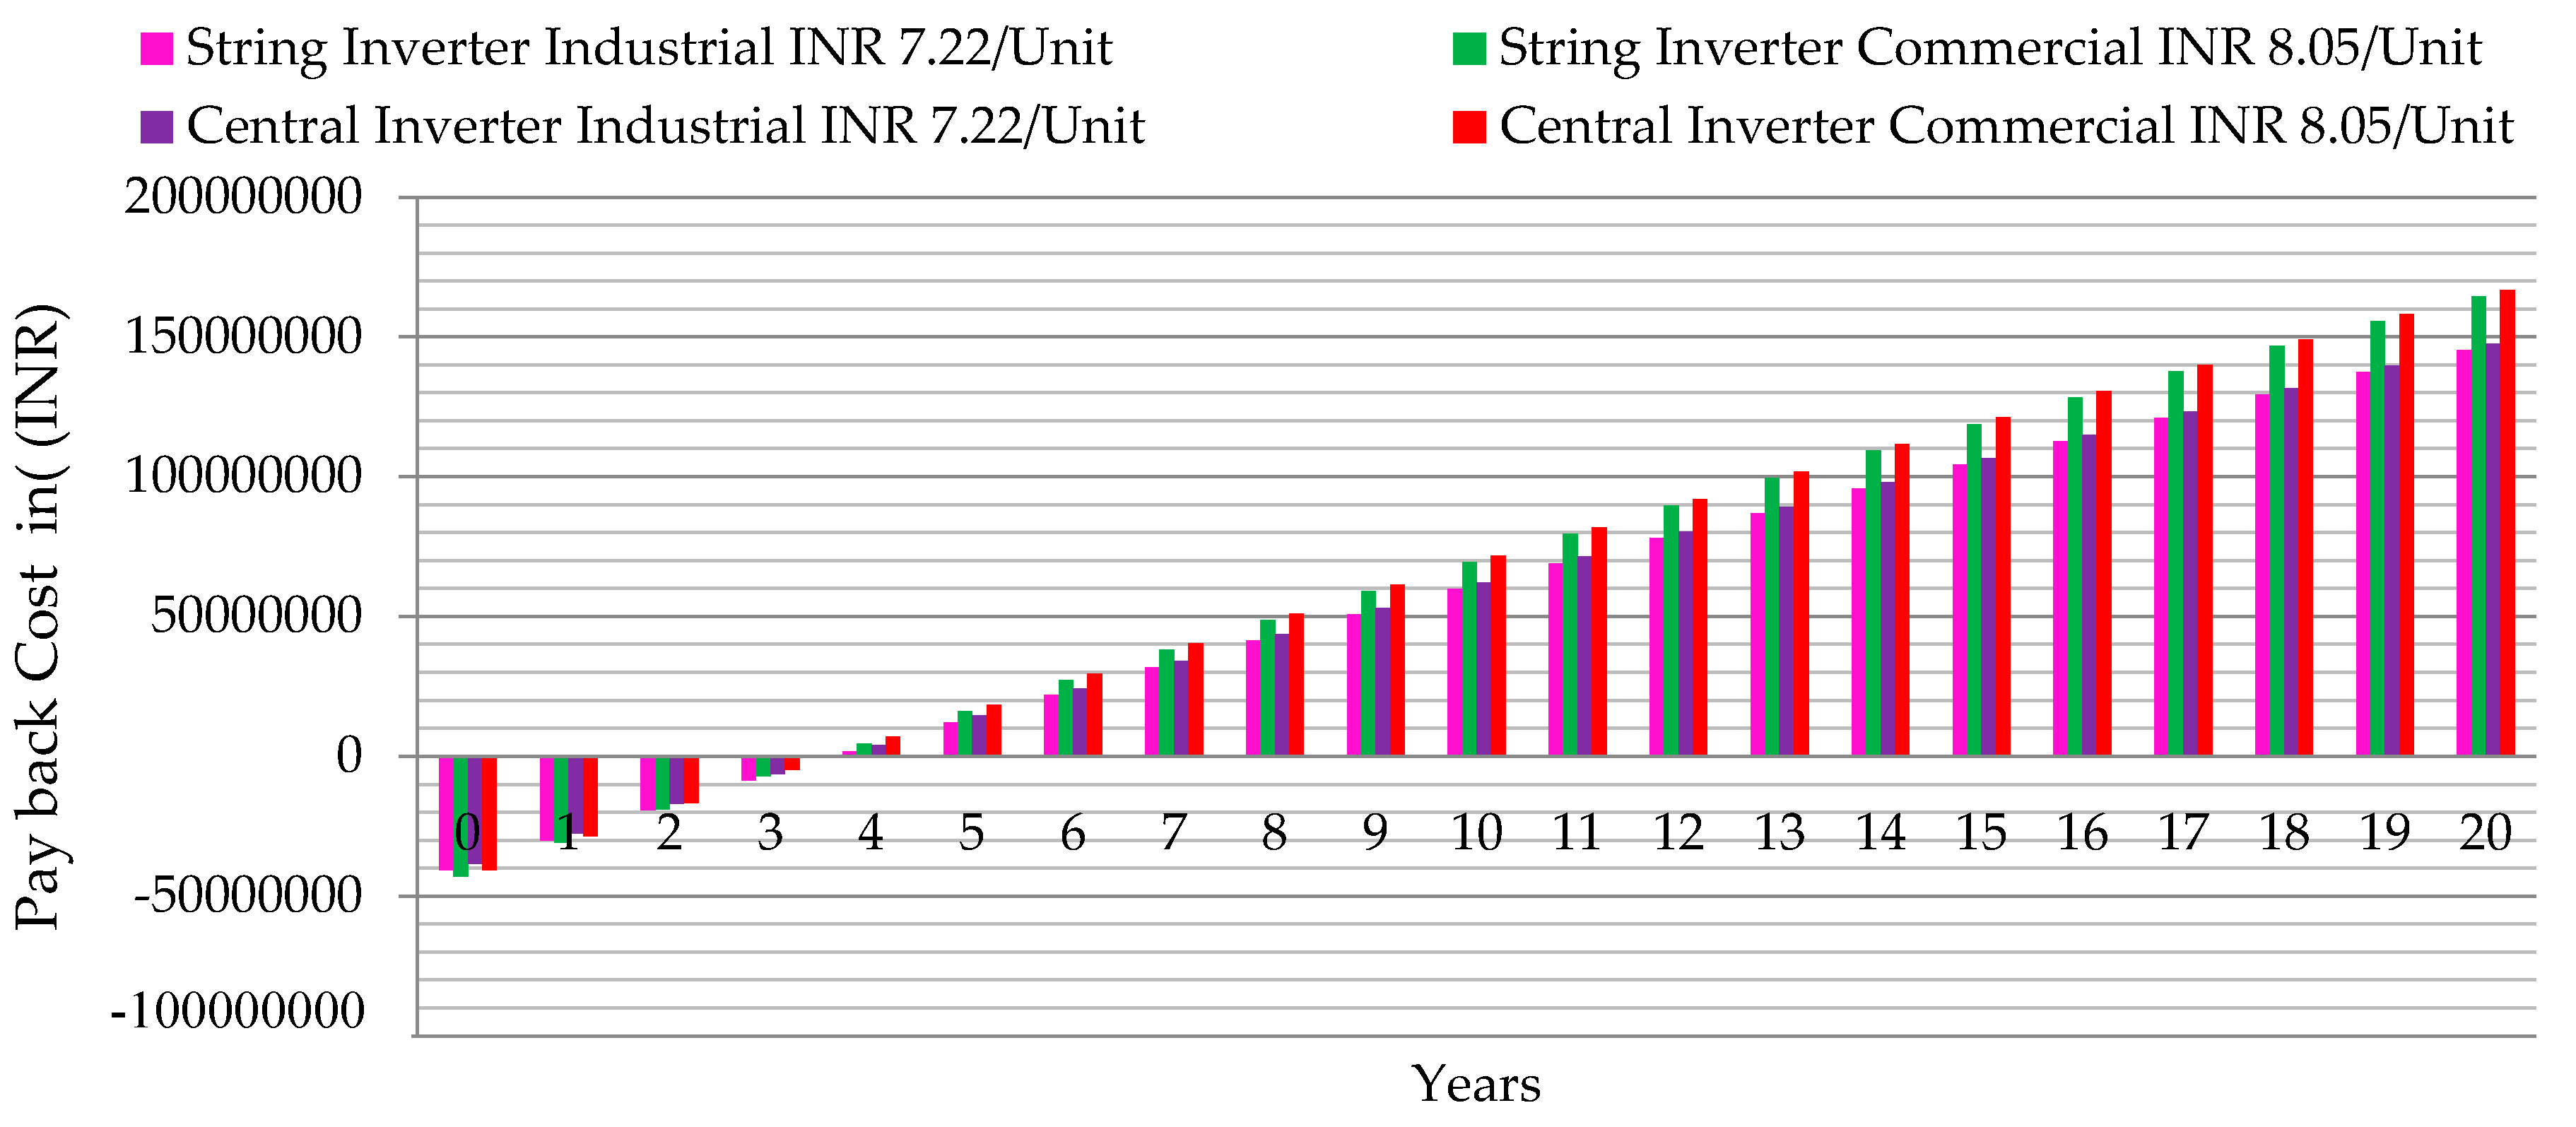
8. Pay Back Analysis of Solar PV System
9. Cost Consideration for MW Solar PV Power Plant
9.1. Term (or PPA Life)
9.2. Subsidy and Accelerated Depreciation (AD)
10. Grid Parity
11. Levelized Cost of Energy, Net Present Value and Internal Rate of Return (IRR)
12. Impact of Demonetization
12.1. High Costs of Equity and Debt
12.2. Sensitivity to Capital Costs
12.3. Sensitivity to PPA Term
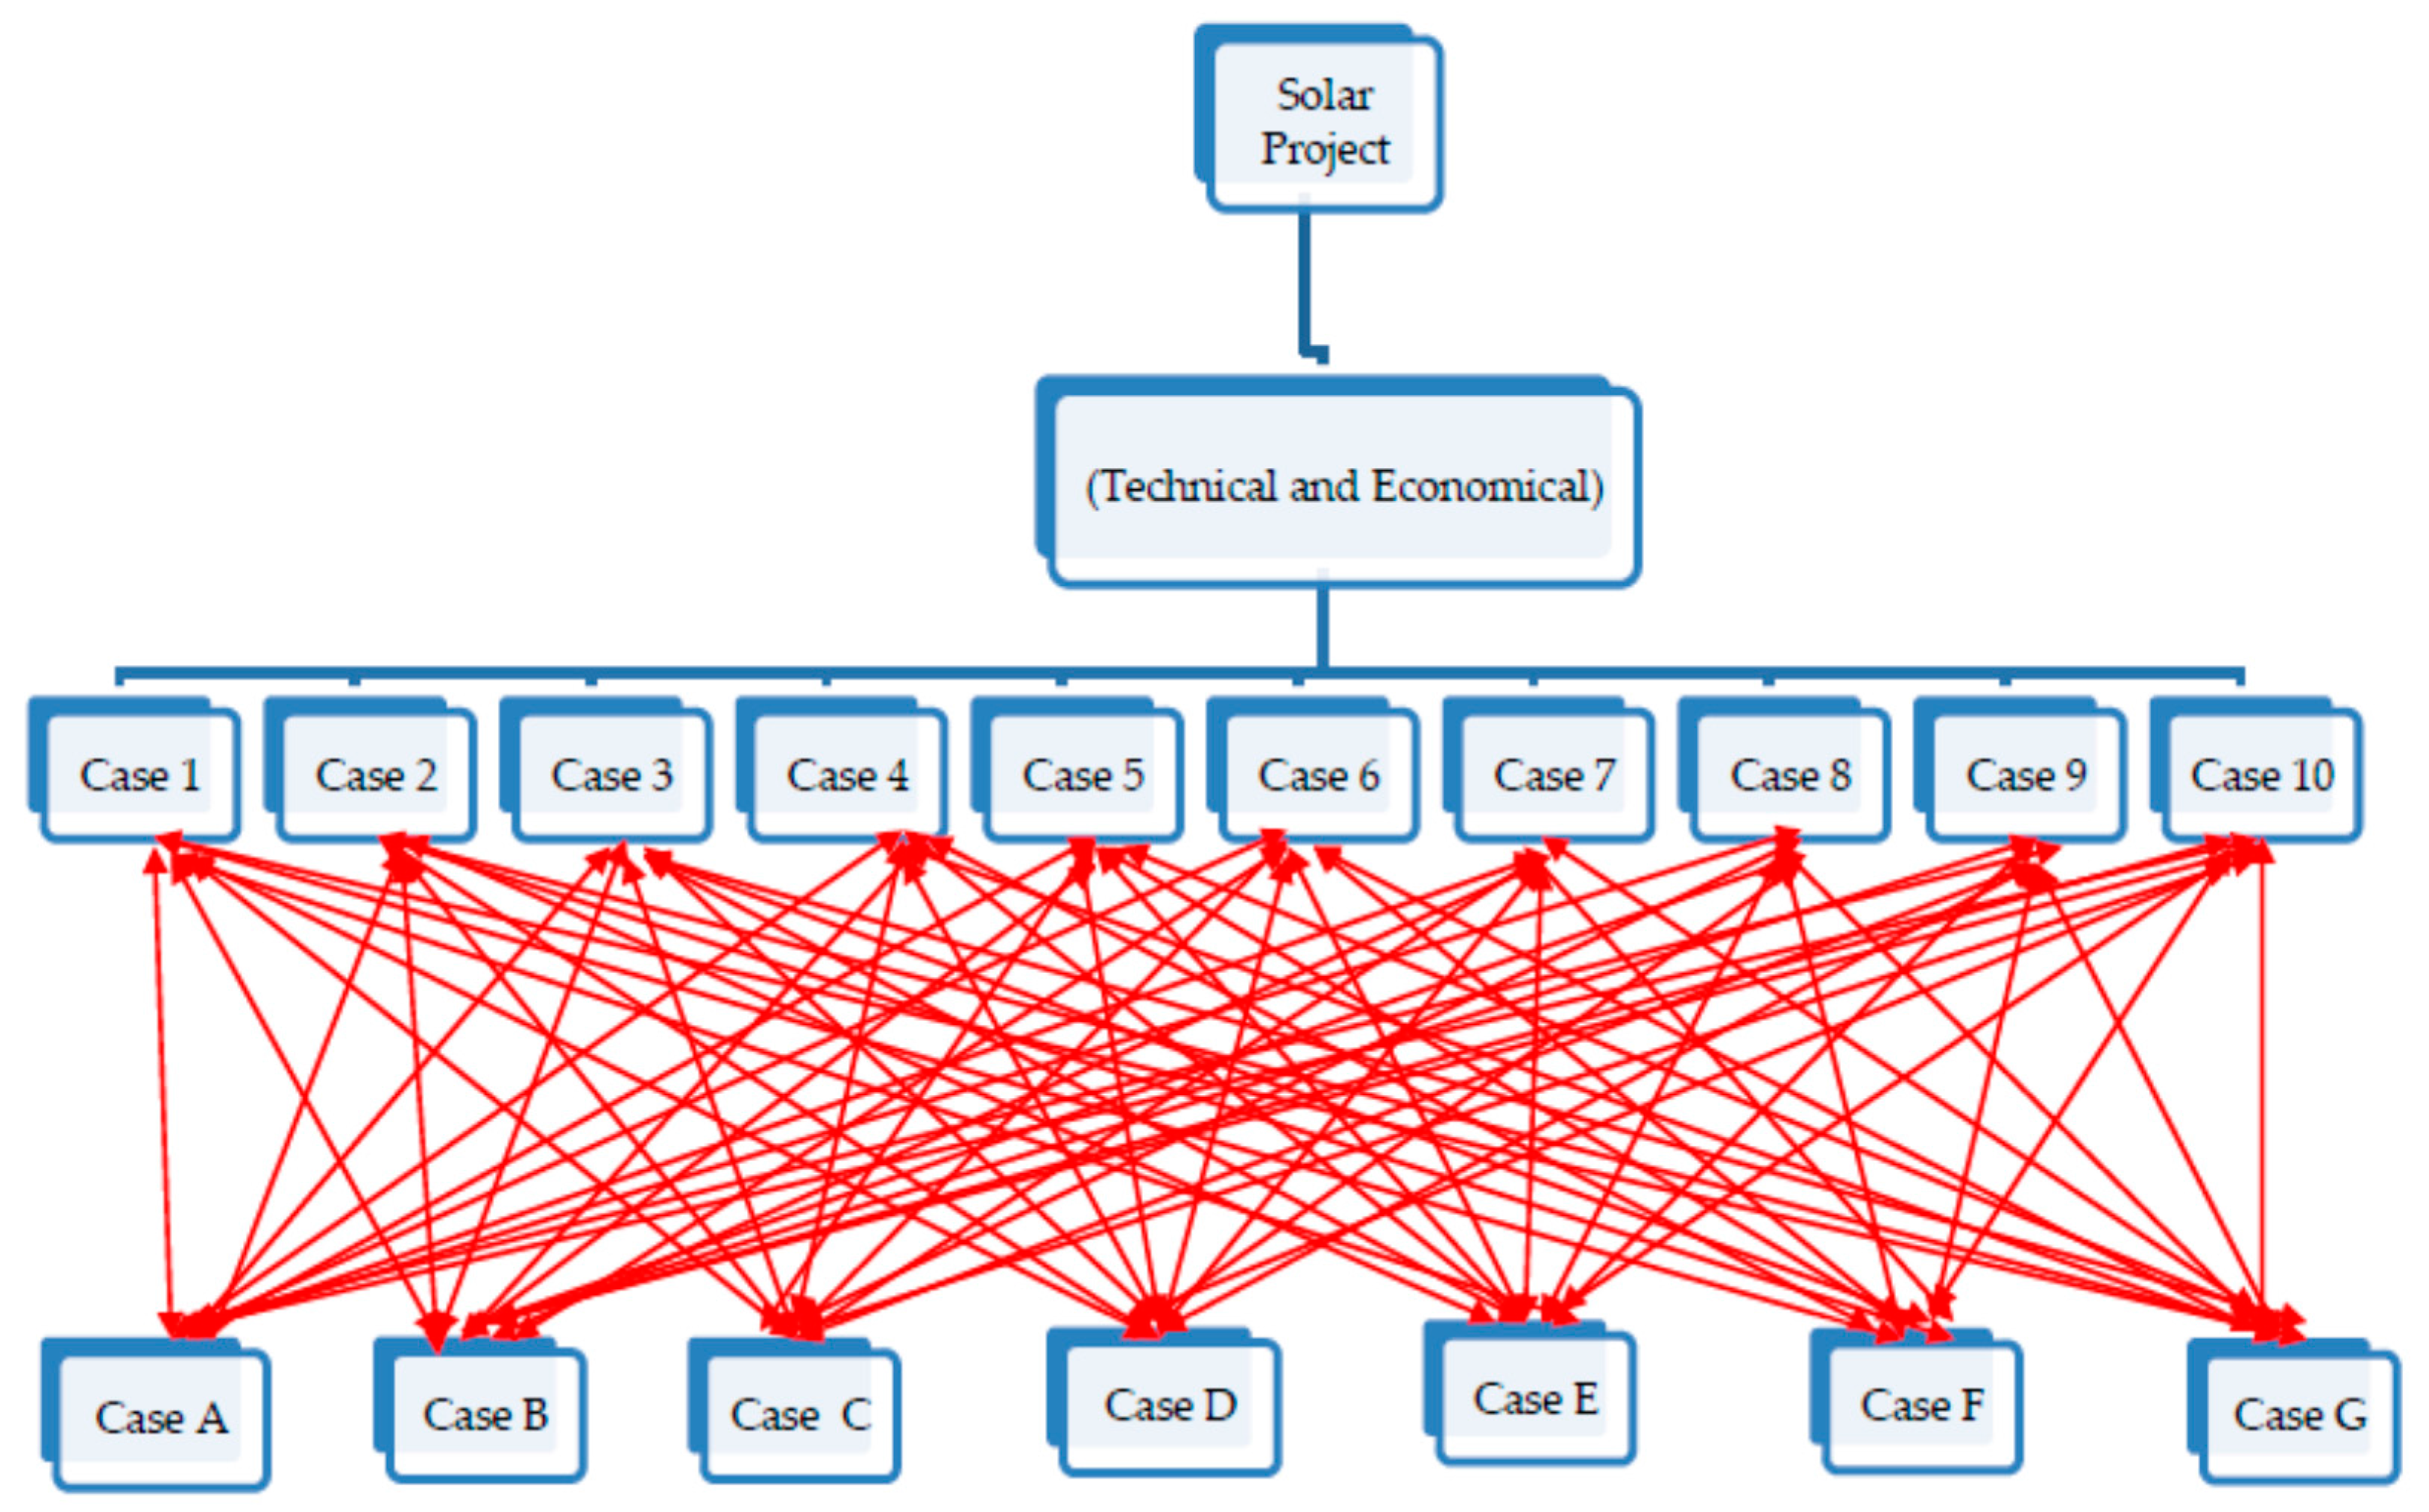
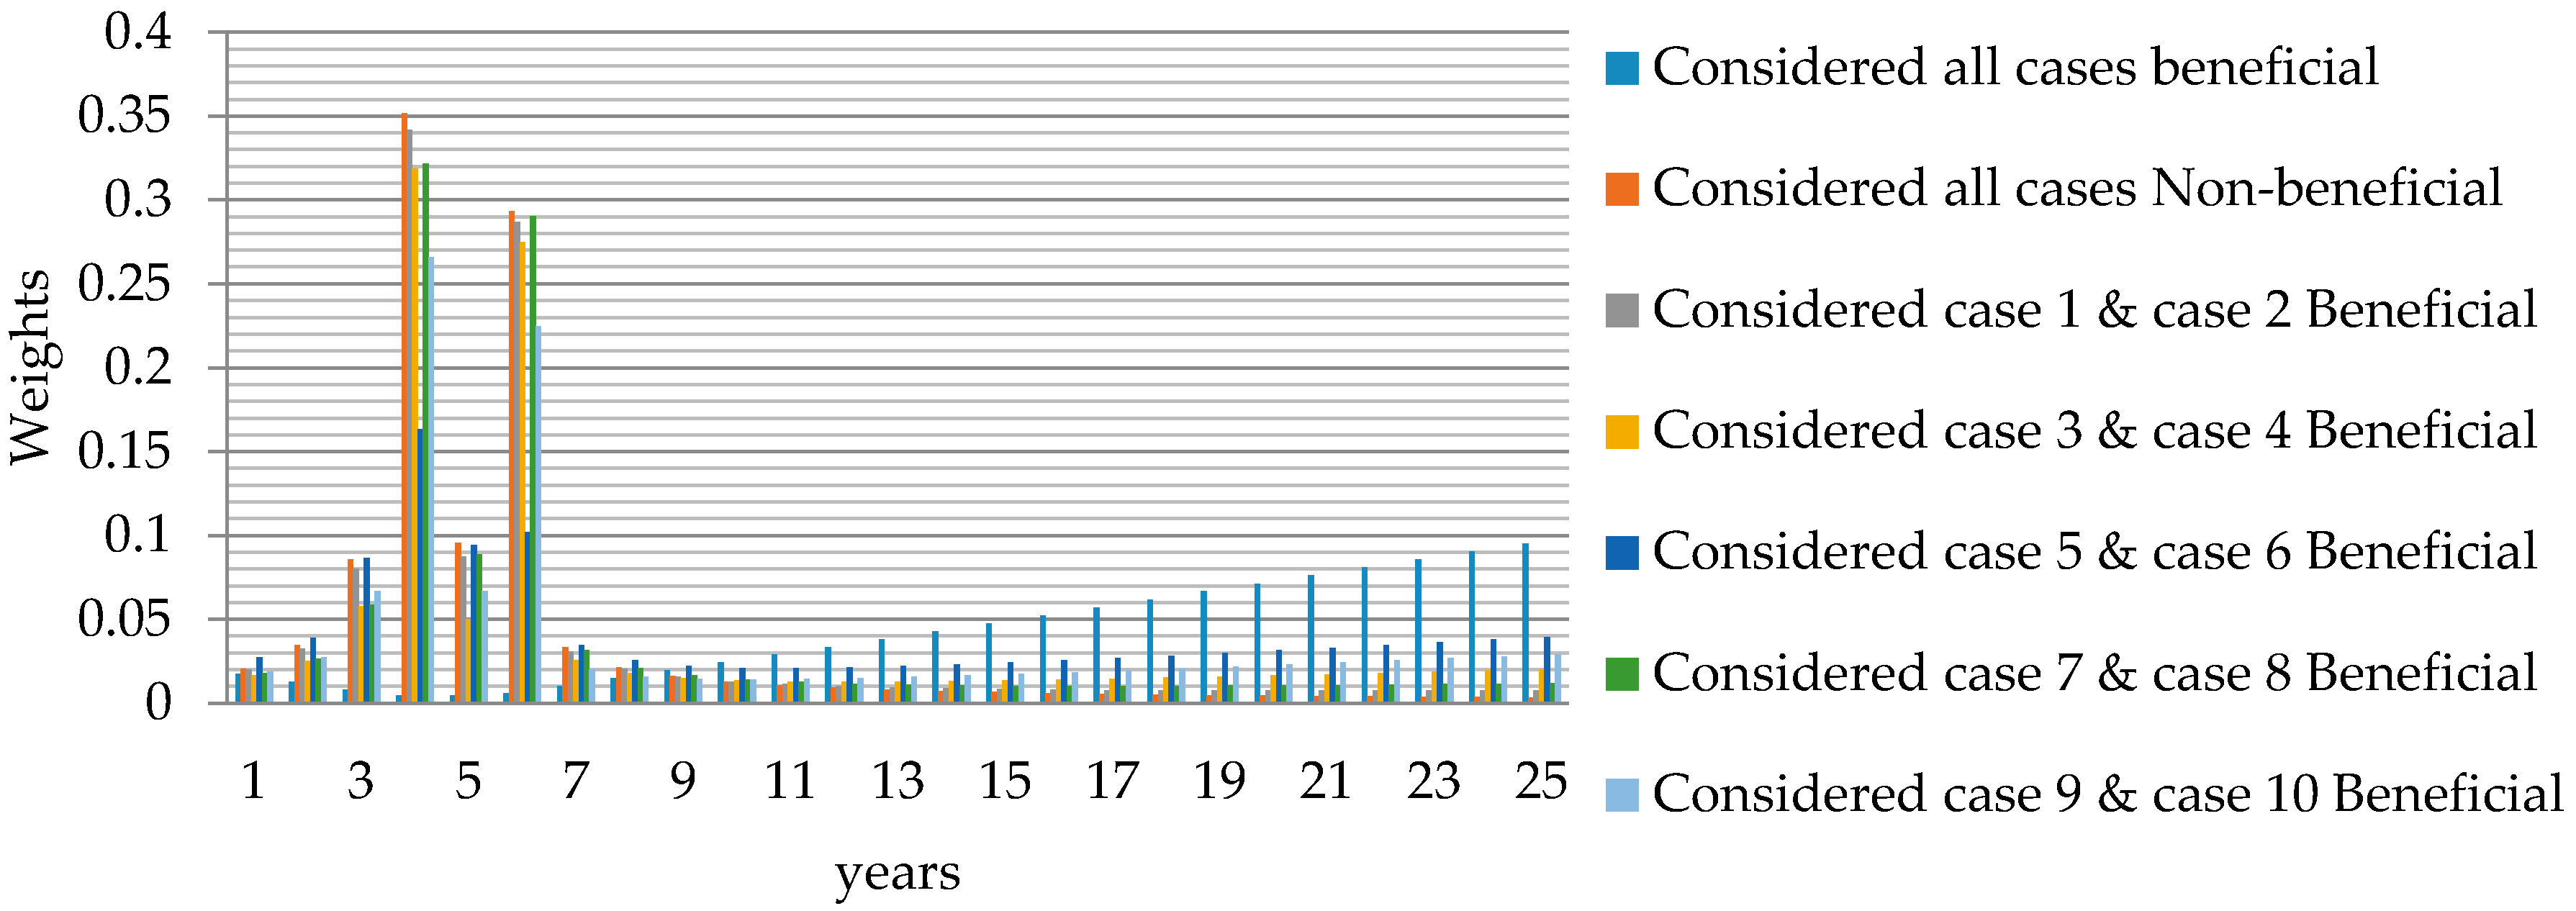
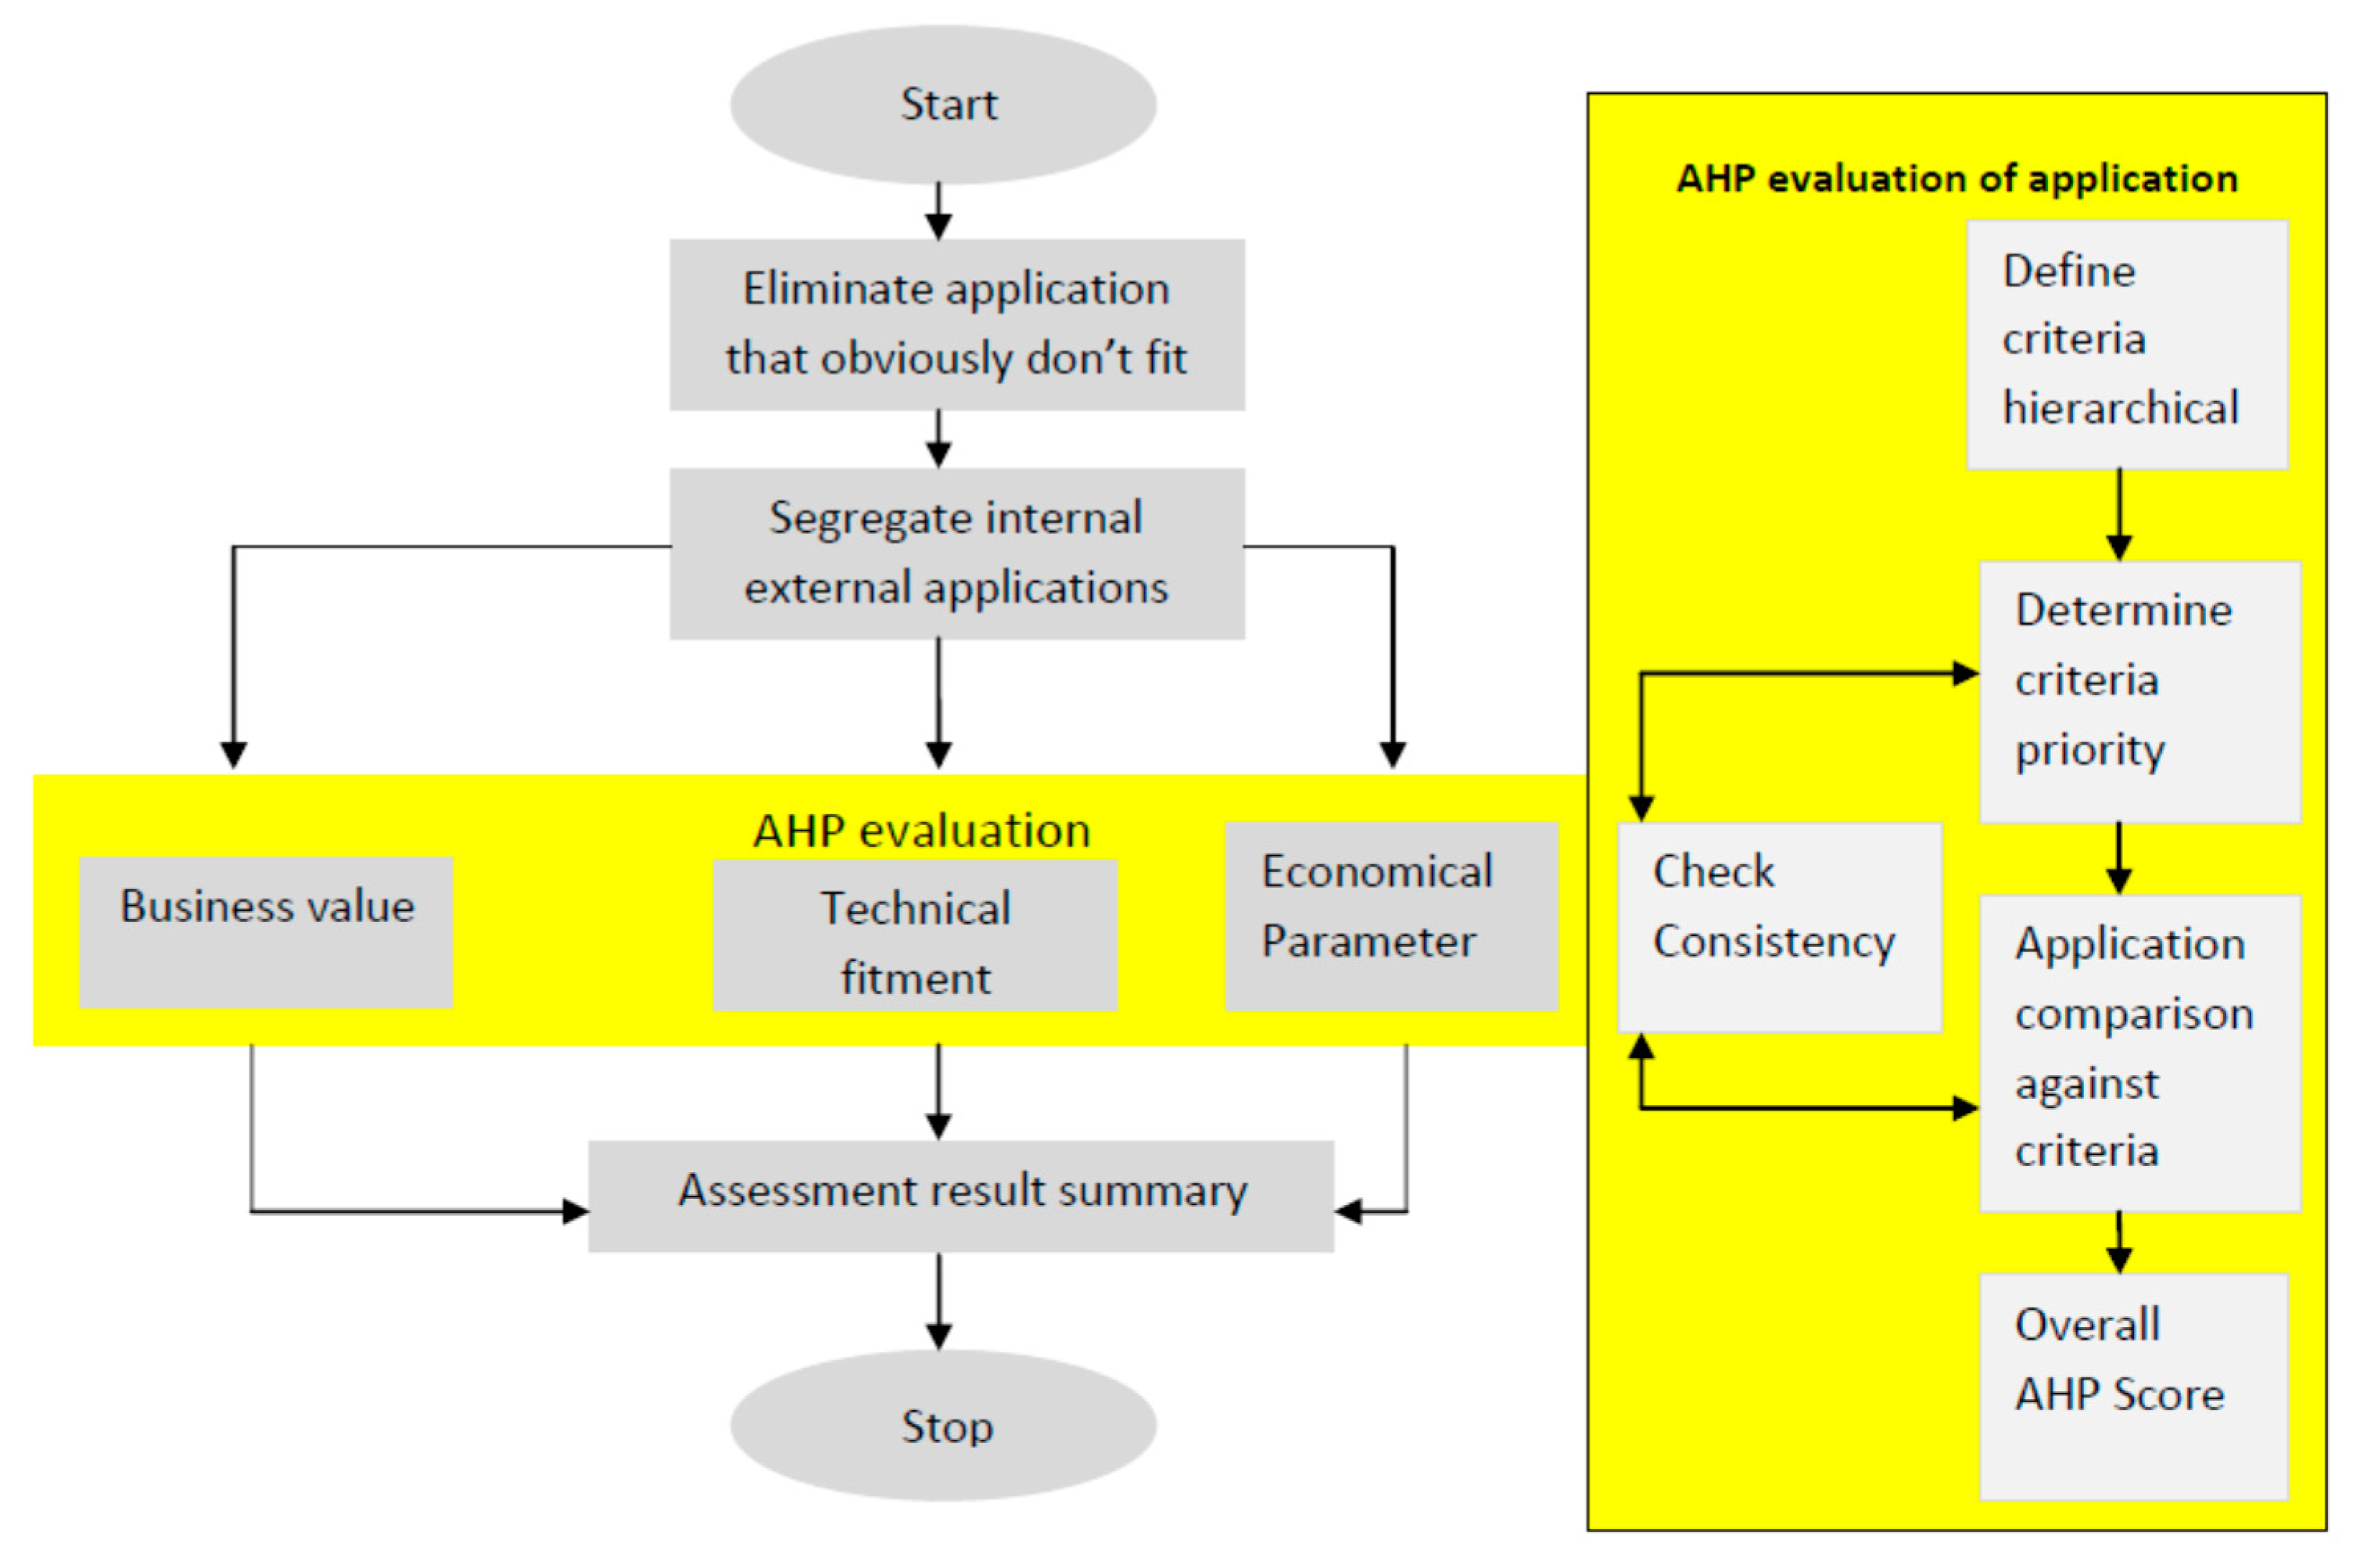
13. Multiple Criteria Decision Making (MCDM)
14. Opportunities and Challenges in Solar Energy Sectors
15. Conclusions
Supplementary Materials
Acknowledgments
Author Contributions
Conflicts of Interest
References
- Record Low Tariff in Rewa Improves Growth Prospects for Solar in India. Available online: http://www.bridgetoindia.com/record-low-tariff-rewa-improves-growth-prospects-solar-india/ (accessed on 23 February 2017).
- Sunny Side up. Available online: http://www.businesstoday.in/magazine/features/solar-energy-in-india-business-tariffs/story/21752.html (accessed on 10 February 2017).
- Solar India Info. Available online: http://indianpowersector.com/home/renewable-energy/solar_new/solar-power/ (accessed on 10 February 2017).
- Tariffs for World’s Biggest Solar Power Plant Hit All-Time Low of Rs2.97/Unit. Available online: http://www.livemint.com/Industry/zW5Lf1okn054cFug5yKGsL/Madhya-Pradesh-solar-bids-hovering-at-Rs3-per-unit-in-revers.html (accessed on 13 February 2017).
- Birol, F.; Gould, T. World Energy Outlook, Special Report India Energy Outlook 2015; Directorate of Global Energy Economics, International Energy Agency: Paris, France.
- Anil, J.; Rajnath, R.; Ashwin, G.; Anshu, B.; Deepak, G. Report of the Expert Group on 175GW RE by 2022; NITI Aayog: New Delhi, India, 2015. [Google Scholar]
- Utility Scale Solar Power Plants. A Guide for Developers and Investors; International Finance Corporation (IFC): Washington, DC, USA, 2011. [Google Scholar]
- Bhattacharyya, R.; Ganguly, A. Cross subsidy removal in electricity pricing in India. Energy Policy 2017, 100, 181–190. [Google Scholar] [CrossRef]
- Garg, P. Energy Scenario and Vision 2020 in India. J. Sustain. Energy Environ. 2012, 3, 7–17. [Google Scholar]
- Ghosh, S.; Nair, A.; Krishnan, S.S. Techno-economic review of rooftop photovoltaic systems: Case studies of industrial, residential and off-grid rooftops in Bangalore, Karnataka. Renew. Sustain. Energy Rev. 2015, 42, 1132–1142. [Google Scholar] [CrossRef]
- Siali, M.; Flazi, S.; Stambouli, A.B.; Fergani, S. Optimization of the investment cost of solar based grid. Renew. Energy 2016, 97, 169–176. [Google Scholar] [CrossRef]
- Zhang, X.; Li, M.; Ge, Y.; Li, G. Research Paper Techno-economic feasibility analysis of solar photovoltaic power generation for buildings. Appl. Therm. Eng. 2016, 108, 1362–1371. [Google Scholar] [CrossRef]
- Köberle, A.C.; Gernaat, D.E.; van Vuuren, D.P. Assessing current and future techno-economic potential of concentrated solar power and photovoltaic electricity generation. Energy 2015, 89, 739–756. [Google Scholar] [CrossRef]
- Sommerfeldt, N.; Madani, H. On the use of hourly pricing in techno-economic analyses for solar photovoltaic systems. Energy Convers. Manag. 2015, 102, 180–189. [Google Scholar] [CrossRef]
- Salehin, S.; Ferdaous, M.T.; Chowdhury, R.M.; Shithi, S.S.; Rofi, M.B.; Mohammed, M.A. Assessment of renewable energy systems combining techno-economic optimization with energy scenario analysis. Energy 2016, 112, 729–741. [Google Scholar] [CrossRef]
- Janko, S.A.; Arnold, M.R.; Johnson, N.G. Implications of high-penetration renewables for ratepayers and utilities in the residential solar photovoltaic (PV) market. Appl. Energy 2016, 180, 37–51. [Google Scholar] [CrossRef]
- Valentin, M.; de Julian, H.; Mareels, I.; Vishwanath, A.; Kalyanaraman, S.; Gort, A. PV Generation and Demand Mismatch: Evaluating the Potential of Residential Storage. In Proceedings of the IEEE Conference on Innovative Smart Grid Technologies (ISGT), Washington, DC, USA, 18–20 February 2015. [Google Scholar]
- Adaramola, M.S. Techno-economic analysis of a 2.1 kW rooftop photovoltaic-grid-tied system based on actual performance. Energy Convers. Manag. 2015, 101, 85–93. [Google Scholar] [CrossRef]
- Orioli, A.; Di Gangi, A. Review of the energy and economic parameters involved in the effectiveness of grid-connected PV systems installed in multi-storey buildings. Appl. Energy 2014, 113, 955–969. [Google Scholar] [CrossRef]
- Zubi, G.; Dufo-López, R.; Pasaoglu, G.; Pardo, N. Techno-economic assessment of an off-grid PV system for developing regions to provide electricity for basic domestic needs: A 2020–2040 scenario. Appl. Energy 2016, 176, 309–319. [Google Scholar] [CrossRef]
- Deepak Kumar. Economic Assessment of Photovoltaic Energy Production Prospects in India. Proc. Earth Planet. Sci. 2015, 11, 425–436. [Google Scholar]
- Soni, M.S.; Gakkhar, N. Techno-economic parametric assessment of solar power in India: A survey. Renew. Sustain. Energy Rev. 2014, 40, 326–334. [Google Scholar] [CrossRef]
- Sukh, N.; Mandavilli, R. YES BANK Working Paper on Financing the Solar Photovoltaic (PV) Rooftop Revolution in India; YES Institute (YI): New Delhi, India, 2016. [Google Scholar]
- International Solar Alliance, YES Bank. Financial Structures for Solar Energy; International Solar Alliance, YES Bank: New Delhi, India, 2016. [Google Scholar]
- Shrimali, G.; Nelson, D.; Goel, S.; Konda, C.; Kumar, R. Renewable deployment in India: Financing costs and implications for policy. Energy Policy 2013, 62, 28–43. [Google Scholar] [CrossRef]
- Aanesen, K.; Heck, S.; Pinner, D. Solar power: Darkest before dawn. In McKinsey on Sustainability & Resource Productivity; McKinsey Silicon Valley Office: Palo Alto, CA, USA, 2012. [Google Scholar]
- Calise, F.; Capuano, D.; Vanoli, L. Dynamic Simulation and Exergo-Economic Optimization of a Hybrid Solar–Geothermal Cogeneration Plant. Energies 2015, 8, 2606–2646. [Google Scholar] [CrossRef]
- Ferroni, F.; Hopkirk, R.J. Energy Return on Energy Invested (ERoEI) for photovoltaic solar systems in regions of moderate insolation. Energy Policy 2016, 94, 336–344. [Google Scholar] [CrossRef]
- Massimo, A.; Dell’Isola, M.; Frattolillo, A.; Ficco, G. Development of a Geographical Information System (GIS) for the Integration of Solar Energy in the Energy Planning of a Wide Area. Sustainability 2014, 6, 5730–5744. [Google Scholar] [CrossRef]
- Carbajales-Dale, M.; Raugei, M.; Fthenakis, V.; Barnhart, C.; Barnhart, C. Energy Return on Investment (EROI) of Solar PV: An Attempt at Reconciliation. Available online: https://www.bnl.gov/isd/documents/89208.pdf (accessed on 11 May 2017).
- Central Electricity Regulatory Commission New Delhi, India. Available online: http://www.cercind.gov.in/2016/orders/SO17.pdf (accessed on 14 January 2017).
- Launching BTI India Solar Price Indices. Available online: http://www.bridgetoindia.com/india-solar-price-indices/ (accessed on 24 March 2017).
- Benchmark Capital Cost of Solar PV Project 2016-2017. Available online: http://www.ezysolare.com/blog/knowledge-center/benchmark-capital-cost-of-solar-pv-project-2016-2017/ (accessed on 14 January 2017).
- Indian Banks and their Lending for the Solar Sector. Available online: http://www.solarmango.com/2015/12/05/indian-banks-to-give-priority-to-rooftop-solar-sector-lending/ (accessed on 24 March 2017).
- Domestic Electricity LT Tariff Slabs and Rates for All States in India in 2017. Available online: https://www.bijlibachao.com/news/domestic-electricity-lt-tariff-slabs-and-rates-for-all-states-in-india-in-2016.html (accessed on 14 January 2017).
- Darling, S.B.; You, F.; Veselka, T.; Velosa, A. Assumptions and the levelized cost of energy for photovoltaics. Energy Environ. Sci. 2011, 4, 3133–3139. [Google Scholar] [CrossRef]
- Internal Rate of Return. Available online: http://www.immagic.com/eLibrary/ARCHIVES/GENERAL/WIKIPEDI/W120622I.pdf (accessed on 18 August 2016).
- Liou, J.J.H.; Tzeng, G.-H. Comments on “Multiple criteria decision making (MCDM) methods in economics: An overview”. Technol. Econom. Dev. Econ. 2012, 18, 672–695. [Google Scholar] [CrossRef]
- Chioua, H.-K.; Tzengb, G.-H.; Chengd, D.-C. Evaluating sustainable fishing development strategies using fuzzy MCDM approach. Omega 2005, 33, 223–234. [Google Scholar] [CrossRef]
- Khasreen, M.M.; Banfill, P.F.; Menzies, G.F. Life-Cycle Assessment and the Environmental Impact of Buildings: A Review. Sustainability 2009, 1, 674–701. [Google Scholar] [CrossRef]
- Mälkki, H.; Alanne, K. An overview of life cycle assessment (LCA) and research-based teaching in renewable and sustainable energy education. Renew. Sustain. Energy Rev. 2017, 69, 218–231. [Google Scholar] [CrossRef]
- Ministry of New & Renewable Energy, Government of India Homepage. Available online: http://mnre.gov.in (accessed on 14 January 2017).
- Daily Reports—2016-17. Available online: https://posoco.in/reports/daily-reports/daily-reports-2016-17/ (accessed on 14 January 2017).
- Saaty, T.L. Decision making with the analytic hierarchy process. Int. J. Serv. Sci. 2008, 1, 83–98. [Google Scholar] [CrossRef]
- Bhushan, N.; Rai, K. Strategic Decision Making. Applying the Analytic Hierarchy Process; Springer: Berlin, Germany, 2004. [Google Scholar]


| Ref. No. | Authors | Year | Objective and Outcomes |
|---|---|---|---|
| [5] | Birol et al. | 2015 | By Year 2040, India is expected to add 600 million new electricity consumers as per the high priority policy. Majority of Indian population receive their power via power grids. Mini-grid and off-grid solutions supply approximately 50% of the electricity demand to the consumers, especially to those who reside at distant areas from existing transmission lines. By Year 2040, it is predicted that 340 GW of electricity will be generated from wind and solar projects due to the increased manufacturing and installation capabilities. |
| [6] | Anil et al. | 2015 | NITI Aayog (National Institute for Transforming India) discussed the hurdles in achieving 100 GW solar power and other renewable energy generation by 2022. |
| [7] | International Finance Corporation | 2011 | Provided guidance for developers in finance, design, construction and operation of utility scale solar PV plants. |
| [8] | Bhattacharyya et al. | 2017 | Discussed the impact of cross subsidy removal in electricity pricing in India. Removal of cross subsidy in India led to increased inflation, especially food inflation, that in turn resulted in decreased household income in rural areas. |
| [9] | Garg | 2012 | Proposed the “Energy Vision 2020”. The electricity consumption per capita for India is just 566 kWh, which is lesser when compared with other countries. Eighty-four Million households in India do not have access to electricity. The electricity consumption of India is predicted to increase up to 2280 BkWh and 4500 BkWh by 2021–2022 and 2031–2032, respectively. In the past 25 years, the power capacity has increased by 5.87% yearly. |
| [10] | Ghosh et al. | 2015 | Evaluated the profitability of various existing Roof Top PV systems (RTPV) and different policy incentives in India. Indian cities with semi-urban spaces show good financial performance in both net metering as well as in Feed in Tariff (FiT) schemes. |
| [11] | Siali et al. | 2016 | A new optimization method was proposed to minimize the investment cost of a distribution grid supplied by PV sources. |
| [12] | Zhang et al. | 2016 | Analyzed the techno-economic aspects for Building Added PV (BAPV) for Hybrid Energy Systems (HES) in commercial and residential buildings. Authors concluded that commercial buildings demand high power supply during daytime due to the similarities in the building load profiles and the solar radiation profile. This scenario has mandated the presence of batteries with large capacities and increased charge-discharge cycle. |
| [13] | Köberle et al. | 2015 | Presented future techno-economic potentials of the PV electricity generation from concentrated solar energy. |
| [14] | Sommerfeldt et al. | 2015 | Provided insights on a rare phenomenon of hourly pricing model in PV techno-economic analysis. Authors proposed a dynamic pricing method. |
| [15] | Salehin et al. | 2016 | Investigated the wind-diesel systems and solar PV-diesel systems and concluded that, solar PV-diesel system has shorter payback period when compared with wind-diesel energy system. |
| [16] | Janko et al. | 2016 | Created the residential energy market model by using HOMER Microgrid software. Due to increasing installations of solar PV systems, this study focused on evaluating the overall effect of electric rate structures and the environmental policies. |
| [17] | Valentin et al. | 2015 | Discussed the factors such as declining subsidies, reduction in Feed-in-Tariff and timing difference between demand and the supply from solar power which decides the cost-efficacy of roof top solar systems. Concluded that Li-ion batteries are increasingly preferred for residential energy storage. |
| [18] | Adaramola, M.S | 2015 | Calculated the annual and monthly cost of energy production by the solar system. The Internal Rate of Return on investment of this installation was found to be approximately 7.5%. |
| [19] | Orioli et al. | 2014 | Analyzed the economic parameters that are involved in finding the effectiveness of grid-connected PV systems installed in multi-story buildings. |
| [20] | Zubi et al. | 2016 | Considered four different scenarios for different years such as 2020, 2030 and 2040. Authors proposed an evolutionary techno-economic assessment and presented an overview about the future developments in off-grid PV systems. |
| [21] | Kumar | 2015 | Investigated the Solar PV energy production and economic assessment for Indian scenario. |
| [22] | Soni et al. | 2014 | Domestic survey was conducted on techno-economic parameters of solar technologies with global attributes. The researchers concluded that various parameters, site location and direct investment cost are the most preferred technical and economical parameters. |
| [23] | Sukh et al. | 2016 | Various business and financial models which are currently used worldwide were presented. The study also suggested, how these models can be implemented in Indian context, thus paving way for the growth of this sector. |
| [24] | International Solar Alliance | 2016 | Information on existing innovative financing structures that can be implemented in streamlining the finance solar energy operations, renewable energy, in general at both national and international level investments were discussed. |
| [25] | Shrimali et al. | 2013 | Conducted financial modeling of renewable energy projects in India and identified that high cost of debt is the most imperative problem. |
| [26] | Aanesen et al., | 2012 | Study covers strategies and resource productivity with specialization in renewable product development and its cost details. |
| [27] | Calise et al. | 2015 | Presented the simulation model and parametric analysis of a solar geothermal hybrid cogeneration. |
| [28] | Ferroni et al. | 2016 | Presented on Energy Return on Energy Invested (ERoEI). |
| [29] | Massimo et al. | 2014 | Presented the use of Geographic Information System (GIS) techniques for the exploitation of solar energy potential estimation. |
| [30] | Carbajales-Dale et al. | 2015 | Analyzed the Energy Return On Investment (EROI). The method serves as a useful metric for assessing long-term viability of energy-dependent systems from bands of hunter-gatherers, to modern society and, finally to the specific case of a solar electricity generating project. |
| [31,32,33,34] | 2016 | Benchmarked the Capital Cost Norm prescribed by Judgment against petition for Indian Solar PV power projects. | |
| [35] | Tabulated the electricity tariff in India for year 2017. Each State Electricity Regulatory Commission (SERC) fixes electricity unit cost under various slabs. | ||
| [36,37] | Darling et al. | 2011 | Various methods and equations are presented related to Levelized Cost of Electricity (LCOE), Net Present Value (NPV), Internal Rate of Return (IRR) and Profitability. |
| [38] | Liou et al. | 2012 | Elucidated an economic model using MCDM methods. |
| [39] | Chioua | 2005 | A hierarchy is structured to set up a sustainable implementation. In this work, an Analytic Hierarchy Process (AHP) composed method is used to build the evaluation framework to study the criteria in order to achieve the sustainable development in the industry. |
| [40] | Khasreen et al. | 2009 | Life Cycle Assessment (LCA) of renewable energy is addressed. |
| [41] | Mälkki et al. | 2017 |
| FY 2016–2017 | FY 2015–2016 | FY 2014–2015 | FY 2013–2014 | FY 2012–2013 | |||||||||
|---|---|---|---|---|---|---|---|---|---|---|---|---|---|
| S. No. | Particulars | Change in Cost over Past 5 Years | Cost in INR Lakhs/MW | % of Total Cost | Change from Previous Year | Cost in INR Lakhs/MW | % of Total Cost | Cost in INR lakhs/MW | % of Total Cost | Cost in INR Lakhs/MW | % of Total Cost | Cost in INR lakhs/MW | % of Total Cost |
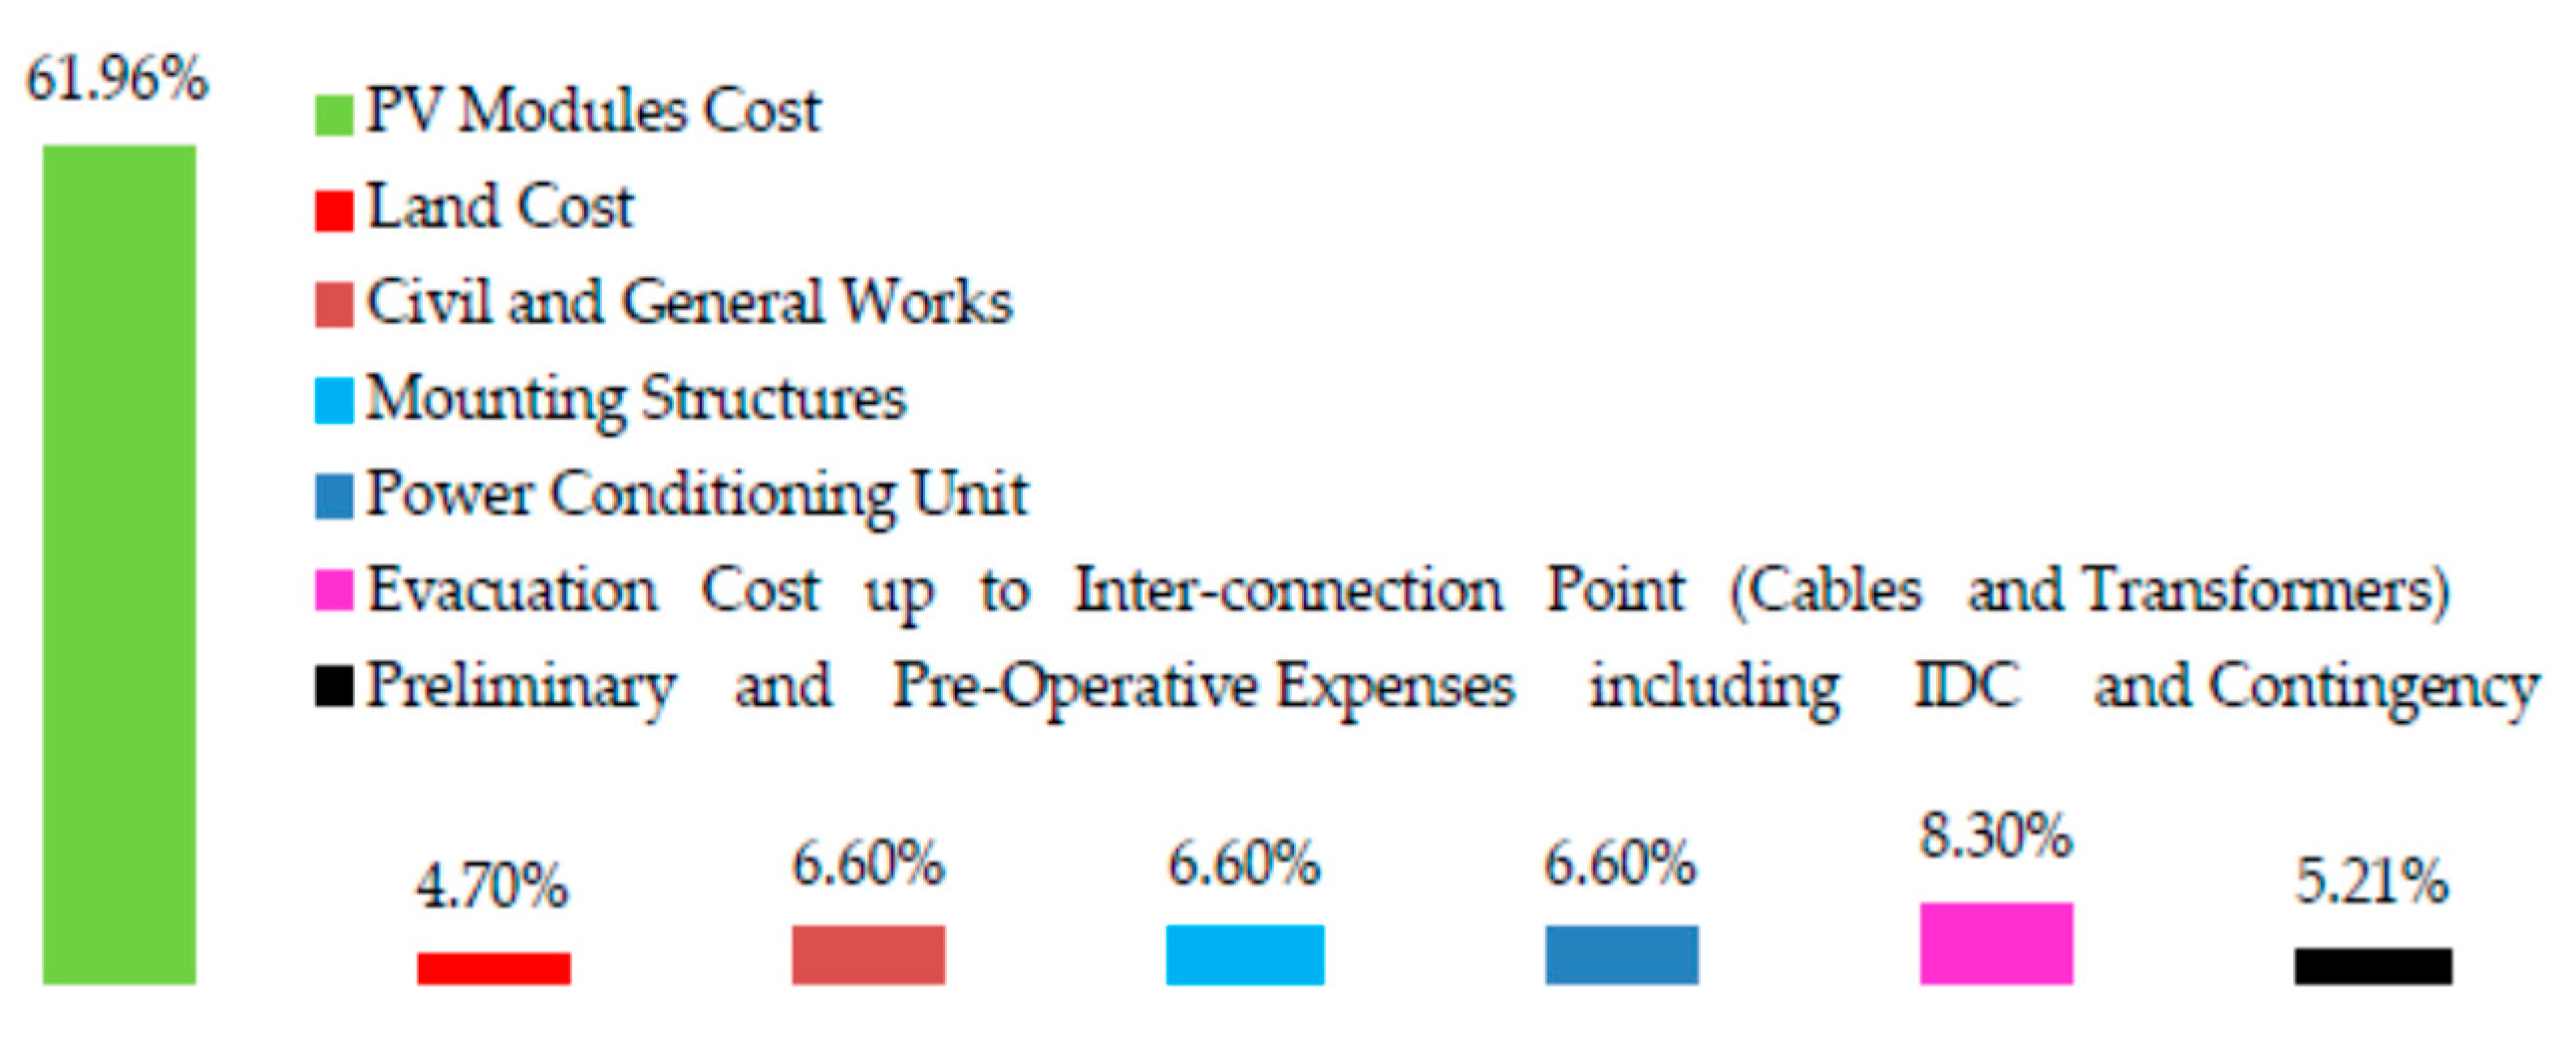
| 1 | PV Modules Cost | −4.68% | 328.39 | 61.96% | 7.10% | 332.35 | 54.53% | 365.8 | 54.53% | 335.71 | 42.12% | 344.5 | 42.75% |
| 2 | Land Cost | 48.81% | 25 | 4.70% | 0.59% | 25 | 4.13% | 25 | 3.73% | 16.8 | 2.11% | 16.8 | 2.08% |
| 3 | Civil and General Works | −62.96% | 35 | 6.60% | −1.65% | 50 | 8.25% | 60 | 8.94% | 94.5 | 11.86% | 94.5 | 11.73% |
| 4 | Mounting Structures | −66.67% | 35 | 6.60% | −1.65% | 50 | 8.25% | 50 | 7.45% | 105 | 13.17% | 105 | 13.03% |
| 5 | Power Conditioning Unit | −41.67% | 35 | 6.60% | −0.82% | 45 | 7.43% | 50 | 7.45% | 60 | 7.53% | 60 | 7.45% |
| 6 | Evacuation Cost up to Inter-connection Point (Cables and Transformers) | −58.10% | 44 | 8.30% | −0.78% | 55 | 9.08% | 60 | 8.94% | 105 | 13.17% | 105 | 13.03% |
| 7 | Preliminary and Pre-Operative Expenses including IDC and Contingency | −65.46% | 27.63 | 5.21% | −2.79% | 48.5 | 8.01% | 60 | 8.94% | 80 | 10.04% | 80 | 9.93% |
| Total Capital Cost | −34.22% | 530.02 | 605.85 | 670.8 | 797.01 | 805.8 | |||||||
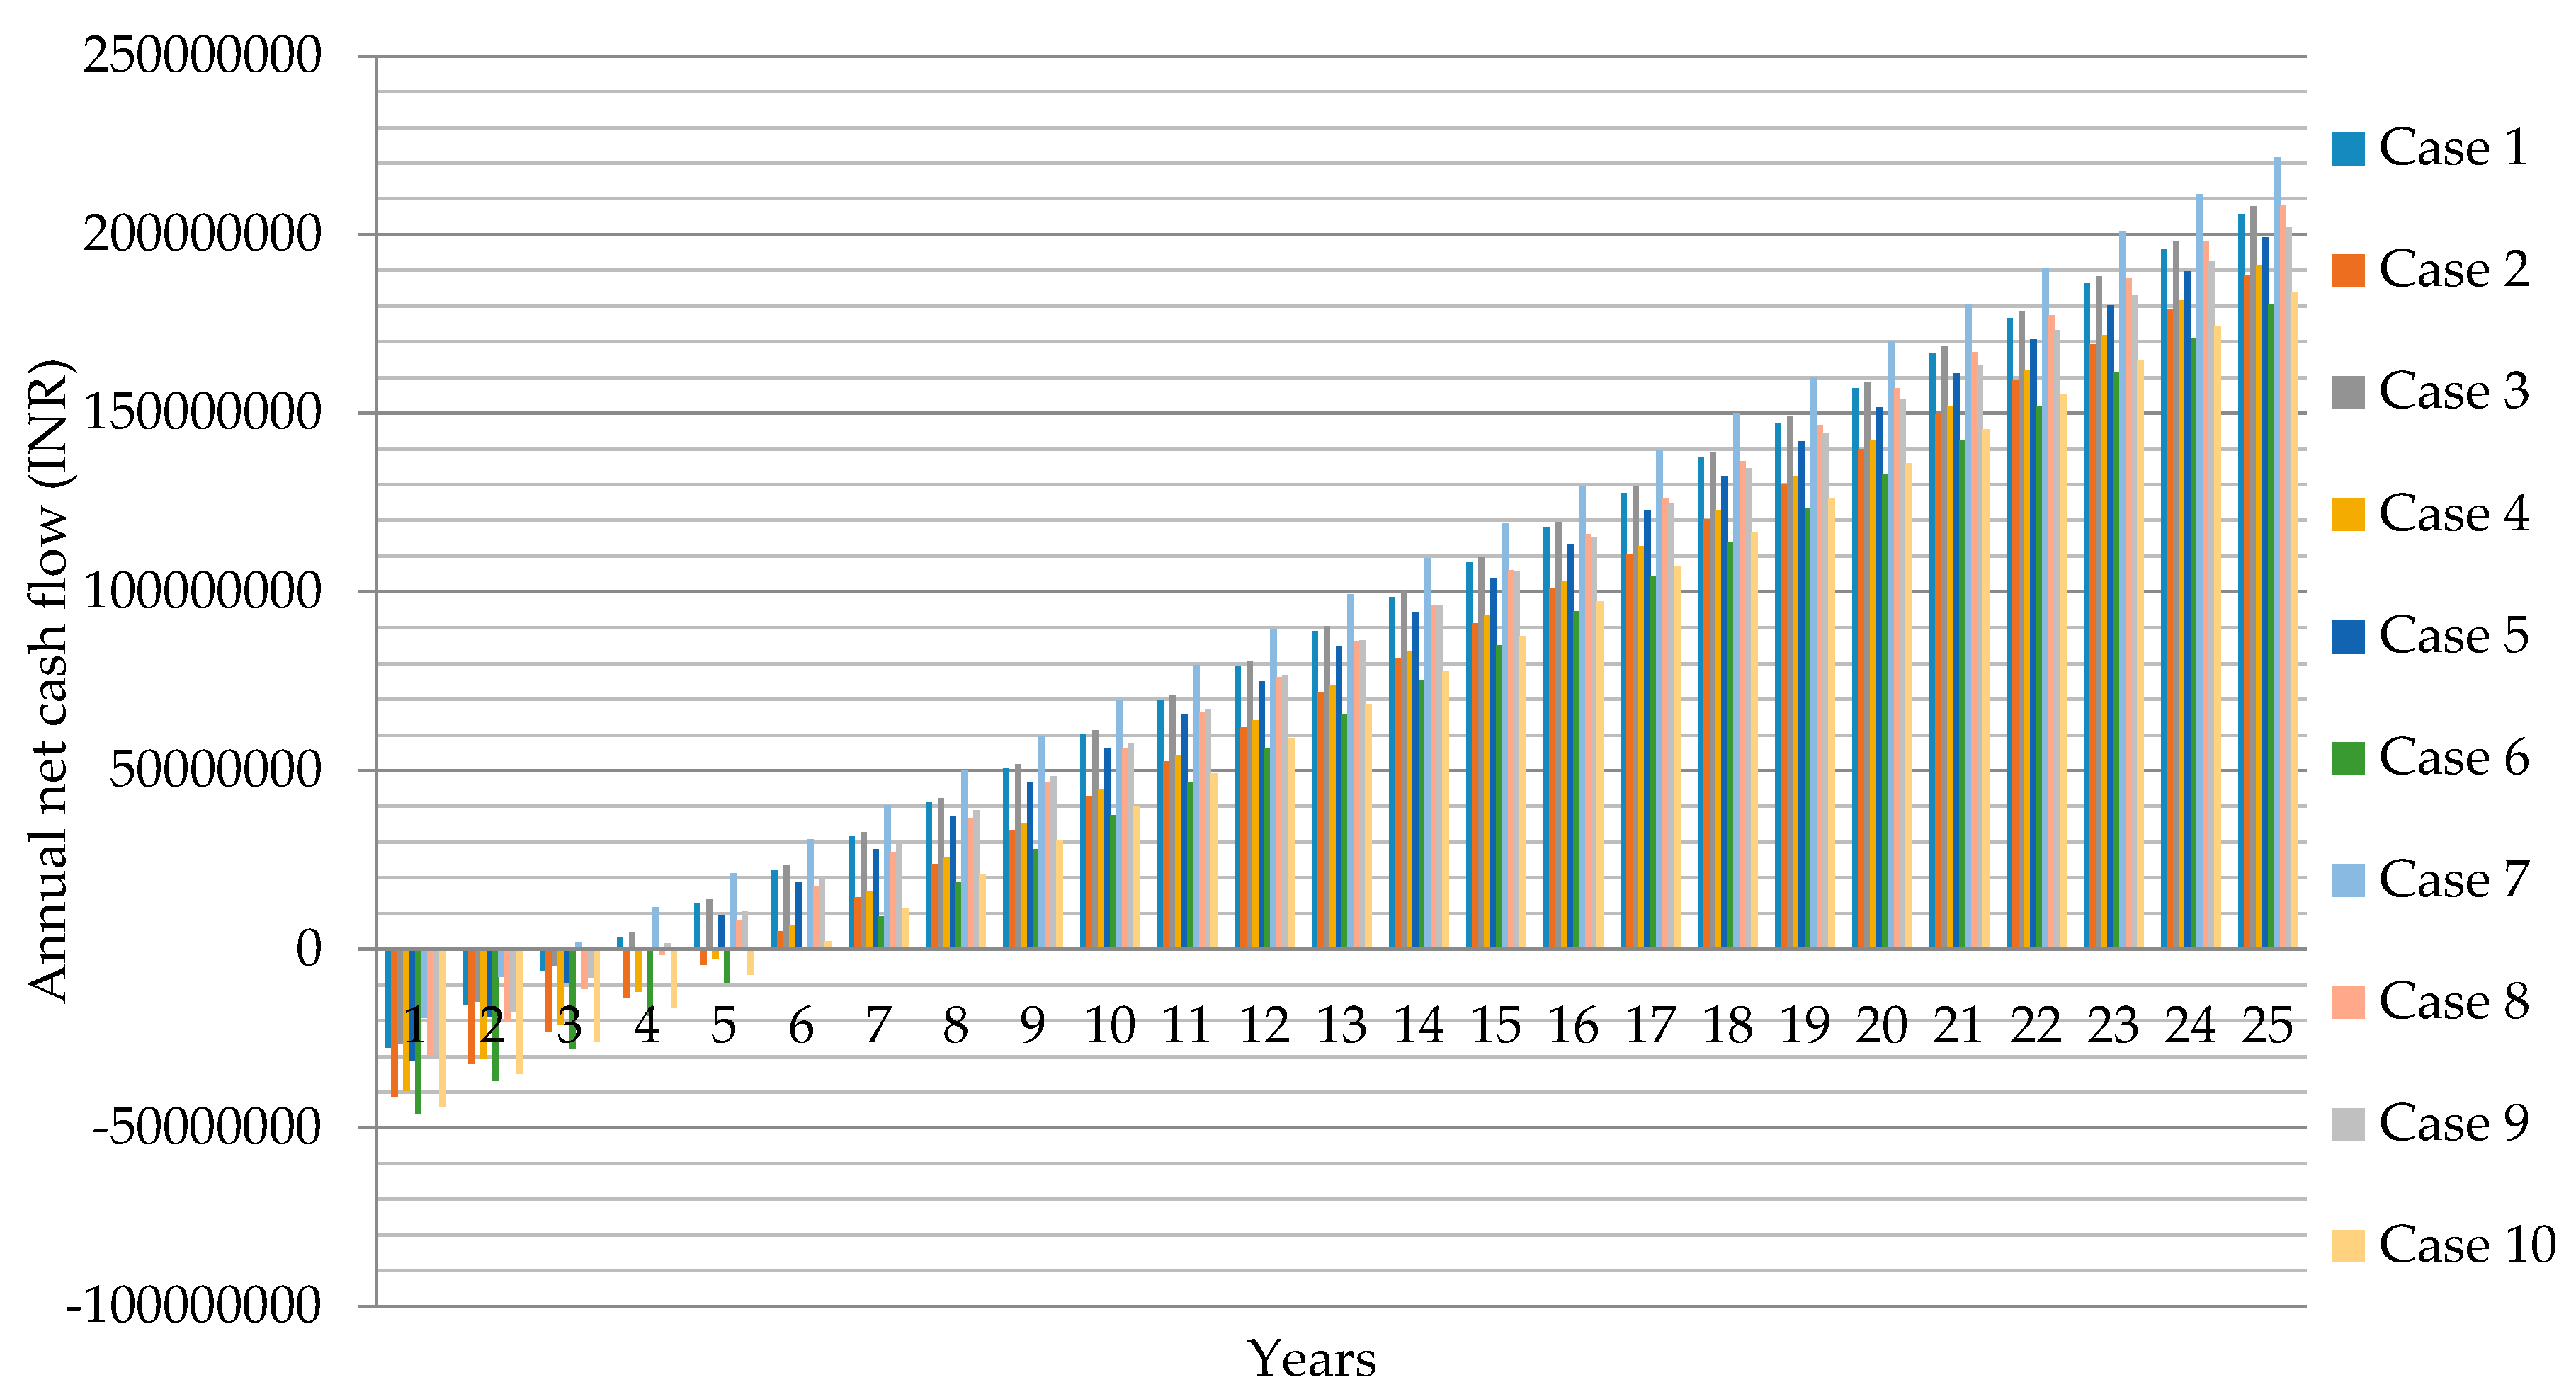
| S. No. | Case | Different Consideration | Project Cost Investment (INR) | AD (INR) | NPV (INR) | LCOE (INR) | IRR % | PI |
|---|---|---|---|---|---|---|---|---|
| 1 | Case 1 | Solar Panel costs expected to fall 5% from CERC Benchmark Cost with AD | 50,351,900 | 17,114,609 | 66,025,510 | 2.65 | 25% | 2.31 |
| 2 | Case 2 | Solar Panel costs expected to fall 5% from CERC Benchmark Cost without AD | 50,351,900 | 0 | 50,466,773 | 2.65 | 18% | 2.00 |
| 3 | Case 3 | Self Solar Project EPC Development Cost with AD | 48,761,840 | 16,574,148 | 67,527,875 | 2.57 | 26% | 2.38 |
| 4 | Case 4 | Self Solar Project EPC Development Cost without AD | 48,761,840 | 0 | 52,460,467 | 2.57 | 19% | 2.08 |
| 5 | Case 5 | Rooftop Solar Project Cost with AD | 55,000,000 | 18,694,498 | 61,633,762 | 2.90 | 23% | 2.12 |
| 6 | Case 6 | Rooftop Solar Project Cost without AD | 55,000,000 | 0 | 44,638,763 | 2.90 | 16% | 1.81 |
| 7 | Case 7 | Solar Parks Development Cost with AD (Lowest Price in India) | 39,000,000 | 13,256,099 | 76,751,330 | 2.055 | 32% | 2.97 |
| 8 | Case 8 | Solar Parks Development Cost without AD (Lowest Price in India) | 39,000,000 | 0 | 64,700,330 | 2.055 | 24% | 2.66 |
| 9 | Case 9 | CERC Benchmark with AD (2016–2017) | 53,002,000 | 18,015,378 | 63,521,568 | 2.7928 | 24% | 2.20 |
| 10 | Case 10 | CERC Benchmark Cost without AD (2016–2017) | 53,002,000 | 0 | 47,143,951 | 2.7928 | 17% | 1.89 |
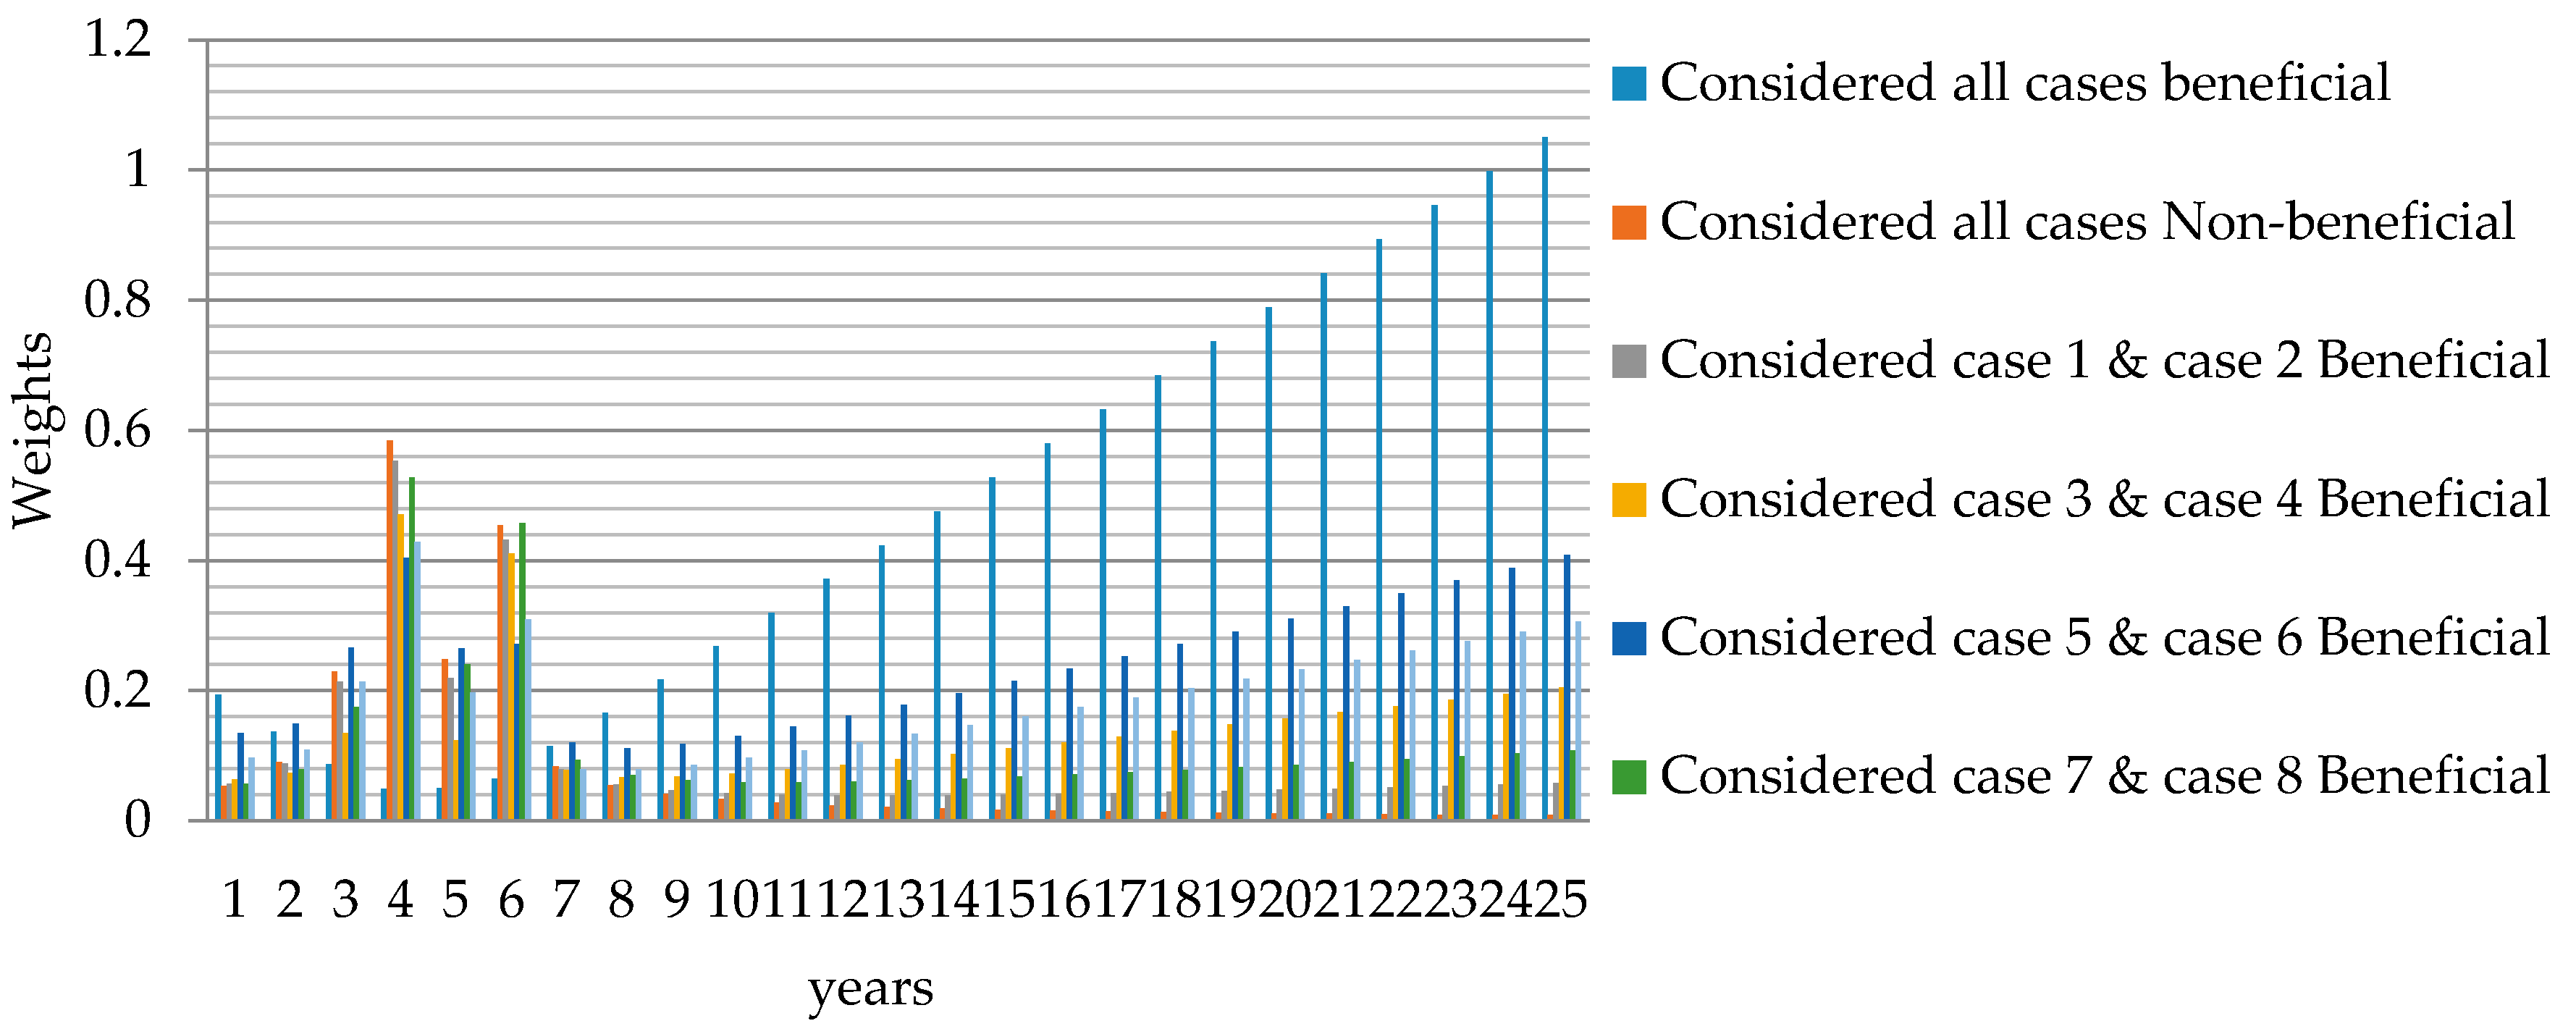
| Case | Beneficial or Non-Beneficial |
|---|---|
| Case A | Considered all cases are Beneficial |
| Case B | Considered all cases are Non-Beneficial ( Ignored Accelerated Depreciation consideration) |
| Case C | Considered Case 1 and Case 2 are Beneficial and all the remaining cases to be Non-Beneficial |
| Case D | Considered Case 3 and Case 4 are Beneficial and all the remaining cases to be Non-Beneficial |
| Case E | Considered Case 5 and Case 6 are Beneficial and all the remaining cases to be Non-Beneficial |
| Case F | Considered Case 7 and Case 8 are Beneficial and all the remaining cases to be Non-Beneficial |
| Case G | Considered Case 9 and Case 10 are Beneficial and all the remaining cases to be Non-Beneficial |
| Years | Hierarchy Rank List for Different Cases with Respect to Years | ||||||
|---|---|---|---|---|---|---|---|
| Case A | Case B | Case C | Case D | Case E | Case F | Case G | |
| 1 | 25 | 4 | 4 | 4 | 4 | 4 | 4 |
| 2 | 24 | 6 | 6 | 6 | 6 | 6 | 6 |
| 3 | 23 | 5 | 5 | 3 a | 5 | 5 | 3 a |
| 4 | 22 | 3 a | 3 a | 5 | 3 a | 3 a | 5 |
| 5 | 21 | 2 b | 2 b | 7 | 25 | 7 | 25 |
| 6 | 20 | 7 | 7 | 2 b | 2 b | 2 b | 24 |
| 7 | 19 | 8 | 8 | 25 | 24 | 8 | 2 b |
| 8 | 18 | 1 c | 1 c | 24 | 23 | 1 c | 23 |
| 9 | 17 | 9 | 9 | 23 | 7 | 9 | 22 |
| 10 | 16 | 10 | 10 | 22 | 22 | 10 | 21 |
| 11 | 15 | 11 | 11 | 8 | 21 | 11 | 20 |
| 12 | 14 | 12 | 12 | 21 | 20 | 25 | 19 |
| 13 | 13 | 13 | 13 | 1 c | 19 | 12 | 18 |
| 14 | 12 | 14 | 14 | 20 | 18 | 24 | 7 |
| 15 | 11 | 15 | 15 | 19 | 1 c | 23 | 17 |
| 16 | 10 | 16 | 16 | 18 | 17 | 13 | 1 c |
| 17 | 9 | 17 | 17 | 9 | 16 | 22 | 16 |
| 18 | 1 c | 18 | 18 | 17 | 8 | 21 | 15 |
| 19 | 8 | 19 | 25 | 16 | 15 | 14 | 14 |
| 20 | 2 b | 20 | 24 | 15 | 14 | 20 | 8 |
| 21 | 7 | 21 | 19 | 10 | 9 | 19 | 13 |
| 22 | 3 a | 22 | 23 | 14 | 13 | 15 | 12 |
| 23 | 6 | 23 | 20 | 11 | 12 | 18 | 9 |
| 24 | 5 | 24 | 22 | 13 | 10 | 16 | 11 |
| 25 | 4 | 25 | 21 | 12 | 11 | 17 | 10 |
© 2017 by the authors. Licensee MDPI, Basel, Switzerland. This article is an open access article distributed under the terms and conditions of the Creative Commons Attribution (CC BY) license (http://creativecommons.org/licenses/by/4.0/).
Share and Cite
K., P.; Govindarajan, U.; K. Ramachandaramurthy, V.; T., S.O.S. Multiple Criteria Decision Making (MCDM) Based Economic Analysis of Solar PV System with Respect to Performance Investigation for Indian Market. Sustainability 2017, 9, 820. https://doi.org/10.3390/su9050820
K. P, Govindarajan U, K. Ramachandaramurthy V, T. SOS. Multiple Criteria Decision Making (MCDM) Based Economic Analysis of Solar PV System with Respect to Performance Investigation for Indian Market. Sustainability. 2017; 9(5):820. https://doi.org/10.3390/su9050820
Chicago/Turabian StyleK., Padmanathan, Uma Govindarajan, Vigna K. Ramachandaramurthy, and Sudar Oli Selvi T. 2017. "Multiple Criteria Decision Making (MCDM) Based Economic Analysis of Solar PV System with Respect to Performance Investigation for Indian Market" Sustainability 9, no. 5: 820. https://doi.org/10.3390/su9050820