
Effects of Population and Land Urbanization on China’s Environmental Impact: Empirical Analysis Based on the Extended STIRPAT Model


1
School of Economics, FuJian Normal University, Fuzhou 350007, Fujian, China
2
School of Management, University of Science and Technology of China, Hefei 230026, Anhui, China
3
Curtin University Sustainability Policy Institute, Curtin University of Technology, Perth, WA 6845, Australia
*
Author to whom correspondence should be addressed.
Sustainability 2017, 9(5), 825; https://doi.org/10.3390/su9050825
Submission received: 7 April 2017
/
Revised: 8 May 2017
/
Accepted: 9 May 2017
/
Published: 15 May 2017
Abstract
:China has been undergoing a very rapid but unbalanced urbanization, characterized by under-urbanization of its population and faster urbanization of the land. In such a situation, the urbanization of the population and the land may produce different effects on the natural environment. In addition, due to substantial inter-regional differences, the influence of urbanization on the environment is likely to vary across regions at different stages of economic and social development. This article expands the basic STIRPAT–Stochastic Impacts by Regression on Population, Affluence and Technology, model by adding industrialization level, foreign trade degree, population urbanization level and land urbanization level. Based on panel data from 2006 to 2014 and using this extended STIRPAT model, the article analyses the effects of the driving forces, especially population urbanization and land urbanization, on the environmental impact for the whole of China as well as on its eastern, middle and western regions. The results indicate that for the whole of China, population urbanization produces a significant negative effect on the environmental impact, while land urbanization has a small, but not statistically significant, positive effect. The effects of population urbanization and land urbanization vary across the eastern, middle and western regions, which are at different stages of economic and social development. Population urbanization and land urbanization have no significant influences on environmental impact in the eastern and middle regions, while in the western region population urbanization has a significant negative influence on environmental impact. The main driving factors of environmental impact remain population, affluence and energy intensity. This study also quantitatively calculates the actual contribution rate of each driving force for the 2006–2014 period. It contributes to understanding the characteristics and key driving forces in each region, allowing for appropriate policy recommendations.
1. Introduction
With more than half of the global population now living in cities and towns, the world is witnessing an unprecedented urban growth [1]. By 2030, the number of urban dwellers is expected to swell to about 5 billion [1]. Together with three decades of astonishing economic growth, China’s urbanization developed very rapidly and attracted international interest from academics but also from politicians and business representatives [2,3]. According to Joseph Stiglitz [4], China’s urbanization is one of the two most significant issues influencing global development in the 21st century (the other being high technology development in USA). The year 2011 marked the moment in the country’s history when for the first time the size of its urban population surpassed that of rural people (Ye and Wu, 2014), according to the data from China’s 2016 Statistical Yearbook [5].The share of China’s urban population increased from 18% in 1978 to 56% in 2015. During 1978–2015, China’s urban population grew from 172 million to 771 million with an average annual growth rate of 4.13%, while the country’s rural population decreased from 790 million to 603 million with a negative average annual growth rate of −0.73%.
With China’s fast urbanization, serious problems emerged related to overcrowding, air and water pollution and environmental degradation [6]. In 2006, China became the world’s largest greenhouse gas (GHG) emitter [7] and continues to contribute to raising CO2 emissions. China’s CO2 emissions reached 10.25 billion tonnes in 2013, which is 1.97 times the amount emitted by the USA [8]. Environmental problems associated with greenhouse gas emissions became increasingly severe [9]. The environmental impact of China is a very serious concern globally and nationally with many studies examining the country’s contribution. Efforts started to be made to understand the interconnections between the integrated environmental, social and economic sustainability imperatives and urban land use [10].
According to Ehrlich [11], each human individual has a negative impact on the environment, irrespective as to whether this is in an agrarian or industrialized society. The practice of agriculture as well as the use of renewable and non-renewable resources result in a simplification (and hence destabilization) of the ecological systems. Environmental impact refers to the total negative impact a society has on the environment. Therefore, based on Ehrlich [11], environmental impact is defined as the total negative impact on the environment of anthropogenic factors, including population, economic activity, technology use and so on. The total negative impact is usually measured by the impact on the environment of the pollutants produced in the process of consuming all energy and resources.
A large body of existing research aims to isolate the anthropogenic factors driving this environmental change. Economic growth is seen as the main culprit, but many other factors (often described as “driving forces”), such as population, economic activity, technology, political and economic institutions, attitudes and beliefs, are also seen as responsible [12].
The STIRPAT model, developed by Dietz and Rosa [13,14] as an improvement of the IPAT model, is often used in studies assessing the impact of anthropogenic factors on GHG and other contaminating emissions, such as CO2 emissions. According to its developers: “The foundation of STIRPAT is an orienting perspective that combines insights from human ecology with a version of environmental sociology that insists on examining a combination of physical, biological, and social variables in combination” [15], (p. 1). This model is constantly refined, applied for generating empirical evidence and used as a basis for policy recommendations [7]. The list of studies includes York et al. [16], Shi [17], Martínez-Zarzoso et al. [18], Martínez-Zarzoso and Maruotti [19], Tian and Da Costa [20], Li and Lin [21] and Lin et al. [22]. They use the STIRPAT model mainly to analyse the driving forces of CO2 emissions across countries.
With China being the largest CO2 emitter in the world, many studies have also analysed the driving forces of GHG emissions in this country applying the STIRPAT model (for example, Li et al. [23]; Shao et al. [24], Wang et al. [25]; Wang et al. [26]; Zhang and Lin [27]; Wang et al. [28]; Song et al. [29]; Ding et al. [30]; Wang and Zhao [31]; and Wen and Liu [32,33]). Furthermore, studies have also analysed the determinants of environmental impact, ecological footprint, water footprint, and cement consumption through the STIRPAT model (e.g., Wang and He [34]; Lin et al. [35]; Wang et al. [36]; Zhao et al. [37]; Cao et al. [38]; Zhang et al. [39] and Ren et al. [40]). More explanation about the studies using the STIRPAT model is provided in Li and Lin [21] and Uddin et al. [41]. However, there are not many studies on China’s comprehensive environmental impact.
Urbanization brings large social, economic and environmental transformations [1], and many researchers use the STIRPAT model to analyse its effects on environmental pollution, GHG and CO2 emissions. For example, Martínez-Zarzoso and Maruotti [19] analysed the impact of urbanization on CO2 emissions in developing countries during 1975–2003. Li and Lin [21] examined the impacts of urbanization and industrialization on energy consumption and CO2 emissions with a balanced panel dataset for 73 countries over the 1971–2010 period. Furthermore, Zheng et al. [42] measured the impact of urbanization on CO2 emissions in 73 Chinese cities during 2002–2012.
Most previous research shows that urbanization and industrialization increase energy consumption and carbon emissions [43,44,45,46], but there are also some empirical studies which find the relationship being of no significance [42] or negative [47,48]. In addition, UNFPA [1] claims that urbanization has the potential to bring a new era in human well-being, resource efficiency and economic growth. Li and Lin [21] point out that the impact of urbanization on energy consumption and related emissions varies across countries with different levels of GDP per capita. The inconsistency in the results from previous research is partly caused by differences in the methods used and sample data. This also implies that the effect of urbanization on environmental impact or carbon dioxide emissions is closely related to the studied sample. The effect of urbanization is expected to vary in different countries or regions.
Although many researchers have studied the influence of urbanization on environmental impact or CO2 emissions, it is usually represented by the proportion of urban to total population, e.g., the studies by Fan et al. [48], Lin et al. [35], Liddle and Lung [43] and Zhou et al. [45]. This is obviously a very blunt measure, requiring more careful examination. Gu and Wu [49], (p. 1), point out that China’s urbanization is “a complex and multifaceted process involving population migration from rural to urban areas, rural and urban land conversions, spatial reconfiguration of settlements, and changing governance”. In order to depict comprehensively the process of urbanization in China, Fang et al. [50] put forward a primary index system representing demographic, economic, spatial and social changes. Since China’s opening-up and reform in 1978, a mass migration of rural residents into cities commenced. However, the country’s urbanization is characterized by population under-urbanization and fast expansion of urban land [4]. In addition to the increase in the number of urban residents associated with the standard work and other opportunities offered in the cities, China has allowed for a large size of a “floating populations” or “temporary” urban migrants [2]. Although these people are allowed to work in the cities, they do not share the full range of benefits available to urban residents. This situation is termed population under-urbanization [4].
On the other hand, land-centred development associated with the conversion of rural land into urban has been a significant feature of China’s urbanization [51,52,53]. Mechanisms used include, among others, spatial reconfiguration, rapid outward development of cities, conversion of farm land, new zone development, creation of new towns and extension of ring roads. With state ownership of urban land (and collective ownership by villages of rural land), the land urbanization process has resulted in increasing marketization of land use and increased government revenues.
In other words, China’s urbanization can be described as unbalanced with land urbanization occurring faster than population urbanization. Therefore, it is incomplete and not accurate to measure urbanization only by using the proportion of urban to total population. Land urbanization also needs to be considered. In fact, Ye and Wu [4] argue that urban land expansion is a better measure of urbanization in China. Hence, in addition to population urbanization, land urbanization is also introduced in this study to measure the level of urbanization. Following Gu and Wu [49], population urbanization in this study is defined as the transformation process of population movement from rural to urban areas (described also as rural-urban migration) while land urbanization is defined as the conversion process of rural land into urban. This allows for the effect of urbanization on environmental impact to be analysed in a more comprehensive and robust way. In the process of population urbanization, the rapid increase in urban dwellers intensifies the demand for all types of resources. Urban residents tend to consume more resources and energy and consequently population urbanization contributes to the generation of more pollutants and greenhouse gases, resulting in a greater pressure on the environment. Land urbanization implies the expansion of urban land and spatial reconfiguration, including creating new zones, new towns, extension of ring roads and land reclassification from rural into urban. The economic activities on the new urban land also consume more energy resources, and even directly damage the natural ecological systems, producing negative impacts on the environment.
In view of the above, we introduce population urbanization and land urbanization, which represent better urbanization in China, into the STIRPAT model. Then, based on China’s 2006–2014 provincial panel data and using the improved STIRPAT model, we assess the effects of the driving forces on China’s environmental impact. Furthermore, as China has a vast territory with complex geographical conditions and large differences between provinces, we divide the country into three regions, namely eastern, middle and western, and establish models to analyse the driving factors of environmental impact in each of them. This helps to better understand the characteristics and key determinants for each region and outline policy implications.
The remainder of the paper is structured as follows. The extended STIRPAT model is outlined in Section 2 with the adopted variables explained. Section 3 analyses the data and Section 4 presents the empirical results, including a comparative analysis. Concluding remarks and policy implications are given in Section 5.
2. Extended STIRPAT Model
Ehrlich and Holdren [11,54] firstly used the I = PAT formulation to assess the impact of the Earth’s growing population on the environment. The idea behind the model is that environmental impacts (I) are a multiplicative function of population size (P), affluence (A) represented as per capita consumption or production, and the level of environmental damage caused by technology per unit of consumption or production (T) [35]. Subsequently, studies have added other factors from different perspectives to expand the IPAT model, proposing the ImPACT—Environmental Impact on Modifying Population, Affluence, Consumption and Technology [55], ImPACTS–Environmental Impact on Modifying Population, Affluence, Consumption, Technology and Society [56] and IPBAT – Environmental Impact on Population, Behaviour, Affluence, and Technology [57] models. They all assume that the elasticity of environmental impact with respect to P, A, T and other determinants is only one respectively. This means that in the model each driving factor is equally important for the environmental impact. To overcome this pivotal limitation, Dietz and Rosa (1994) proposed the STIRPAT (Stochastic Impacts by Regression on Population, Affluence and Technology) model, which is the stochastic form of IPAT. The standard STIRPAT model is:
After taking logarithms, the model becomes:
where the subscript i denotes the observational units; t is the year; b, c, and d are, respectively, the coefficients of P, A, and T; e is the error term; and a is a constant.
Then, the model can analyse non-proportionate contributions of the various variables to environmental impact while the multiplicative logic of the equation I = PAT is still preserved. When the model is converted into natural logarithms, the coefficients of the explanatory variables are interpreted as elasticities. York et al. [16] pointed out that additional conceptually appropriate factors can be added to the basic STIRPAT model to improve its multiplicative specification. Subsequently, corresponding improvements are often made to the original model in a variety of empirical studies according to their specific research aims and requirements [24]. Most studies added additional variables to the basic STIRPAT model.
This study analyses not only the effect of population, affluence and technology, but also the effect of population urbanization level, land urbanization level, industrialization level and foreign trade degree on the environmental impact. The impacts of population, affluence, energy intensity, urbanization level (namely population urbanization level in this study) and industrialization level on environmental impact or CO2 emissions have been demonstrated in many studies, including Lin et al. [35], Liddle and Lung [43], Poumanyvong and Kaneko [58], Martínez-Zarzoso and Maruotti [19] and Li and Lin [21]. Frankel and Rose [59] proposed that increase in the degree of foreign trade helps the country attract advanced technology and management ideas from developed countries. Furthermore, it is beneficial to promote energy efficiency and economic growth while reducing the impacts on the environment. Shahbaz et al. [60] found that trade openness (exports + imports) per capita produced a negative impact on the CO2 emissions of Pakistan whether in the long- or short-run. Jalil and Mahmud [61] observed that trade openness, measured by the ratio of total value of exports and imports to GDP, had a significant negative effect on CO2 emissions for China. However, Li and Lin [21] indicated that the influence of the foreign trade degree, similarly measured by the ratio of total value of exports and imports to GDP, on CO2 emissions was positive in China. Therefore, the effect of the foreign trade degree on environmental impact is uncertain, and will be analysed in this study. Then similar to Martínez-Zarzoso and Maruotti [19], Li and Lin [21] and Wang and Zhao [31], this article revises Equation (2) by adding population urbanization level (PUr), land urbanization level (LUr), industrialization level (Ind) and foreign trade degree (FTD) to the set of factors, resulting in Equation (3):
where the sub-index i refers to provinces in China and t refers to the different years; I denotes environmental impact; P is the total population, PGRP is the GRP per capita, EnI is the energy intensity, Ind is the industrialisation level, FTD is the foreign trade degree, PUr is the population urbanization level, and LUr is the land urbanization level; PGRP and EnI, respectively, represent the affluence (A) and the technological level (T). The specific descriptions of the variables used in this study are shown in Table 1.
Due to the absence of reliable statistical data about the environmental impact of pollutant emissions in China, we have to calculate environmental impact through indirect measures. Referring to Lin et al. [35], we calculate the impact on the environment of the pollutants produced in the process of consuming all energy resources. Its basic rationale is that coal, oil and gas emit respectively different amounts of pollutants, including carbon dioxide (CO2), sulphur oxides (SOx), nitrogen oxides (NOx), particulate and volatile organic compounds, when used to produce 1 MJ of energy. The respective weights per 1 MJ of energy for the influences of CO2, SOx, NOx, particulate and volatile organic compounds are 0.6, 0.1, 0.1 and 0.1 [34]. The influence coefficients (represented by Bi) of the pollutants emitted by coal, oil, gas, hydro, nuclear and wind power are, respectively, 1, 0.79, 0.55 and 0 [34]. Then, the impact on the environment of the pollutants produced in the process of consuming each energy resource is the product of the respective energy consumption multiplied by bi. The total environmental impact is the sum of the impacts of the various energy resources. Energy intensity of primary energy is primary energy consumption divided by Gross Domestic Product (GDP) or Gross Regional Product (GRP).
As explained, urbanization is measured by population urbanization level and land urbanization level. The population urbanization level is represented by the proportion of urban population to total population. In principle, land urbanization level should be measured by the proportion of urban land area to total land area. However, urban land area is not yet counted; therefore we replace it with the proportion of area of built districts to total city proper area to reflect the land urbanization level. With the United Nations projecting that almost all global population growth between 2016 and 2030 is likely to be absorbed in the cities, this will add about 1.1 billion new dwellers to the urban fabric [62]. Ye and Wu [4] similarly use the proportion of area of built districts to total city proper area to measure the land urbanization level in China. Therefore, this indicator should be able to reflect well the land urbanization level of China.
3. Data Source and Description
This study constructs a balanced panel data set for China’s 30 mainland provinces (excluding Tibet) for the 2006–2014 period for which all relevant data are available. The data sources used and the description of the data are described in turn below.
3.1. Data Source
City proper area is counted as the greater city area listed in China’s Statistical Yearbooks before 2006. This allows for the changes in the land urbanization level, represented by the proportion of built districts area to total city proper area, to be manifested. In order to ensure data consistency, we also use 2006 data for the other variables. As 2015 data on energy consumption and energy structure for many provinces are not available, the end date of the study period is 2014. Population and GRP per capita data are collected from China’s 2007–2015 Statistical Yearbooks. Data on environmental impact, energy intensity, industrialization level, foreign trade degree, population urbanization level and land population level are calculated from China’s 2007–2015 Statistical Yearbooks and all 2007–2015provincial statistical yearbooks.
As pointed out, due to big differences across the country, China is divided into three regions—eastern, middle and western. According to the classification method of the National Bureau of Statistics of China, the eastern region includes 11 provinces: Beijing, Tianjin, Hebei, Liaoning, Shanghai, Jiangsu, Zhejiang, Fujian, Shandong, Guangdong and Hainan; the middle region includes eight provinces: Shanxi, Jilin, Heilongjiang, Anhui, Jiangxi, Henan, Hubei and Hunan; and the western region includes 11 provinces: Neimenggu, Guangxi, Chongqing, Sichuang, Guizhou, Yunnan, Shangxi, Gansu, Qinghai, Ningxia and Xinjiang. In addition to the overall analysis of the 30 provinces in the whole of China, we also establish separate models to respectively analyse each region.
3.2. Data Description
Figure 1, Figure 2, Figure 3, Figure 4, Figure 5, Figure 6, Figure 7, Figure 8 and Figure 9 describe the changes in the variables according to the original data (without logarithmic transformation) over the period 2006–2014. They show that:
- (1)
- China’s population urbanization level was higher than land urbanization level, with the former increasing much slower than the latter, with an average annual growth rate of 2.68% and 3.74%, respectively. This means that China has been simultaneously promoting population urbanization and land urbanization, however urban land expanded faster.
- (2)
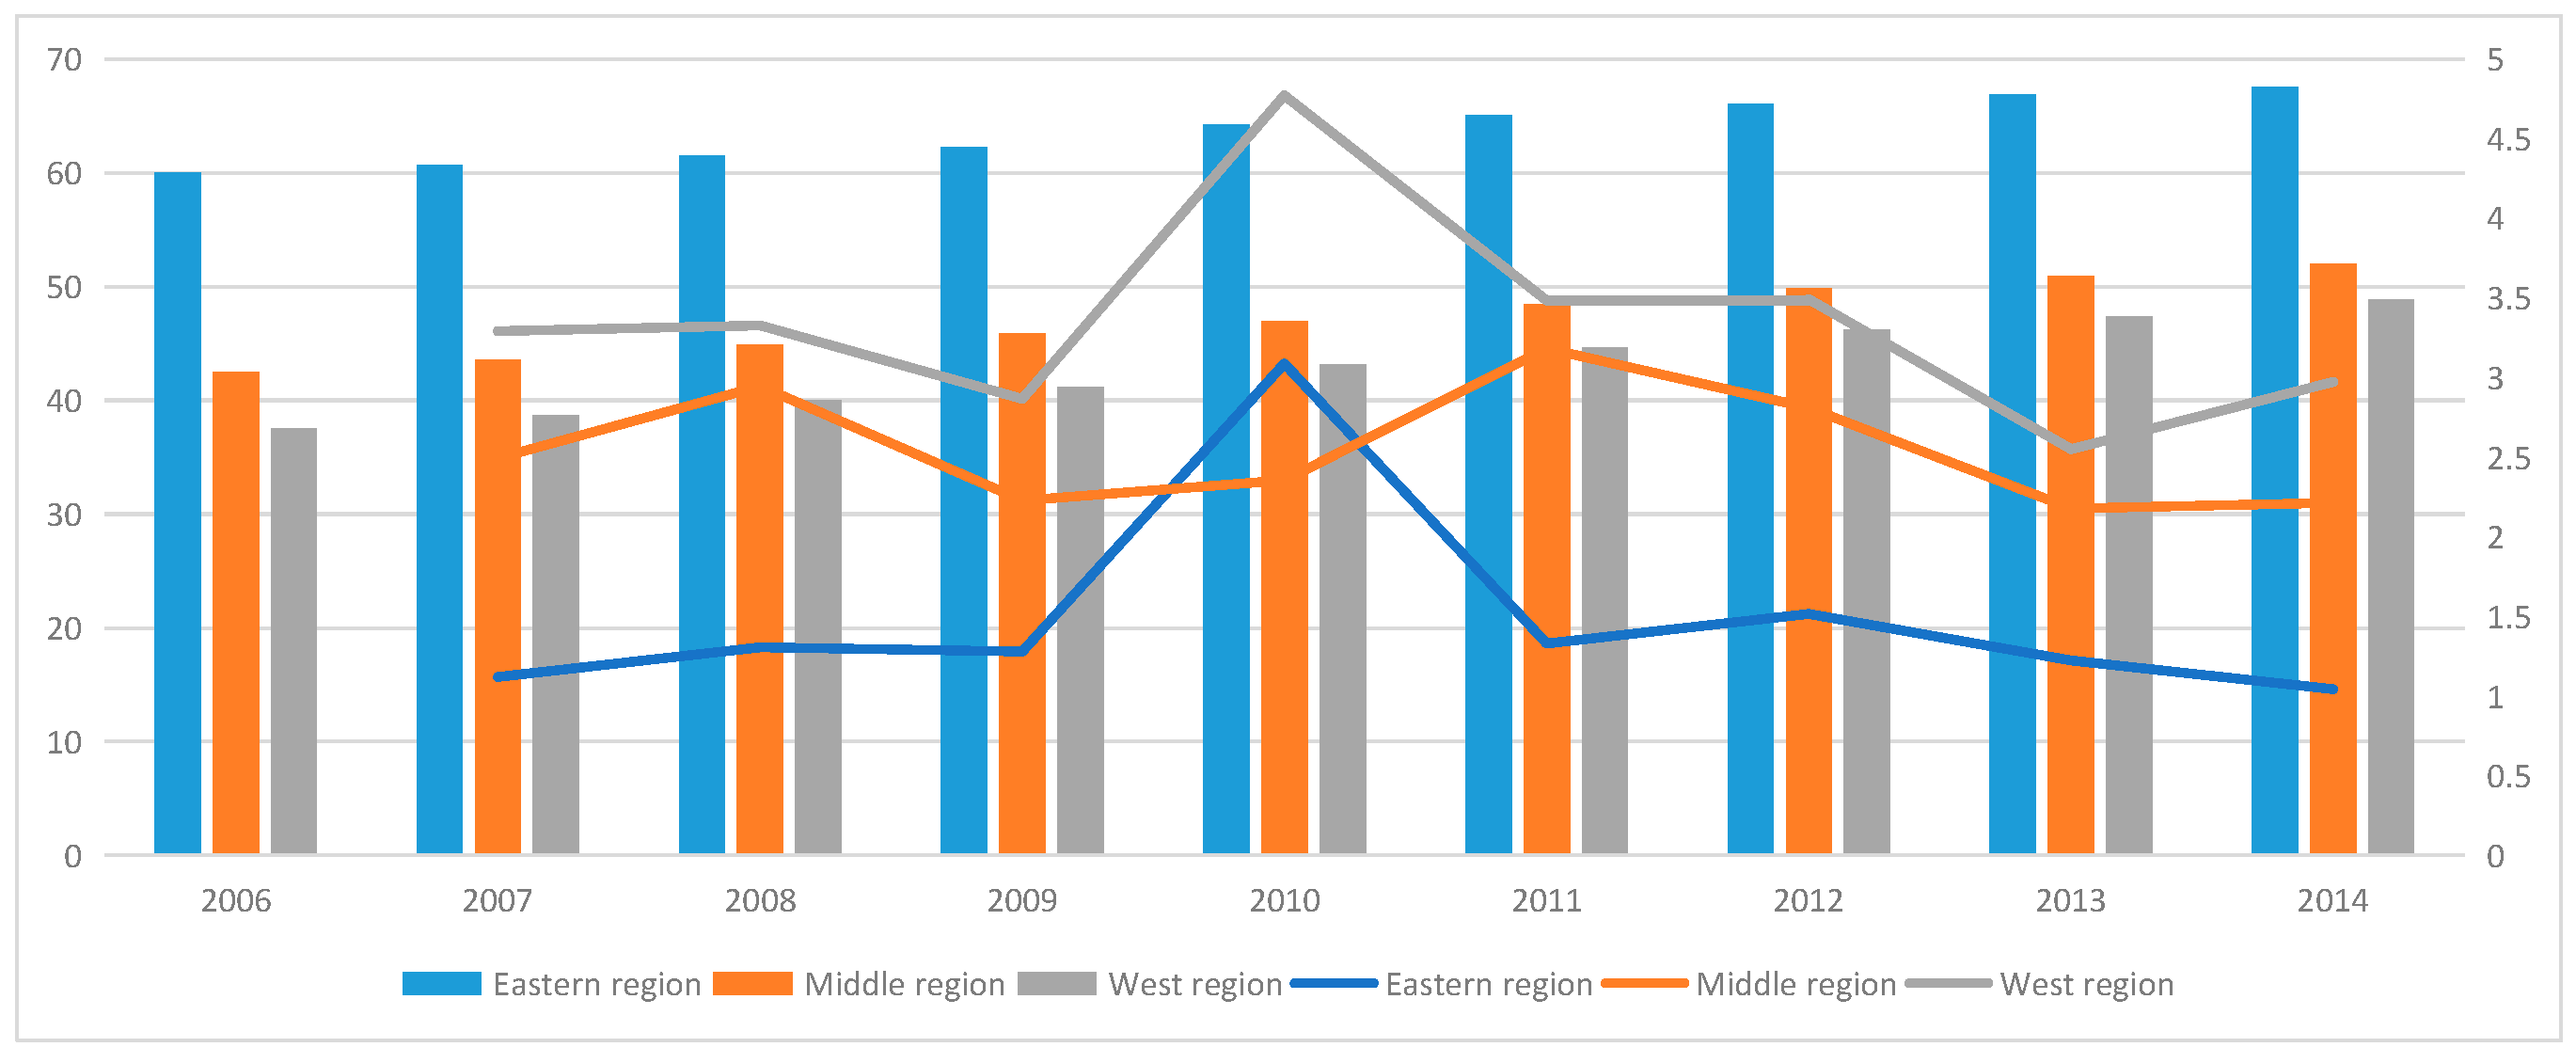
- The eastern region had the highest population urbanization level, followed by the middle and western regions. However, the average annual growth rate of the population urbanization level of the eastern region was much lower than that of the middle and western regions, which were 1.49%, 2.55% and 3.34%, respectively. The situation with land urbanization was very different—the middle region had the highest land urbanization level, followed by the western and eastern region. Furthermore, the average annual growth rate of the land urbanization level was the highest for the middle region, reaching 4.68%, while the western region had the lowest only at 0.35%, and the eastern region’s was in between at 1.79%. In other words, the processes of population urbanization and land urbanization in the eastern region were coordinated, while the land urbanization process in the middle region was much faster than the population urbanization process, and the land urbanization process in the western region was much slower than the population urbanization process.
- (3)
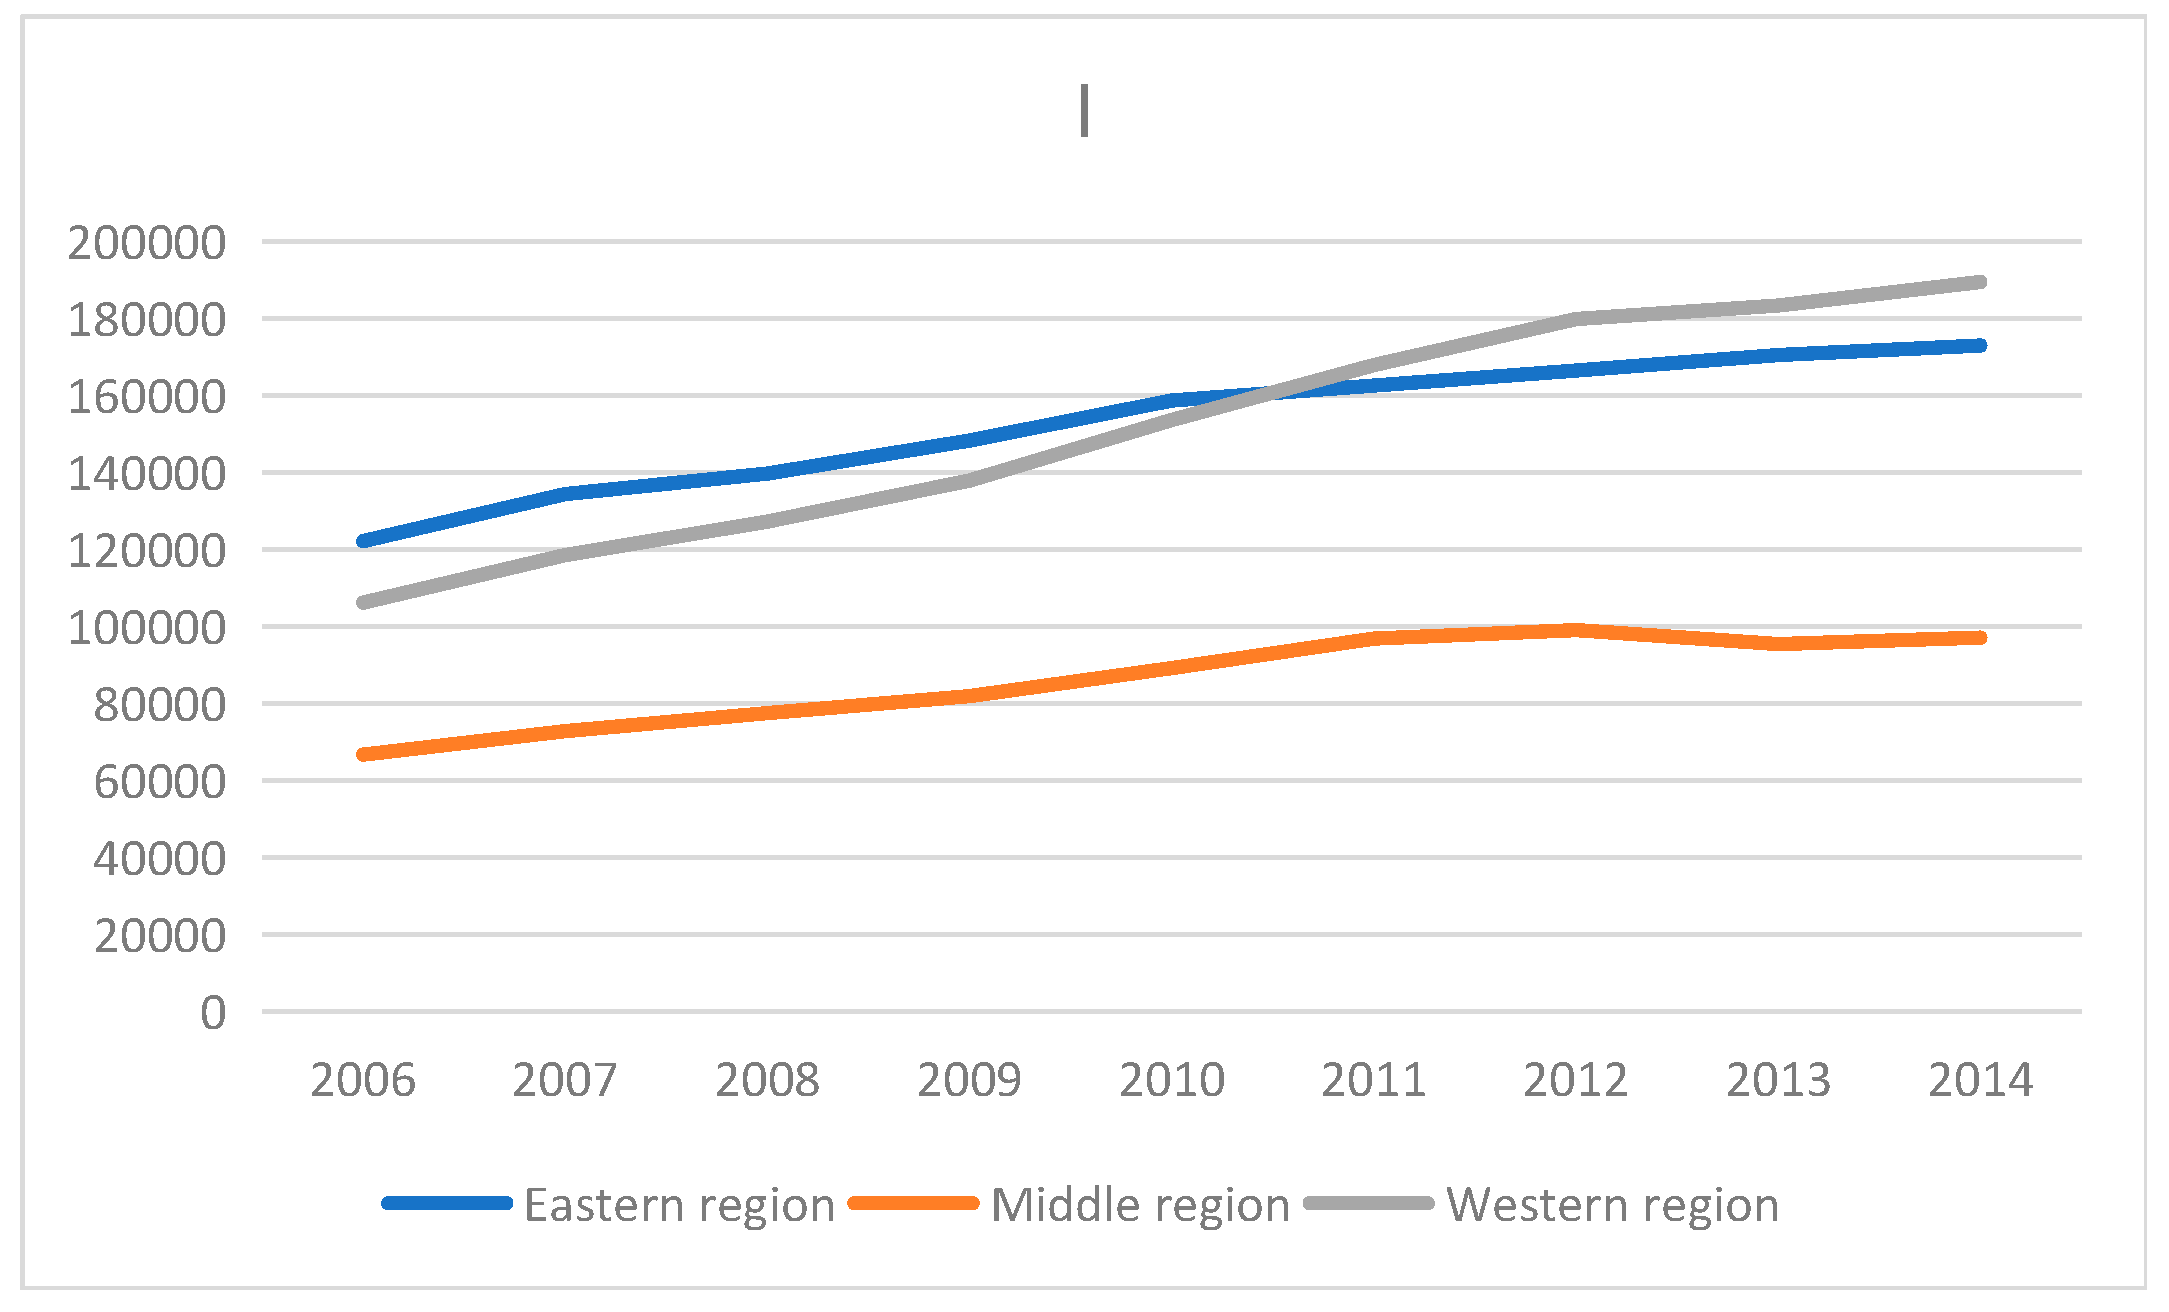
- Environmental impact grew very fast in the western region with an average annual growth rate of 7.51%, much higher than that of the eastern and middle region. In 2011, the western region’s environmental impact surpassed the eastern region’s and became the greatest.
- (4)
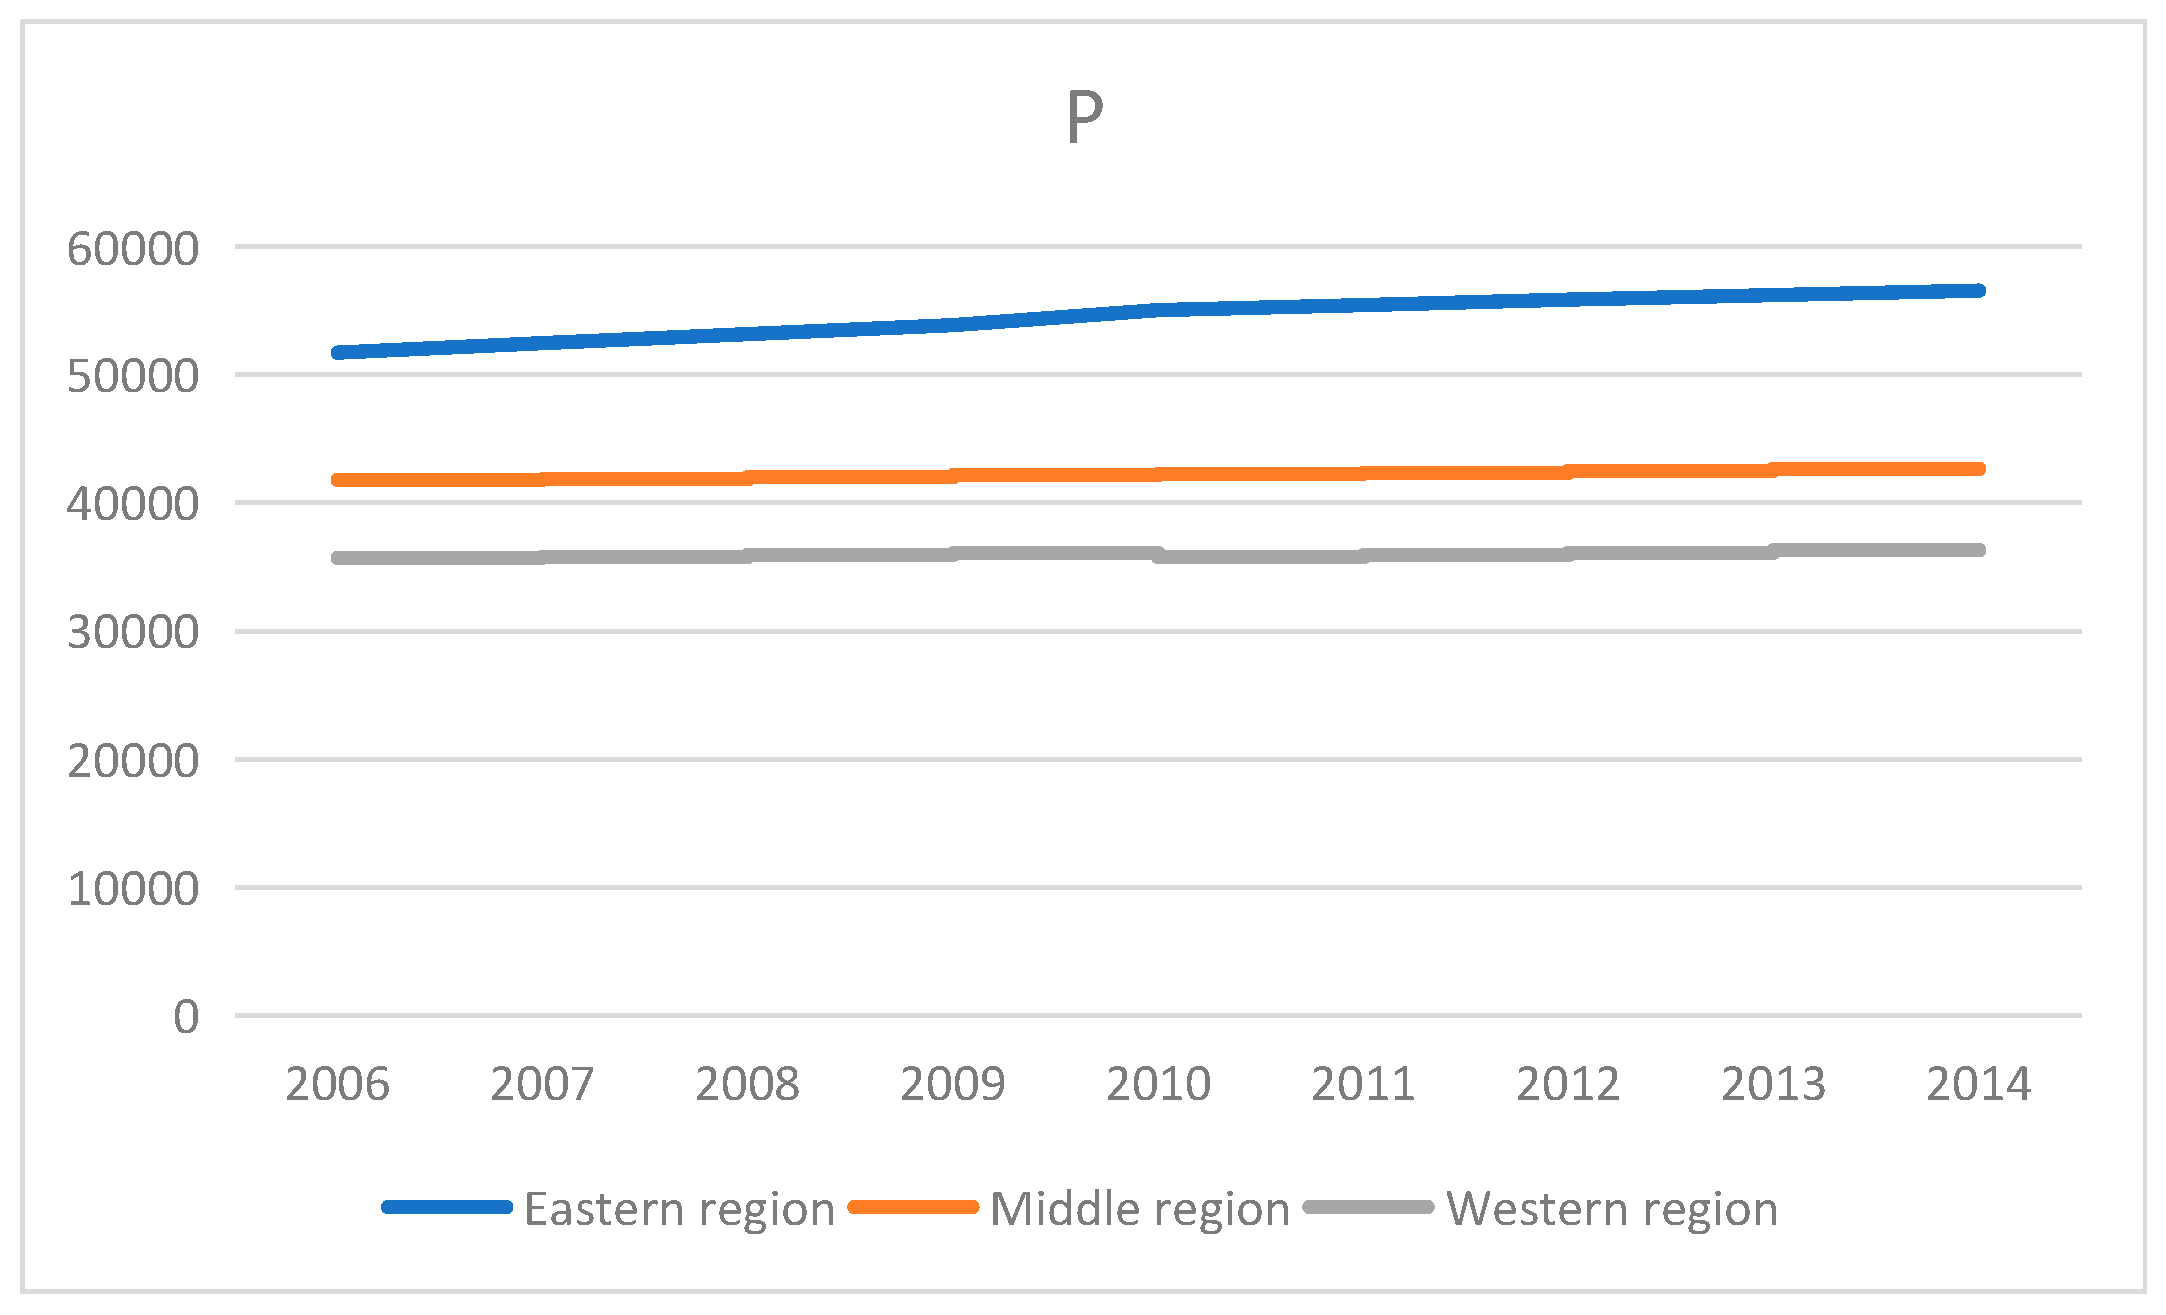
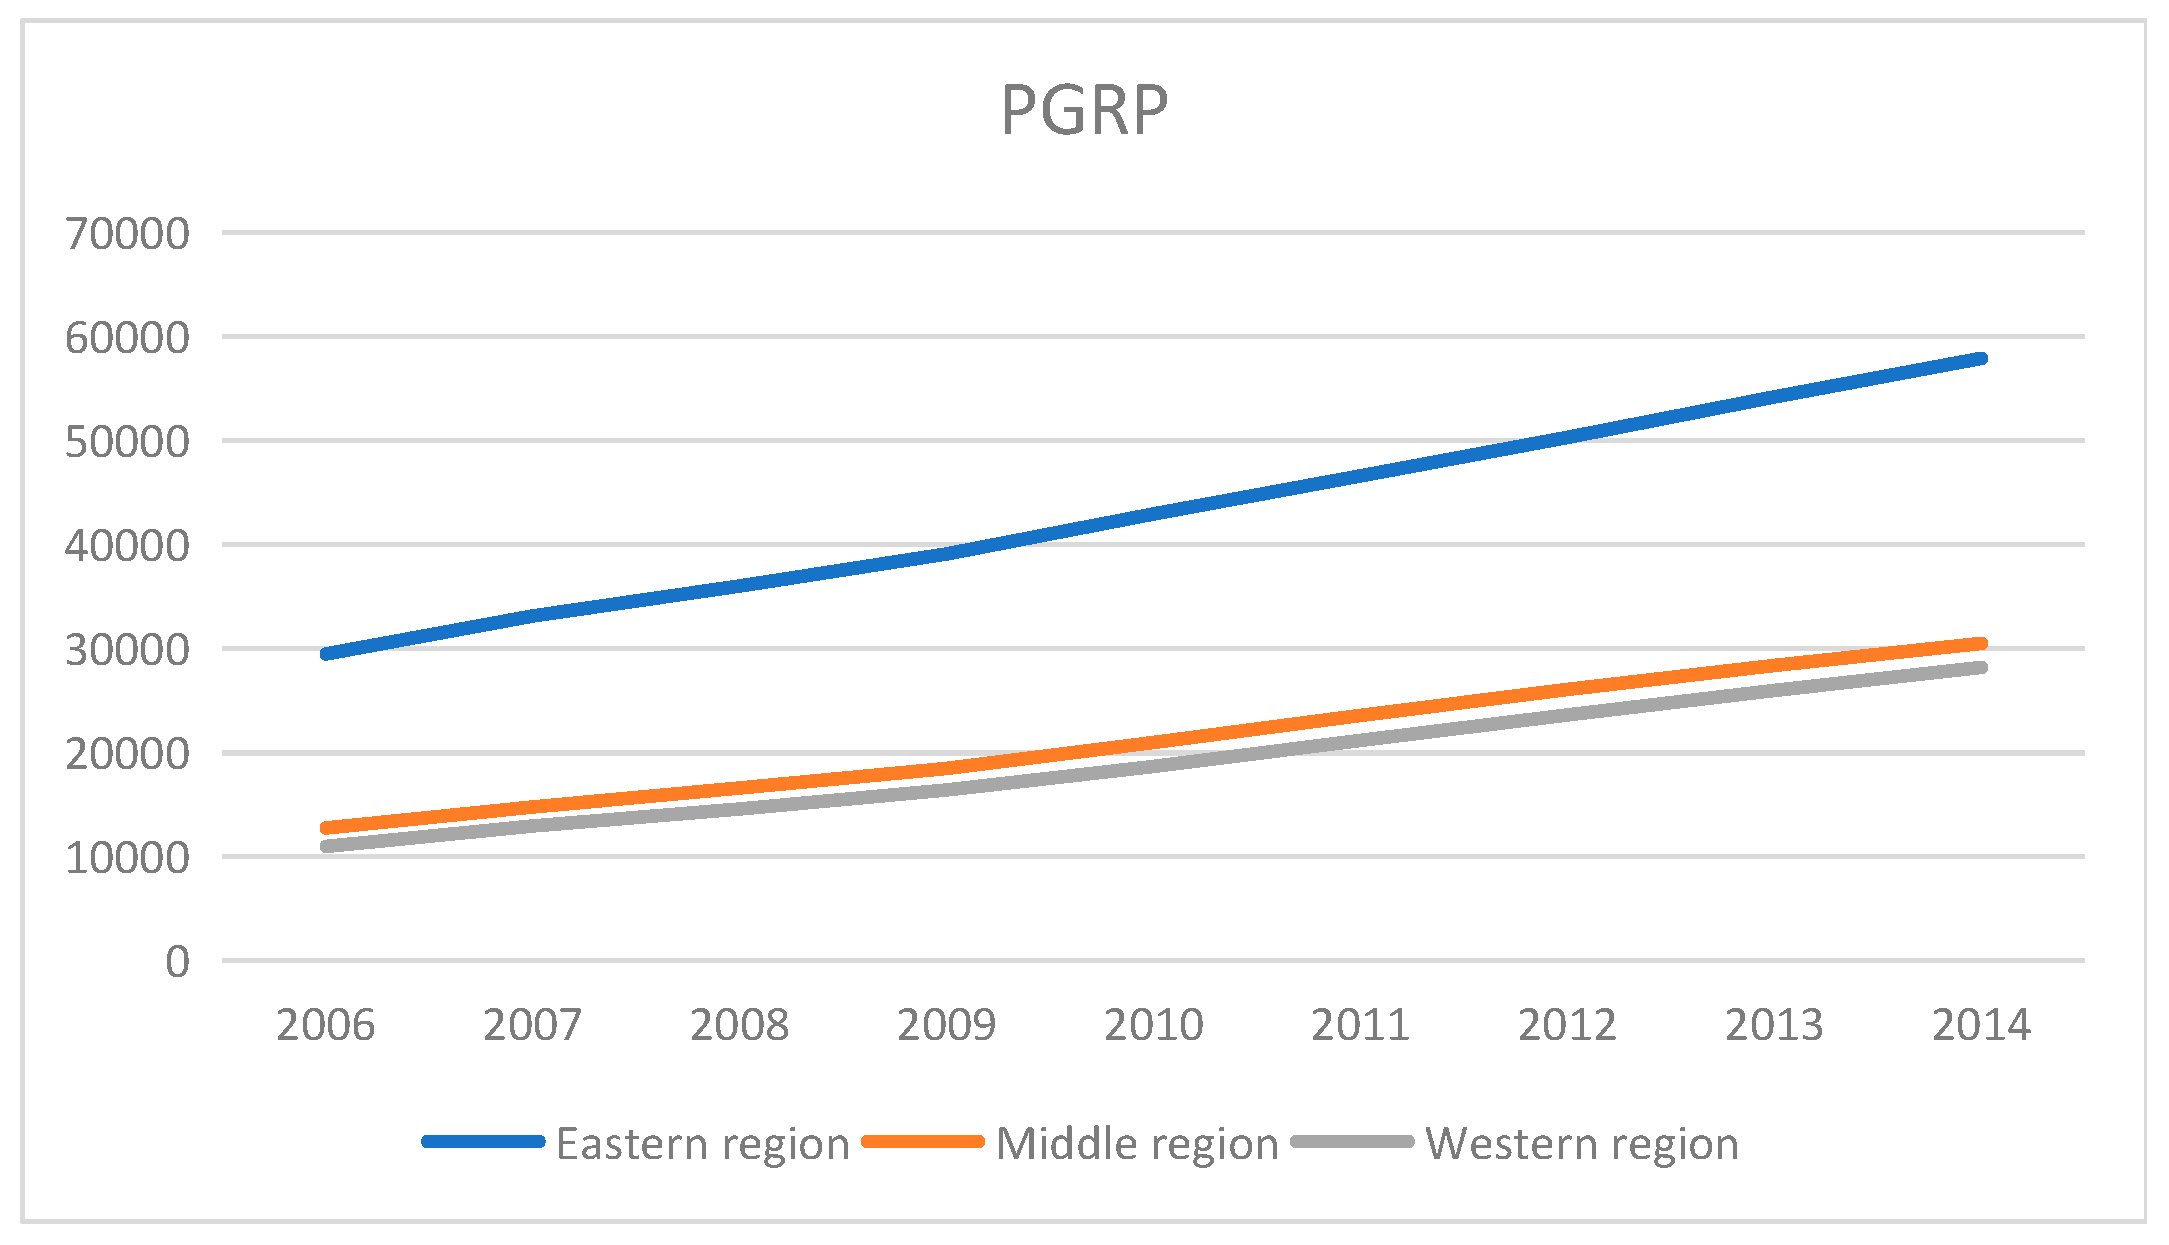
- The eastern region had the highest population, GRP per capita and energy utilization efficiency (i.e., the lowest energy intensity), followed by the middle and western region. The populations in these regions grew slowly, while the GRP per capita increased very fast, especially for the middle and western region. Moreover, all energy intensities in these regions decreased very fast, with average annual growth rates of −5.19%, −5.65% and −3.98%, respectively.
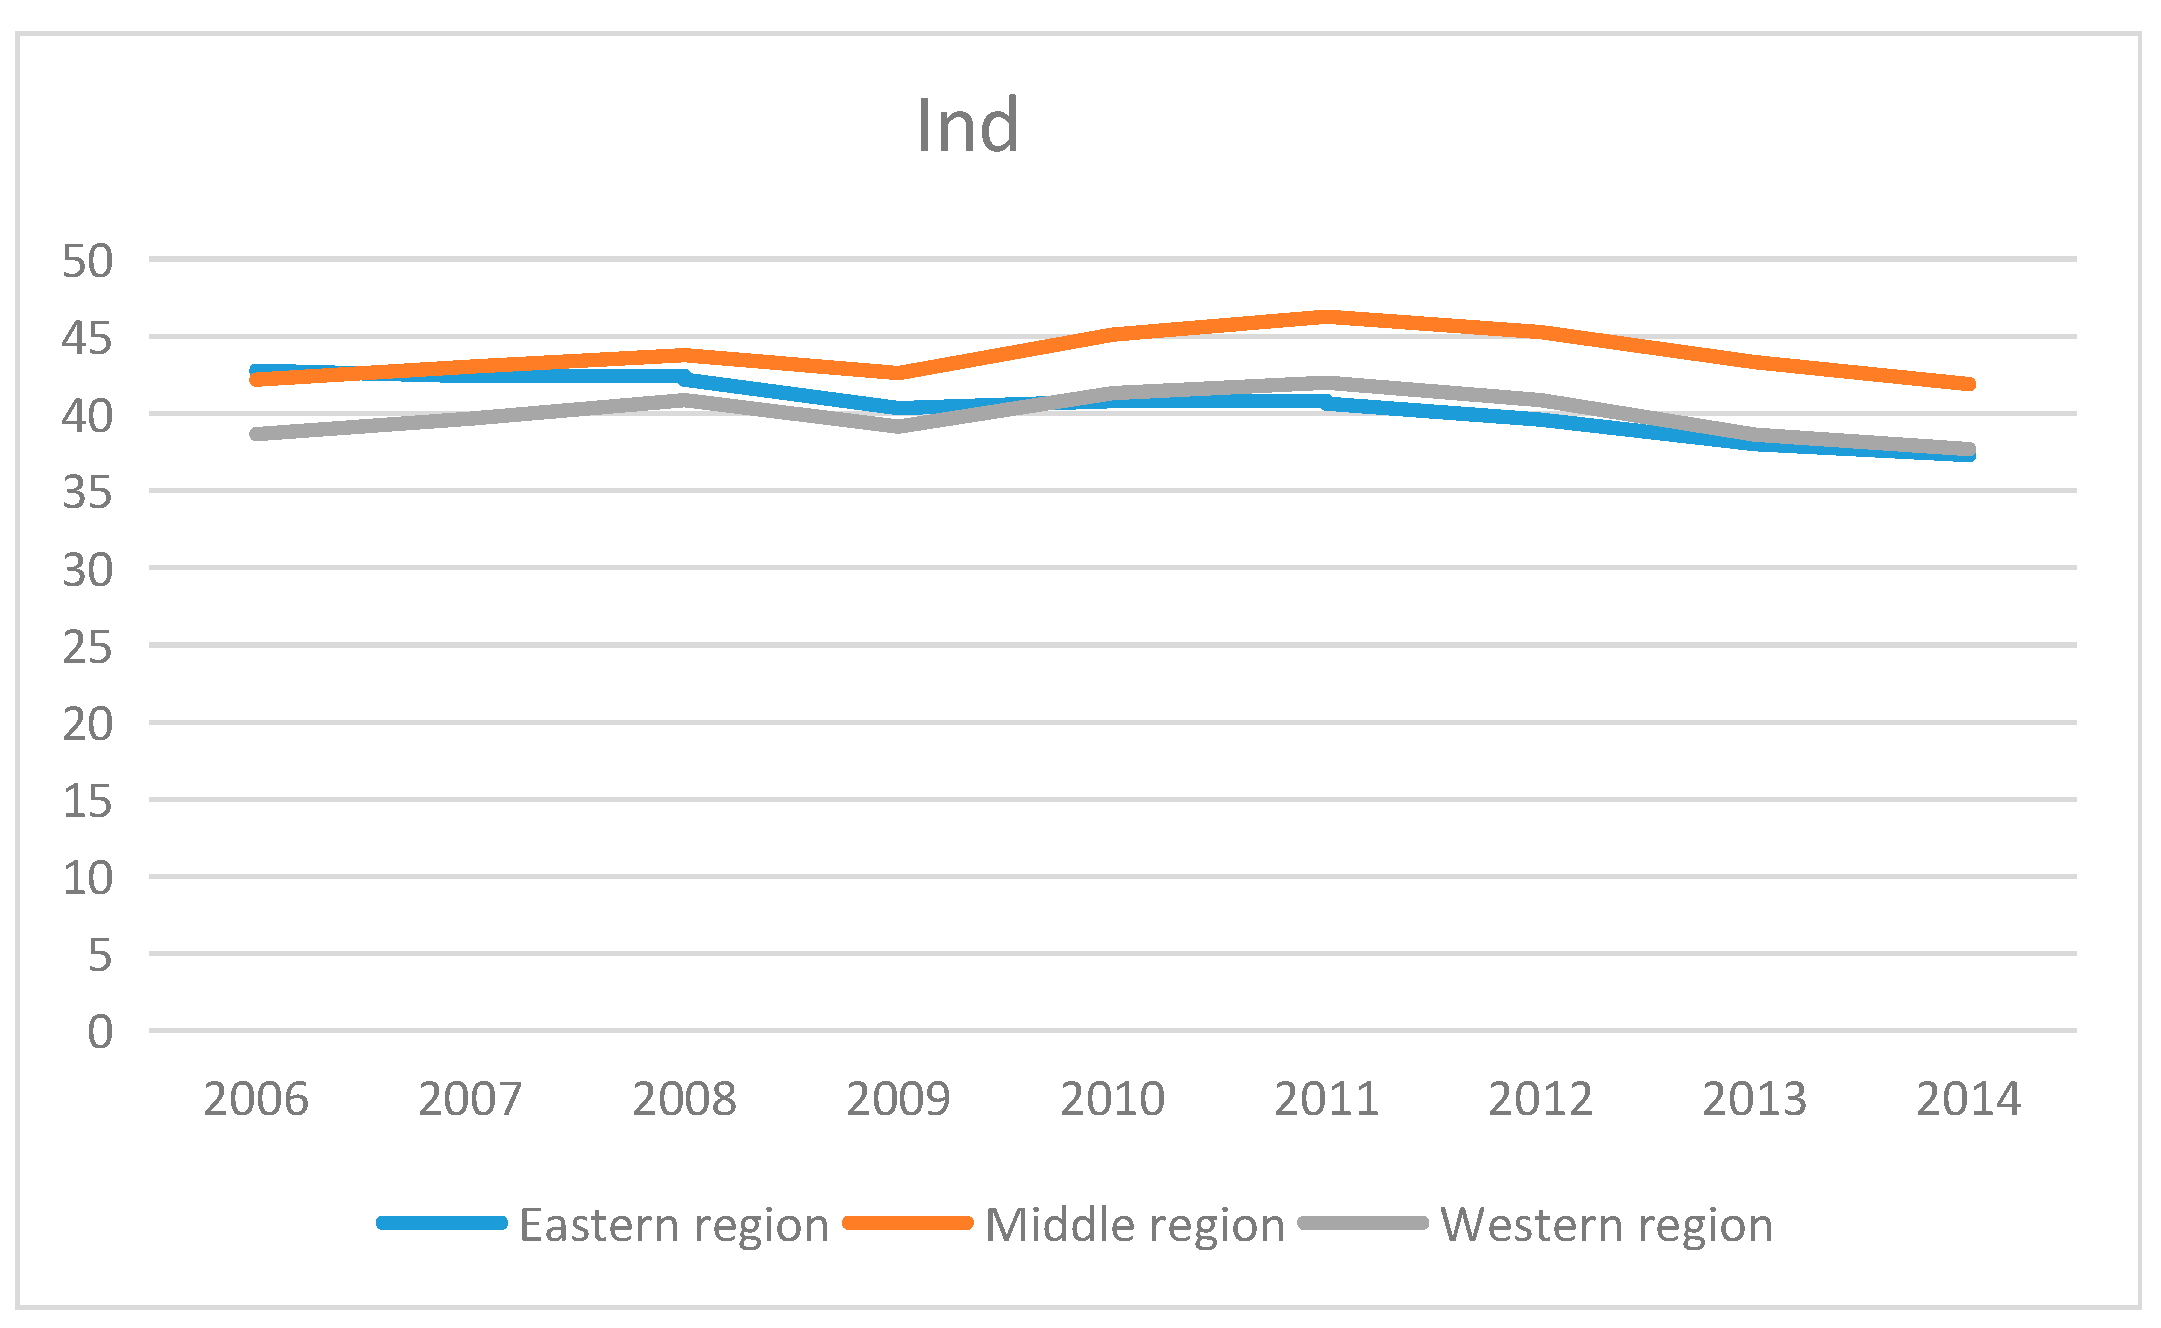
- (5)
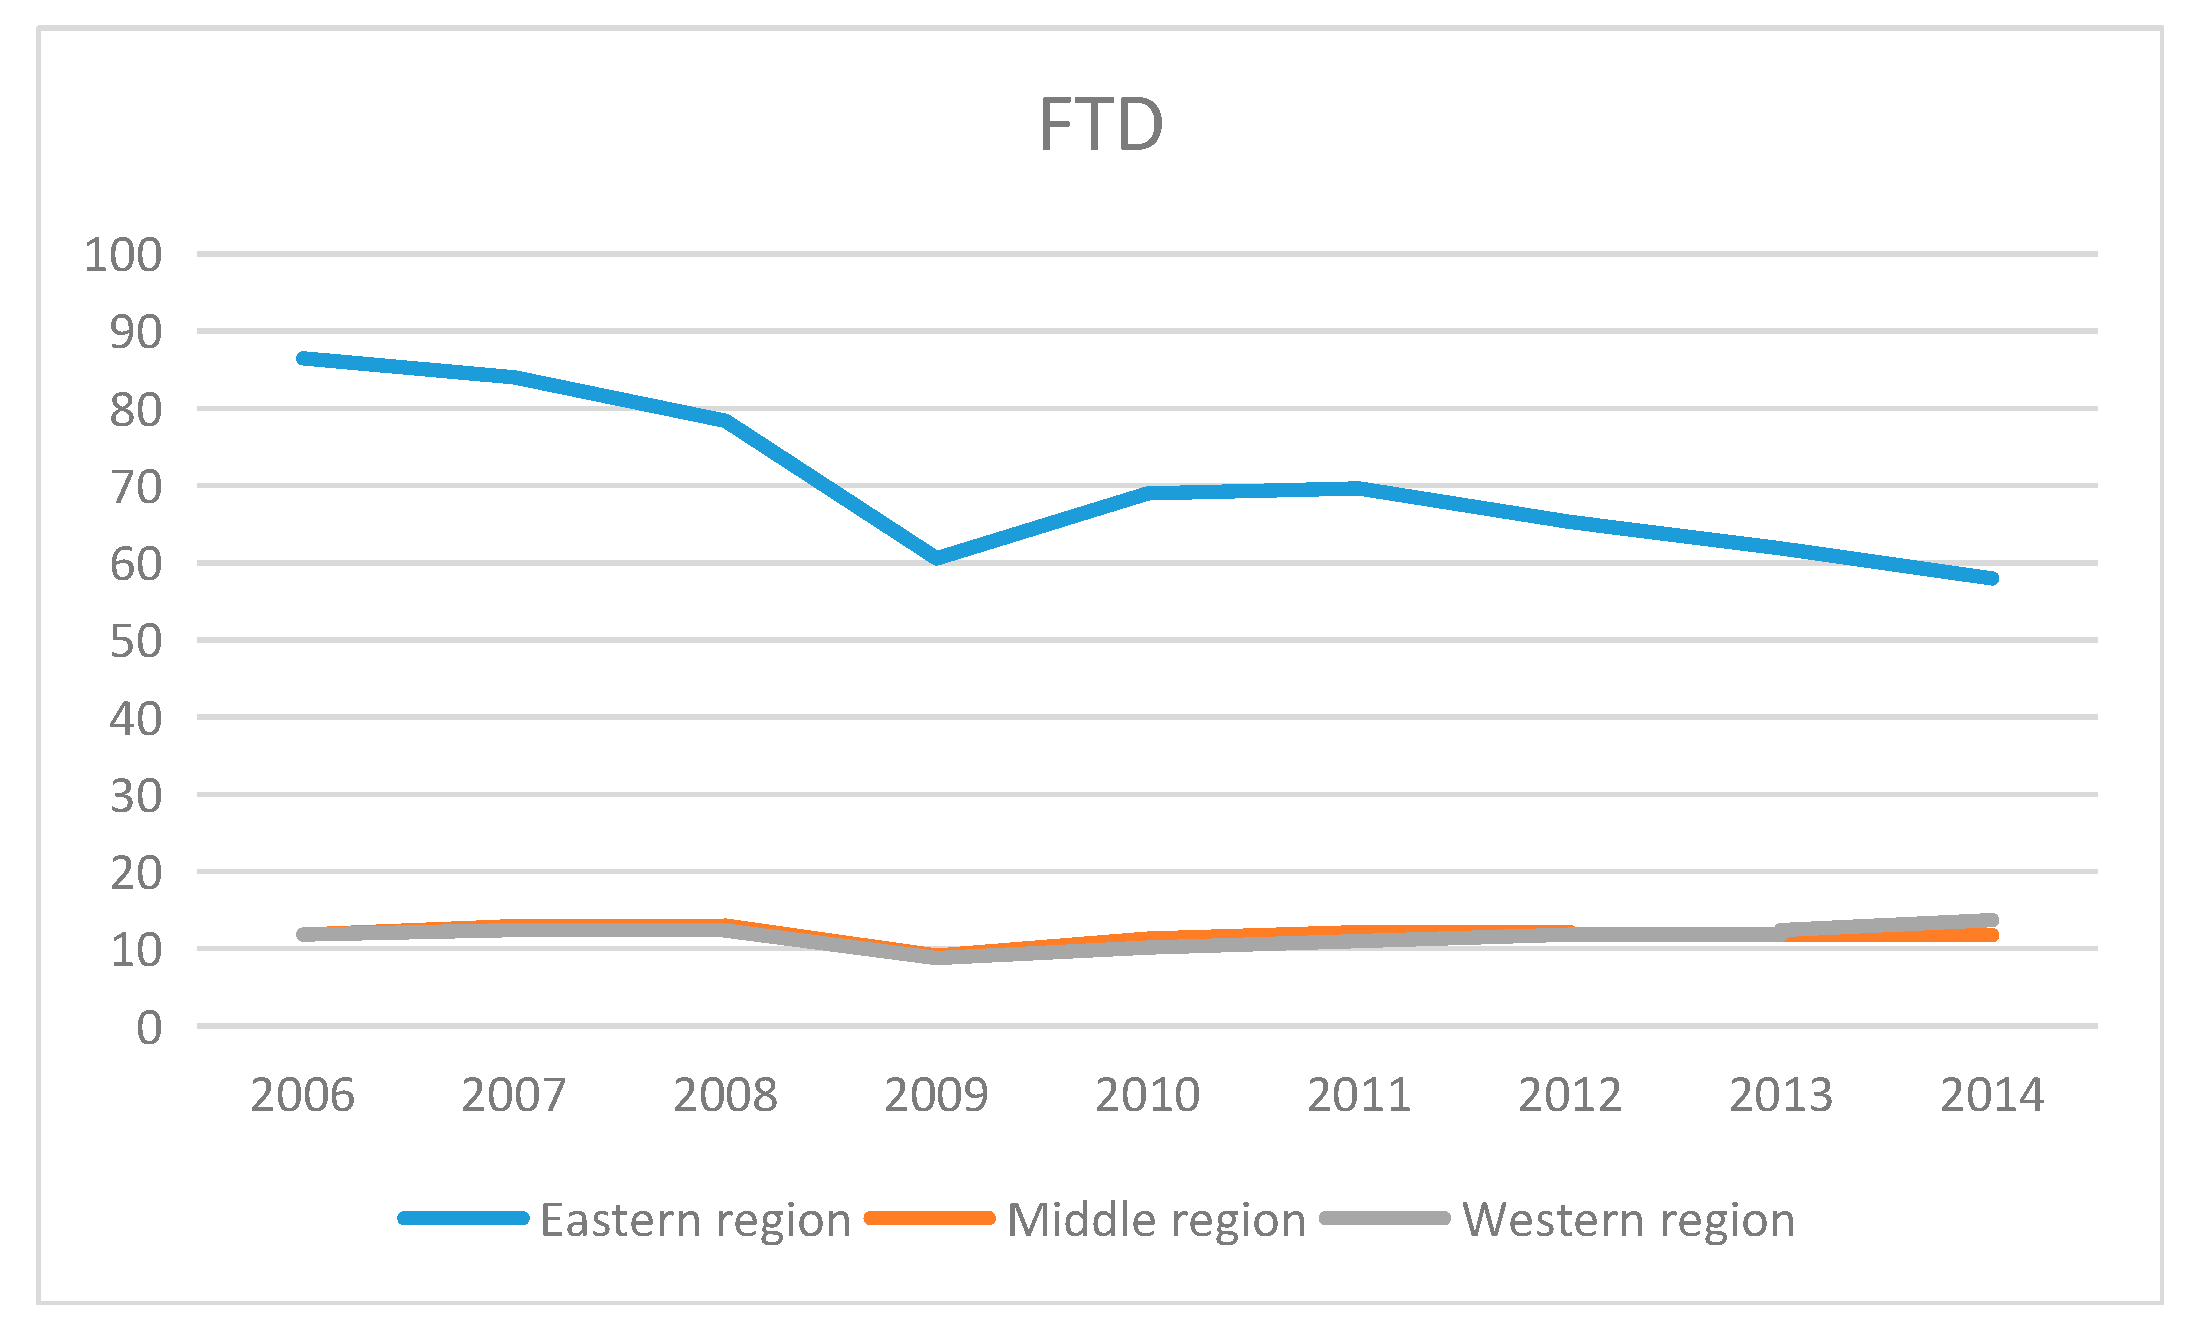
- The industrialization levels of these three regions were very close and hardly changed. Foreign trade degree in the eastern region was much higher but gradually declined whilst the foreign trade degrees of the middle and western regions slowly increased, narrowing the gap with the eastern region.
4. Empirical Results and Analysis
The regression results from the extended STIRPAT model and the contribution to environmental impact of the main driving forces are presented below. As indicated earlier, the compatible 2006–2014 data set allows for analysis of the overall group of 30 provinces as well as the three regions.
4.1. Regression Results
In the extended STIRPAT model, the dependent variable is environmental impact (I), while population (P), GRP per capita (PGRP), energy intensity (EnI), industrialization level (Ind), foreign trade degree (FTD), population urbanization level (PUr) and land urbanization level (LUr) are independent variables (refer to Equation (3)).
Table 2 shows that lnPUr and lnPGRP are highly correlated, hence there might be multicollinearity in the model. Similar situations also exist in the eastern, middle and western regions. However, as we know there is no strong correlation in an economic sense between population urbanization level and GRP per capita. The high correlation coefficient just indicates high correlation of the data. In addition, multicollinearity is essentially a problem of not enough data, described as micronumerosity [63]. The use of panel data increases the size of the samples, and thus reduces the disturbance of multicollinearity. Therefore, the multicollinearity is not a serious problem. In fact, strong statistical results imply that there are good reasons to believe that the conclusion is true [63] and the multicollinearity can be disregarded [64].
The model estimation was carried out using the software STATA12.0. Table 3 presents the results from the regression models when the dependent variable is lnI for the whole of China. Model 1 in Table 3 estimates the influences of lnP, lnPGRP and lnEnI on lnI. Model 2 adds lnInd and lnFTD based on Model 1. Then, Model 3 adds lnPUr and lnLUr based on Model 2. The models in Table 4, Table 5, Table 6 and Table 7 for the western, middle and eastern region are similar to the models in Table 3. Based on the results from the Hausman Test presented in the tables, all models are estimated using random effects, except Model 9, which is estimated using fixed effects.
In order to check the robustness of the model, the environmental impact (I) in Equation (3) is replaced with CO2 emissions. The CO2 emissions are calculated based on the energy consumption through the method provided by Wang et al. [28] and Wang and Zhao [31]. Table 4 shows the results from the re-estimated model with the new variables based on the 2006–2014 panel data. The regression results in Table 3 and Table 4 are very close which means that the model is robust and credible. Below is a further analysis of the results presented in Table 3.
The results in Table 3 show that population, GRP per capita and energy intensity are all statistically significant in Model 1 and have positive effects on environmental impact. The conclusion is consistent with other studies, such as Lin et al. [35], Wang and Zhao [31], Cao et al. [38]. In Model 2, population, GRP per capita and energy intensity are still statistically significant, while industrialization level and foreign trade degree are not significant. In Model 3, the effect of population urbanization level on environmental impact is statistically significant with a coefficient of −0.2843, which means that the environmental impact decreases by 0.2843% per 1% increase in population urbanization level. The effect of land urbanization level on environmental impact is not statistically significant and its coefficient is very small, only 0.0036, which means that land urbanization does not produce a significant influence on China’s environmental impact.
The results from the models established to analyse the driving factors of environmental impact in the eastern, middle and western region are presented in Table 5, Table 6 and Table 7. They show that the effects of population urbanization and land urbanization on environmental impact vary across the different regions.
Table 5 shows that population, GRP per capita and energy intensity also have significant effects on environmental impact for the eastern region, which is similar to the results for the whole of China in Table 3. However, in Model 6, the industrialization level of the eastern region produces significant negative influence on environmental impact, with the coefficient of −0.1090. This means that the environmental impact of the eastern region declines by 0.1090% per 1% increase in its industrialization level.
The effects of population urbanization level and land urbanization level are not statistically significant. However, we believe that such effects may actually exist in practice. The eastern region of China has attracted a large number of people from the middle and western regions, so that its population density reached 527 persons per km2 in 2014—much higher than those of the middle and western region, which were respectively 257 persons per km2 and 54 persons per km2. If the population urbanization level continues to increase, the urban population will continue to expand and inevitably cause greater environmental impact. However, if the land urbanization level increases faster, the urban land area will expand even faster. Then the population pressure on the cities and towns, especially the central cities and towns, will decline. Consequently, the environmental impact will decrease. For example, in 2012, the Beijing municipal government proposed to build Tongzhou as a subsidiary administrative centre for the capital city. An important goal with this is to reduce the pressures on resources and the environment in Beijing city (Liu, Q., 2012. Full text of Liu Qi’s Report at 11th Party Congress of Beijing on 29 June 2012. (In Chinese) Available at: http://www.bj.xinhuanet.com/bjzw/2012-07/05/c_112476528.htm).
Table 6 shows a different situation in the middle region from those for the whole of China and the eastern region. In Model 8, the effects of industrialization level and foreign trade degree on environmental impact are statistically significant. The increase in industrialization level will cause increase in environmental impact, while increase in foreign trade degree will reduce environmental impact. However, compared to Model 8, in Model 9 the industrialization level is no longer significant, and its coefficient also slightly decreases while foreign trade degree still has a significant negative effect. Furthermore, the effect of population decreases a little, while the effects of GRP per capita and energy intensity vary only slightly.
The population urbanization level and the land urbanization level both have negative effects on environmental impact, but they are not statistically significant. Similar to the eastern region, the middle region’s population density is also very high. A further increase in the land urbanization level may be beneficial to reducing the population density and environmental impact. The population urbanization level of the middle region is still very low, only 52.02% in 2014, much lower than the 67.57% in the eastern region. This implies that population urbanization can still be improved in the middle region. According to UNFPA [1], urbanization is linked to sustainability opportunities related to potentially more efficient use of resources, better sustainable land use and protection of biodiversity. Therefore, further population urbanization in the middle region will be beneficial to improving the resource utilization efficiency and reducing environmental impact.
Table 7 shows that the western region is very different from both the eastern and middle regions. The influence coefficient of population in the western region is only 0.5911 in Model 12, much lower than those of the eastern and middle regions. However, the effects of GRP per capita and energy intensity were greater than those of the eastern and middle regions. This may be due to the special geographical and ecological environment in the western region. According to the statistics [5], the western region covers an area of 6.88 million km2 (including Tibet), accounting for 71.51% of China, while, in 2014, it had only 368.39 million people, accounting for only 27.04% of China’s population. Its population density was only 54 persons per km2. In other words, the resource per capita is very high, so that the effect of population on environmental impact in the western region is much smaller than those of the eastern and middle regions. In addition, most of the land area in the western region is dedicated to restricted development zone or prohibited development zone, with a relatively fragile ecological environment [65]. Therefore, affluence, technology, industrialization and foreign trade have greater positive influences on environmental impact. Moreover, due to the low population density and population urbanization level (only 48.81% in 2014), population urbanization produces large effects on the environment, with an influence coefficient of −0.6433. Similar to the middle region, further population urbanization in the western region will be beneficial to improving the efficiency of resource utilization and reducing environmental impact. However, increase in the land urbanization level implies expansion of the urban area which will inevitably destroy the relatively good ecological environment and cause greater negative influence on the environment. At the same time, a fast land urbanization would make population density even lower, resulting in waste of resources, which is not beneficial to reducing environmental impact.
In summary, for the whole of China, population urbanization has a significant negative effect on environmental impact, while land urbanization has a small, but not statistically significant, positive effect. The effects of population urbanization and land urbanization vary across the eastern, middle and western regions, which are at different stages of economic and social development. Population urbanization and land urbanization in the eastern and middle regions have no significant influences on environmental impact, while population urbanization in the western region has a significant negative influence.
The industrialization level has no significant effect on environmental impact for the whole of China, but has a significant negative effect for the eastern region. It also has a positive effect for the middle and western regions, but is not significant when considering the effects of urbanization. Foreign trade degree has positive effects for the whole of China, the eastern and western regions, but is not statistically significant. It has a significant negative effect for the middle region. Finally, the main driving forces of environmental impact are population, GRP per capita and energy intensity regardless of whether this refers to the whole of China or any of the three regions.
4.2. Contribution of Driving Forces
The actual effect and each variable’s contribution degree on the increase of environmental impact for the whole of China and the three regions during 2006–2014 are given in Table 8, Table 9, Table 10 and Table 11. For the whole of China, environmental impact increased by 5.69% per annum. The GRP per capita changed the most, increasing by 10.21% per annum, while energy intensity decreased with an average annual growth rate of 4.68%. Similarly, the average annual growth rates (in absolute values) of the foreign trade degree, population urbanization level and land urbanization level are all high at more than 1%. Population and industrialization level changed only slowly.
The big difference in the variables’ changes indicates different actual effects on the environmental impact. Although the regression coefficient for some variables is very high, the actual effect on environmental impact is not as large because of a low average change rate, such as in the case of population. In addition, although the regression coefficient for some variables is very small, the actual effect on environmental impact is not as small because of a high average change rate, such as for population urbanization level. Therefore, it is not sufficient to analyse the regression coefficient or the actual change rate of each factor in isolation. In order to accurately grasp the main driving forces of environmental impact, the actual effect and actual contribution degree of each factor need to be analysed.
Table 8 shows that the actual effect of population urbanization on environmental impact for the whole of China is opposite to that of land urbanization. The population urbanization level resulted in an environmental impact decrease of 0.66% per annum, while the land urbanization level increased environmental impact by 0.01% per annum. The actual contribution degree of population urbanization level is much higher than that of the land urbanization level. With respective contribution degrees of 181.85% and 11.45%, the main driving forces for environmental impact growth are increases in GRP per capita and population. While the main cause of environmental impact reduction is the rapid decrease of energy intensity with a contribution degree of 82.25%. Industrialization level and foreign trade degree also caused environmental impact decreases of 0.02% and 0.03% per annum, respectively, with contribution degrees of 0.39% and 0.54%.
Contrary to the whole of China, the population urbanization level of the eastern region increased environmental impact with a contribution degree of 3.57%, while the land urbanization level caused a decrease in environmental impact with a contribution degree of 0.45%. Growth of GRP per capita had the greatest effect on environmental impact, making it increase 8.43% per annum, with a contribution degree of 190.07%. The increase in population and the decrease in industrialization level also increased environmental impact. Rapid decline in energy intensity is the main cause for environmental impact reduction, with a contribution degree of 122.32%. The decrease in foreign trade degree also contributed to environmental impact reduction.
In the middle region, the population urbanization level and land urbanization level both reduced environmental impact with a total contribution degree of 1.56%. The driving factors for environmental impact growth are only population and GRP per capita. In addition, the contribution degree of population is very low (4.48%). Energy intensity, industrialization level and foreign trade degree all drove decline of environmental impact. The contribution degree of energy intensity is 98.83%, much higher than that of industrialization level and foreign trade degree.
Similar to the whole of China, the population urbanization level in the western region resulted in an environmental impact decrease with a contribution degree of 21.43%, while land urbanization level increased environmental impact with a contribution degree of 0.03%. The actual contribution degree of population urbanization level is much higher than that of land urbanization level. Other driving factors for environmental impact growth are population, GRP per capita and foreign trade degree, while the contribution degrees of population and foreign trade degree are much lower than that of GRP per capita. In addition to the population urbanization level, energy intensity and industrialization level also resulted in environmental impact decrease. However, the contribution degree of industrialization level is just 0.21%, much lower than that of energy intensity.
The above analysis shows that population urbanization and land urbanization have different effects on environmental impact in the different regions. Increase in the population urbanization level made environmental impact rise in the eastern region, but made it decline in the middle and western regions. Similarly, increase in the land urbanization level made environmental impact rise in the western region, but made it decline in the eastern and middle regions. Moreover, the actual effect of population in the eastern region is much greater than that in the middle and western regions.
Irrespective of the region, the main driving forces of environmental impact are GRP per capita and energy intensity while the effects of industrialization level and foreign trade degree are very small. In addition, the effects on environmental impact of other factors should not be ignored, particularly for the middle and western regions, as their contribution degrees are higher than 10%. This implies that many other factors need to be analysed further in future research.
This study carried out an analysis of the impact of urbanization in China at the relatively high, regional level. This can be justified on the basis of similarities between the provinces and municipalities administratively located in the respective regions. For example, the eastern region comprises provinces which are more industrialized, more urbanized with higher population densities, have access to sea ports and generate a higher gross regional product on a per capita basis. By comparison, the western region is vast, less developed and more sparsely populated although very rich in natural resources, including minerals and water. The middle region is in between the East and the West not only geographically but also in terms of urbanization, industrialization and per capita gross regional product. Hence, the differences between provinces within the same region are not that pronounced in relation to urbanization with their basic trends and characteristics being very similar. Notwithstanding these regional similarities, individual provinces, municipalities and autonomous regions warrant further future investigation at a finer scale, including specific characteristics, comparisons and case studies, in order to understand better the effects of population and land urbanization on the country’s natural environment within particular settings.
The STIRPAT model continues to be a useful way to analyse environmental impacts of human activities and the findings presented here provide insights for policy formulation which are discussed below. It is likely that this well-established vein of research will continue in the future with other applications and further adjustments and development of the model, including the introduction of new causal variables.
5. Conclusions and Policy Implications
Based on the extended STIRPAT model and using panel data covering 30 provinces in China over the 2006–2014 period, this article analysed the driving forces of environmental impact with consideration of regional differences. The sample provinces were divided into three regions: eastern, middle and western. The results allow the following conclusions:
Firstly, for the whole of China, population urbanization produces a significant negative effect on environmental impact, while land urbanization does not have a statistically significant effect.
Secondly, the effects of population urbanization and land urbanization vary across the eastern, middle and western regions, which are at different stages of economic and social development. The eastern region’s economic development level and population density are relatively higher, so that further population urbanization will result in a further increase in population density and, consequently, an increase in environmental impact. However, for the middle and western regions, which have lower economic development level and population density, further population urbanization will be beneficial for promoting the intensive use of resources, improving the resource utilization efficiency and, consequently, reducing environmental impact. For the eastern and middle regions, which have high population density and low land resources, further land urbanization can promote intensive use of land resources, improve the land resource utilization efficiency and consequently reduce environmental impact. The western region however is very different. Due to its low population density, abundant land resources and fragile ecological environment, further land urbanization will destroy the originally good ecological environment and simultaneously lower further population density, leading to waste of land resources and lower land resource utilization efficiency.
Thirdly, the main driving forces of environmental impact are increases in population and GRP per capita, while the main causes of environmental impact decrease are improvement of technological level and rapid reduction in energy intensity. The effects of industrialization level and foreign trade degree are very small.
These findings are of interest to policy makers as they outline different development patterns and opportunities. China needs to monitor population and GRP per capita changes, effectively improve the technological level and reduce energy intensity to restrain increase in environmental impact.
Currently, China’s most important primary task is economic and social development, including poverty elimination. In the future China is highly likely to continue to stimulate economic growth and accelerate urbanization. It is impossible to restrict this in order to control environmental impact. However, China has recognized the problems of traditional urbanization. In 2012, the Chinese government proposed a new type urbanization with Chinese characteristics (Hu, J.T., 2012. Full text of Hu Jintao’s Report at 18th Party Congress of China on 8 November 2012. (In Chinese) Available at: http://cpc.people.com.cn/n/2012/1118/c64094-19612151.html), which is an important recognition of the country’s transformation from the traditional patterns of urbanization. This was followed in March 2014 by the the first outline of the Chinese government’s urbanization plan, namely the “National New-Type Urbanization Plan (2014–2020)” (Chinese Government, 2014. National New-Type Urbanization Plan (2014–2020). 2014-3-16. (In Chinese) Available at: http://www.gov.cn/zhengce/2014-03/16/content_2640075.htm). The plan sets out a blueprint for China’s future urbanization and economic development. It focuses on the quality and connotation of urbanization, not just the scale of urban population and land. In the future, China needs to fully consider regional differences and make suitable strategies for population urbanization and land urbanization for its different regions.
The eastern region of China needs to better control population growth in its central towns, especially the central cities, and appropriately speed up the pace of land urbanization, so that population is distributed well and not excessively concentrated in the central cities and towns. By comparison, the middle region needs to speed up the pace of population urbanization and land urbanization. The western region, however, should strictly control the growth of urban land and make efforts to promote a faster growth for urban population and improve resource utilization efficiency.
Acknowledgments
Work on this paper was supported by a grant from the National Social Science Foundation of China (No. 16CJL020).
Author Contributions
Shoufu Lin, Ji Sun, Dora Marinova and Dingtao Zhao conceived, designed, prepared, and revised the paper together. All authors read and approved the final manuscript.
Conflicts of Interest
The authors declare no conflicts of interest. The funding sponsors had no role in the design of the study, the collection, analyses or interpretation of data, the writing of the manuscript, nor in the decision to publish the results.
References
- United Nations Population Fund (UNFPA). Urbanization. Available online: http://www.unfpa.org/urbanization (accessed on 3 October 2016).
- Chan, K.W. China’s urbanization 2020: A new blueprint and direction. Eurasian Geogr. Econ. 2014, 55, 1–9. [Google Scholar] [CrossRef]
- Lin, G.C.S. China’s landed urbanization: Neoliberalizing politics, land commodification, and municipal finance in the growth of metropolises. Environ. Plan. A 2014, 46, 1814–1835. [Google Scholar] [CrossRef]
- Ye, L.; Wu, A.M. Urbanization, land development, and land financing: Evidence from Chinese cities. J. Urban Aff. Assoc. 2014, 36, 354–368. [Google Scholar] [CrossRef]
- National Bureau of Statistics of China. China’s Statistical Yearbook (2016); China Statistics Press: Beijing, China, 2016.
- Bloom, D.E.; Canning, D.; Fink, G. Urbanization and the Wealth of Nations. Science 2008, 319, 772–775. [Google Scholar] [CrossRef] [PubMed]
- Netherlands Environmental Assessment Agency (NEAA). China Now No. 1 in CO2 Emissions, USA in Second Position. 2008. Available online: http://www.mnp.nl/en/dossiers/Climatechange/moreinfo/Chinanowno1inCO2emissionsUSAinsecondposition.html (accessed on 29 December 2008).
- World Bank. World Development Indicators 2016. Washington, DC. Available online: http://data.worldbank.org/data-catalog/world-development-indicators/ (accessed on 14 October 2016).
- Zhang, N.; Wang, B. Toward a sustainable low-carbon China: A review of the Special Issue of “Energy Economics and Management”. Sustainability 2016, 8, 823. [Google Scholar] [CrossRef]
- Wei, Y.D. Towards equitable and sustainable urban space: Introduction to Special Issue on “Urban Land and Sustainable Development”. Sustainability 2016, 8, 804. [Google Scholar] [CrossRef]
- Ehrlich, P.R.; Holdren, J.P. Impact of Population Growth. Science 1971, 171, 1212–1217. [Google Scholar] [CrossRef] [PubMed]
- Stern, P.C.; Young, O.R.; Druckman, D. Global Environmental Change: Understanding the Human Dimensions; National Academy Press: Washington, DC, USA, 1992; ISBN 978-0309044943. [Google Scholar]
- Dietz, T.; Rosa, E.A. Rethinking the environmental impacts of population, affluence and technology. Hum. Ecol. Rev. 1994, 1, 277–300. [Google Scholar]
- Dietz, T.; Rosa, E.A. Effects of population and affluence on CO2 emissions. Proc. Natl. Acad. Sci. USA 1997, 94, 175–179. [Google Scholar] [CrossRef] [PubMed]
- Rosa, E.A.; York, R.; Dietz, T. Reflections on the STIRPAT Research Program. In Proceedings of the Newsletter of the Section on Environment and Technology of the American Sociological Association Summer, San Francisco, CA, USA, 14–17 August 2004; pp. 1–2. [Google Scholar]
- York, R.; Rosa, E.A.; Dietz, T. STIRPAT, IPAT, and ImPACT: Analytic tools for unpacking the driving forces of environmental impacts. Ecol. Econ. 2003, 46, 351–365. [Google Scholar] [CrossRef]
- Shi, A. The impact of population pressure on global carbon dioxide emissions, 1975–1996: Evidence from pooled cross-country data. Ecol. Econ. 2003, 44, 29–42. [Google Scholar] [CrossRef]
- Martínez-Zarzoso, I.; Bengochea-Morancho, A.; Morales-Lage, R. The impact of population on CO2 emissions: Evidence from European countries. Environ. Resour. Econ. 2007, 4, 497–512. [Google Scholar] [CrossRef]
- Martínez-Zarzoso, I.; Maruotti, A. The impact of urbanization on CO2 emissions: Evidence from developing countries. Ecol. Econ. 2011, 7, 1344–1353. [Google Scholar] [CrossRef]
- Tian, W.H.; Da Costa, P. Inequalities in per capita CO2 emissions in European Union, 1990–2020. In Proceedings of the International Conference on the European Energy Market, Kraków, Poland, 28–30 May 2014. [Google Scholar]
- Li, K.; Lin, B.Q. Impacts of urbanization and industrialization on energy consumption/CO2 emissions: Does the level of development matter? Renew. Sustain. Energy Rev. 2015, 52, 1107–1122. [Google Scholar] [CrossRef]
- Lin, B.; Omoju, O.E.; Nwakeze, N.M.; Okonkwo, J.U.; Megbowon, E.T. Is the environmental Kuznets curve hypothesis a sound basis for environmental policy in Africa? J. Clean. Prod. 2016, 133, 712–724. [Google Scholar] [CrossRef]
- Li, H.; Mu, H.; Zhang, M.; Li, N. Analysis on influence factors of China’s CO2 emissions based on Path-STIRPAT model. Energy Policy 2011, 39, 6906–6911. [Google Scholar] [CrossRef]
- Shao, S.; Yang, L.L.; Yu, M.B.; Yu, M.L. Estimation, characteristics, and determinants of energy-related industrialCO2 emissions in Shanghai (China), 1994–2009. Energy Policy 2011, 39, 6476–6494. [Google Scholar] [CrossRef]
- Wang, M.W.; Che, Y.; Yang, K.; Wang, M.; Xiong, L.; Huang, Y. A local-scale low-carbon plan based on the STIRPAT model and the scenario method: The case of Minhang District, Shanghai, China. Energy Policy 2011, 39, 6981–6990. [Google Scholar] [CrossRef]
- Wang, Z.; Yin, F.; Zhang, Y.; Zhang, X. An empirical research on the influencing factors of regional CO2 emissions: Evidence from Beijing city, China. Energy Policy 2012, 100, 277–284. [Google Scholar] [CrossRef]
- Zhang, C.; Lin, Y. Panel estimation for urbanization, energy consumption and CO2 emissions: A regional analysis in China. Energy Policy 2012, 49, 488–498. [Google Scholar] [CrossRef]
- Wang, P.; Wu, W.S.; Zhu, B.Z.; Wei, Y.M. Examining the impact factors of energy-related CO2 emissions using the STIRPAT model in Guangdong Province, China. Appl. Energy 2013, 106, 65–71. [Google Scholar] [CrossRef]
- Song, J.; Song, Q.; Zhang, D.; Lu, Y.; Luan, L. Study on Influencing Factors of Carbon Emissions from Energy Consumption of Shandong Province of China from 1995 to2012. Sci. World J. 2014, 4, 1–12. [Google Scholar]
- Ding, W.N.; Han, B.T.; Zhao, X.; Massimiliano, M. How does green technology influence CO2 emission in China?—An empirical research based on provincial data of China. J. Environ. Biol. 2015, 36, 745–753. [Google Scholar] [PubMed]
- Wang, Y.N.; Zhao, T. Impacts of energy-related CO2 emissions: Evidence from underdeveloped, developing and highly developed regions in China. Ecol. Indic. 2015, 50, 186–195. [Google Scholar] [CrossRef]
- Wen, L.; Liu, Y.J. Energy-related CO2 emissions in Hebei province: Driven factors and policy implications. Environ. Eng. Res. 2016, 21, 74–83. [Google Scholar] [CrossRef]
- Wen, L.; Liu, Y.J. The Peak Value of Carbon Emissions in the Beijing-Tianjin-Hebei Region Based on the STIRPAT Model and Scenario Design. Pol. J. Environ. Stud. 2016, 25, 823–834. [Google Scholar]
- Wang, L.M.; He, K.L. Analysis of temporal variation of environmental impact based on STIRPAT model: A case study of energy consumption in China. J. Nat. Resour. 2006, 6, 862–869. (In Chinese) [Google Scholar]
- Lin, S.F.; Zhao, D.T.; Marinova, D. Analysis of the environmental impact of China based on STIRPAT model. Environ. Impact Assess. Rev. 2009, 29, 341–347. [Google Scholar] [CrossRef]
- Wang, M.Q.; Liu, J.S.; Wang, J.D.; Zhao, G.Y. Ecological Footprint and Major Driving Forces in West Jilin Province, Northeast China. Chin. Geogr. Sci. 2010, 20, 434–441. [Google Scholar] [CrossRef]
- Zhao, C.F.; Chen, B.; Hayat, T.; Alsaedi, A.; Ahmad, B. Driving force analysis of water footprint change based on extended STIRPAT model: Evidence from the Chinese agricultural sector. Ecol. Indic. 2014, 47, 43–49. [Google Scholar] [CrossRef]
- Cao, Z.; Shen, L.; Liu, L.; Zhong, S. Analysis on major drivers of cement consumption during the urbanization process in China. J. Clean. Prod. 2016, 133, 304–313. [Google Scholar] [CrossRef]
- Zhang, X.J.; Zhao, K.; Jennings, E.T. Empirical Evidence and Determinants of Region-Based Environmental Injustice in China: Does Environmental Public Service Level Make a Difference? Soc. Sci. Q. 2016, 1, 1–14. [Google Scholar] [CrossRef]
- Ren, S.G.; Li, X.L.; Yuan, B.L.; Li, D.Y.; Chen, X.H. The effects of three types of environmental regulation on ecoefficiency: A cross-region analysis in China. J. Clean. Prod. 2016. [Google Scholar] [CrossRef]
- Uddin, G.A.; Alam, K.; Gow, J. Estimating the major contributors to environmental impacts in Australia. J. Ecol. Econ. Stat. 2016, 37, 1–14. [Google Scholar]
- Zheng, H.; Hu, J.; Guan, R.; Wang, S. Examining determinants of CO2 emissions in 73 cities in China. Sustainability 2016, 8, 1296. [Google Scholar] [CrossRef]
- Liddle, B.; Lung, S. Age-structure, urbanization, and climate change in developed countries: Revisiting STIRPAT for disaggregated population and consumption-related environmental impacts. Popul. Environ. 2010, 31, 317–343. [Google Scholar] [CrossRef]
- Madlener, R.; Sunak, Y. Impacts of urbanization on urban structures and energy demand: What can we learn for urban energy planning and urbanization management? Sustain. Cities Soc. 2011, 1, 45–53. [Google Scholar] [CrossRef]
- Zhou, W.; Zhu, B.; Chen, D.; Griffy-Brown, C.; Ma, Y.; Fei, W. Energy consumption patterns in the process of China’s urbanization. Popul. Environ. 2011, 33, 202–220. [Google Scholar] [CrossRef]
- Yi, Y.; Ma, S.; Guan, W.; Li, K. An empirical study on the relationship between urban spatial form and CO2 in Chinese cities. Sustainability 2017, 9, 672. [Google Scholar] [CrossRef]
- Dodman, D. Blaming cities for climate change? An analysis of urban greenhouse gas emissions inventories. Environ. Urban. 2009, 21, 185–201. [Google Scholar] [CrossRef]
- Fan, Y.; Liu, L.C.; Wu, G.; Wei, Y.M. Analyzing impact factors of CO2 emissions using the STIRPAT model. Environ. Impact Assess. Rev. 2006, 26, 377–395. [Google Scholar] [CrossRef]
- Gu, C.; Wu, F. Urbanization in China: Processes and policies. China Rev. 2010, 10, 1–10. [Google Scholar]
- Fang, C.; Liu, H.; Li, G.; Sun, D.; Miao, Z. Estimating the impact of urbanization on air quality in China using spatial regression models. Sustainability 2015, 7, 15570–15592. [Google Scholar] [CrossRef]
- Heikkila, E.J. Three questions regarding urbanization in China. J. Plan. Educ. Res. 2007, 27, 65–81. [Google Scholar] [CrossRef]
- Lin, G.C.S. Reproducing spaces of Chinese urbanisation: New city-based and land-centred urban transformation. Urban Stud. 2007, 44, 1827–1855. [Google Scholar] [CrossRef]
- Xu, J.; Yeh, A.G.O.; Wu, F. Land commodification: New land development and politics in China since the late 1990s. Int. J. Urban Reg. Res. 2009, 33, 890–913. [Google Scholar] [CrossRef]
- Ehrlich, P.R.; Holdren, J.P. One-dimensional Economy. Bull. At. Sci. 1972, 28, 16–27. [Google Scholar]
- Waggoner, P.E.; Ausubel, J.H. A framework for sustainability science: A renovated IPAT identity. Proc. Natl. Acad. Sci. USA 2002, 99, 7860–7865. [Google Scholar] [CrossRef] [PubMed]
- Xu, Z.M.; Cheng, G.D.; Qiu, G.Z. ImPACTS identity of sustainability assessment. Acta Geogr. Sin. 2005, 60, 198–218. (In Chinese) [Google Scholar]
- Schulze, P.C. I=PBAT. Ecol.Econ. 2002, 40, 149–150. [Google Scholar] [CrossRef]
- Poumanyvong, P.; Kaneko, S. Does urbanization lead to less energy use and lower CO2 emissions? A cross-country analysis. Ecol. Econ. 2010, 70, 434–444. [Google Scholar] [CrossRef]
- Frankel, J.A.; Rose, A.K. Is trade good or bad for the environment? Sorting out the causality. Rev. Econ. Stat. 2005, 87, 85–91. [Google Scholar] [CrossRef]
- Shahbaz, M.; Lean, H.H.; Shabbir, M.S. Environmental Kuznets curve and the role of energy consumption in Pakistan. Mpra Paper 2011, 18, 165–173. [Google Scholar]
- Jalil, A.; Mahmud, S.F. Environment Kuznets curve for CO2 emissions: A cointegration analysis for China. Energy Policy 2009, 37, 5167–5172. [Google Scholar] [CrossRef]
- Cohen, B. Urbanization, City growth, and the New United Nations development agenda. Cornerstone 2015, 3, 4–7. [Google Scholar]
- Goldberger, A.S. A Course in Econometrics; Harvard University Press: Cambridge, UK, 1991; ISBN 978-0674175440. [Google Scholar]
- Gujarati, D.N.; Porter, D.C. Basic Econometrics, 5th ed.; McGraw-Hill/Irwin: New York, NY, USA, 2009. [Google Scholar]
- Zhang, G.Y. The Path of the Environment Protection and the Construction of Ecological Barrier in the Key Ecological Zones of Western China. Gansu Soc. Sci. 2016, 1, 89–93. (In Chinese) [Google Scholar]
Figure 1.
China’s population urbanization level, land urbanization level and their growth rates (%).
Figure 1.
China’s population urbanization level, land urbanization level and their growth rates (%).
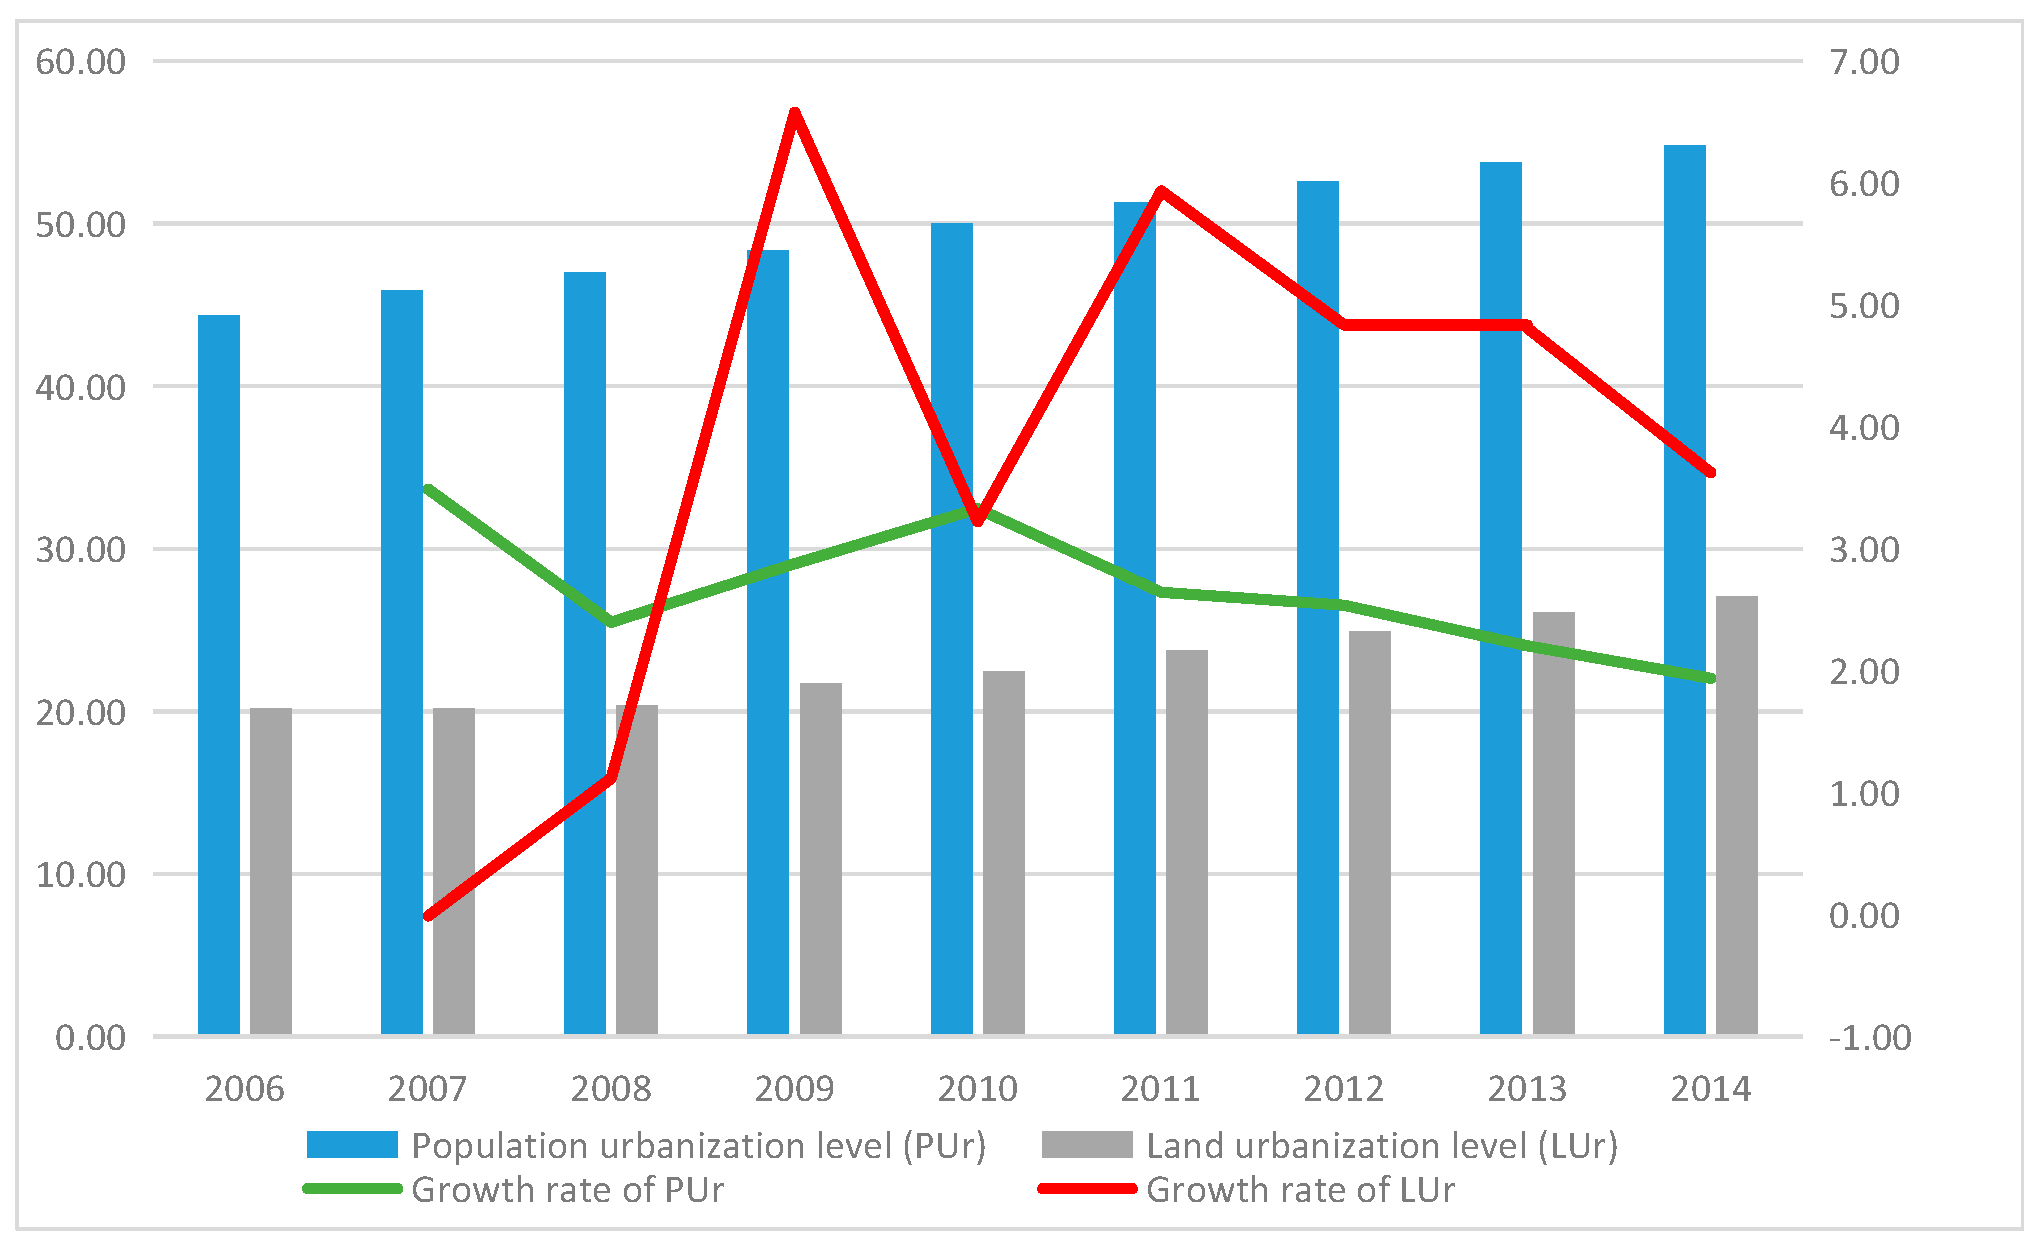
Figure 2.
Population urbanization level and its growth rate for eastern, middle and western regions (%).
Figure 2.
Population urbanization level and its growth rate for eastern, middle and western regions (%).

Figure 3.
Land urbanization level and its growth rate for eastern, middle and western regions (%).
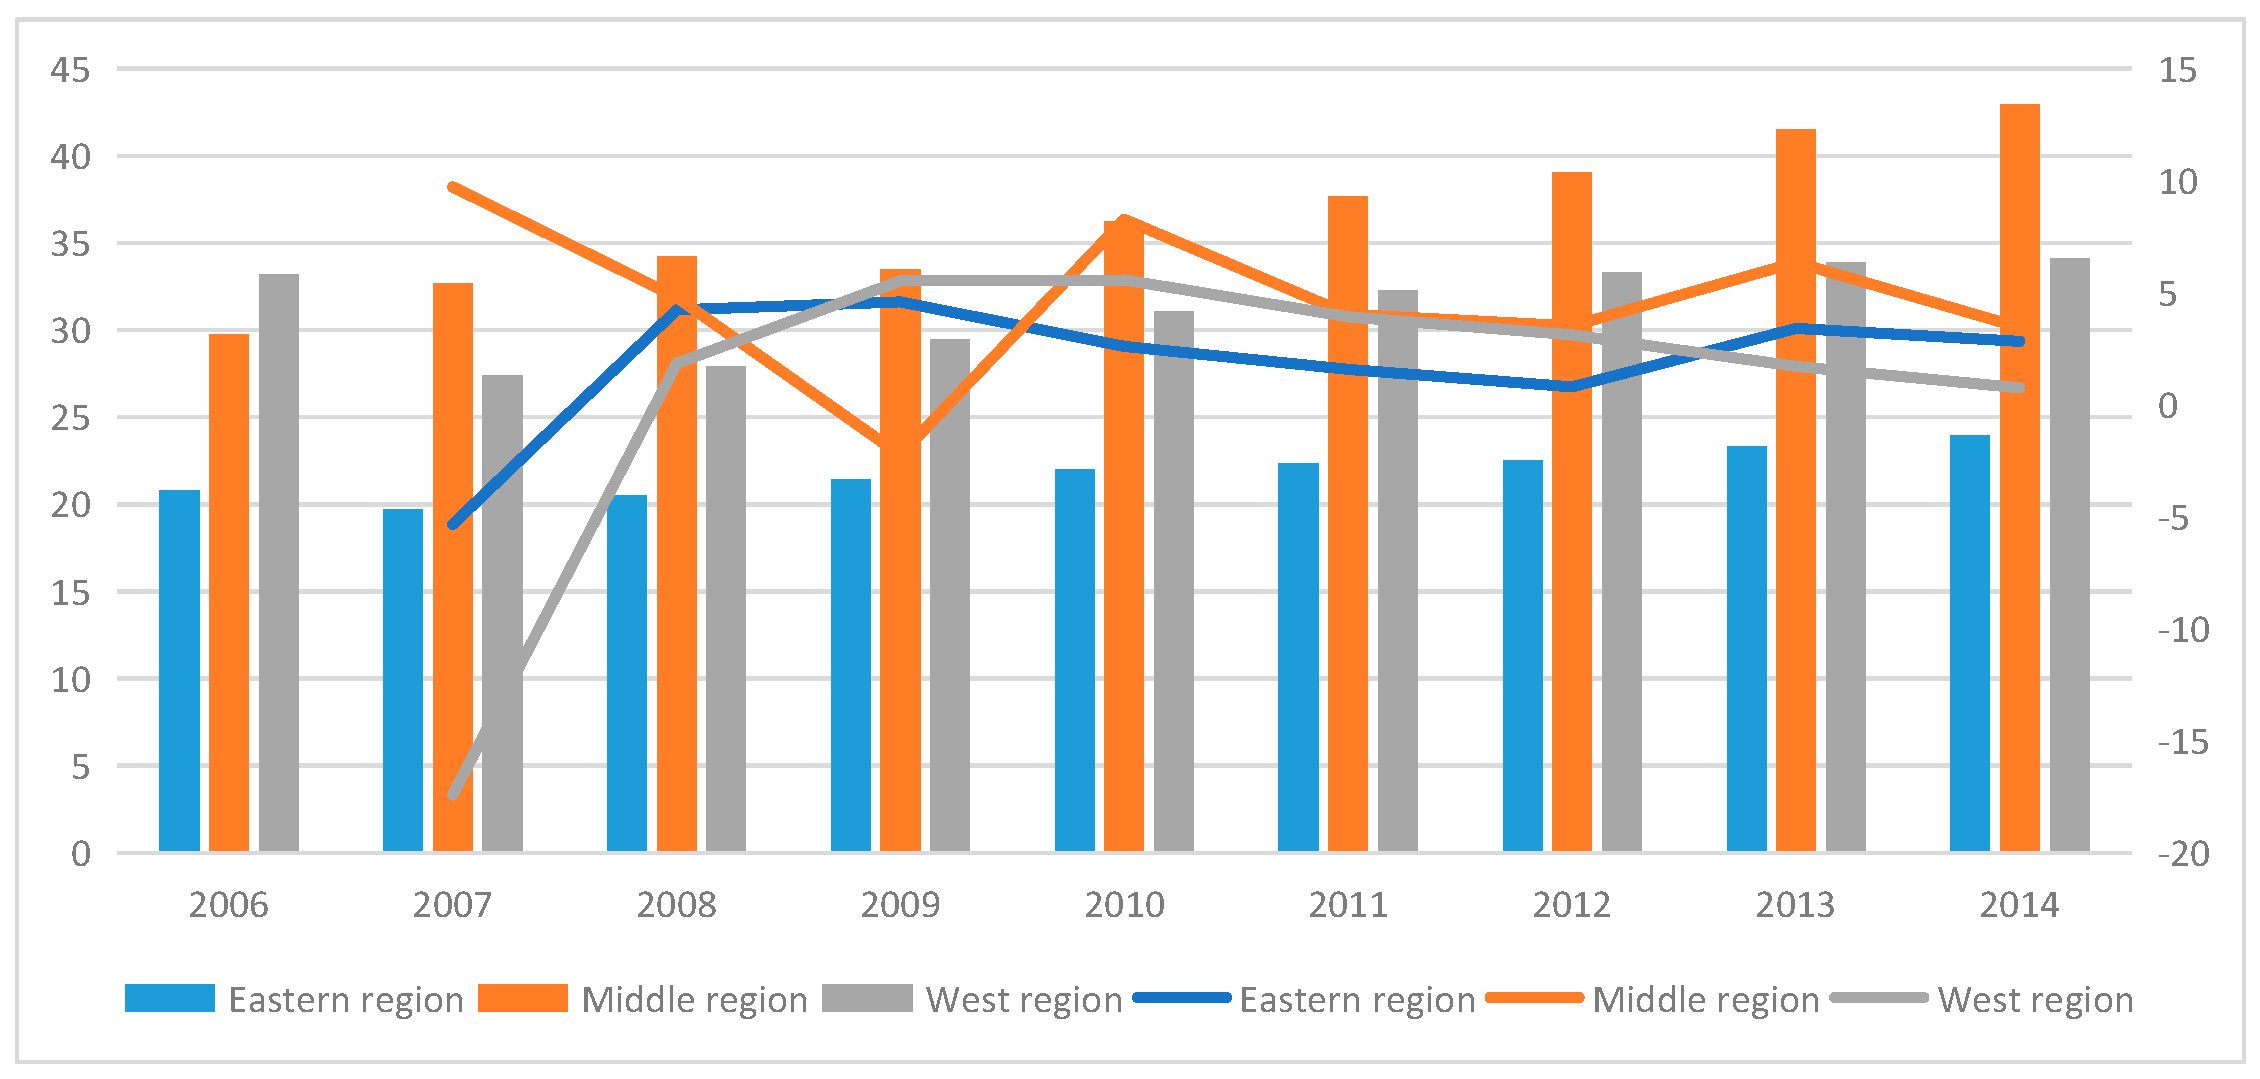
Figure 4.
Environmental impact (I) for eastern, middle and western regions (′0000 tce).

Figure 5.
Population (P) for eastern, middle and western regions (10000).

Figure 6.
GRP per capita(PGRP) for eastern, middle and western regions (Yuan, 2005 prices).

Figure 7.
Energy intensity of primary energy (EnI) for eastern, middle and western regions (tce/100,000 Yuan).
Figure 7.
Energy intensity of primary energy (EnI) for eastern, middle and western regions (tce/100,000 Yuan).
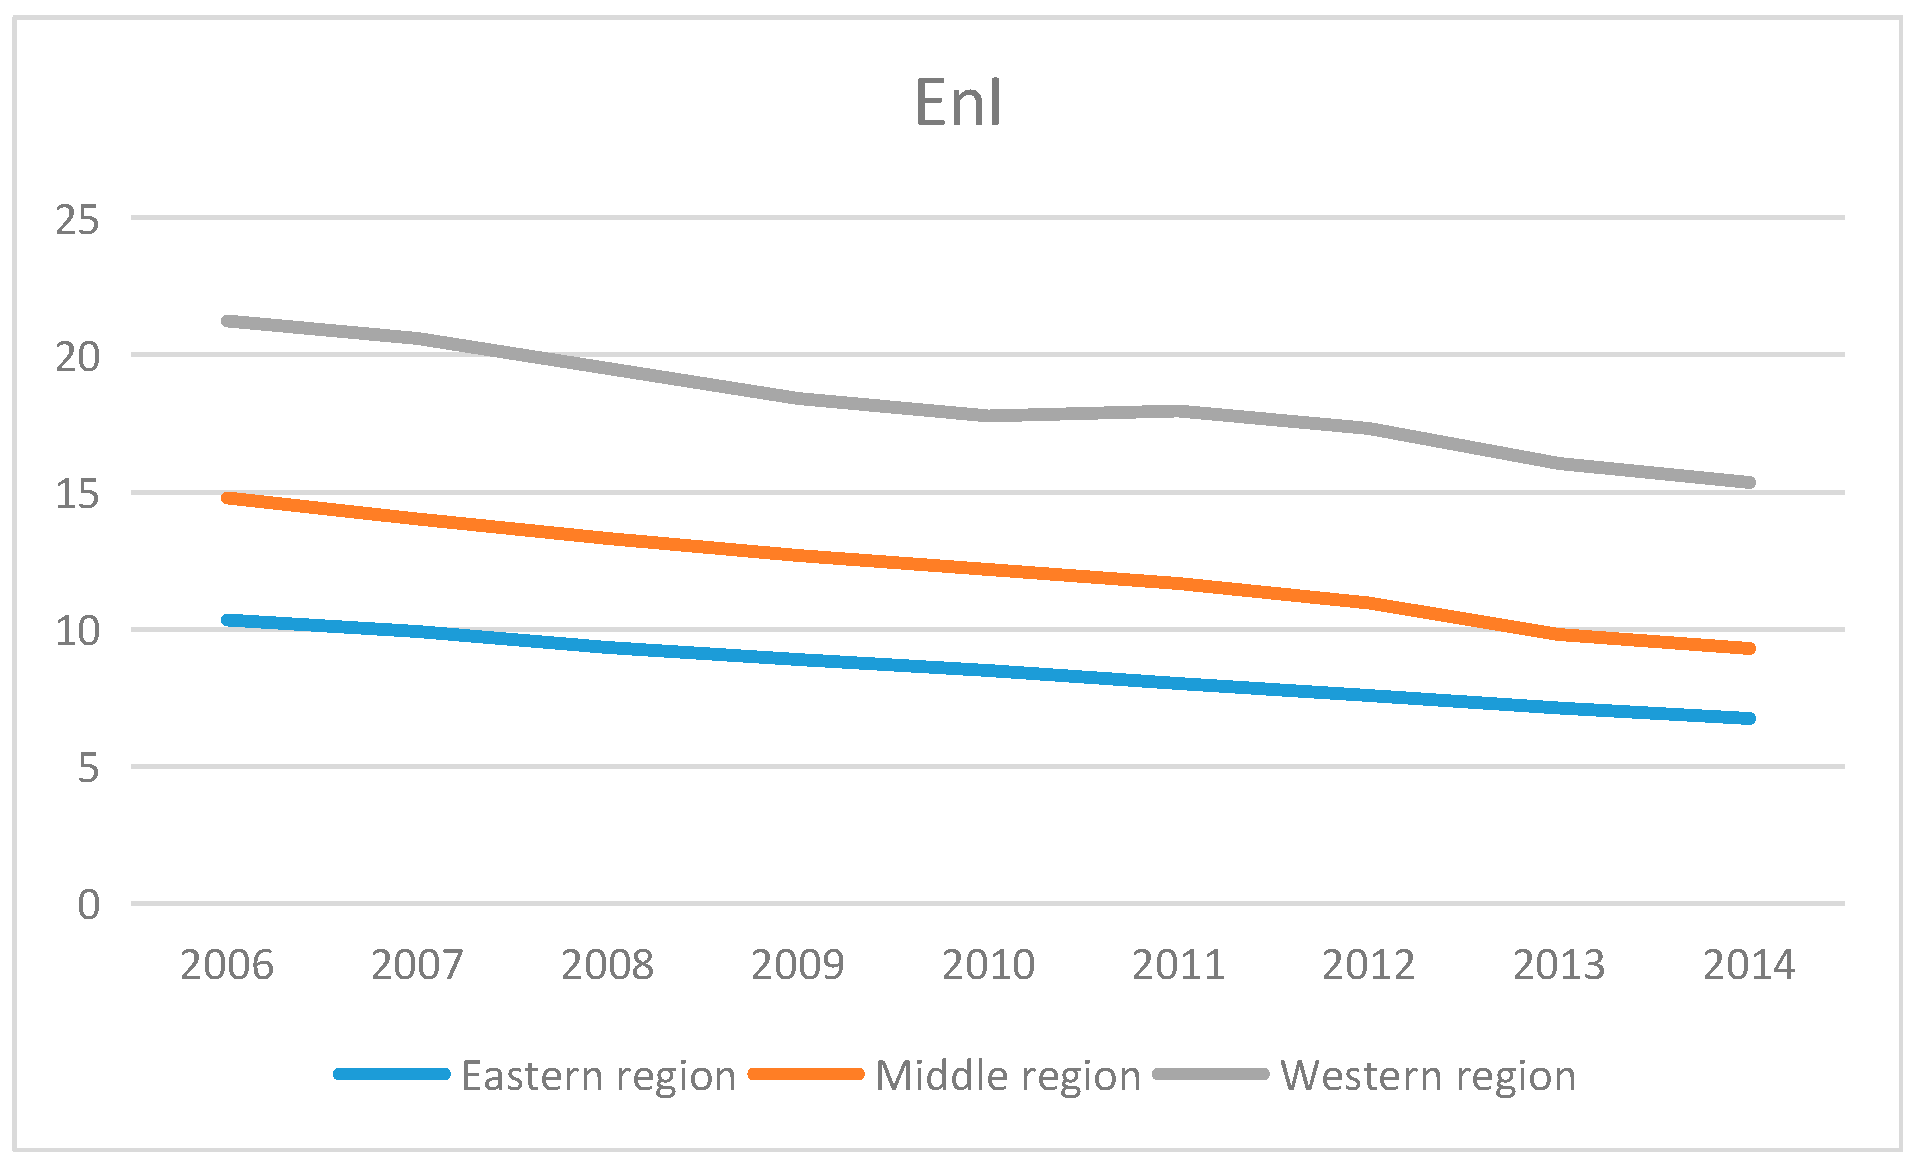
Figure 8.
Industrialization level (Ind) for eastern, middle and western regions (%).

Figure 9.
Foreign trade degree (FTD) for eastern, middle and western regions (%).

Table 1.
Definition of the variables used in the study.
| Symbol | Variable | Definition | Unit of Measurement |
|---|---|---|---|
| I | Environmental Impact | The impact on the environment of the pollutants produced in the process of consuming all energy resources | 10,000 tonnes of coal equivalent (tce) |
| P | Population | Total population at the end of the year | 10,000 units |
| PGRP | GRP per capita | Gross Regional Product (GRP) divided by total population | Yuanin constant 2005 prices |
| EnI | Energy intensity of primary energy | Energy use per unit GRP | tce/100,000 Yuan (constant 2005 prices) |
| Ind | Industrialization level | Share of industrial value-added in GRP | Percent |
| FTD | Foreign trade degree | Ratio of total gross import and export value to GRP | Percent |
| PUr | Population urbanization level | Proportion of urban population to total population | Percent |
| LUr | Land urbanization level | Proportion of the area of built districts to total city proper area | Percent |
Table 2.
Matrix of correlation between the variables for whole of China.
| lnI | lnP | LnPGRP | lnEnI | lnInd | lnFTD | lnPUr | lnLUr | |
|---|---|---|---|---|---|---|---|---|
| lnI | 1.0000 | |||||||
| lnP | 0.7418 | 1.0000 | ||||||
| lnPGRP | 0.2337 | 0.0126 | 1.0000 | |||||
| lnEnI | −0.2104 | −0.3909 | −0.6091 | 1.0000 | ||||
| lnInd | 0.4591 | 0.3853 | 0.0219 | 0.1836 | 1.0000 | |||
| lnFTD | 0.0783 | 0.0828 | 0.6766 | −0.6892 | −0.1817 | 1.0000 | ||
| lnPUr | 0.0328 | −0.1614 | 0.9201 | −0.5870 | −0.0919 | 0.7438 | 1.0000 | |
| lnLUr | −0.0881 | 0.1527 | −0.2741 | 0.0709 | 0.1725 | −0.2672 | −0.3945 | 1.0000 |
Table 3.
Empirical results for lnI (environmental impact) as the dependent variable for whole of China.
Table 3.
Empirical results for lnI (environmental impact) as the dependent variable for whole of China.
| Variables | Model 1 | Model 2 | Model 3 |
|---|---|---|---|
| Constant | −11.4798 (−19.96) *** | −11.7424 (−18.19) *** | −11.0301 (−16.28) *** |
| lnP (population) | 1.0684 (17.31) *** | 1.0895 (16.38) *** | 1.0295 (15.09) *** |
| lnPGRP (gross regional product per capita) | 0.9332 (53.56) *** | 0.9309 (52.75) *** | 1.0135 (31.91) *** |
| lnEnI (energy intensity) | 0.9904 (28.84) *** | 0.9849 (28.19) *** | 1.0005 (28.56) *** |
| lnInd (industrialization level) | 0.0313 (0.89) | 0.0288 (0.83) | |
| lnFTD (foreign trade degree) | 0.0039 (0.36) | 0.0088 (0.82) | |
| lnPUr (population urbanization) | −0.2843 (−3.2) *** | ||
| lnLUr (land urbanization) | 0.0036 (0.25) | ||
| R2 | 0.6878 | 0.6879 | 0.6846 |
| Test effect | Random effect | Random effect | Random effect |
| Hausman Test [p] a | 0.57 [0.9033] | 0.33 [0.9971] | 1.54 [0.9810] |
Notes: The t-statistics for the coefficients are in parentheses. *** Denotes statistical significance at the 1% level. a p-values are in square brackets.
Table 4.
Empirical results for lnCO2 (carbon dioxide) as a dependent variable for whole of China.
| Variables | Model 1’ | Model 2’ | Model 3’ |
|---|---|---|---|
| Constant | −10.4719 (−18.18) *** | −10.7378 (−16.6) *** | −10.0152 (−14.76) *** |
| lnP (population) | 1.0677 (17.26) *** | 1.0890 (16.32) *** | 1.0280 (15.02) *** |
| lnPGRP (gross regional product per capita) | 0.9340 (53.79) *** | 0.9316 (52.97) *** | 1.0149 (32.06) *** |
| lnEnI (energy intensity) | 0.9909 (28.95) *** | 0.9851 (28.3) *** | 1.0010 (28.69) *** |
| lnInd (industrialization level) | 0.0325 (0.93) | 0.0299 (0.86) | |
| lnFTD (foreign trade degree) | 0.0033 (0.31) | 0.0082 (0.76) | |
| lnPUr (population urbanization) | −0.2863 (−3.23) *** | ||
| lnLUr (land urbanization) | 0.0038 (0.26) | ||
| R2 | 0.6764 | 0.6784 | 0.6732 |
| Test effect | Random effect | Random effect | Random effect |
| Hausman Test [p] a | 0.56 [0.9046] | 0.32 [0.9972] | 1.50 [0.9821] |
Notes: The t-statistics for the coefficients are in parentheses. *** Denotes statistical significance at the 1% level. a p-values are in square brackets.
Table 5.
Empirical results for lnI (environmental impact) as the dependent variable for China’s eastern region.
Table 5.
Empirical results for lnI (environmental impact) as the dependent variable for China’s eastern region.
| Variables | Model 4 | Model 5 | Model 6 |
|---|---|---|---|
| Constant | −11.9383 (−33.56) *** | −11.5557 (−30.25) *** | −11.9185 (−24.62) *** |
| lnP (population) | 1.0468 (30.91) *** | 1.0410 (32.88) *** | 1.0672 (28.11) *** |
| lnPGRP (gross regional product per capita) | 0.9840 (61.61) *** | 0.9815 (63.67) *** | 0.9582 (36.67) *** |
| lnEnI (energy intensity) | 1.0152 (37.26) *** | 1.0404 (38.6) *** | 1.0453 (38.25) *** |
| lnInd (industrialization level) | −0.1072 (−3.64) *** | −0.1090 (−3.6) *** | |
| lnFTD (foreign trade degree) | 0.0076 (0.64) | 0.0034 (0.26) | |
| lnPUr (population urbanization) | 0.1064 (1.18) | ||
| lnLUr (land urbanization) | −0.0110 (−0.59) | ||
| R2 | 0.9777 | 0.9775 | 0.9760 |
| Test effect | Random effect | Random effect | Random effect |
| Hausman Test [p] a | 0.19 [0.9794] | 2.69 [0.7471] | 3.24 [0.8618] |
Notes: The t-statistics for the coefficients are in parentheses. *** Denotes statistical significance at the 1% level. a p-values are in square brackets.
Table 6.
Empirical results for lnI (environmental impact) as the dependent variable for China’s middle region.
Table 6.
Empirical results for lnI (environmental impact) as the dependent variable for China’s middle region.
| Variables | Model 7 | Model 8 | Model 9 |
|---|---|---|---|
| Constant | −11.5514 (−19.07) *** | −11.0692 (−17.57) *** | −9.8109 (−8) *** |
| lnP (population) | 1.0274 (16.42) *** | 0.9916 (15.16) *** | 0.8204 (5.57) *** |
| lnPGRP (gross regional product per capita) | 0.9662 (51.57) *** | 0.9454 (44.33) *** | 0.9742 (32.21) *** |
| lnEnI (energy intensity) | 1.0043 (29.63) *** | 0.9680 (25.57) *** | 0.9958 (23.38) *** |
| lnInd (industrialization level) | 0.0470 (1.69) * | 0.0330 (1.16) | |
| lnFTD (foreign trade degree) | −0.0256 (−2.59) *** | −0.0320 (−3) *** | |
| lnPUr (population urbanization) | −0.0103 (−0.17) | ||
| lnLUr (land urbanization) | −0.0133 (−0.86) | ||
| R2 | 0.9651 | 0.9640 | 0.9921 |
| Test effect | Random effect | Random effect | Fixed effect |
| Hausman Test [p] a | 7.11 [0.0686] | 2.97 [0.3091] | 47.7 [0.0000] b |
Notes: The t-statistics for the coefficients are in parentheses. *** Denotes statistical significance at the 1% level. * Denotes statistical significance at the 10% level. a p-values are in square brackets. b In the Hausman test of this model, the null hypothesis is a random effect, while the null hypothesis in other models is a fixed effect. Therefore, it means rejecting the random effect when the p is 0.0000.
Table 7.
Empirical results for lnI (environmental impact) as the dependent variable for China’s western region.
Table 7.
Empirical results for lnI (environmental impact) as the dependent variable for China’s western region.
| Variables | Model 10 | Model 11 | Model 12 |
|---|---|---|---|
| Constant | −9.2108 (−5.03) *** | −10.9019 (−5.11) *** | −8.2594 (−3.46) *** |
| lnP (population) | 0.7385 (3.09) *** | 0.8494 (3.24) *** | 0.5911 (2.08) ** |
| lnPGRP (gross regional product per capita) | 0.9460 (26.49)*** | 0.9499 (26.99) *** | 1.1463 (13.41) *** |
| lnEnI (energy intensity) | 1.0933 (13.71)*** | 1.1103 (14.24) *** | 1.1268 (14.73) *** |
| lnInd (industrialization level) | 0.1834 (2.04) ** | 0.1243 (1.39) | |
| lnFTD (foreign trade degree) | 0.0261 (1.31) | 0.0249 (1.29) | |
| lnPUr (population urbanization) | −0.6433 (−2.5) ** | ||
| lnLUr (land urbanization) | 0.0160 (0.61) | ||
| R2 | 0.1827 | 0.2552 | 0.0765 |
| Test effect | Random effect | Random effect | Random effect |
| Hausman Test [p] a | 5.48 [0.1397] | 2.63 [0.7572] | 3.55 [0.8304] |
Notes: The t-statistics for the coefficients are in parentheses. *** Denotes statistical significance at the 1% level. ** Denotes statistical significance at the 5% level. a p-values are in square brackets.
Table 8.
Contributions of variables to the change of environmental impact for the whole of China, 2006–2014.
Table 8.
Contributions of variables to the change of environmental impact for the whole of China, 2006–2014.
| Variables | Total Growth Rate | Average Annual Growth Rate | Regression Coefficient | Effect on the Change of Environmental Impact | Contribution Degree to Change of Environmental Impact |
|---|---|---|---|---|---|
| Environmental Impact | 55.67% | 5.69% | |||
| Population | 5.18% | 0.63% | 1.0295 | 0.65% | 11.45% |
| GRP per capita | 117.60% | 10.21% | 1.0135 | 10.34% | 181.85% |
| Energy intensity | −31.83% | −4.68% | 1.0005 | −4.68% | −82.25% |
| Industrialization level | −5.94% | −0.76% | 0.0288 | −0.02% | −0.39% |
| Foreign trade degree | −24.91% | −3.52% | 0.0088 | −0.03% | −0.54% |
| Population urbanization level | 20.02% | 2.31% | −0.2843 | −0.66% | −11.53% |
| Land urbanization level | 18.11% | 2.10% | 0.0036 | 0.01% | 0.13% |
| Other factors (a) | −11.0301 | 0.07% | 1.28% |
Note: Effect on the change of environmental impact = Average annual growth rate × Regression Coefficient; Contribution degree to change of environmental impact = Effect on the change of environmental impact ÷ Average annual growth rate of environmental impact.
Table 9.
Contributions of variables to the change of environmental impact for eastern region of China, 2006–2014.
Table 9.
Contributions of variables to the change of environmental impact for eastern region of China, 2006–2014.
| Variables | Total Growth Rate | Average Annual Growth Rate | Regression Coefficient | Effect on the Change of Environmental Impact | Contribution Degree to Change of Environmental Impact |
|---|---|---|---|---|---|
| Environmental Impact | 41.51% | 4.44% | |||
| Population | 9.38% | 1.13% | 1.0672 | 1.20% | 27.12% |
| GRP per capita | 96.31% | 8.80% | 0.9582 | 8.43% | 190.07% |
| Energy intensity | −34.71% | −5.19% | 1.0453 | −5.43% | −122.32% |
| Industrialization level | −12.86% | −1.71% | −0.1090 | 0.19% | 4.19% |
| Foreign trade degree | −32.99% | −4.88% | 0.0034 | −0.02% | −0.37% |
| Population urbanization level | 12.54% | 1.49% | 0.1064 | 0.16% | 3.57% |
| Land urbanization level | 15.25% | 1.79% | −0.0110 | −0.02% | −0.45% |
| Other factors (a) | −11.9185 | −0.08% | −1.82% |
Note: Effect on the change of environmental impact = Average annual growth rate × Regression Coefficient; Contribution degree to change of environmental impact = Effect on the change of environmental impact ÷ Average annual growth rate of environmental impact.
Table 10.
Contributions of variables to the change of environmental impact for middle region of China, 2006–2014.
Table 10.
Contributions of variables to the change of environmental impact for middle region of China, 2006–2014.
| Variables | Total Growth Rate | Average Annual Growth Rate | Regression Coefficient | Effect on the Change of Environmental Impact | Contribution Degree to Change of Environmental Impact |
|---|---|---|---|---|---|
| Environmental Impact | 45.34% | 4.78% | |||
| Population | 2.51% | 0.31% | 0.8204 | 0.25% | 4.48% |
| GRP per capita | 139.03% | 11.51% | 0.9742 | 11.21% | 197.08% |
| Energy intensity | −37.18% | −5.65% | 0.9958 | −5.62% | −98.83% |
| Industrialization level | −0.64% | −0.08% | 0.0330 | 0.00% | −0.05% |
| Foreign trade degree | 0.17% | 0.02% | −0.0320 | 0.00% | −0.01% |
| Population urbanization level | 22.33% | 2.55% | −0.0103 | −0.03% | −0.46% |
| Land urbanization level | 44.20% | 4.68% | −0.0133 | −0.06% | −1.10% |
| Other factors (a) | −9.8109 | −0.97% | −17.00% |
Note: Effect on the change of environmental impact = Average annual growth rate × Regression Coefficient; Contribution degree to change of environmental impact = Effect on the change of environmental impact ÷ Average annual growth rate of environmental impact.
Table 11.
Contributions of variables to the change of environmental impact for western region of China, 2006–2014.
Table 11.
Contributions of variables to the change of environmental impact for western region of China, 2006–2014.
| Variables | Total Growth Rate | Average Annual Growth Rate | Regression Coefficient | Effect on the Change of Environmental Impact | Contribution Degree to Change of Environmental Impact |
|---|---|---|---|---|---|
| Environmental Impact | 78.49% | 7.51% | |||
| Population | 2.21% | 0.27% | 1.0295 | 0.28% | 6.35% |
| GRP per capita | 156.68% | 12.51% | 1.0135 | 12.67% | 285.77% |
| Energy intensity | −27.72% | −3.98% | 1.0005 | −3.98% | −89.69% |
| Industrialization level | −2.50% | −0.32% | 0.0288 | −0.01% | −0.21% |
| Foreign trade degree | 15.92% | 1.86% | 0.0088 | 0.02% | 0.37% |
| Population urbanization level | 30.10% | 3.34% | −0.2843 | −0.95% | −21.43% |
| Land urbanization level | 2.87% | 0.35% | 0.0036 | 0.001% | 0.03% |
| Other factors (a) | −11.0301 | −0.53% | −11.84% |
Note: Effect on the change of environmental impact = Average annual growth rate × Regression Coefficient; Contribution degree to change of environmental impact = Effect on the change of environmental impact ÷Average annual growth rate of environmental impact.
© 2017 by the authors. Licensee MDPI, Basel, Switzerland. This article is an open access article distributed under the terms and conditions of the Creative Commons Attribution (CC BY) license (http://creativecommons.org/licenses/by/4.0/).
Share and Cite
MDPI and ACS Style
Lin, S.; Sun, J.; Marinova, D.; Zhao, D. Effects of Population and Land Urbanization on China’s Environmental Impact: Empirical Analysis Based on the Extended STIRPAT Model. Sustainability 2017, 9, 825. https://doi.org/10.3390/su9050825
AMA Style
Lin S, Sun J, Marinova D, Zhao D. Effects of Population and Land Urbanization on China’s Environmental Impact: Empirical Analysis Based on the Extended STIRPAT Model. Sustainability. 2017; 9(5):825. https://doi.org/10.3390/su9050825
Chicago/Turabian StyleLin, Shoufu, Ji Sun, Dora Marinova, and Dingtao Zhao. 2017. "Effects of Population and Land Urbanization on China’s Environmental Impact: Empirical Analysis Based on the Extended STIRPAT Model" Sustainability 9, no. 5: 825. https://doi.org/10.3390/su9050825
Note that from the first issue of 2016, this journal uses article numbers instead of page numbers. See further details here.