
Green Shipping Practices of Shipping Firms


Graduate School of Logistics, Inha University, Incheon 22212, Korea
*
Author to whom correspondence should be addressed.
Sustainability 2017, 9(5), 829; https://doi.org/10.3390/su9050829
Submission received: 12 March 2017
/
Revised: 30 April 2017
/
Accepted: 11 May 2017
/
Published: 15 May 2017
Abstract
:The primary objective of this study is to provide an empirical research using structural equation modeling to identify the factors that motivate shipping firms to adopt green shipping practices (GSP). Furthermore, it also examines if adopting GSP can enhance the shipping firms’ environmental and productivity performance. The findings show that shipping firms are motivated to adopt GSP mostly by industrial norms set by institutionalized associations. They are also motivated by customers’ demand for environmental friendliness and their own strategy to make good image. Unlike our expectation, government regulations and international environmental laws are not significant in influencing shipping firms to adopt GSP. Moreover, adoption of green shipping practices can improve the environmental and productivity performance of the shipping firms.
1. Introduction
With increasing international trade volume, aggravating global warming and climate change issues, reducing the emissions of greenhouse gases and other air pollutants has become a critical concern in the international shipping community. The shipping industry is now experiencing increased pressure to comply with more stringent environmental regulations to become cleaner and greener in their operations. Therefore, adoption of green shipping practices (GSP) is increasingly popularized by shipping companies [1,2,3]. To address the environmental issues of shipping industry, several researchers have conducted studies on improving and understanding the environmental aspects of the shipping industry [4,5,6,7,8,9]. A literature review on environmental sustainability in shipping [10] showed that increasing studies have been conducted in the last decade, whereas almost no studies existed prior to 2005. Most of these studies have dealt with speed reduction [11], fuel consumption, or new energy technology for environmental or economic benefits of shipping companies [12]. Lister et al. [13] found that research on shipping industry for environmental governance is lagged behind compared with other sectors. Part of the reason that maritime governance lags behind stems from weaker implementation procedures of green regulations by the International Maritime Organization (IMO). Dissatisfied with the weaker implementation, regionally-based green initiatives have been adopted including the Paris Memorandum of Understanding (MoU) on Port State Control, European Union’s green legislations and various market-based initiatives [14]. Most existing studies on green shipping have attempted either to solve technical problems to design, operation and other business aspects [10,15,16,17,18], or to survey opinions of stakeholders based on survey or interviews [1,10,11,13,14,19]. No studies, except Lai et al. [4], however, have yet examined the motivations of shipping companies on why they practice green shipping activities. Even the study by Lai et al. [4] only proposed theoretical propositions without providing any empirical evidence. Moreover, it is not addressed and tested yet in the literature whether shipping companies’ green activities help their environmental and/or economic performances. Therefore, it is important to identify the primary motivation and principal factors that affect the decision of shipping firms to engage in green shipping practices and to examine their impact on the environmental and economic performances. To fill the gap in the literature, the primary objective of this study is to provide an empirical research as novelty approach using structural equation modeling to identify the factors that motivate shipping firms to adopt green shipping practices (GSP). Furthermore, it also examines if adopting GSP can enhance the shipping firms’ environmental and productivity performance.
The remainder of the paper is structured as this. Section 2 provides theoretical foundation and construct development. Section 3 describes research design and data collection. Section 4 explains measurement assessment and the results as well as the implications. Finally, the paper is concluded by suggesting further research issues.
2. Theoretical Foundation and Construct Development
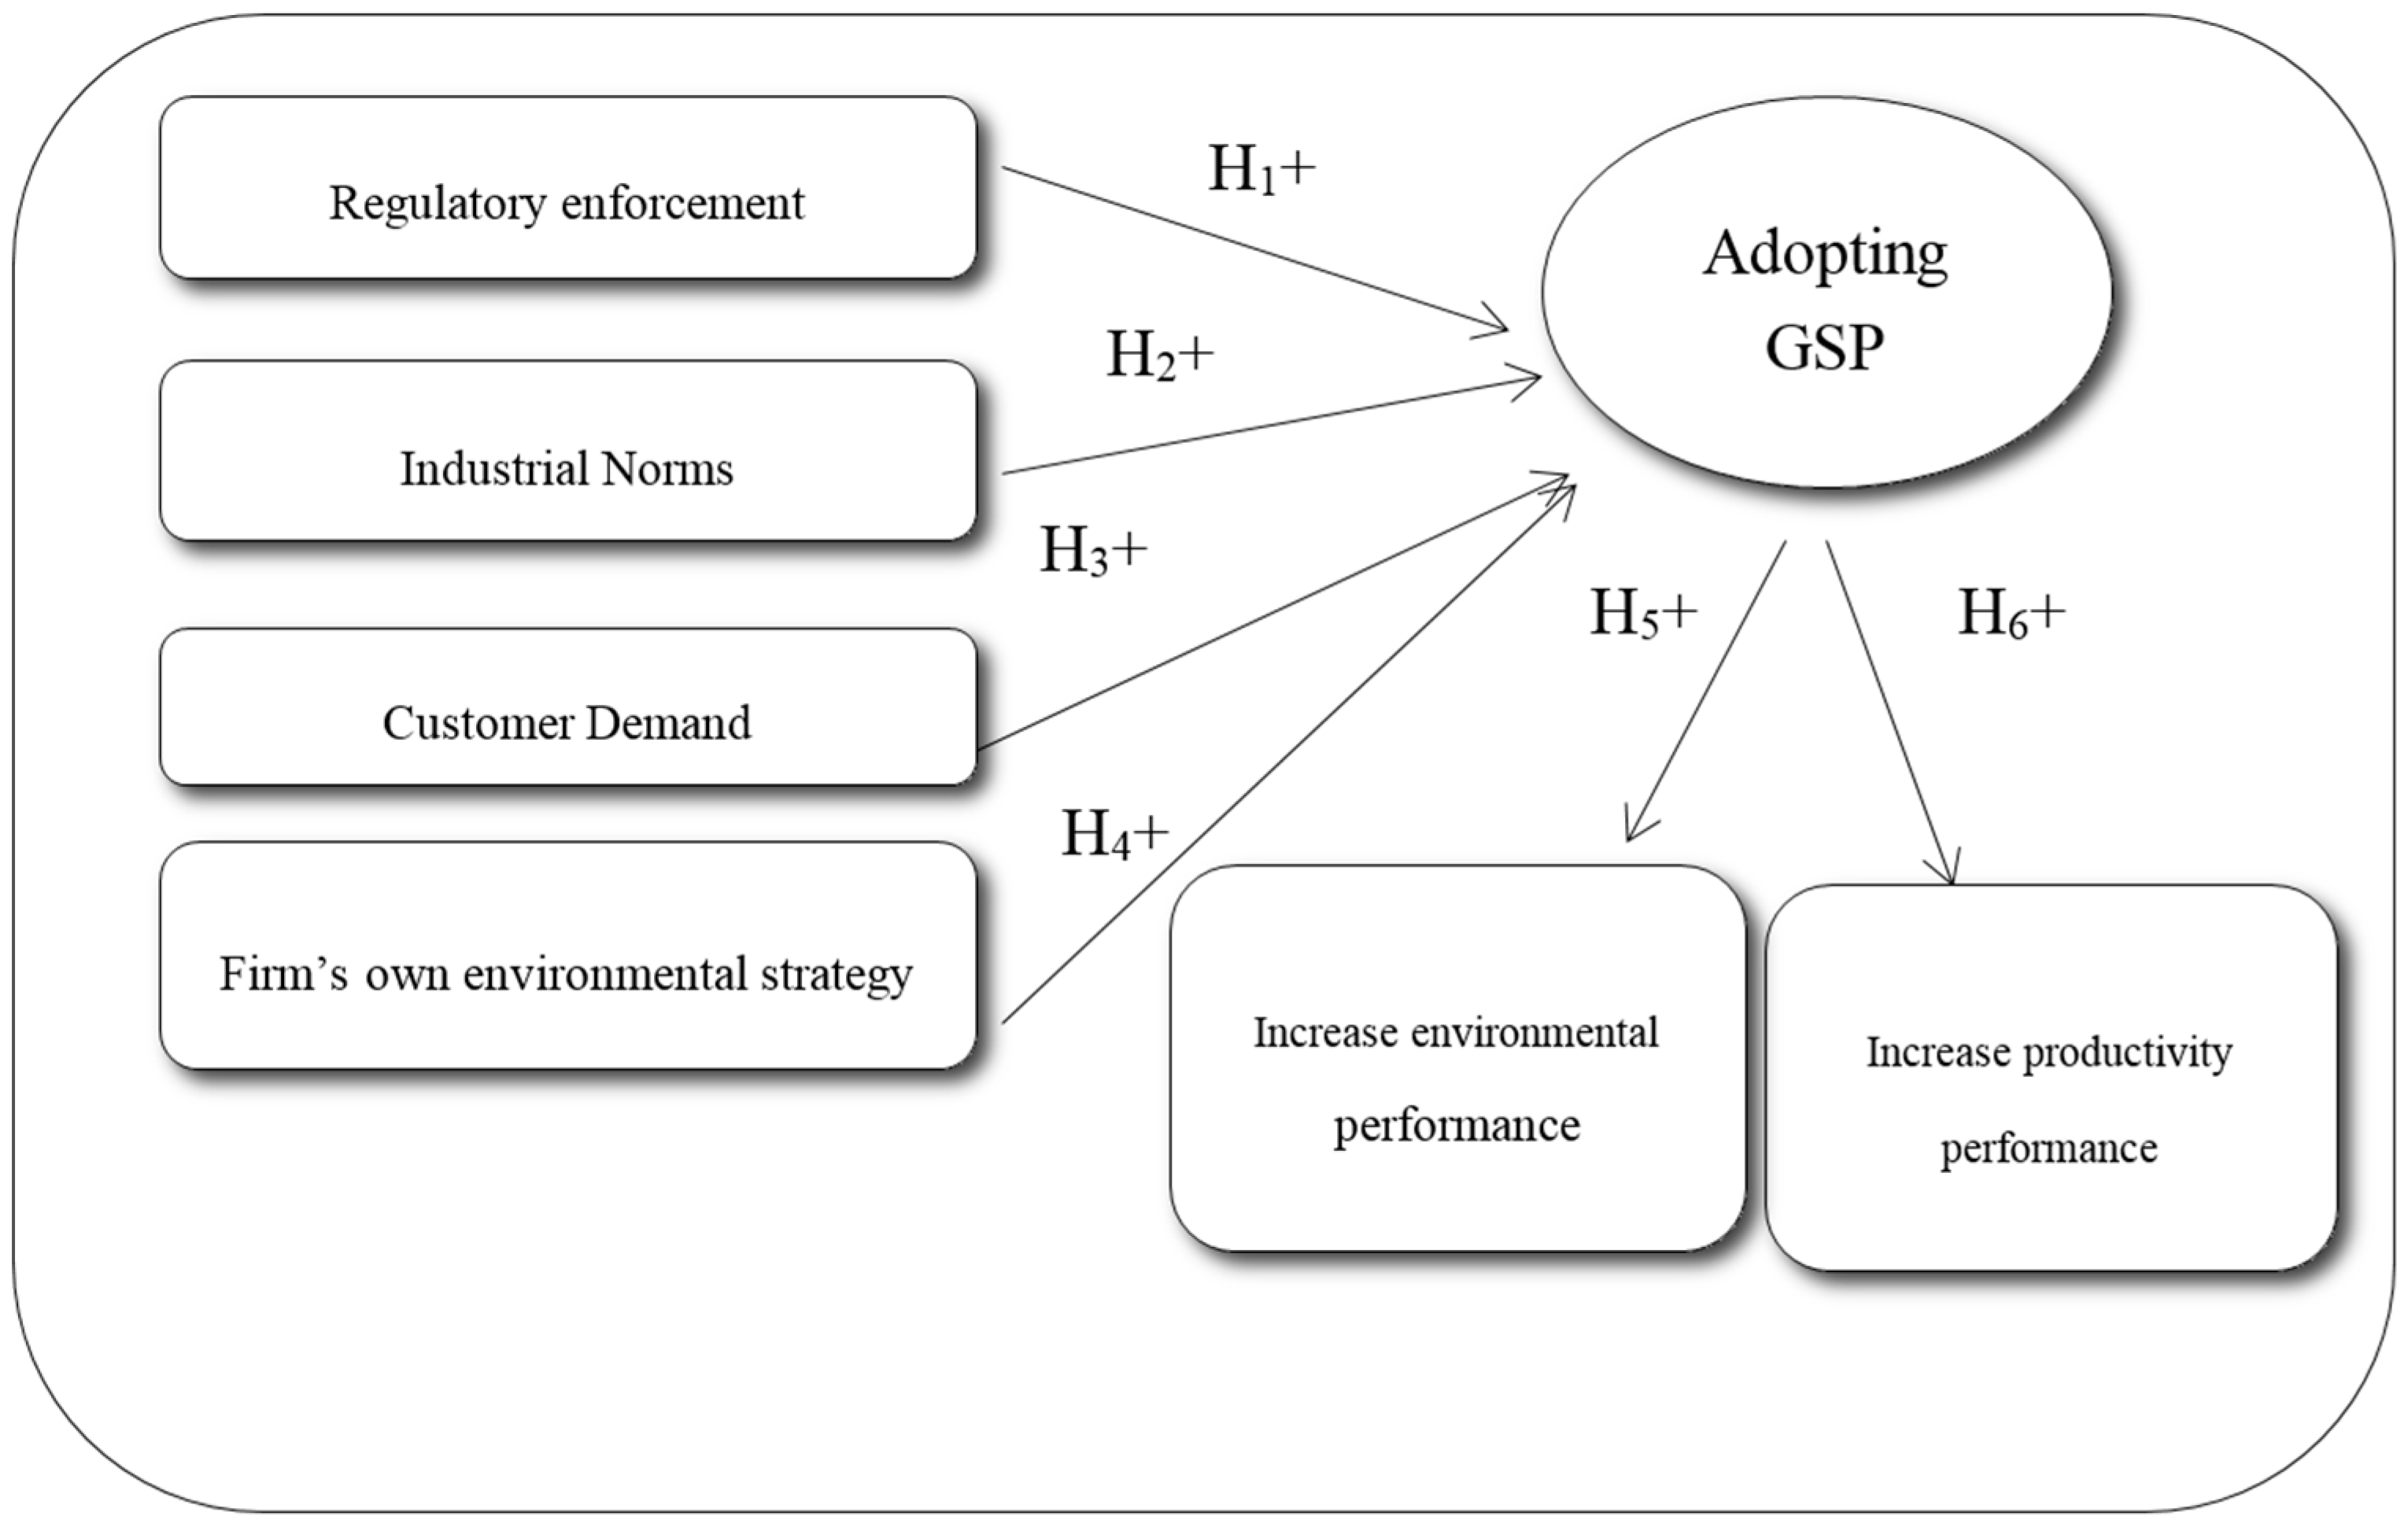
Identifying motivating factors of green shipping practices (GSP) by shipping companies and assessing their impact on the companies’ performances in this study requires us to develop three important constructs as shown in Figure 1. The constructs are: (1) what is green shipping practices; (2) identifying the motivations of the firms to adopt GSP; and (3) environmental and productivity performance. We develop the construct based on relevant theories as follows:
2.1. Conceptualizing Green Shipping Practices
Environmental management system (EMS) has been widely recognized by businesses as an importance factor to gain a competitive advantage over competitors. However, it is also considered a burden because of the perception that being an environmentally friendly business includes a huge amount of investment. Ship-owners, for instance, have lobbied against environmental regulations for decades due to worry about increased costs and distortion of market competition [13]. Melnyk et al. [20] defined EMS as a formal system with a database which combines procedures and processes for training of workforce, monitoring, summarizing and reporting of specialized environmental information related to the firm and its stakeholders. This documentation of the environmental information is mainly focused on the internal issues within the company. The internal issues include the design, pollution control and waste minimization, training of workforce, reporting to top management and the setting of goals.
In the shipping industry, several studies have been conducted related to the environmental management system regarding mitigation of harmful effect brought by shipping emission. Psaraftis, and Kontovas [8] categorized three main ways on how to reduce maritime greenhouse gas (GHG) emissions. These are the technical, market-based instruments and operational measurements (OM). The technical measurements include more efficient ship hulls, energy-saving engines and more efficient propulsion [21]. The market-based instruments include emission trading system and carbon levy schemes [22]. The operational measurement considers speed optimization or reducing ship speed, optimization of ship routing, more use of low sulfur fuels and other logistics-based measures [6,7,9]. Reducing ship speed by 60–70% from design speed can reduce fuel consumption by 70% and in turn the corresponding emissions of ships [11]. The International Maritime Organization (IMO) adopted Energy Efficiency Design Index (EEDI) and Ship Energy Efficiency Management Plan (SEEMP) in 2013 as the results of TM and OM, respectively [13].
Lai et al. [4] defined GSP as an environmental management practice undertaken by shipping firms with great emphasis on waste reduction during the operation and resource conservation in handling and distributing cargoes. For instance, Maersk Line switched from using bunker fuel to a low-sulfur fuel, which reduces the sulfur present in the air up to 80–95% in the port. The company also adopts slow steaming operation and energy-efficient refrigerated containers as well as recycling steel materials of ships [1]. Other shipping firms like BP Shipping are also adopting sustainable operations. They operate in double hulled vessels, have an environmental management system (EMS), and are involved in an emission reduction initiative such as cold-ironing. Yang Ming established the Energy Conservation and Carbon Reduction Committee in 2009 to preserve resources [1]. Facing increasing pressures for greener operation, more and more shipping firms are starting to adopt GSP.
GSP is not only exclusive in one aspect of the business operation but it also includes the whole scope of the shipping business. Lai et al. [4] listed the company’s policy and procedure, shipping equipment, shipping materials, and shipping design and compliance (see Figure 2).
Company policy and procedure is the commitment of a company to have a vision or culture of sustainability. For example, there is a commitment among senior managers, mid-level managers and every department of the firm toward GSP. According to [23,24], strong top management support is needed in the company to have an effective environmental core practices. The establishment of the Energy Conservation and Carbon Reduction Committee by Yang Ming and cradle-to-cradle passport approach of ship materials by Maersk typify shipping companies’ green policy and procedures [1].
Another aspect of GSP is the shipping equipment that refers to the use of shipping equipment and facilities that are environmentally friendly. Shipping companies attempt to avoid the use of refrigerated containers that contains chlorofluorocarbon (CFC). They also use environmentally friendly equipment or technologies based on renewable resources thus minimize the harmful effect produced during operation.
The shipping materials deal with recycling of the used shipping resources to reduce costs and improve the operations. This includes the selling of excess equipment and facilities rather than letting it be idled in the storage place. Furthermore, it also includes the selling of shipping materials, for example, packaging and cartons, rather than considering it garbage, and collecting the used oil and selling it afterward.
The shipping design and compliance is to minimize the life-cycle environmental damage of shipping activities through complying with the regulation requirements of governing body. This includes the use of design of shipping activities and equipment that helps the company reduce consumption of materials and energy, use of polluting energy and implement the reuse, recycle and recovery programs for the materials [1,3]. Thus, it includes broader shipping activities than physical ship designs. Zhu and Sarkis [24] also showed that respondents consider eco-design as a way to increase cost savings due to the decrease of cost for energy consumption, waste treatment and discharge fee. IMO developed standards on construction, design, equipment and manning (CDEM) and inspections are made possible for the compliance with CDEM by a ship [14].
2.2. Drivers Influencing the Adoption of GSP
Although sea transportation is generally considered cleaner transportation compared to other modes, it also faces significant environmental challenges. One of these is the heavy use of fossil fuels during the shipping operation. Leading shipping companies, therefore, attempt to respond to these environmental challenges. Numerous studies were conducted to suggest ways on how to mitigate the GHG emission [5,9,21]. However, very few studies in the literature attempt to identify the significant factors that motivate shipping firms to adopt GSP, except Lai et al. [4]. Building on the theoretical propositions by Lai et al. [4] in shipping industry and adding one more important factor from other fields [25,26,27], we present a conceptual framework on major drivers of GSP depicted in Figure 3. Furthermore, through the support of institutional theory and other literatures, we elaborate and operationalize the different factors that influence shipping firms to adopt green shipping practices.
2.2.1. Government Regulation
Government regulation consists of the international laws set by the International Maritime Organization (IMO) either mandated or voluntarily. It also includes the governing environmental laws in each country that are usually performed mainly by the local environmental protection bureaus that push shipping firms to minimize their impact on the natural environment. Dissatisfied with weak leadership of IMO, the European Commission decided a mandatory scheme for monitoring, reporting and verification of CO2 emissions for ships calling at European ports, which will enter into force in 2018 [13]. Lai et al. [4] and Lister et al. [13] considered regulation as a systematic guideline to lead firms in implementing environmental responsible practices and regulations and as an influential motivating factor for shipping firms to adopt GSP if it is strongly enforced. For example the U. S. Environmental Protection Agency (EPA) tightens the regulation regarding the discharge of grey water of the tanker. Other countries also require shipping firms to install additional tank storage for new and existing vessels. Another example is the Singapore Green Plan headed by the Singapore Environment Ministry that strongly encourages the businesses and the community to be proactive in taking part in the environmental protection businesses. Van Leeuwen [14] describes various regionalization schemes of maritime governance for sustainable shipping based on a literature review.
The government regulations are often a significant factor that drives firms to adopt environmental initiatives [24,26,27]. An example of environmental initiative is the adoption of ISO 14001 certification that provides the requirements for an Environmental Management System (EMS). Fryxell and Szeto [28] found that firms adopt this certification mainly because they desire to ensure that their company is complying with the regulations of Hong Kong government. Thus, it is posited that strong enforcement of government environmental regulations will influence shipping firms to adopt green practices.
2.2.2. Industrial Institutionalized Norms
Most of the industries have their own environmental practices. For instance the Norwegian Shipowners Association is adopting green shipping that includes the responsibility for recycling of ships, continued reduction of atmospheric conditions and establishing forums regarding environmentally friendly shipping. Bansal and Roth [25] conducted a research regarding the factors that motivate firms to adopt corporate ecological responsiveness. The respondents of the study are different types of firms including the Peninsular and Oriental Steam Navigation Company, which is a shipping firm. Three motivations for firms to adopt corporate ecological responsiveness are the competitiveness, legitimation and ecological responsibility. Legitimation is defined by Suchman [29] as the desire of a firm to enhance its proper actions within an established set of regulations, norms, values or belief.
Most shipping firms are members of industrial associations where they have their own missions and visions. Industrial associations such as INTERTANKO encourage its member to continuously improve the Tanker industry’s performance. They strive to achieve the three goals of zero fatalities, zero pollution and zero detentions. Some of industrial norms are institutionalized by regional dimensions, e.g., Green Award by a Dutch initiative; Clean Shipping Project, a Swedish one; and the Clean Cargo Working Group, an American one [14].
2.2.3. Customer’s Environmental Demand
Customers are considered as presumably most important aspect in the business. Customers are the consumers of using products and services provided by business entities in manufacturing and service industries. They have a direct impact on firm’s operation especially on the environmental activities [30]. Zhang et al. [31] recognized the importance of identifying the primary motivation and principal factors that affect firm’s decision to involve in environmental protection initiatives. They conducted a survey to 176 chemical manufacturing firms using a regression method. The result showed that pressure from customers is one of the positively significant factors that motivate the firms to adopt environmental management initiatives.
Björklund [26] conducted a research to identify the contingency factors that work as a driver or hindrance to green performance. The result showed that 74% of the respondents coming from large Swedish companies in the food and forestry sectors described customers’ environmental request as a driver to green performance while only 2% mentioned that it is a hindrance. Furthermore, customers give pressures to shipping firms to adopt GSP through requiring them to have an ISO 14001 certification [32]. Adoption of an ISO 14001 can be formulated as an operational standard between shipping companies and their business partners [2]. In a similar vein, cargo owners involve participation in new green regulations in shipping industry such as the Clean Cargo Working Group and NGO-led Sustainable Shipping Initiative [13]. Lister et al. [13] and Fryxell and Szeto [28] showed that larger firms dealing with international customers usually tend to adopt environmental initiatives in order to meet their customers’ expectation.
Another possible motivation for shipping firms adopt green practices is that there are environmental conscious customers who carry out environmental audits of the shipping firm. Through the environmental audits, customers can recognize the positive efforts made by the shipping firms to increase their environmental performance. Companies like H&M and Akzo Nobel select ships that have a good environmental profile to reduce carbon footprint [14]. Thus, this increases the confidence of its customers. Therefore, the strong environmental demand from the customers can greatly influence the shipping firms to adopt green practices.
2.2.4. Firm’s Own Environmental Strategy
Bansal and Roth [25] conducted a qualitative study that examined the reasons of 53 companies in different business sectors why they go green. One of the common reasons is that they want to improve their company’s image. A good reputation is considered as an important asset in the current market where there is an increasing environmental awareness. This is supported by the study of [26] who showed that the reputation of firm, image and its products are viewed by all the respondents as great driving forces for environmental purchasing of transportation services. Similarly, Quazi et al. [33] showed that 52% of the respondents stopped buying products from companies that have poor environmental image in the Gallop poll during 1990. Through firm’s environmental image the customers could recognize how credible the company is and how environmentally responsible it is. Fryxell and Szeto [28] affirmed that firms need to adopt green practices to improve their image, maintain their customers and attract environmental conscious customers.
Furthermore, Chavan [34] and Montabon et al. [35] claimed that firms are adopting environmental initiatives mainly because of gaining a commercial advantage. Practicing environmental initiatives can serve a firm’s bottom line [36]. Other companies adopt pro-environmental strategies to gain competitive advantage through differencing its strategy from its competitors.
2.3. Productivity and Environmental Performance
To be an environmental friendly and economically successful company is one of the interesting issues for current businesses. Being environmental conscious is usually perceived as a burden to the business sectors due to the additional cost needed to improve its operation and subsequent decrease of its profitability as has been the case with shipping industry [13]. On the other hand, there are other arguments that the improvement of environmental performance would lead to increase of productivity performance because of the cost saving and increase in sales. Rao and Holt [37] and Klassen and McLaughlin [38] showed that applying environmental initiatives improve not only a firm’s environmental performance but also its production performance. Similarly, Yang et al. [39] showed that internal and external green collaboration in supply chain can enhance firms’ performance and competitiveness.
Production performance is concerned with the improvement in product development and delivery [40] while environmental performance is to measure the performance of the company pertinent to the reduction of its pollution, conservation of resources and the environmental image of the company.
Several studies [38,41,42] show a positive relationship between adopting environmental initiatives and economic result of the firms. Other literature concurs in acknowledging that there are several benefits that firms can obtain towards the competitive advantage when a firm mitigates its environmental impact [43]. Examples of these benefits are: the cost reduction resulting from more efficient use of raw materials; reduction in fines and risk costs; quality improvement; early adoption of new regulations; benefits in management and personnel; external benefits caused by the improvement in company image; loyalty; and improvement in stakeholder communication and feedback [33,44,45].
As for the relationship between adopting green practices and environmental performance, several studies [1,24,28,46] supported the idea that adoption of environmental management improves environmental performance of the company. Increasing environmental performance would reduce pollution such as carbon emission, waste water and solid waste, which in turn improves the cost savings. Thus, our study assumes that adopting green shipping practices lead to the overall improvement of environmental and production performance of the shipping firm. As future studies are recommended to examine the relationship between environmental sustainability and economic performance [10], our study is deemed to contribute to the literature by providing empirical evidence on the relationship.
3. Research Design and Data Collection
3.1. Research Hypothesis
The research hypotheses were taken from the previous literature mostly based on the study of [40]. The Hypotheses 1 to 4 examine the relationship between four driving factors and adopt the GSP. Hypotheses 1 to 3 come from the prepositions of [40] and Hypothesis 4 is added through the literature review suggesting that one of the factors motivating shipping firms to adopt green practices is their own environmental strategy. Hypotheses 5 and 6 investigate if adopting GSP can enhance the environmental and productivity performance of the firm, respectively.
Figure 4 is the theoretical framework of the study. It suggests that shipping firms adopt green shipping practices because of the enforcement of regulatory environmental requirements, exposed to industrial norms regarding environmental protection, due to strong environmental request from the customers and firm’s own environmental strategy. Furthermore, it also implies that shipping firms adopting GSP can achieve both environmental and productivity performance gains. Thus, the hypotheses of the study are stated as follow:
Hypotheses 1 (H1).
Strong enforcement of regulatory environmental requirement to the shipping firms is positively related to adopting GSP.
Hypotheses 2 (H2).
Exposing the shipping firms to the industrial norms regarding environmental protection is positively related to adopting GSP.
Hypotheses 3 (H3).
Strong environmental request from the customers is positively related to adopting GSP.
Hypotheses 4 (H4).
Firm’s own environmental strategy is positively related to adopting GSP.
Hypotheses 5 (H5).
Adopting GSP is significant in improving environmental performance.
Hypotheses 6 (H6).
Adopting GSP is significant in improving productivity performance.
3.2. Instrument Development
The initial questions used for the measurement instrument were developed from the reviewed literature. First, 19 GSP choice items were developed from [40], 17 choice items for the reasons of shipping firms to adopt GSP and 11 choice items for the results of adopting GSP. In order to test the comprehensiveness of the instrument and eliminate the ambiguousness, online pretest survey was sent to three large shipping firms, and forty professors and graduate students working in logistics departments in Korea. The pre-test showed that the survey form needed only few minor changes especially in the clarity of the sentence. Thus, no questions were deleted but a minor revision of the ambiguous sentences was made. The revised questionnaire was checked again by another round of experts of the same sample to the pretest and it was confirmed that all expressions were clear and covered necessary items in conducting this research. As the questionnaire was developed based on the thorough literature review and tested via the pre-test and post-test, the content validity is deemed to be achieved. In sum, the pilot test was based on the sample size of forty three (three large shipping firms and forty professors and students), who are familiar with green shipping practices in Korea.
We developed the measurement instrument following the study by Chen and Paulraj [47] to meet the requirements for the reliability, validity and unidimensionality. The flow of the instrument development is displayed in Figure 5, and includes four main stages with an involvement of continuous improvement cycle.
The first stage (see Figure 5) tests the reliability of the whole instrument and each construct for assessing if the developed instrument is appropriate in achieving the objectives of the research. Reliability test is used to investigate if the observed variables are consistent to what the instrument and each construct are intended to measure. Then, the construct with least reliability was investigated using the inter-item correlation method in order to identify the items that contributed the least to the construct. Items that are negatively correlated and less than 0.10 should be deleted given that the cut off value is 0.30 [48]. Afterwards, the reliability of the constructs is again tested to assure that each construct achieved the 0.60 minimum requirements for reliability [49].
The second stage is testing the construct validity using exploratory factor analysis (EFA). Construct validity is tested to examine if the item is significantly loaded on the factor that it is measuring. EFA is usually used to provide the researcher with the information about how many factors are needed to best represent the data. The result of the EFA, however, is used as a comparison to the theoretical framework of the study because the constructs in this study were already identified based on the theoretical foundation before the process. Therefore, the exact number of factors that need to be extracted is identified before running the program. An item that is not loaded in the intended factor where it should be loaded is called nuisance item and thus it should be discarded [47]. All items should exceed the minimum factor loading value of 0.30. Afterwards, reliability test is again performed to ensure that deleting the nuisance item would increase the reliability of the construct.
The third stage uses confirmatory factor analysis (CFA) to test the unidimensionality, construct validity and discriminant validity. Unidimensionality test is important to affirm that the set of measured variables (indicators) has only one underlying construct. The need to examine the construct validity is important to know if a set of measured variables actually represents the theoretical latent construct where they are designed to measure. Discriminant validity is used to validate if the construct is truly distinct from other constructs [50]. After fulfilling all criteria, reliability test was performed again.
Finally, criterion-related validity is concerned with the ability of the scales to represent the various construct related to measure of performance. After accomplishing all of the validity and reliability, the instrument is considered appropriate to use for data analysis.
3.3. Data Collection
3.3.1. The Sample
Because we like to target companies that are operating globally, regionally and locally, the final online questionnaire was first sent to the 556 shipping firms that are considered as ship owner, ship operator and ship managers. They are members of World Shipping Council, International Association of Independent Tanker Owners (INTERTANKO), International Association of Dry Cargo Shipowners (INTERCARGO) and Baltic and International Maritime Council (BIMCO). Furthermore, we prepared English, Chinese and Korean versions of the questionnaire to increase the response rate. The three versions were validated by native language experts in each country to ensure that the translations were identical to each other.
One week after first email, reminders were sent again to all potential respondents. Another week later the final reminder was sent. In an effort to increase the response rate, convenient sampling [24] and then drop-off survey were conducted to the shipping firms that are based in the Philippines. A respondent from environment department if present in the company were sought at first and, if none, then from the operational or technical department. Consequently, 77 responses were received, 50 from online survey and 27 from the drop-off survey. One response was removed from the data due to incompleteness. Thus, 76 useable responses of the questionnaires were collected for this study.
3.3.2. Non-Response Bias
Forty-nine useable responses from the online survey and 27 responses from the drop off survey were collected. Due to the difference of data collection method, only responses from the online survey were utilized to test the non-response bias. The early and late waves of responses were examined using independent sample t-test. The hypothesis is that the two sample means are not different. The result showed that there is no statistically significant difference (at 95% confidence interval) between the two groups thus non-response bias is not a problem in this study.
4. Measurement Assessment and Result
4.1. Measurement Development and Assessment
The GSP measurement model is composed of four constructs, as shown in Figure 2. The four constructs are company policy and procedure (CP), shipping equipment (SE), shipping materials (SM) and shipping design and compliance (SD). The measurement model of the drivers influencing the adoption of GSP (see Figure 3) consists of regulation (REG), industrial norms (NRM), customer demand (CST) and firm’s own environmental strategy (FRM). The measurement model of the result of adopting GSP involves environmental performance (ENP) and productivity performance (PRP). All of the processes of the measurement development and assessment follow the flow displayed in Figure 5. Henceforth, the GSP measurement model, GSP driver model and the measurement model of the results of adopting GSP will be called Model 1, Model 2 and Model 3, respectively, for the convenience of expression.
4.1.1. Reliability Test and Inter-Item Correlation—First Stage
After collecting the data, reliability test to the whole data and to each construct was first conducted using SPSS 19. The reliability was measured using Cronbach alpha value which is the most commonly used index of scale reliability [51]. The result shows that the Cronbach alpha value of the whole data is 0.94, which is greater than the cut-off value 0.70 therefore instrument’s reliability is accepted. Then we used the three-step approach presented by Flynn et al. [48] and also adopted by Chen and Paulraj [47] in selecting constructs. First the constructs were accepted if the Cronbach alpha value is greater than 0.7. Second, the constructs with an acceptable Cronbach alpha of at least 0.60 were further evaluated for the possibility of improvement. Then, the items that contributed least to the overall internal consistency were the first to be considered for exclusion. The result shows that only the SM construct in Model 1 and the NRM construct in Model 2 have Cronbach alpha lower than 0.60 and contributed least to the overall internal consistency of the model they indicated. The constructs SM and NRM were not able to achieve the given criteria of Cronbach alpha therefore using inter- item correlation matrix the two constructs were further examined to identify the items on each construct that contributed the least. The items that contributed the least are the best candidates for deletion. In addition, if the item has a negative correlation to the other item within a scale it should be the first to be deleted [47]. All retained items should reach the cut-off value 0.30 which is given by Flynn et al. [48].
The result of inter-correlation matrix shows that the correlations of items in NRM construct achieved the criteria for inter-correlation, however, the Cronbach alpha value is still lower than the given cut-off value thus the researchers decided to remove NRM 3 to see if there will be improvement in the Cronbach alpha. Reliability of the NRM construct was tested again and the result showed that after removing NRM3 the Cronbach alpha value increased to 0.66.
For the SM construct, all items passed the given criteria. Nonetheless according to [47], if a construct still fails to achieve the target value of Cronbach alpha, it should be discarded. Therefore the SM (shipping materials) construct comprised of SM1 and SM2 were removed from the analysis. Since all the constructs surpassed the given criteria values, the analysis continued on to the next stage of instrument development which is construct validity test using exploratory factor analysis.
4.1.2. Exploratory Factor Analysis—Second Stage
The next stage is to test construct validity through exploratory factor analysis (EFA). The principal component analysis with varimax rotation was utilized in all three measurement models. Furthermore, the exact number of factors to be extracted was identified before running the program because the number of constructs was determined based on the theoretical framework as explained previously. Then the results of EFA were compared to the theoretical framework of the study. Indicator items that loaded on the factor where they are not intended to load were deleted following the approach of [47]. Furthermore, scree plots and the eigen value greater than 1 [52] were used to ensure that the extracted factors were significant. Then reliability test was again performed to assert if the criterion of Cronbach alpha is satisfied.
The result in Model 1 where three factors were extracted showed that CP5 and CP6 in the CP construct and SE1 in the SE construct were not located together with the other items that they are intended to be located thus they were deleted in the measurement Model 1. The eigen values of three extracted factors were all above the cut-off value.
In Model 2, where there are four extracted factors, the four items REG5, REG6, NRM1 and FRM4 were deleted because they were considered the nuisance item. Again, all eigen values were above 1. The result of Model 3 having the two extracted factors were above the eigen value cut-off and only ENP5 was not loaded in the intended factor, thus it was removed in the model.
After ensuring that all the items are loaded in the factor where they are intended to load, reliability test on each construct was again performed to ensure that deleted items did not reduce the reliability of each construct. All the constructs achieved the minimum value of Cronbach alpha such that NRM construct had the lowest value of 0.60 and FRM construct had the highest value of 0.91.
4.1.3. Confirmatory Factor Analysis—Third stage
The third stage is to test the unidimensionality and construct validity using confirmatory factor analysis (CFA) utilizing AMOS 18. The summary result of the CFA can be seen in Appendix A. It shows the outcome from reliability analysis, unidimensionality and construct validity.
Unidimensionality
The test of unidimensionality is used to ensure that a set of measured variables (indicators) has only one underlying construct. In this study, CFA was used to test the unidimensionality of the model. Unidimensionality was validated through examining the overall model fit of the models. Garver and Mentzer [51] suggested two methods to evaluate the overall model fit. First is to choose fit indices that represent measures of absolute fit, incremental fit measures and parsimonious fit measures. Second is to use more restrict criteria and select the fit indices that best represent these criteria.
The second method was used in this study. Five different measures of model fit, namely the normed chi-square statistics (χ2), comparative fit index (CFI), Tucker-Lewis index (TLI), adjusted goodness of fit index (AGFI) and root mean square error of approximation (RMSEA) were evaluated. The acceptable threshold for normed χ2 should be between 1.0 and 3.0 because χ2 < 1.0 is considered as an over-fitted model and χ2 > 3.0–5.0 is considered as an under parameterized model [53]. For the CFI and TLI, the acceptable threshold is 0.90 or greater while 0.80 or greater for AGFI and 0.05–0.08 for RMSEA. For getting the AGFI, data with input mean value were utilized because the AMOS program does not allow the use of raw data with missing value in finding the value of AGFI.
The results in Appendix A show that Model 1 and Model 2 are adequately fit. However, in the case of Model 3, only the CFI value reached the criterion.
Construct Validity
Construct validity examines the degree to which a scale measures what it intends to measure [51]. It includes two sub-dimensions: the convergent validity and discriminant validity. Convergent validity investigate if the item significantly loads on the factor it is measuring while discriminant validity ensures that the item representing the latent variable measures no other construct from other items that represent other latent variables [51,54]. Convergent validity was tested through examining the factor loadings of each item using EFA. The factor loadings should exceed the minimum value of 0.30 [47] and the eigen value of each construct should be higher than 1.0 to ensure the convergent validity [50]. The proportion of variance (R2) from the result of CFA was also utilized to estimate the reliability of each indicator with a minimum value of 0.30. It can also be tested by using the t-values which is the critical ratio (C.R.) in the AMOS text output file. This C.R. represents the parameter estimate divided by its standard error [50,55].
Appendix A shows that all items were able to exceed the minimum value of 0.30. All constructs are above the minimum cut-off value of eigen except NRM construct. In terms of R2, all items were above 0.30, and their factor loadings and standard coefficients surpassed the criteria as well with t-values being all significant at p value < 0.01.
Discriminant validity was also tested to investigate if two or more constructs are separated and distinct from one another [56]. In order to test the discriminant validity, correlations among latent variables of the measurement model were assessed and compared to a theoretical model observing difference of chi-square values [57]. Several researches [47,51,55,58] used a test where two factor measurement models were specified. In Model 1, the estimated correlation parameter between the two constructs was constrained to 1.0 while estimated correlation parameters of Model 2 were freely estimated between two constructs. Using maximum likelihood (ML) estimation, the correlation between the two constructs and their each chi-square were measured. Then the difference of chi-square values for these two models was calculated. The idea in this method is that the larger the item value of difference from other item values, the more different it is from the others. Thus, it shows that each item is significantly different from other items.
Except NRM and FRM constructs, correlations of all constructs were tested using maximum likelihood estimate (ML). In addition, NRM and FRM constructs were tested using the generalized least square (GLS) because the AMOS software cannot establish the correlations of two constructs using ML. According to [59] GLS assumes normality but does not impose the restriction of a positive definite input matrix. Thus, to ensure the normality distribution of the residuals, Shapiro–Wilk estimator was executed. The result shows significant values, hence the data are normally distributed. Table 1 presents the final results of discriminant validity. The table shows all constructs are distinct with each other ensuring the discriminant validity.
4.1.4. Criterion-Related Validity—Fourth Stage
Criterion-related validity is a measure of how well scales representing the various construct are related to measures of performance. As this study uses two performances each construct was correlated with the environmental performance and productivity performance, respectively to test the criterion-related validity.
Table 2 presents the result of criterion-related validity using the AMOS 18 software. The result shows that all the constructs are significantly correlated to the outcome variables. Through the result of the correlation analysis, the researchers concluded that the development of theoretical constructs have an acceptable criterion-related validity.
4.2. Results
4.2.1. Structural Equation Model Results
After confirming and establishing the instrument measurement, the proposed structural model was assessed to investigate the hypothesized relationships. Maximum likelihood ratio was utilized as the estimation method because it postulates that the data are univariate and multivariate normal and also it is commonly used to manage missing data [60,61].
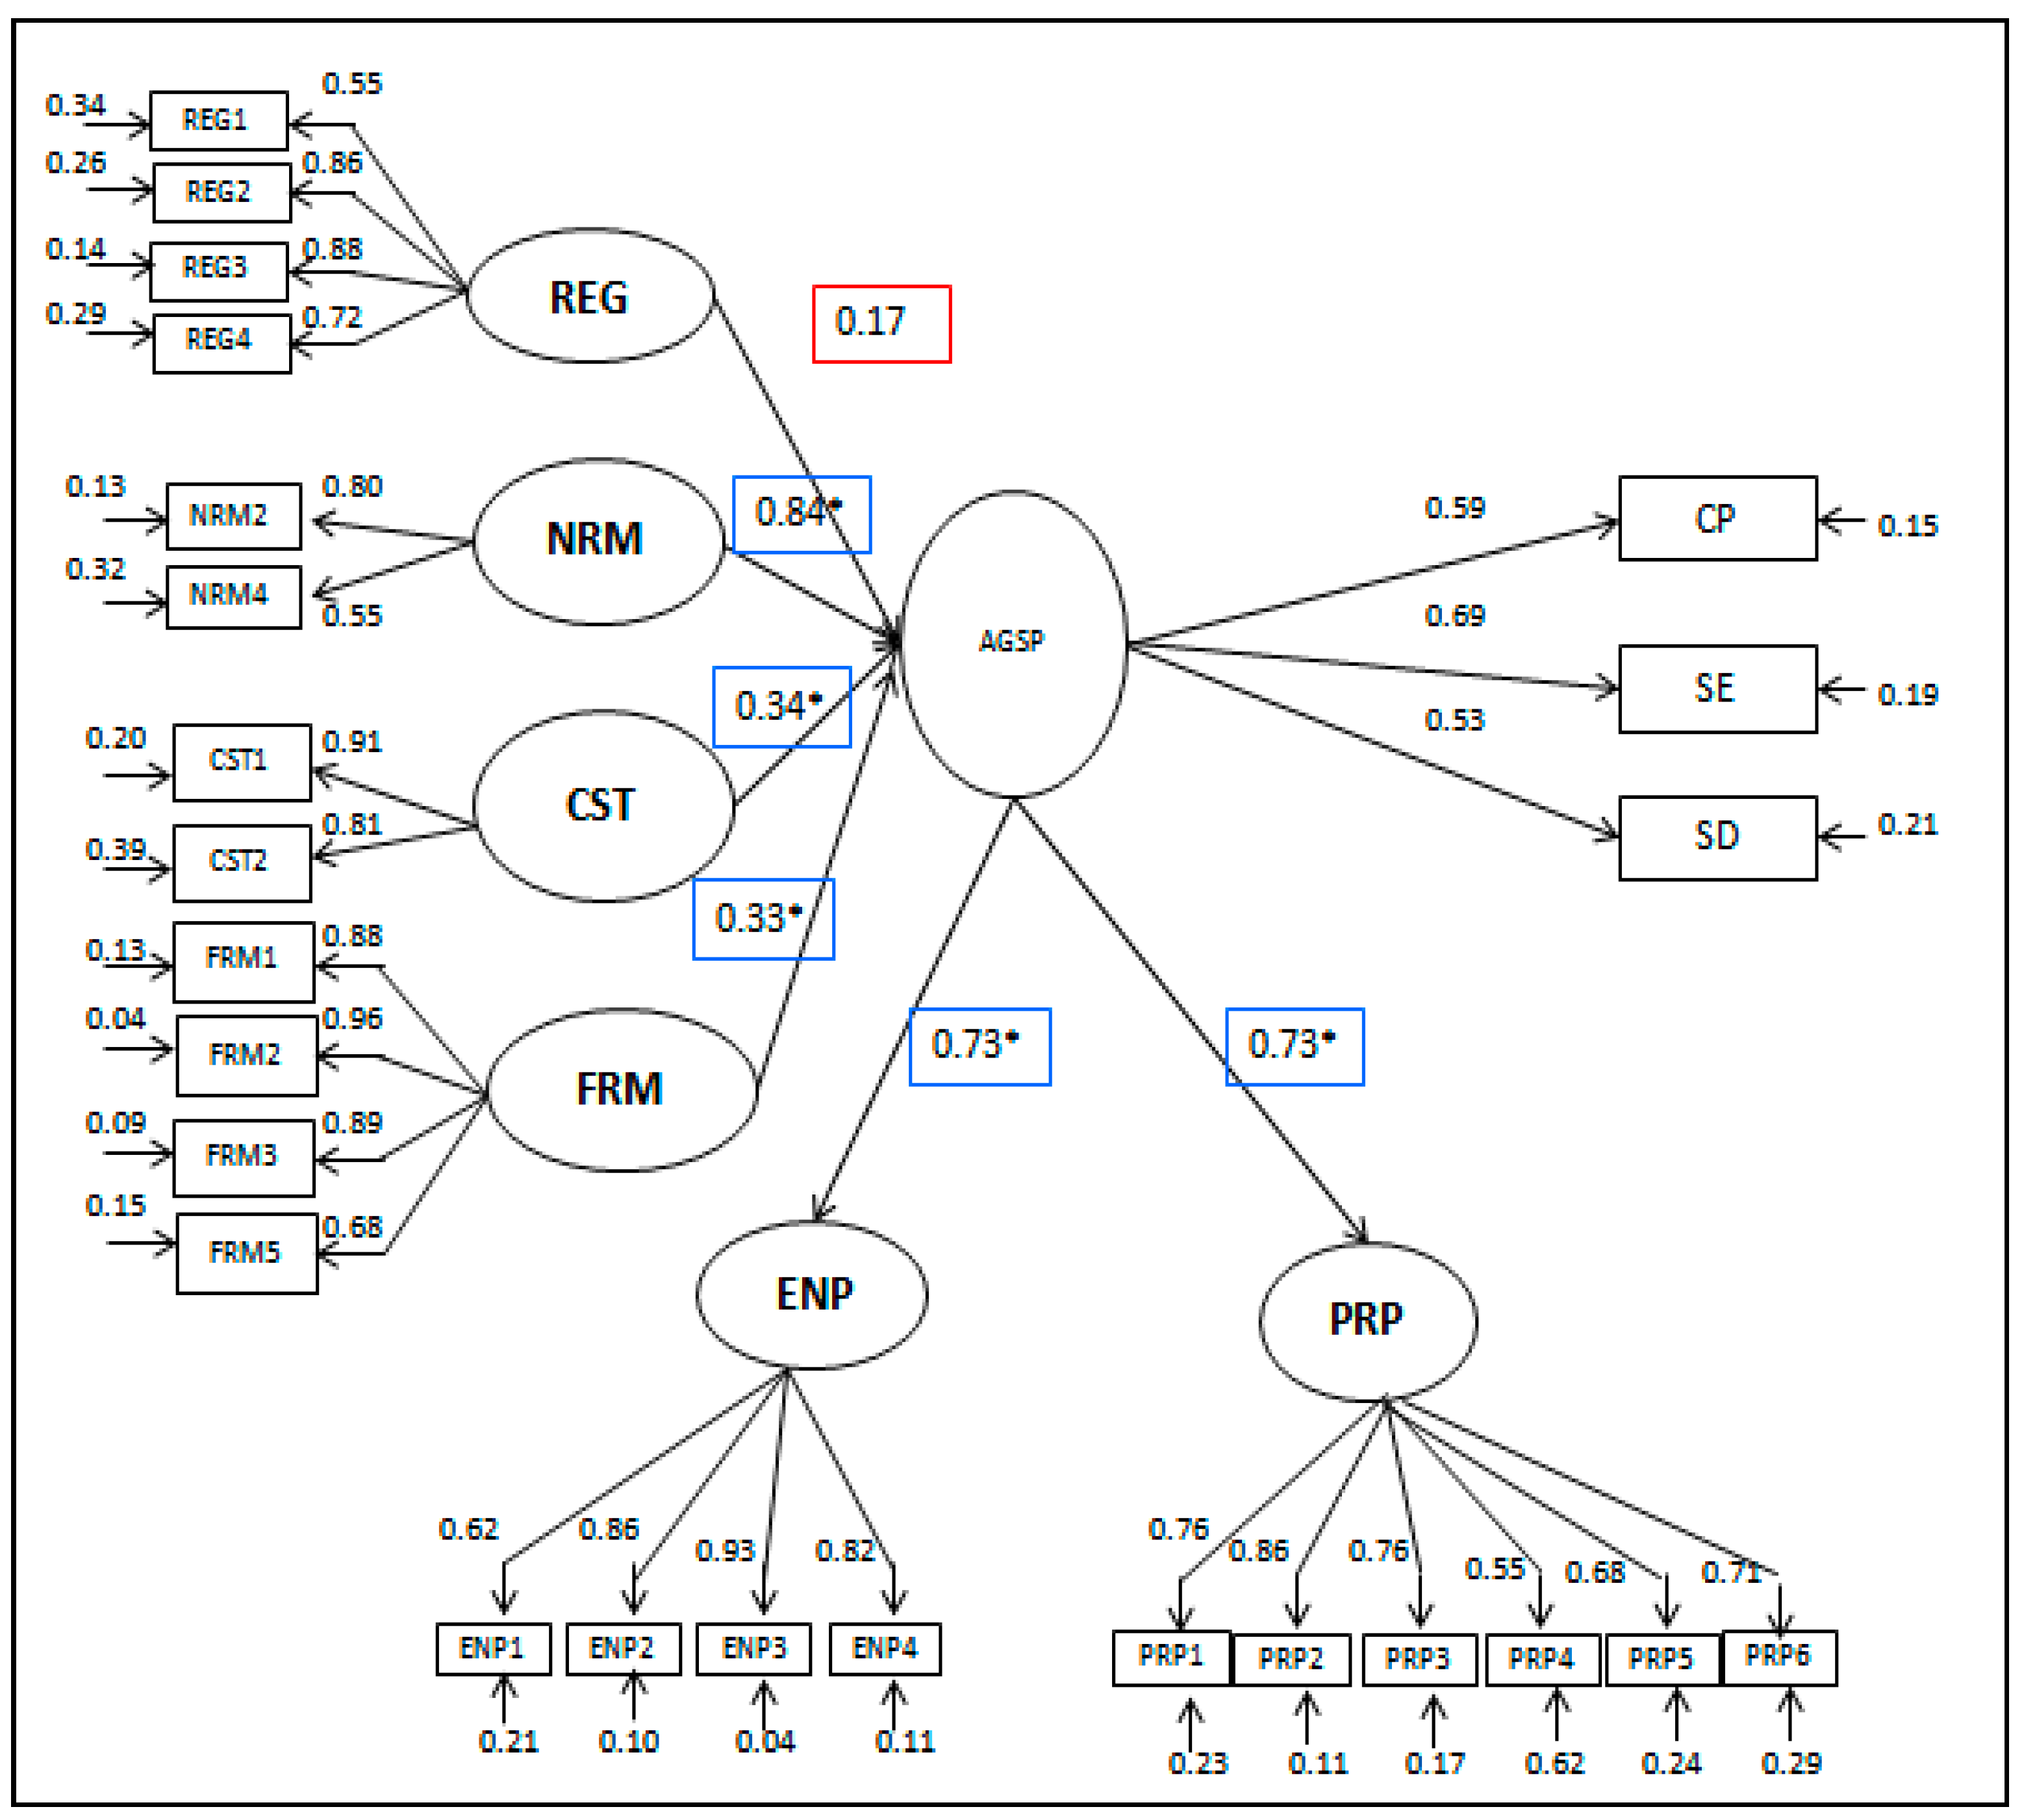
Table 3 and Figure 6 summarize the results of the hypotheses testing. Among the four hypothesized factors that could influence shipping firms to adopt green practices, H2 to H4 are positive and significant. Therefore, it indicates that industrial institutionalized norms, customer environmental demand and firm’s own environmental strategy are the significant factors that influence shipping firms to adopt green shipping practices. At 10% significance level regulation is not considered as an influential factor for shipping firms to adopt GSP. The industrial institutionalized norms factor is considered the most influential factor having 99.9% confidence interval in motivating shipping firms to adopt GSP followed by firm’s own environmental strategy then customers’ environmental demand.
Furthermore, H5 and H6, which predict positive result in increasing the environmental and productivity performance of shipping firms after adopting GSP, show positive and significant results as expected. Adopting GSP affects the improvement of environmental and productivity performance at the same rate.
4.2.2. Hierarchical Regression Results
One can argue that adoption of GSP can be different between larger firms and small firms. Similarly, firms operating in different market coverage among global, regional and local areas can have different motivations and degrees of practicing GSP. For instance, large size firms operating in global market can have more motivations and practices of GSP due to more exposure to regulations, norms, customer demand and their own strategy. In other words, the firm size and market coverage can be control variables in affecting the results of this research. To test these control variable effects as well as to check again that the results of the structural equation models are not biased, we employed hierarchical regression analysis. Adopting green shipping practices (AGSP) is the dependent variable and regulations (REG), industrial institutionalized norms (NRM), customer environmental demand (CST) and firm’s environmental strategy (FRM) are the independent variable. All the item values that are included in each construct were averaged in order to obtain the overall construct values [62].
We added two control variables: the firm’s size and market coverage operation. The firm size is the scale of operation based on the number of the firm’s employees. Dummy variable 1 to 5 was assigned, where 1 = fewer than 51 employees; 2 = 51 to 200 employees; 3 = 201 to 500 employees; 4 = 501 to 1000 employees; and 5 = more than 1000 employees [62,63]. The second control variable is the market coverage operation of the shipping firm, where 1 = domestic operation; 2 = regional operation; and 3 = global operation. The results are shown in Table 4.
In Model 1, only one control variable, the firm’s size, was included (F value = 1.102, insignificant). Then, in Model 2, the second control variable, the market coverage operation, was entered into the regression equation (F value = 0.565, insignificant) indicating that the two control variables only explain 1.6% (R2 = 0.016) of the variance in adopting GSP and they are insignificant.
Models 3–6 are composed of independent variables where the independent variable was entered one by one in each model. In Model 3, the REG, which is the first independent variable, was entered and the result shows that the regulation is significant factor in adopting GSP (β = 0.000, p < 0.001). However, in Model 4, when NRM was entered in the regression equation REG became insignificant in affecting the adoption of GSP while NRM is significant (β = 0.000, p < 0.001). In Model 5, the CST was entered in the equation and resulted in a significant value of NRM (β = 0.000, p < 0.001) and CST (β = 0.001, p < 0.01). In Model 6, composed of all control variables and independent variables, the result shows that all control variables are not significant in influencing the adoption of GSP while only the regulation variable among the driver factors is not significant in affecting the adoption of GSP by shipping firms.
Therefore, the result of the hierarchical regression supports the result from structural equation modeling reassuring that regulation (REG) is the only factor that is insignificant in adopting GSP by the shipping firms.
4.2.3. Discussion and Implications of Results
The result regarding the factors that motivate shipping firms to adopt GSP shows that industrial institutionalized norms is the most significant factor, followed by firm’s own environmental strategy and then customers’ environmental demand. On the other hand, regulation enforcement was not significant at 10% significance level and it was tested again using hierarchical regression. The result from hierarchical regression using the average data of each construct supported the result from structural equation modeling. The result indicates that shipping firms will mostly adopt GSP if the institutions where they belong pushed them to be an environmentally friendly operator. In addition, for shipping firms to be competitive and distinguish themselves from their competitors, they adopt environmental strategy such as adopting GSP in their company. Furthermore, because most businesses are customer driven companies, the environmental demand from their customers force the companies to implement GSP. On the other hand, the non-significant relationship of regulation enforcement to the adoption of GSP is supported by the study of [64]. They found that government regulation is insignificant in shaping firms to adopt environmental management when basic compliance is not the issue. The other possible explanation for this result is that some of the respondents are domestic operators and so there is a possibility that the environmental regulations in their own countries are not as strict as international environmental laws. Even if the hierarchical regression showed that the market coverage effect did not influence the results of GSP by shipping firms, this should be further tested when more data are collected in the future.
The question of whether adopting GSP enhances environmental and productivity performance of the shipping firms or not is an interesting debate. There are views that there is a trade-off between environmental performance and productivity performance. It means that, for a firm to be environmentally friendly, it needs to compromise the productivity performance of its company or vice versa. However, the result of this study shows that adopting GSP is significant in improving the firm’s environmental and productivity performance. Lai et al. [4] also found the same relationship between green logistics management and the environmental and productivity performance in Chinese manufacturing exporter. Their study shows that adopting environmental management is significant in increasing the environmental performance. Moreover, the result that GSP is also significant in enhancing the productivity performance of the shipping firms is supported by the idea that pollution is equal to inefficiency. Pollution is usually in the form of economic waste and if there is pollution it only means that resources have been used incompletely, inefficiently and ineffectively [65]. Thus, adopting GSP can reduce the pollution and consequently can increase the productivity performance [66].
These findings have important implications for regulatory bodies and managers of the shipping firms. Since customers’ environmental demand and industrial institutionalized norm are significant in influencing shipping firms to adopt GSP, the regulatory bodies should strengthen the involvement of customers and industrial institutions towards green shipping [67]. Furthermore, this study can serve as a basis in evaluating green practices for shipping firms that are currently implementing GSP and as a guide for shipping firms that are planning to adopt GSP. Lastly, showing that adopting GSP not only improves environmental performance but also productivity performance of a shipping firm [67], this study can serve as an encouragement for shipping firms to adopt GSP. In addition, recent studies by Poulsen and Johnson [68] and Kitada and Ölçer [69] show that energy consumption practices in shipping companies often conflict with common business practices and human element should be additionally included for better understanding the practices.
It should be noted that this study has also some limitations. As shown in the result, two of the significant factors in adopting GSP have only two measured variables. If we add more measured variables in the two significant factors we may have different results. Therefore, further development of these measures by adding more measured variable should be explored in the future research. In addition, shipping material factor was deleted during the validity test even if it was grounded on previous theoretical proposition. This should be further tested in the future when more data are collected. Moreover, future study can link the drivers of GSP with the approach of Green Supply Chain Management and Eco-innovation. Green supply chain and its linkage with firms’ performance are almost non-existent, except for [39]. Firm’s own strategy in this study showed independent relationship with customer demand in both theory and empirical test. This independence relationship, however, should be further tested with larger samples and in different context in the future as one of reviewer pointed out. In addition, we collected the sample consisting of ship owners, operators and management companies based on our experiences and interviews, which provided us with the confidence that they are all aware of GSP. The degree of understanding the GSP, however, can vary by type of company as per detailed items of GSP, e.g., ship operators and managing people can have lesser understanding of ship design than ship owners as one reviewer commented. Finally, through our theoretical framework built on existing theoretical proposition and is validated on empirical data, alternative theoretical relationships can be built, for instance, organizational integration and their impact on green performance [39] or further detailed environmental governance mechanism (contractual, relational and organizational) and their impact on environmental performance [2]. Future study should address this differentiation among the different companies when larger samples are collected. All these remain as an avenue for further researches.
5. Conclusions
With increasing international trade volume and aggravating global warming and climate change issues, reducing the emissions of greenhouse gases and other air pollutants from international shipping becomes critical concern in international shipping community. Thus, it is important to understand and know the factors that influence the shipping firms to adopt green shipping practices. This study intended to identify the factors that motivate shipping firms to adopt GSP and to examine if adopting GSP can enhance the shipping firms’ environmental and productivity performance.
The major findings are as follows. Shipping firms are motivated to adopt GSP mostly by industrial norms set by institutionalized associations, for instance, ship owners’ association. They are also motivated by customers’ demand for environmental friendliness and their own strategy to make good image. Unlike our expectation, government regulations and international environmental laws were not significant in influencing shipping firms to adopt GSP. Moreover, adoption of green shipping practices can improve the environmental and productivity performance of the shipping firms.
The current study has concentrated only on four drivers in adopting GSP, therefore, it is suggested that future research examine other possible factors that influence the adoption of GSP. Furthermore, we suggest that future research explore more significant variables related to firm’s own environmental strategy construct because this is a new construct. Testing if increasing environmental performance also increases productivity performance would also be an interesting study. Increasing the sample size is another future area of work.
Author Contributions
Both authors equally contributed to the design, analysis and writing of the paper.
Conflicts of Interest
The authors declare no conflict of interest.
Appendix A

Table A1.
Summary Result of the CFA.
| Indicator (Cronbach’s Alpha; Eigen Value) | Principal Component Factor Loading | Measurement Model | ||||
|---|---|---|---|---|---|---|
| Standard Coefficient | R2 (0.30>) | t-Value | ||||
| Green Shipping Practices Measurement Model | ||||||
| Model fit | ||||||
| χ2 (<2) | 0.939 | |||||
| AGFI (>0.80) | 0.833 | |||||
| CFI (>0.90) | 1.000 | |||||
| TLI (>0.90) | 1.019 | |||||
| RMSEA (<0.1) | 0.000 | |||||
| Company policy and procedure (α = 0.75; eigen value = 1.76 ) | ||||||
| CP1 Our senior managers are committed to GSP | 0.741 | 0.709 | 0.503 | |||
| CP2 Our mid-level managers support GSP | 0.858 | 0.817 | 0.667 | 6.313 *** | ||
| CP3 Our company has a cross-functional cooperation for green practices | 0.731 | 0.818 | 0.668 | 6.166 *** | ||
| CP4 Our company has environmental compliance and auditing programs | 0.549 | 0.680 | 0.463 | 5.359 *** | ||
| CP7 Our company offers an End to End EDI solutions. | 0.522 | 0.338 | 0.114 | 2.672 ** | ||
| CP5 Our company has ISO 14001 certification b | ||||||
| CP6 Our company has a strong environmental policy b | ||||||
| Shipping equipment (α = 0.84; eigen value = 5.56) | ||||||
| SE2 In our company there is a cooperation with equipment suppliers about environmental objectives | 0.776 | 0.672 | 0.452 | |||
| SE3 Our company performs an environmental auditing of suppliers’ internal management | 0.820 | 0.706 | 0.498 | 5.377 *** | ||
| SE4 Our suppliers have ISO 14001 certification | 0.755 | 0.712 | 0.507 | 5.276 *** | ||
| SE5 Our company’s refrigerated containers no longer use chlorofluorocarbon (CFC). Instead we are now using more environmentally friendly types of refrigerants | 0.469 | 0.437 | 0.191 | 3.273 ** | ||
| SE6 Our company works with our customers on eco-design in cargo handling and shipments | 0.741 | 0.848 | 0.718 | 5.702 *** | ||
| SE7 Our company involves our customers in cleaner delivery for example we enforce programs for recycling, vehicle idling, packing waste collection and using green packing materials | 0.625 | 0.769 | 0.591 | 5.503 *** | ||
| SE1 Our company reuses shipping equipment b | ||||||
| Shipping Materials a | ||||||
| SM1 Our company sells our excess equipment and facilities a | ||||||
| SM2 Our company sells the used shipping materials such as packaging and cartons and collection of used oil a | ||||||
| Shipping design and compliance (α = 0.71; eigen value = 1.217 ) | ||||||
| SD1 The design of our shipping activities and equipment helps our company reduce consumption of materials and energy | 0.673 | 0.665 | 0.442 | |||
| SD2 The design of our shipping activities is for reuse, recycling and recovery of materials | 0.740 | 0.603 | 0.364 | 3.925 *** | ||
| SD3 The design of our equipment avoid or reduce the use of polluting energy | 0.817 | 0.755 | 0.570 | 4.478 *** | ||
| Reasons for adopting green shipping practices measurement model | ||||||
| χ2 | 1.162 | |||||
| AGFI | 0.835 | |||||
| CFI | 0.983 | |||||
| TLI | 0.972 | |||||
| RMSEA | 0.046 | |||||
| Strong enforcement of environmental regulations (α = 0.84; eigen value = 2.40) | ||||||
| REG1 Mandated by the International Law | 0.710 | 0.573 | 0.328 | |||
| REG2 Our service products are sold to countries with specific environmental laws | 0.863 | 0.835 | 0.698 | 4.961 *** | ||
| REG3 Environmental regulations governing our service product are very strict | 0.880 | 0.892 | 0.795 | 5.096 *** | ||
| REG4 Our shipping services are controlled by regulations that limit the emission of air pollutants | 0.745 | 0.727 | 0.529 | 4.513 *** | ||
| REG5 We comply with regulations that limit the disposal waste b | ||||||
| REG6 Our products comply with environmental regulations of many countries b | ||||||
| Industrial Norms (α = 0.60; eigen value = 0.851) | ||||||
| NRM2 Our operation is based on shipping and environmental code of practice | 0.657 | 0.837 | 0.701 | |||
| NRM4 Because we like to increase the corporate social responsibility of the company | 0.885 | 0.525 | 0.275 | 3.080 ** | ||
| NRM1 We are recommended to practice GSP by industrial association b | ||||||
| NRM3 Because other shipping companies are adopting it a | ||||||
| Strong customer demand (α = 0.84; eigen value = 1.58 ) | ||||||
| CST1 Our customers require us to have ISO 14001 certification | 0.933 | 0.643 | 0.413 | |||
| CST2 Our customer carry out environmental audits of our firm | 0.832 | 1.152 | 1.327 | 3.199 ** | ||
| Firm’s own environmental strategy (α = 0.91; eigen value = 4.59 ) | ||||||
| FRM1 We like to gain a loyalty from the customers | 0.850 | 0.889 | 0.791 | |||
| FRM2 We like to attract potential customers | 0.937 | 0.962 | 0.925 | 13.329 *** | ||
| FRM3 We like to gain competitive advantage over competitors | 0.937 | 0.888 | 0.789 | 11.099 *** | ||
| FRM5 We like to improve firm’s own image | 0.720 | 0.687 | 0.472 | 7.009 *** | ||
| FRM4 We like to strengthen international trade partnerships b | ||||||
| Result in adopting green shipping practices measurement model | ||||||
| χ2 | 2.171 | |||||
| AGFI | 0.770 | |||||
| CFI | 0.917 | |||||
| TLI | 0.866 | |||||
| RMSEA | 0.125 | |||||
| Environmental performance (α = 0.90; eigen value = 5.75 ) | ||||||
| ENP1We reduced our carbon emission | 0.781 | 0.651 | 0.424 | |||
| ENP2 We reduced our waste water | 0.881 | 0.886 | 0.785 | 6.345 *** | ||
| ENP3 We reduced our solid waste | 0.888 | 0.955 | 0.911 | 6.449 *** | ||
| ENP4 We reduced consumption of hazardous materials | 0.810 | 0.848 | 0.719 | 6.091 *** | ||
| ENP5 We reduced frequency of environmental accidents b | ||||||
| Productivity performance (α = 0.88; eigen value = 1.42) | ||||||
| PRP1 We significantly improved our product quality | 0.673 | 0.797 | 0.635 | |||
| PRP2 We improved our position in marketplace | 0.818 | 0.906 | 0.821 | 8.458 *** | ||
| PRP3 We reduced our waste operation | 0.677 | 0.789 | 0.622 | 7.229 *** | ||
| PRP4 We significantly reduced overall costs | 0.839 | 0.602 | 0.363 | 5.190 *** | ||
| PRP5 It helped enhance the reputation of our company | 0.732 | 0.724 | 0.524 | 6.412 *** | ||
| PRP6 It improved our operation in international market | 0.671 | 0.737 | 0.543 | 6.636 *** | ||
| Green shipping practices measurement model (second order CFA) | ||||||
| CP Company policy and procedure | 0.820 | 0.673 | ||||
| SE Shipping equipment | 0.754 | 0.568 | ||||
| SD Shipping design and compliance | 0.819 | 0.671 | ||||
a deleted item from inter-item correlation; b deleted item from exploratory factor analysis; *** p < 0.001; ** p < 0.01.
References
- Lam, J.S.L.; Lai, K. Developing Environmental Sustainability by ANP-QFD Approach: The Case of Shipping Operations. J. Clean. Prod. 2015, 105, 275–284. [Google Scholar] [CrossRef]
- Venus Lun, Y.H.; Lai, K.; Wong, C.W.Y.; Cheng, T.C.E. Environmental Governance Mechanisms in Shipping Firms and their Environmental Performance. Transp. Res. Part E 2015, 78, 82–92. [Google Scholar] [CrossRef]
- Cheng, T.C.E.; Lai, K.; Venus Lun, Y.H.; Wong, C.W.Y. Green Shipping Management. Transp. Res. Part E 2013, 55, 1–2. [Google Scholar] [CrossRef]
- Lai, K.; Lun, V.Y.H.; Wong, C.W.Y.; Cheng, T.C.E. Green Shipping Practices in the Shipping Industry: Conceptualization, Adoption, and Implications. Resour. Conserv. Recycl. 2011, 55, 631–638. [Google Scholar] [CrossRef]
- Kim, H.; Chang, Y.; Kim, K.; Kim, H. An Epsilon-Optimal Algorithm Considering Greenhouse Gas Emissions for the Management of a Ship’s Bunker Fuel. Transp. Res. Part D 2012, 17, 97–103. [Google Scholar] [CrossRef]
- Corbett, J.J.; Wang, H.; Winebrake, J.J. The Effectiveness and Costs of Speed Reductions on Emissions from International Shipping. Transp. Res. Part D 2009, 14, 593–598. [Google Scholar] [CrossRef]
- Cariou, P. Is Slow Steaming a Sustainable Means of Reducing CO2 Emissions from Container Shipping? Transp. Res. Part D 2011, 16, 260–264. [Google Scholar] [CrossRef]
- Psaraftis, H.N.; Kontovas, C.A. Balancing the Economic and Environmental Performance of Maritime Transportation. Transp. Res. Part D 2010, 15, 458–462. [Google Scholar] [CrossRef]
- Lindstad, H.; Sandaas, I.; Strømman, A.H. Assessment of Cost as a Function of Abatement Options in Maritime Emission Control Areas. Transp. Res. Part D 2015, 38, 41–48. [Google Scholar] [CrossRef]
- Mansouri, S.A.; Lee, H.; Aluko, O. Multi-Objective Decision Support to Enhance Environmental Sustainability in Maritime Shipping: A Review and Future Directions. Transp. Res. Part E 2015, 78, 3–18. [Google Scholar] [CrossRef]
- Mander, S. Slow Steaming and a New Dawn for Wind Propulsion: A Multi-Level Analysis of Two Low Carbon Shipping Transitions. Mar. Policy 2017, 75, 210–216. [Google Scholar] [CrossRef]
- Ren, J.; Lützen, M. Selection of Sustainable Alternative Energy Source for Shipping: Multi-Criteria Decision Making Under Incomplete Information. Renew. Sustain. Energy Rev. 2017, 74, 1003–1019. [Google Scholar] [CrossRef]
- Lister, J.; Poulsen, R.T.; Ponte, S. Orchestrating Transnational Environmental Governance in Maritime Shipping. Glob. Environ. Chang. 2015, 34, 185–195. [Google Scholar] [CrossRef]
- Van Leeuwen, J. The Regionalization of Maritime Governance: Towards a Polycentric Governance System for Sustainable Shipping in the European Union. Ocean Coast. Manag. 2015, 117, 23–31. [Google Scholar] [CrossRef]
- Sihn, W.; Pascher, H.; Ott, K.; Stein, S.; Schumacher, A.; Mascolo, G. A Green and Economic Future of Inland Waterway Shipping. Procedia CIRP 2015, 29, 317–322. [Google Scholar] [CrossRef]
- Boscarato, I.; Hickey, N.; Kašpar, J.; Prati, M.V.; Mariani, A. Green Shipping: Marine Engine Pollution Abatement using a Combined Catalyst/Seawater Scrubber System. 1. Effect of Catalyst. J. Catal. 2015, 328, 248–257. [Google Scholar] [CrossRef]
- Bell, M.G.H.; Meng, Q. Special Issue in Transportation Research Part B—Shipping, Port and Maritime Logistics. Transp. Res. Part B 2016, 93, 697–699. [Google Scholar] [CrossRef]
- Schøyen, H.; Bråthen, S. Measuring and Improving Operational Energy Efficiency in Short Sea Container Shipping. Res. Transp. Bus. Manag. 2015, 17, 26–35. [Google Scholar] [CrossRef]
- Howell, K.E.; Bhattacharya, S. Functional and Territorial Jurisdictions: Regulating a Globalized Shipping Industry. J. Transp. Geogr. 2016, 55, 92–100. [Google Scholar] [CrossRef]
- Melnyk, S.A.; Sroufe, R.P.; Calantone, R. Assessing the Impact of Environmental Management Systems on Corporate and Environmental Performance. J. Oper. Manag. 2003, 21, 329–351. [Google Scholar] [CrossRef]
- Krozer, J.; Mass, K.; Kothuis, B. Demonstration of Environmentally Sound and Cost-Effective Shipping. J. Clean. Prod. 2003, 11, 767–777. [Google Scholar] [CrossRef]
- Nakata, T.; Lamont, A. Analysis of the Impacts of Carbon Taxes on Energy Systems in Japan. Energy Policy 2001, 29, 159–166. [Google Scholar] [CrossRef]
- Flynn, B.B.; Schroeder, R.G.; Sakakibara, S. The Impact of Quality Management Practices on Performance and Competitive Advantage. Decis. Sci. 1995, 26, 659–691. [Google Scholar] [CrossRef]
- Zhu, Q.; Sarkis, J. Relationships between Operational Practices and Performance among Early Adopters of Green Supply Chain Management Practices in Chinese Manufacturing Enterprises. J. Oper. Manag. 2004, 22, 265–289. [Google Scholar] [CrossRef]
- Bansal, P.; Roth, K. Why Companies Go Green: A Model of Ecological Responsiveness. Acad. Manag. J. 2000, 43, 717–736. [Google Scholar] [CrossRef]
- Björklund, M. Influence from the Business Environment on Environmental purchasing—Drivers and Hinders of Purchasing Green Transportation Services. J. Purch. Supply Manag. 2011, 17, 11–22. [Google Scholar] [CrossRef]
- Walton, S.V.; Handfield, R.B.; Melnyk, S.A. The Green Supply Chain: Integrating Suppliers into Environmental Management Processes. J. Supply Chain Manag. 1998, 34, 2–11. [Google Scholar] [CrossRef]
- Fryxell, G.E.; Szeto, A. The Influence of Motivations for Seeking ISO 14001 Certification: An Empirical Study of ISO 14001 Certified Facilities in Hong Kong. J. Environ. Manag. 2002, 65, 223–238. [Google Scholar] [CrossRef]
- Suchman, M.C. Managing Legitimacy: Strategic and Institutional Approaches. Acad. Manag. Rev. 1995, 20, 571–610. [Google Scholar]
- Carter, C.R.; Carter, J.R. Interorganizational Determinants of Environmental Purchasing: Initial Evidence from the Consumer Products Industries. Decis. Sci. 1998, 29, 659–684. [Google Scholar] [CrossRef]
- Zhang, B.; Bi, J.; Fan, Z.; Yuan, Z.; Ge, J. Eco-Efficiency Analysis of Industrial System in China: A Data Envelopment Analysis Approach. Ecol. Econ. 2008, 68, 306–316. [Google Scholar] [CrossRef]
- Berry, M.A.; Rondinelli, D.A. Proactive Corporate Environmental Management: A New Industrial Revolution. Acad. Manag. Executive 1998, 12, 38–50. [Google Scholar] [CrossRef]
- Quazi, H.A.; Khoo, Y.; Tan, C.; Wong, P. Motivation for ISO 14000 Certification: Development of a Predictive Model. Omega 2001, 29, 525–542. [Google Scholar] [CrossRef]
- Chavan, M. An Appraisal of Environment Management Systems: A Competitive Advantage for Small Businesses. Manag. Environ. Qual. Int. J. 2005, 16, 444–463. [Google Scholar] [CrossRef]
- Montabon, F.; Sroufe, R.; Narasimhan, R. An Examination of Corporate Reporting, Environmental Management Practices and Firm Performance. J. Oper. Manag. 2007, 25, 998–1014. [Google Scholar] [CrossRef]
- Yuen, K.F.; Lim, J.M. Barriers to the Implementation of Strategic Corporate Social Responsibility in Shipping. Asian J. Shipp. Logist. 2016, 32, 49–57. [Google Scholar] [CrossRef]
- Rao, P.; Holt, D. Do Green Supply Chains Lead to Competitiveness and Economic Performance? Int. J. Oper. Prod. Manag. 2005, 25, 898–916. [Google Scholar] [CrossRef]
- Klassen, R.D.; McLaughlin, C.P. The Impact of Environmental Management on Firm Performance. Manag. Sci. 1996, 42, 1199–1214. [Google Scholar] [CrossRef]
- Yang, C.; Lu, C.; Haider, J.J.; Marlow, P.B. The Effect of Green Supply Chain Management on Green Performance and Firm Competitiveness in the Context of Container Shipping in Taiwan. Transp. Res. Part E 2013, 55, 55–73. [Google Scholar] [CrossRef]
- Lai, K.; Wong, C.W.Y. Green Logistics Management and Performance: Some Empirical Evidence from Chinese Manufacturing Exporters. Omega 2012, 40, 267–282. [Google Scholar] [CrossRef]
- Russo, M.V.; Fouts, P.A. A Resource-Based Perspective on Corporate Environmental Performance and Profitability. Acad. Manag. J. 1997, 40, 534–559. [Google Scholar] [CrossRef]
- Claver, E.; Lopez, M.D.; Molina, J.F.; Tarí, J.J. Environmental Management and Firm Performance: A Case Study. J. Environ. Manag. 2007, 84, 606–619. [Google Scholar] [CrossRef] [PubMed]
- De Burgos Jimenez, J.; Céspedes Lorente, J.J. Environmental Performance as an Operations Objective. Int. J. Oper. Prod. Manag. 2001, 21, 1553–1572. [Google Scholar] [CrossRef]
- Guimaraes, T.; Liska, K. Exploring the Business Benefits of Environmental Stewardship. Bus. Strategy Environ. 1995, 4, 9–22. [Google Scholar] [CrossRef]
- Shrivastava, P. Environmental Technologies and Competitive Advantage. Strateg. Manag. J. 1995, 16, 183–200. [Google Scholar] [CrossRef]
- Geffen, C.A.; Rothenberg, S. Suppliers and Environmental Innovation: The Automotive Paint Process. Int. J. Oper. Prod. Manag. 2000, 20, 166–186. [Google Scholar] [CrossRef]
- Chen, I.J.; Paulraj, A. Towards a Theory of Supply Chain Management: The Constructs and Measurements. J. Oper. Manag. 2004, 22, 119–150. [Google Scholar] [CrossRef]
- Flynn, B.B.; Schroeder, R.G.; Sakakibara, S. A Framework for Quality Management Research and an Associated Measurement Instrument. J. Oper. Manag. 1994, 11, 339–366. [Google Scholar] [CrossRef]
- Nunnally, J.C. Psychometric Theory; McGraw Hill: New York, NY, USA, 1967. [Google Scholar]
- Hair, J.F.; Black, W.C.; Babin, B.J.; Anderson, R.E.; Tatham, R.L. Multivariate Data Analysis 6th Edition. Pearson Prentice Hall.New Jersey.humans: Critique and reformulation. J. Abnorm. Psychol. 2006, 87, 49–74. [Google Scholar]
- Garver, M.S.; Mentzer, J.T. Logistics Research Methods: Employing Structural Equation Modeling to Test for Construct Validity. J. Bus. Logist. 1999, 20, 33–57. [Google Scholar]
- Churchill, G.A.; Iacobucci, D. Marketing Research: Methodological Foundations; Dryden Press: New York, NY, USA, 2006. [Google Scholar]
- Jöreskog, K.G. A General Approach to Confirmatory Maximum Likelihood Factor Analysis. ETS Res. Rep. Ser. 1967, 1967, 183–202. [Google Scholar] [CrossRef]
- Campbell, D.T.; Fiske, D.W. Convergent and Discriminant Validation by the Multitrait-Multimethod Matrix. Psychol. Bull. 1959, 56, 81. [Google Scholar] [CrossRef] [PubMed]
- Yang, C.; Marlow, P.B.; Lu, C. Assessing Resources, Logistics Service Capabilities, Innovation Capabilities and the Performance of Container Shipping Services in Taiwan. Int. J. Prod. Econ. 2009, 122, 4–20. [Google Scholar] [CrossRef]
- Carr, A.S.; Pearson, J.N. Strategically Managed Buyer—Supplier Relationships and Performance Outcomes. J. Oper. Manag. 1999, 17, 497–519. [Google Scholar] [CrossRef]
- Dunn, S.C.; Seaker, R.F.; Waller, M.A. Latent Variables in Business Logistics Research: Scale Development and Validation. J. Bus. Logist. 1994, 15, 145. [Google Scholar]
- Nahm, A.Y.; Vonderembse, M.A.; Koufteros, X.A. The Impact of Organizational Structure on Time-Based Manufacturing and Plant Performance. J. Oper. Manag. 2003, 21, 281–306. [Google Scholar] [CrossRef]
- Shah, R.; Goldstein, S.M. Use of Structural Equation Modeling in Operations Management Research: Looking Back and Forward. J. Oper. Manag. 2006, 24, 148–169. [Google Scholar] [CrossRef]
- Marsh, H.W. Pairwise Deletion for Missing Data in Structural Equation Models: Nonpositive Definite Matrices, Parameter Estimates, Goodness of Fit, and Adjusted Sample Sizes. Struct. Equ. Model. Multidiscip. J. 1998, 5, 22–36. [Google Scholar] [CrossRef]
- Bollen, K. Structural Equations with Latent Variables; JohnWiley & Sons: New York, NY, USA, 1989; Volume 29. [Google Scholar]
- Li, Y.; Liu, Y.; Liu, H. Co-Opetition, Distributor’s Entrepreneurial Orientation and Manufacturer’s Knowledge Acquisition: Evidence from China. J. Oper. Manag. 2011, 29, 128–142. [Google Scholar] [CrossRef]
- Dröge, C.; Claycomb, C.; Germain, R. Does Knowledge Mediate the Effect of Context on Performance? Some Initial Evidence. Decis. Sci. 2003, 34, 541–568. [Google Scholar] [CrossRef]
- Zhang, B.; Bi, J.; Yuan, Z.; Ge, J.; Liu, B.; Bu, M. Why do Firms Engage in Environmental Management? An Empirical Study in China. J. Clean. Prod. 2008, 16, 1036–1045. [Google Scholar] [CrossRef]
- Porter, M.E.; Van der Linde, C. Green and Competitive: Ending the Stalemate. Harv. Bus. Rev. 1995, 73, 120–134. [Google Scholar]
- Lun, Y.H.V.; Lai, K.; Wong, C.W.Y.; Cheng, T.C.E. Greening and Performance Relativity: An Application in the Shipping Industry. Comput. Oper. Res. 2015, 54, 295–301. [Google Scholar] [CrossRef]
- Poulsen, R.T.; Ponte, S.; Lister, J. Buyer-Driven Greening? Cargo-Owners and Environmental Upgrading in Maritime Shipping. Geoforum 2016, 68, 57–68. [Google Scholar] [CrossRef]
- Poulsen, R.T.; Johnson, H. The Logic of Business vs. the Logic of Energy Management Practice: Understanding the Choices and Effects of Energy Consumption Monitoring Systems in Shipping Companies. J. Clean. Prod. 2016, 112 Pt 5, 3785–3797. [Google Scholar] [CrossRef]
- Kitada, M.; Ölçer, A. Managing People and Technology: The Challenges in CSR and Energy Efficient Shipping. Res. Transp. Bus. Manag. 2015, 17, 36–40. [Google Scholar] [CrossRef]
Figure 1.
Theoretical foundation.

Figure 2.
Scope of green shipping practices.
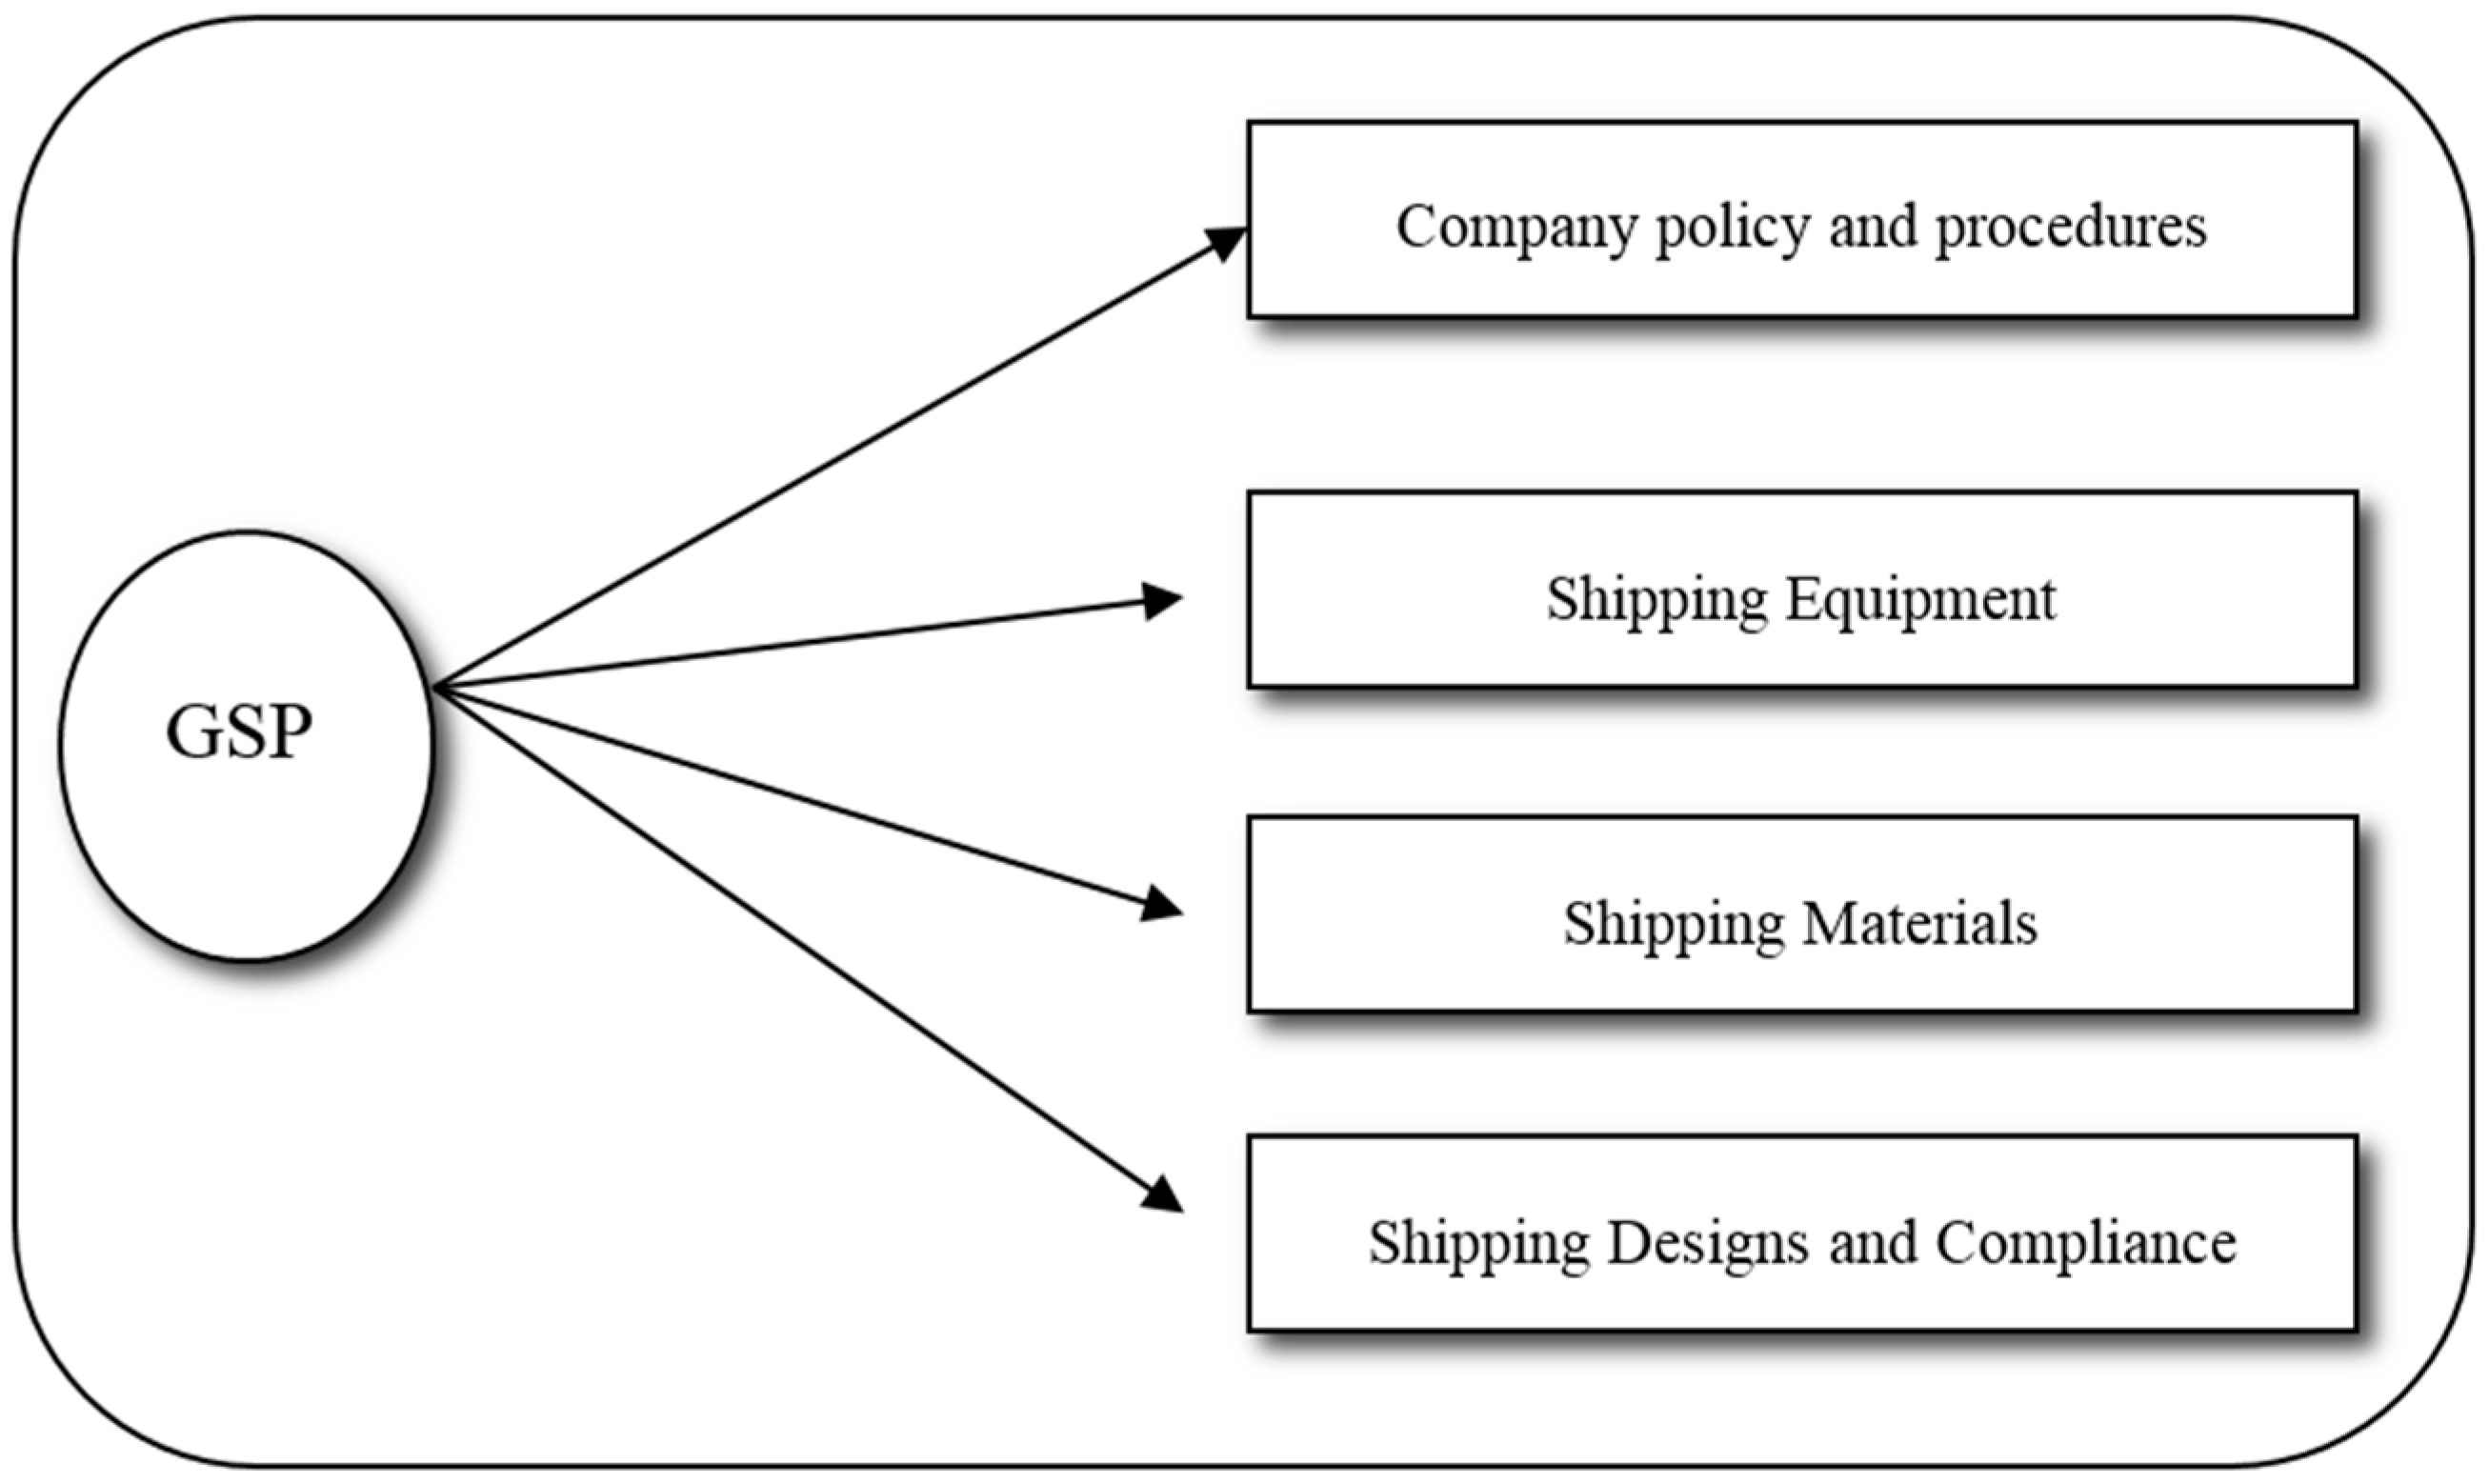
Figure 3.
Drivers influencing the adoption of GSP.
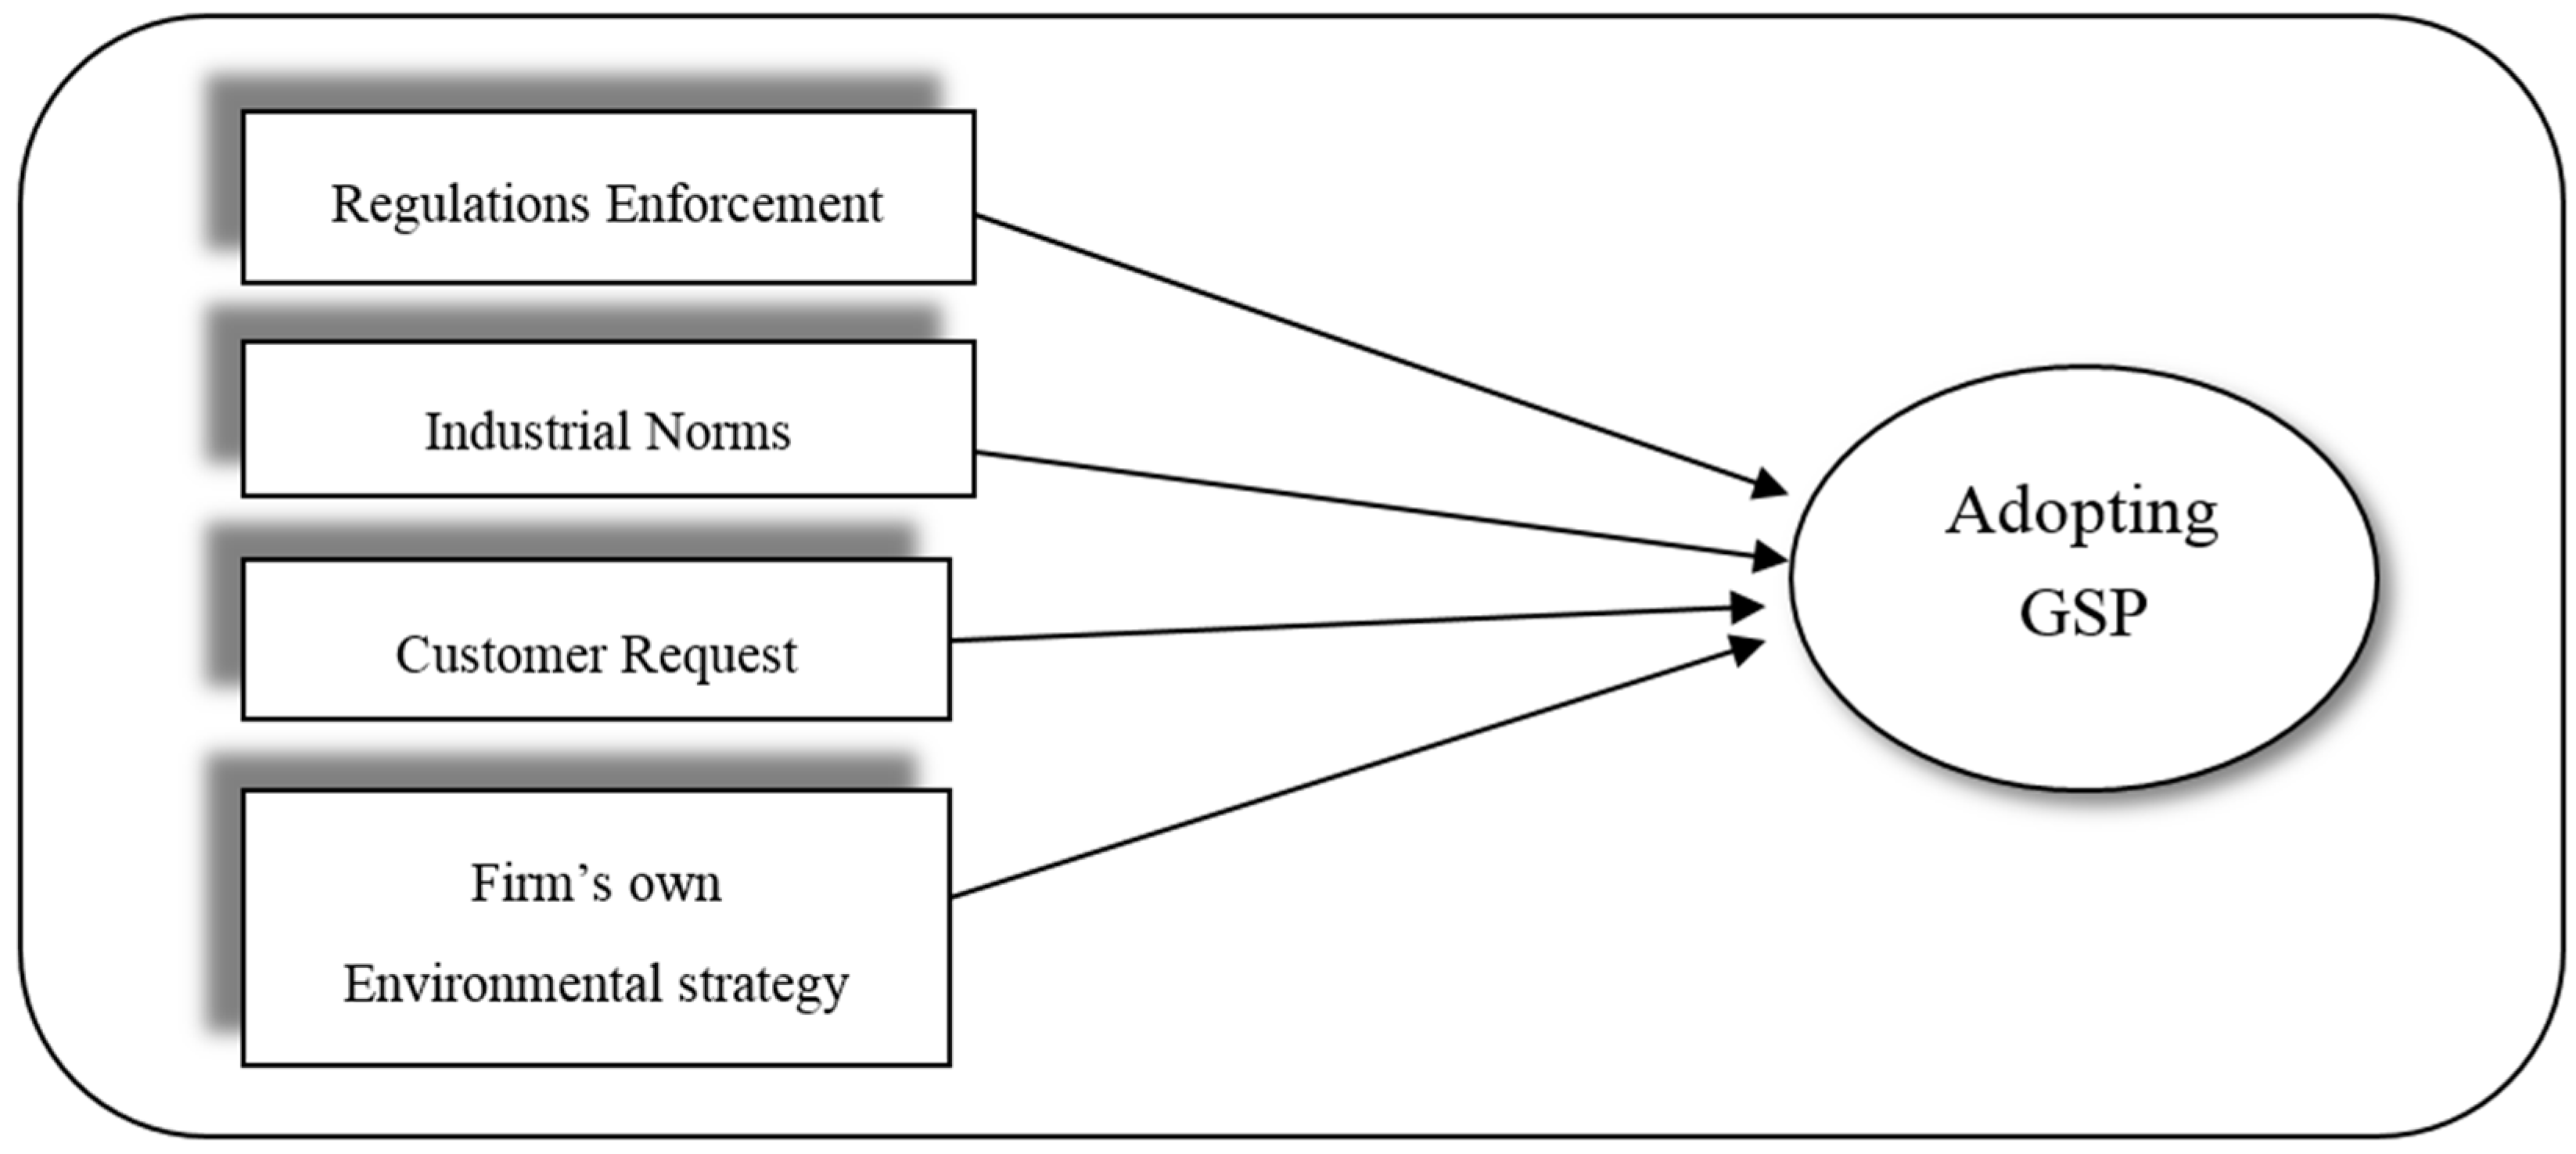
Figure 4.
Theoretical framework.

Figure 5.
Flow of instrument development.
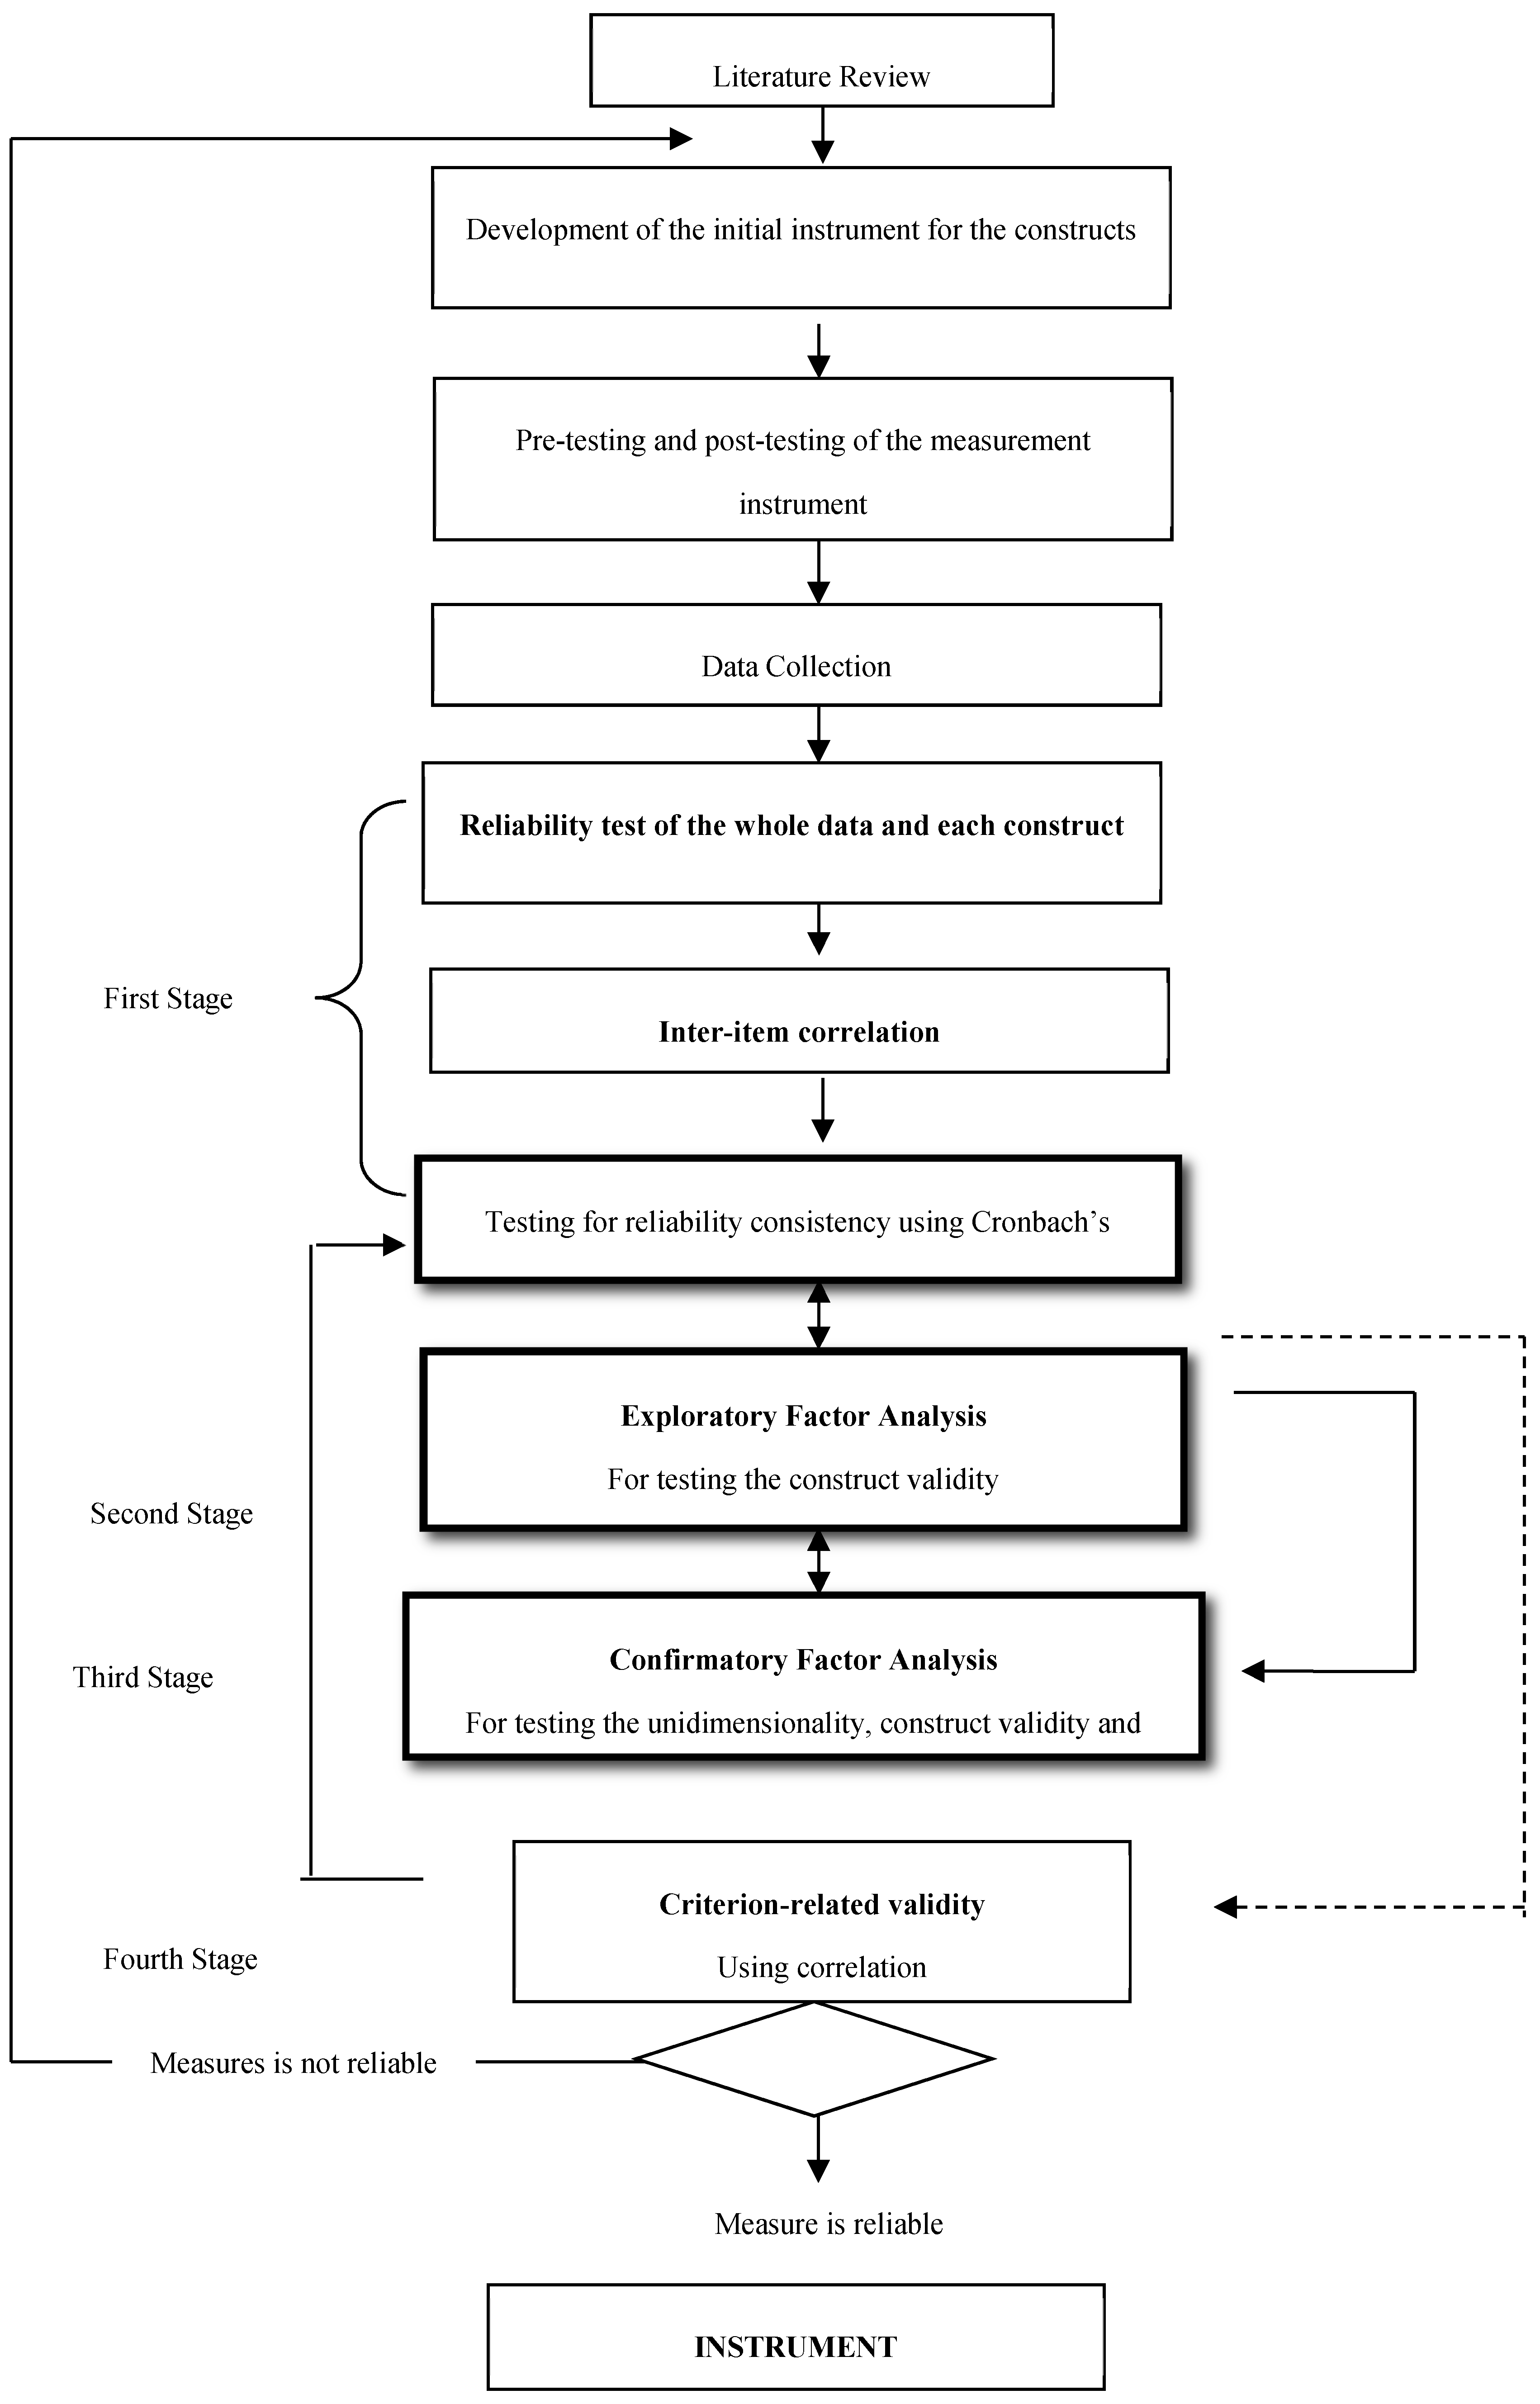
Figure 6.
The result of structural equation model.

Table 1.
Result of discriminant validity.
| Description | Correlation | Chi-Square Statistic | Difference | ||
|---|---|---|---|---|---|
| Constrained Model | Unconstrained Model | Constrained Model (d.f.) | Unconstrained Model (d.f.) | ||
| CP with | |||||
| SE | 0.884 | 0.620 | 90.59 (44) | 46.17 (43) | 44.42 * |
| SD | 0.905 | 0.667 | 53.27 (20) | 12.64 (19) | 40.63 * |
| REG | 0.792 | 0.442 | 53.28 (27) | 25.70 (26) | 27.58 * |
| NRM | 0.942 | 0.765 | 51.03 (14) | 10.89 (13) | 40.14 * |
| CST | 0.765 | 0.428 | 50.94 (14) | 25.59 (13) | 25.35 * |
| FRM | 0.786 | 0.317 | 81.95 (27) | 36.26 (26) | 45.69 * |
| SE with | |||||
| SD | 0.880 | 0.606 | 76.14 (27) | 33.28 (26) | 42.86 * |
| REG | 0.828 | 0.592 | 67.46 (35) | 41.39 (34) | 26.07 * |
| NRM | 0.897 | 0.622 | 58.58 (20) | 23.64 (19) | 34.94 * |
| CST | 0.800 | 0.681 | 41.66 (20) | 35.44 (19) | 6.22 ** |
| FRM | 0.794 | 0.507 | 83.55 (35) | 59.48 (34) | 24.07 * |
| SD with | |||||
| REG | 0.798 | 0.365 | 48.10 (14) | 10.16 (13) | 37.94 * |
| NRM | 0.980 | 0.898 | 45.64 (5) | 8.26 (4) | 37.38 * |
| CST | 0.714 | 0.205 | 35.21 (5) | 1.56 (4) | 33.65 * |
| FRM | 0.805 | 0.352 | 59.77 (14) | 18.38 (13) | 41.39 * |
| REG with | |||||
| NRM | 0.840 | 0.592 | 29.99 (9) | 3.56 (8) | 26.41 * |
| CST | 0.701 | 0.333 | 22.20 (9) | 3.70 (8) | 18.50 * |
| FRM | 0.687 | 0.202 | 50.15 (20) | 17.46 (19) | 32.69 * |
| NRM with | |||||
| CST | 0.628 | 0.120 | 29.40 (2) | 0.10 (1) | 29.30 |
| FRM | 1.128 a | 0.693 a | 369.3 (9) a | 22.90 (8) a | 346.399 a |
| CST with | |||||
| FRM | 0.725 | 0.407 | 29.20 (9) | 9.10 (8) | 20.10 * |
| ENP with | |||||
| PRP | 0.885 | 0.678 | 113.30 (35) | 73.80 (34) | 39.50 * |
a Result from using Generalized Least Squares; * Chi-square difference are significant at the 0.005 level; ** Chi-square difference are significant at the 0.025 level.
Table 2.
Evaluation of criterion-related validity.
| Factors | Environmental Performance Measure |
| (REG) Regulations | 0.403 ** |
| (NRM) Industrial Norms | 0.738 ** |
| (CST) Customer’s environmental demand | 0.346 * |
| (FRM) Firm’s own environmental strategy | 0.526 *** |
| (CP) Company Policy and Procedure | 0.496 *** |
| (SE) Shipping Equipment | 0.628 *** |
| (SD) Shipping Design and compliance | 0.649 *** |
| Factors | Productivity Performance Measure |
| (REG) Regulations | 0.399 ** |
| (NRM) Industrial Norms | 0.653 * |
| (CST) Customer’s environmental demand | 0.547 *** |
| (FRM) Firm’s own environmental strategy | 0.504 *** |
| (CP) Company Policy and Procedure | 0.332 * |
| (SE) Shipping Equipment | 0.645 *** |
| (SD) Shipping Design and compliance | 0.500 ** |
*** p < 0.001; ** p < 0.01; * p < 0.05.
Table 3.
Test results of the structural equation model.
| Hypothesis | Path from | To | Regression Weight | Standard Error | t-Value | p-Value | |
|---|---|---|---|---|---|---|---|
| 1 | REG | AGSP | 0.17 | 0.042 | 1.422 | 0.155 | Not Supported |
| 2 | NRM | AGSP | 0.84 | 0.143 | 3.575 | *** | Supported |
| 3 | CST | AGSP | 0.34 | 0.042 | 2.787 | 0.005 ** | Supported |
| 4 | FRM | AGSP | 0.33 | 0.048 | 2.944 | 0.003 ** | Supported |
| 5 | AGSP | ENP | 0.73 | 0.230 | 5.230 | *** | Supported |
| 6 | AGSP | PRP | 0.73 | 0.280 | 4.841 | *** | Supported |
*** p < 0.001; ** p < 0.01.
Table 4.
Results of Hierarchical Regression analysis.
| Model 1 | Model 2 | Model 3 | Model 4 | Model 5 | Model 6 | |
|---|---|---|---|---|---|---|
| Control | ||||||
| Firm’s size | 0.297 | 0.307 | 0.118 | 0.735 | 0.683 | 0.526 |
| Market Coverage Operation | 0.836 | 0.578 | 0.3 | 0.454 | 0.406 | |
| Independent Variable | ||||||
| Regulation (REG) | 0.000 *** | 0.12 | 0.471 | 0.409 | ||
| Industrial Norms (NRM) | 0.000 *** | 0.000 *** | 0.000 *** | |||
| Customer environmental demand (CST) | 0.001 ** | 0.012 * | ||||
| Firm’s own environmental strategy (FRM) | 0.046 * | |||||
| Regression Results | ||||||
| R2 | 0.016 | 0.016 | 0.224 | 0.47 | 0.547 | 0.574 |
| Adjusted R2 | 0.001 | −0.013 | 0.189 | 0.438 | 0.512 | 0.534 |
| F Value | 1.102 | 0.565 | 6.443 ** | 14.621 *** | 15.690 *** | 14.393 *** |
* p < 0.05; ** p < 0.01; *** p < 0.001.
© 2017 by the authors. Licensee MDPI, Basel, Switzerland. This article is an open access article distributed under the terms and conditions of the Creative Commons Attribution (CC BY) license (http://creativecommons.org/licenses/by/4.0/).
Share and Cite
MDPI and ACS Style
Chang, Y.-T.; Danao, D. Green Shipping Practices of Shipping Firms. Sustainability 2017, 9, 829. https://doi.org/10.3390/su9050829
AMA Style
Chang Y-T, Danao D. Green Shipping Practices of Shipping Firms. Sustainability. 2017; 9(5):829. https://doi.org/10.3390/su9050829
Chicago/Turabian StyleChang, Young-Tae, and Denise Danao. 2017. "Green Shipping Practices of Shipping Firms" Sustainability 9, no. 5: 829. https://doi.org/10.3390/su9050829
Note that from the first issue of 2016, this journal uses article numbers instead of page numbers. See further details here.