
The Effectiveness of Planning Control on Urban Growth: Evidence from Hangzhou, China

1
Department of Urban Planning, Zhejiang University of Technology, Hangzhou 310058, China
2
School of Planning, Design, and Construction & Center of Global Change and Earth Observation, Michigan State University, East Lansing, MI 48824, USA
3
Land resource management center, Chengdu Hi-Tech development zone committee, Chengdu 610041, China
4
Center of Global Change and Earth Observation, Michigan State University, East Lansing, MI 48824, USA
5
College of Resources and Environment, Southwest University, Chongqing 400715, China
6
School of Public Administration, Zhejiang University of Finance and Economics, Hangzhou 310018, China
*
Author to whom correspondence should be addressed.
Sustainability 2017, 9(5), 855; https://doi.org/10.3390/su9050855
Submission received: 6 April 2017
/
Revised: 15 May 2017
/
Accepted: 15 May 2017
/
Published: 19 May 2017
(This article belongs to the Special Issue Sustainable Land Use in China)
Abstract
:Urban sprawl presents a serious challenge for sustainable urban land use. Urban planning attempts to guarantee sustainable urban development and proper use of land resources. However, a large gap usually exists between planning and actual development. This paper aims to analyze the evolutionary characteristics of urban form and the spatiotemporal dynamics of urban planning from 1964 to 2013, using the case of Hangzhou, China. We proposed a framework that included remote sensing, landscape metrics, and control effectiveness indexes. The results indicated that urban planning failed to perform effectively in Hangzhou, reflected by the uncontrolled urban sprawl during all the planning periods. The low effectiveness of planning was resulted from multiple factors, including historical economic events that made expansion unexpected, functional orientation of planning which drove fragmented suburbanization, the ineffective methods for forecasting population and land use, and the influences by the market forces. The findings deepen the understanding of the impacts of urban planning, and provide references for making rational urban management decisions and sustainable urban land management.
1. Introduction
Urban sprawl presents a serious challenge for regional sustainable urban land use. It is associated with a number of negative impacts on the urban land use [1,2,3]. Urban sprawl leads to low land use efficiency, and it copes with the loss of farmland resources. Meanwhile, Urban sprawl results in more public infrastructure such as hospitals and transport infrastructure because of low-density settlements. Despite of the debate on its exact definition, urban sprawl is often considered to be an uncontrolled, scattered suburban development that increases habitat fragmentation and impacts ecological protection [4]. Spatial planning is regarded as a useful tool for achieving urban sustainable development, especially by restricting urban sprawl. However, existing research [4] indicates that urban planning, the most important tool for guiding land development of an urban area, does not effectively control urban sprawl in North America, Europe, or Asia [5]. This issue has also become pressing in China, which has experienced rapid urban development in the past 30 years. To evaluate the gap between planning and actual development, in this paper, we first identify the spatiotemporal patterns of urban land expansion, and then assess the effectiveness of planning by using the landscape metrics and remote sensing, combined with Geographical Information Systems (GIS) [6,7,8].
Urban planning is an important tool of sustainable urban land management, and it is the arrangement of urban land use in the future. In order to prevent land-use conflicts, urban planning encompasses various disciplines which seek to order and regulate urban land use in an efficient and ethical way. One foundation of regional development is the urban land sustainable use which is greatly affected by urban planning. Most relevant studies used remote sensing data for tracing urban land use/cover changes, and analyzed the inconsistency of urban expansion and planning boundaries [9,10]. Generally, the gap was analyzed based on the ratio of the urban land use area within the planning boundary to the outside. For example, Han et al. (2009) calculated three quantitative indicators, namely, boundary containment ratio, boundary sufficiency ratio, and boundary adjacent development ratio, in order to test the effectiveness of urban planning [11]. Hai et al. (2011) put forward a spatial metric for calculating the spatial relationship between developed urban land and non-developed land. The metric was named as PLADJ, which was composed of several patch-based indexes [12]. Gennaio et al. (2009) discussed the effectiveness of urban growth boundary (UGB) through comparing the building zone, built-up area, urban density, and population density inside and outside the UGB. Some researchers also compared the public facilities and land use characteristic within and outside the planning boundary [13]. Others employed spatial overlay or qualitative analysis to identify the differences between planning and actual situation [14,15]. However, few scholars have applied comprehensive spatial indexes to assess the planning control effectiveness. In addition, few studies investigated the influences of spatial structure guidance in urban planning, and the social and economic background on planning implementation.
The reasons for the failure in urban planning and the driving factors of urban land unsustainable development are complex and multi-dimensional. Apart from the geographical factors, urban sprawl is also influenced by factors such as demography, economy, technology, and institution [16,17,18,19,20]. Urban planning plays an important role in controlling the expansion and urban unsustainable development [7,14,19]. For example, it constrains the development of low-density residential buildings [20]. However, many studies show that urban planning fails to play an expected role in regulating urban land use [4,11,14,19,21], especially in rapid growing cities. The primary reason may be a lack of knowledge about future economic development and micro-agent foundation [22,23,24,25,26]. An example is that large industrial areas in the suburbs are often located outside the urban planning area [11]. With reduced commuting cost as a result of modern transportation development, expansion of suburban areas and the development of enclaves have become the dominant mode of urban expansion. Urban spatial form appears to follow the trend of shifting from mono-centric to polycentric pattern [14]. Unconscionable urban management systems and the lack of a legal authority are also important contributors to the failure of planning [27,28,29]. Due to the absence of regulations and the fragmentation of governmental management, a significant amount of speculative development has occurred beyond the planned urban boundaries [30,31].
Sustainable land management is very important for national food security, resources, ecology, environmental, economic and social security. Utilization control of land resources through urban planning for guaranteeing the regional sustainable development is an important field of land management research all over the world [32,33]. While many scholars have examined urban expansion in China [7,18,19,20], few scholars have quantified the role of planning in sustainable urban land management. The traditional control-oriented approach to planning and its implementation is not suitable for China’s rapid urbanization [19]. Rapid increases in urban population and the inadequate information available to the planning process have resulted in unsustainable development patterns [11,15]. Since the reform and opening-up in 1978, urban development in China has been characterized by intensifying sprawl [34], which indicates the lack of effective plan implementation. There is a large gap between spatial planning and actual development of China’s cities [35]. While plenty of studies have focused on the spatial features of urban land expansion [36,37,38,39,40], there is no clear understanding of the contributors to the failure of planning controls in Chinese cities [41,42,43].
Urban land use and urban planning were intertwined by their nature in this research. It aimed to establish a spatial index including planning control indexes and landscape metrics for evaluating the physical outcome of planning implementation, and to discuss the underlying factors that contribute to differences between planning and reality. We used Hangzhou as a case study to demonstrate this system. We first proposed a comprehensive analysis framework from planning ideas, planning control effects, and economic and social background. We then described the spatiotemporal characteristics of Hangzhou’s urban spatial patterns using remote sensing images and landscape metrics. We further evaluated the control effectiveness of four rounds of planning from 1964 to 2013 with control effectiveness indexes (PCEIs) and analyzed the driving forces for each round of planning, based on the comparison for plan-making logic. This study can contribute to a better understanding of urban planning making and implementation from the perspectives of historical feature, planning methods, spatial planning system and support mechanisms. It will help planners and governments formulate more rational plans and corresponding policy towards sustainable urban land management.
2. Materials and Methods
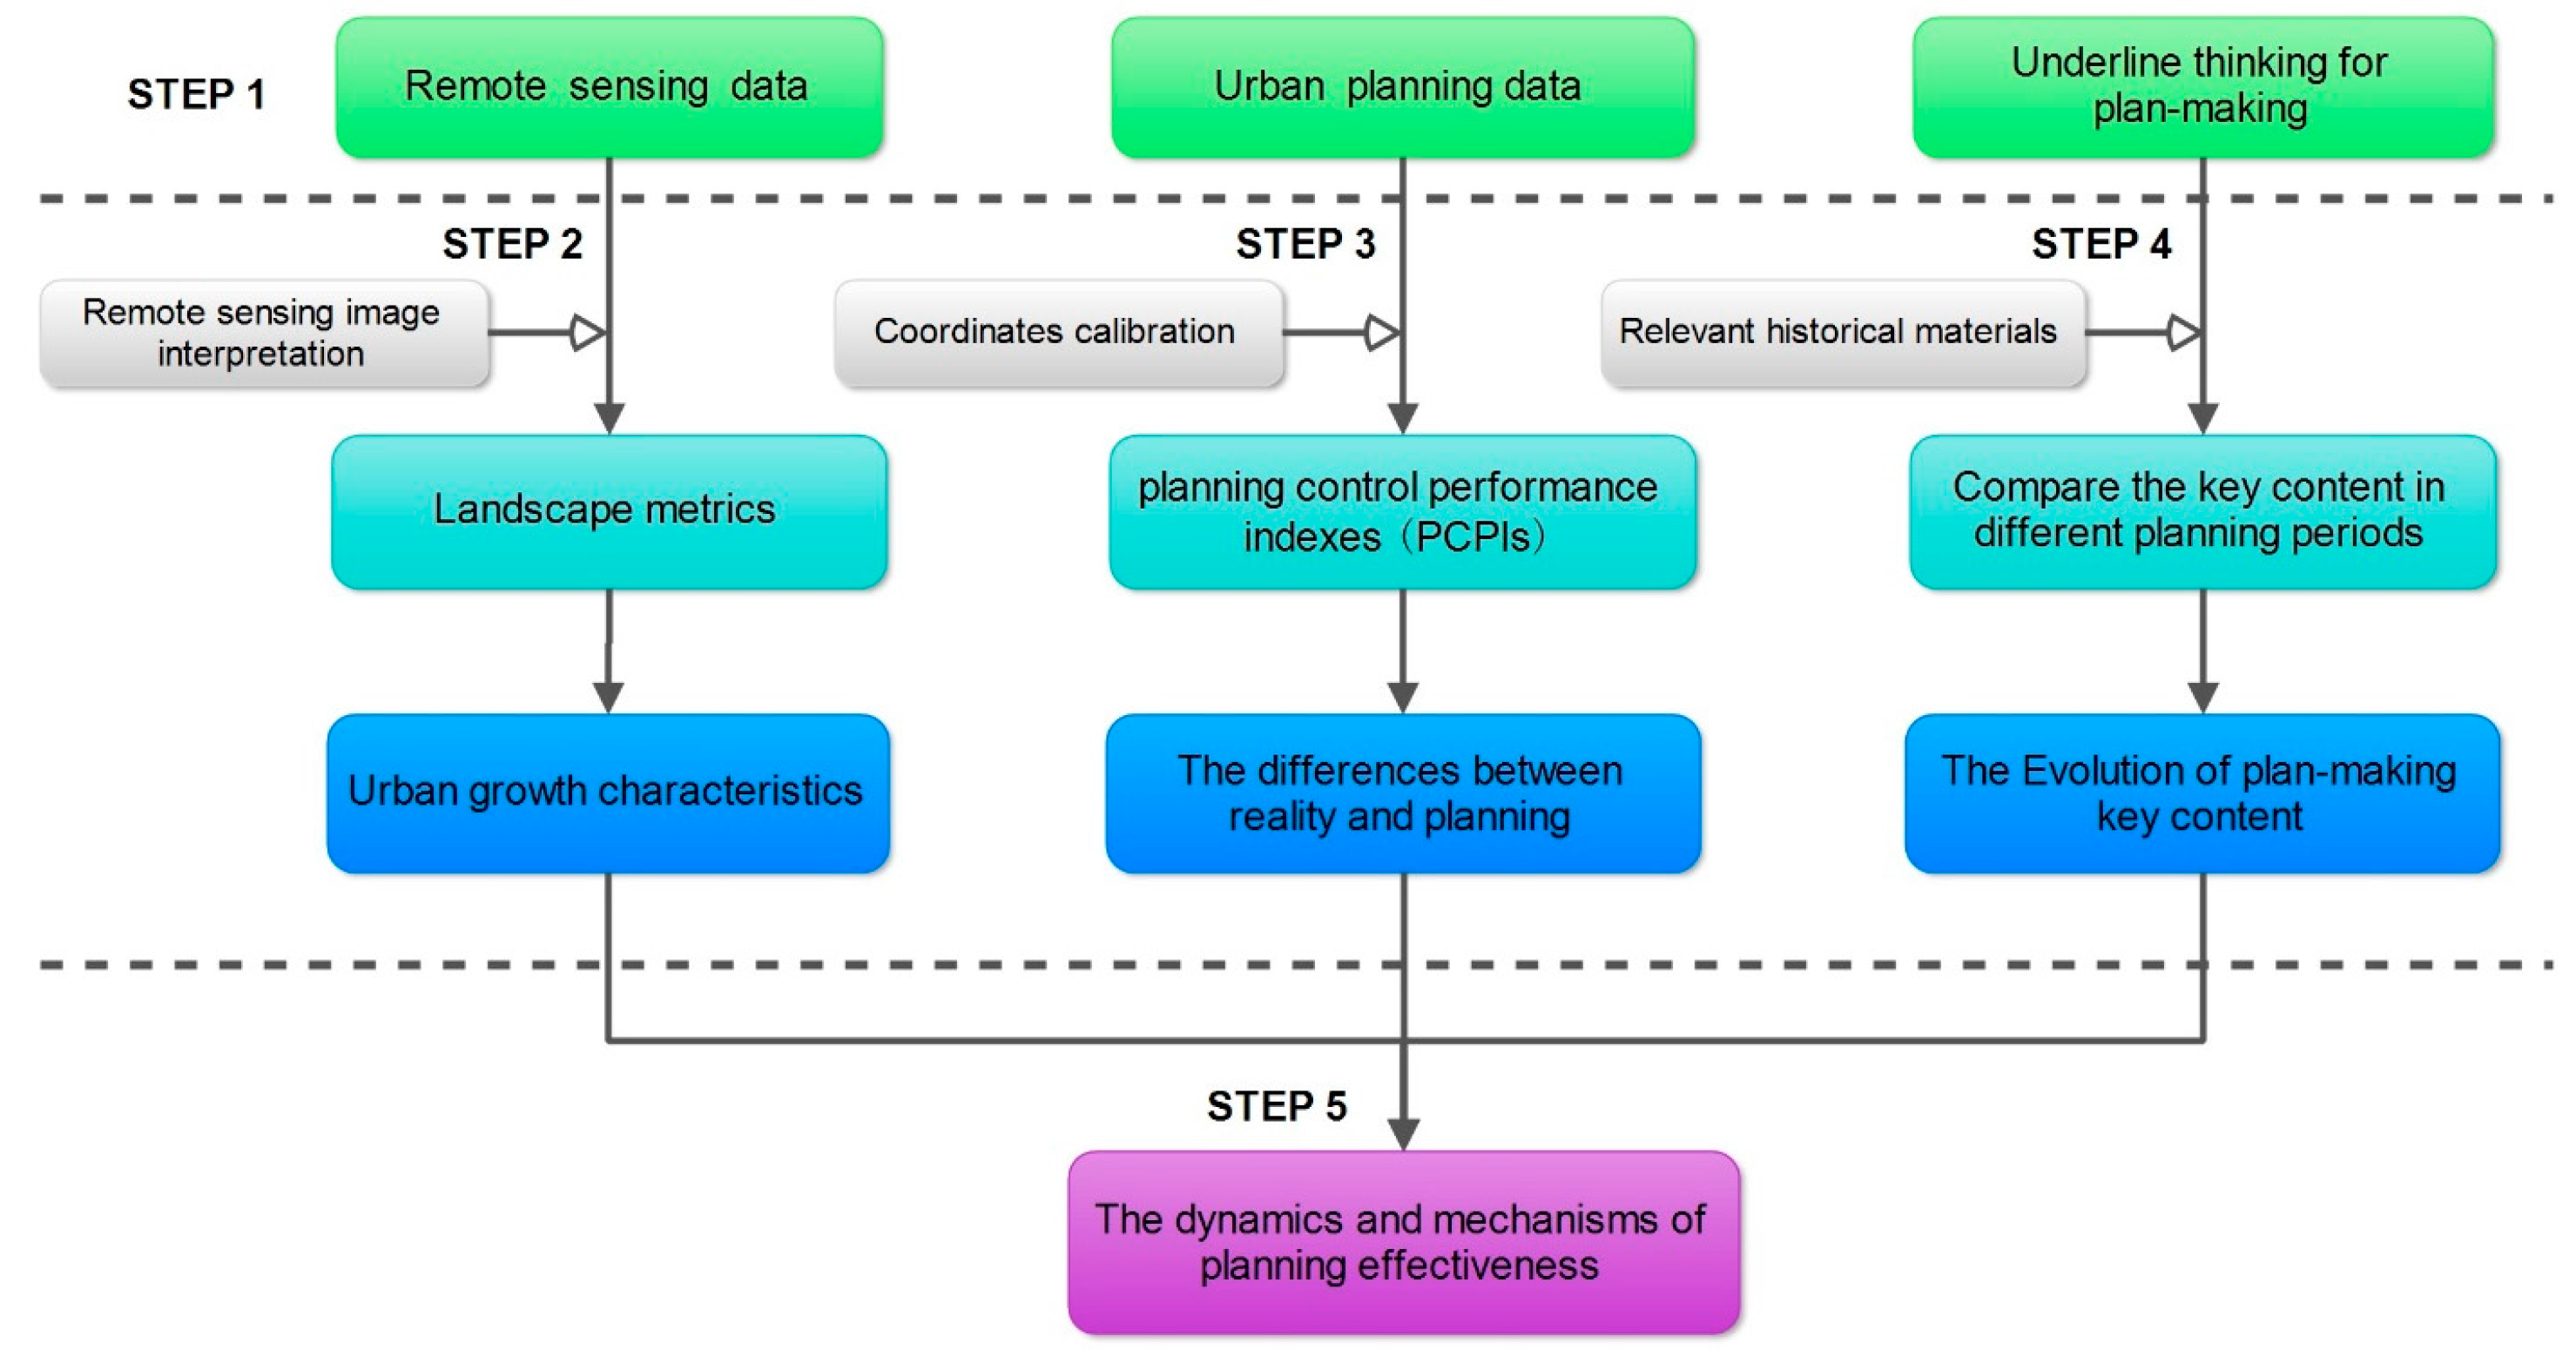
The study involved five major steps as presented in the detailed framework of Figure 1: (1) collect remote sensing data, urban planning data, and relevant historical materials for the study area during each period; (2) identify the spatial distribution of Hangzhou’s urban land in each period using remote sensing images and relevant ground data, and then calculate the spatial indexes reflecting urban growth characteristics in each period; (3) calculate the PCEIs in each period; (4) compare the key content of plan-making logic in each period; and (5) analyze and explain the dynamics and mechanisms of Hangzhou’s master planning process and the effectiveness of regulatory controls.
2.1. Study Area
Hangzhou, the capital of Zhejiang Province, is located at the southern end of the Grand Canal of China and on the plain of the mid-lower reaches of the Yangtze River (Figure 2).
Hangzhou is an ideal example for China’s urban planning process given its representativeness and typicality [44]. Hangzhou has a long history and unique geographical features. However, Hangzhou’s reforms in the context of globalization and marketization were much more in-depth and complete than those in other Chinese cities [45]. Spatially, similar to many other coastal cities, its urban areas reflect a tendency of rapid expansion and population growth. More importantly, Hangzhou completed five planning processes in 1953, 1964, 1983, 1994, and 2004, which provided an opportunity to examine the effectiveness of the urban planning under different development periods. We divided our study into four periods: (1) 1964–1985; (2) 1983–1995; (3) 1994–2005; and (4) 2004–2013, corresponding to the timelines of planning in Hangzhou.
2.2. Interpretation of Urban Land Using Remote Sensing Images
In order to investigate the control effectiveness of urban master planning, remote sensing images were used for extracting the urban land in various periods (Table 1). Five Landsat MSS/TM/ETM+ remotely sensed images from 1985, 1995, 2000, 2005, and 2013 were acquired from the Global Land Cover Facility (GLCF), the Data Sharing Infrastructure of Earth System Science (DSIESS), and the University of Maryland. In addition, topographic and large-scale administrative maps of Hangzhou were obtained from the China National Geometry Center, and supplementary data was taken from annual land surveys from the Hangzhou Bureau of Land and Resources.
We interpreted the remote sensing images using the maximum-likelihood classifier. Land use/land cover was divided into five categories: construction land, farmland, forest, bare land, and water. Construction land was defined to include both urban and rural land. To evaluate the classification accuracy, 100 randomly selected points were identified from topographic maps, high-resolution spatial images, and ground survey data (GPS data). The overall accuracy of the five images was 86.24%, 82.11%, 83.42%, 80.52%, and 81.57%, respectively. Kappa index was 0.821, 0.768, 0.785, 0.747, and 0.761. Post-classification processes removed rural residential land, and urban land was extracted via the village texture spatial analysis.
2.3. Landscape Metrics of Urban Growth
Landscape metrics provided a comprehensive view of the overall landscape structure, including area, density, boundary, shape, core area, isolation/closeness, difference, spread, connection, and diversity [46]. Landscape metrics are applied to analyze the spatial pattern of urban land in different planning periods; these metrics include the type of occupied farming land by urban land and decentralization level of expansion for urban land. Based on the analysis of landscape metrics, the combination of the analysis results between PCEIs and the under thinking of planning making can be conducive to explain in details the factors affecting differences between reality and planning. Nine landscape metrics (Table 2) were utilized based on previous studies [47,48,49]. All of the metrics were calculated using the FRAGSTATS spatial analysis program (Version 4.2) [46]; these metrics were calculated for 1985, 1995, 2000, 2005, and 2013.
2.4. Planning Control Effectiveness Index
In order to analyze the effectiveness of planning controls in different periods, a comprehensive set of planning control effectiveness indexes (PCEIs) was developed. The PCEIs reflected the three aspects of physical outcomes of planning implementation: spatial scale, spatial structure, and spatial pattern (Table 3). The spatial scale indexes depicted the accuracy of urban land use prediction, including spill proportion and spill speed; the spatial structure indexes reflected to what extent the polycentric strategy has been implemented and the impact of transport facilities; and the spatial pattern indexes reflected to what extent the planning guiding urban expansion direction and impact development, as well as the degree of planning boundary breakthroughs. The PCEIs are put forward in this study except OI and BCI, which made references to the calculation of BCR and BADR in Han et al. (2009) [11]. The indexes were calculated in ArcGIS 10.
The overflow index (OI) and annual average overflow area (AAOA) were used to measure the spatial scale of control effectiveness. OI and AAOA reflect the land-use planning restrictions on the scale of urban land expansion. A larger overflow area and greater overflow speed in the actual development reflected a higher degree of planning control ineffectiveness.
The spatial structure of the control effectiveness was measured using the multi-center consistency index (MCI), the traffic guiding index (TGI), and the centrifugal diffusion index (CDI). MCI reflect the guiding effect of planning on the scale and location of future urban primary and secondary centers, while TGI clarifies the influences of planning transport facilities on urban land expansion. Higher MCI, TGI and CDI indexes indicate that the planning control of the urban spatial structure is more effective.
The spatial pattern of the control effectiveness was quantified using the development direction index (DDI), the bouncing development index (BDI), and the boundary consistency index (BCI). DDI reflects the accuracy of predictions for expansion trends in overall urban patterns. BDI clarifies the effects of planning control on the compactness of urban land development. BCI reflects the effectiveness proportion in the implementation of the planning boundary. Lower DDI and BDI indexes reflect higher planning control efficiency. However, lower BCI means higher efficiency.
2.5. Comparison of Context and Objectives for Planning
Urban and Rural Planning Law of the People’s Republic of China (2008) states that “The urban master planning is the comprehensive deployment and implementation of a designated function of the city, development goals, development scale, land use, spatial layout and all constructions.” This study collected four master planning documents for Hangzhou from 1964 to 2004, and selected political and institutional backgrounds, the orientation of urban functions, urban population, urban land scale, and urban spatial structure as the primary indicators of the context and objectives of planning in each period. Combined with these indicators, plan-making logic, the effectiveness of planning controls, and urban spatial growth characteristics were analyzed to identify major reasons for the failure of planning in different periods (Figure 3).
3. Results
3.1. Spatiotemporal Characteristics of Urban Land Expansion
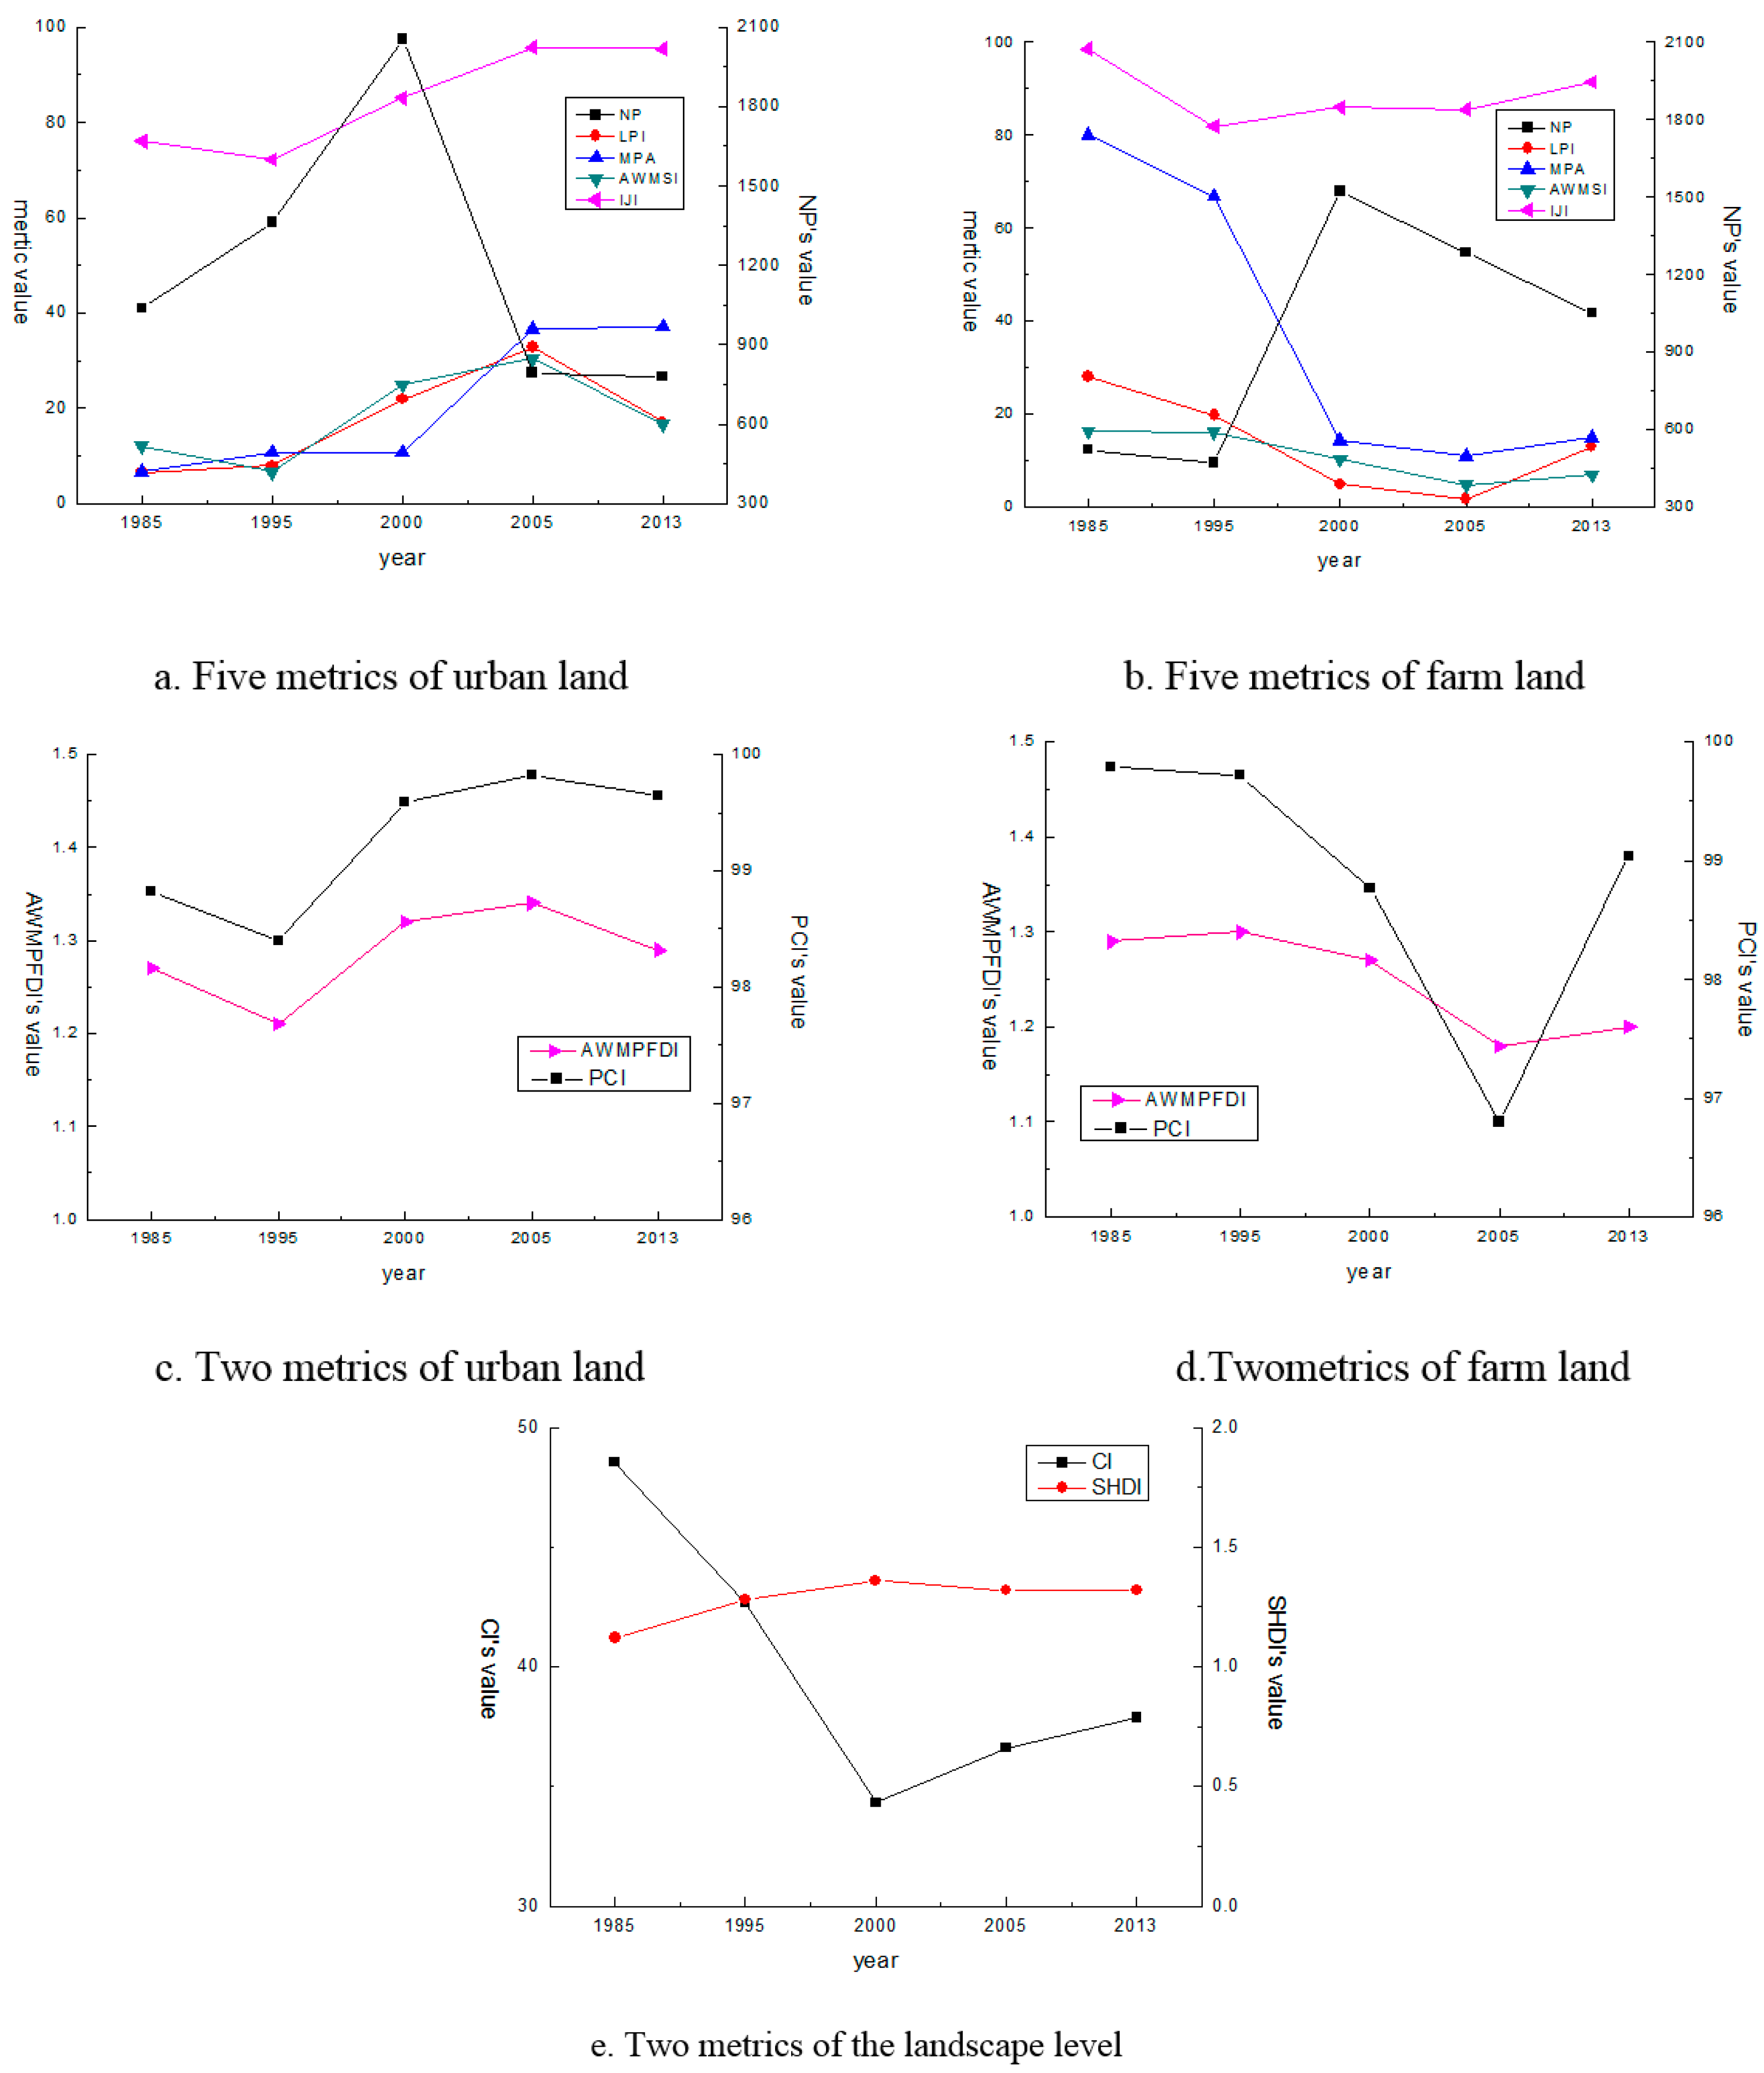
The study calculated the landscape metrics of Hangzhou’s urban land during the identified periods. The results are shown in Figure 4 and Figure 5. During the period 1985–2013, the expansion of urban areas was the most obvious characteristic of land-use changes. In that context, the diversity of land uses has increased every year. The pattern of urban land-use distribution was initially dispersed and then clustered. Meanwhile, farmland became more dispersed and fragmented.
The urban land expansion encroached the farmland and other open space, and farmland is the major source of urban land transition in Hangzhou (Table 4). The urban growth could really cause a ripple in the ecology [33]. It damaged the rural heritage, local food production, and open space. The values of the agricultural landscape for ecosystem service were not protected. The NP of urban land and farmland increased from 1985 to 2000, but started to decline since 2000. The LPI of urban land began to increase from 1985 to 2005, but slightly declined from 2005 to 2013. This suggests the growing dominance of urban land resulted from rapid expansion. The LPI for farmland became more interspersed during that period. From 2000 to 2005, the MPA of urban land remained stable except for a significant increase. It showed that the expanded areas of a single project and large tracts of urban land gradually formed through the acquisition of small patches. The MPA for farmland was steadily shrinking, indicating the distribution of farmland patches becoming more interspersed.
From 1985 to 1995, the PCI and IJI of urban land experienced a slight decline, and then increased from 1995 to 2013. This reflected a greater cohesion and connectivity of urban land. The change of PCI for farmland indicated that, although farmland became more interspersed with lower connectivity from 1995 to 2005, a trend toward concentration and integration occurred from 2005 to 2013.
Most of the study area was farmland during 1985 to 2000, and the percentage of farmland in the study area became lower and the cohesion of farmland became lower. However, the CI increased slowly from 2000 to 2013; during that time, most of the study area was converted to urban land that was reflected by the increasing cohesion of urban land.
The AWMSI and AWMPFDI for urban land fluctuated greatly. They declined from 1985 to 1995, increased from 1995 to 2005, and declined again from 2005 to 2013. These varying trends indicated that the irregularly distributed patches of urban land experienced the most rapid increase in development. These patches became more complex from 1995 to 2005. However, as the average area of urban land patches shrank from 2005 to 2013, the complexity in the distribution of farmland patches began to increase.
From 1985 to 2013, the SHDI rose, indicating that more types of land use emerged in Hangzhou on more interspersed patches.
3.2. Control Effectiveness in the Different Periods of Urban Planning
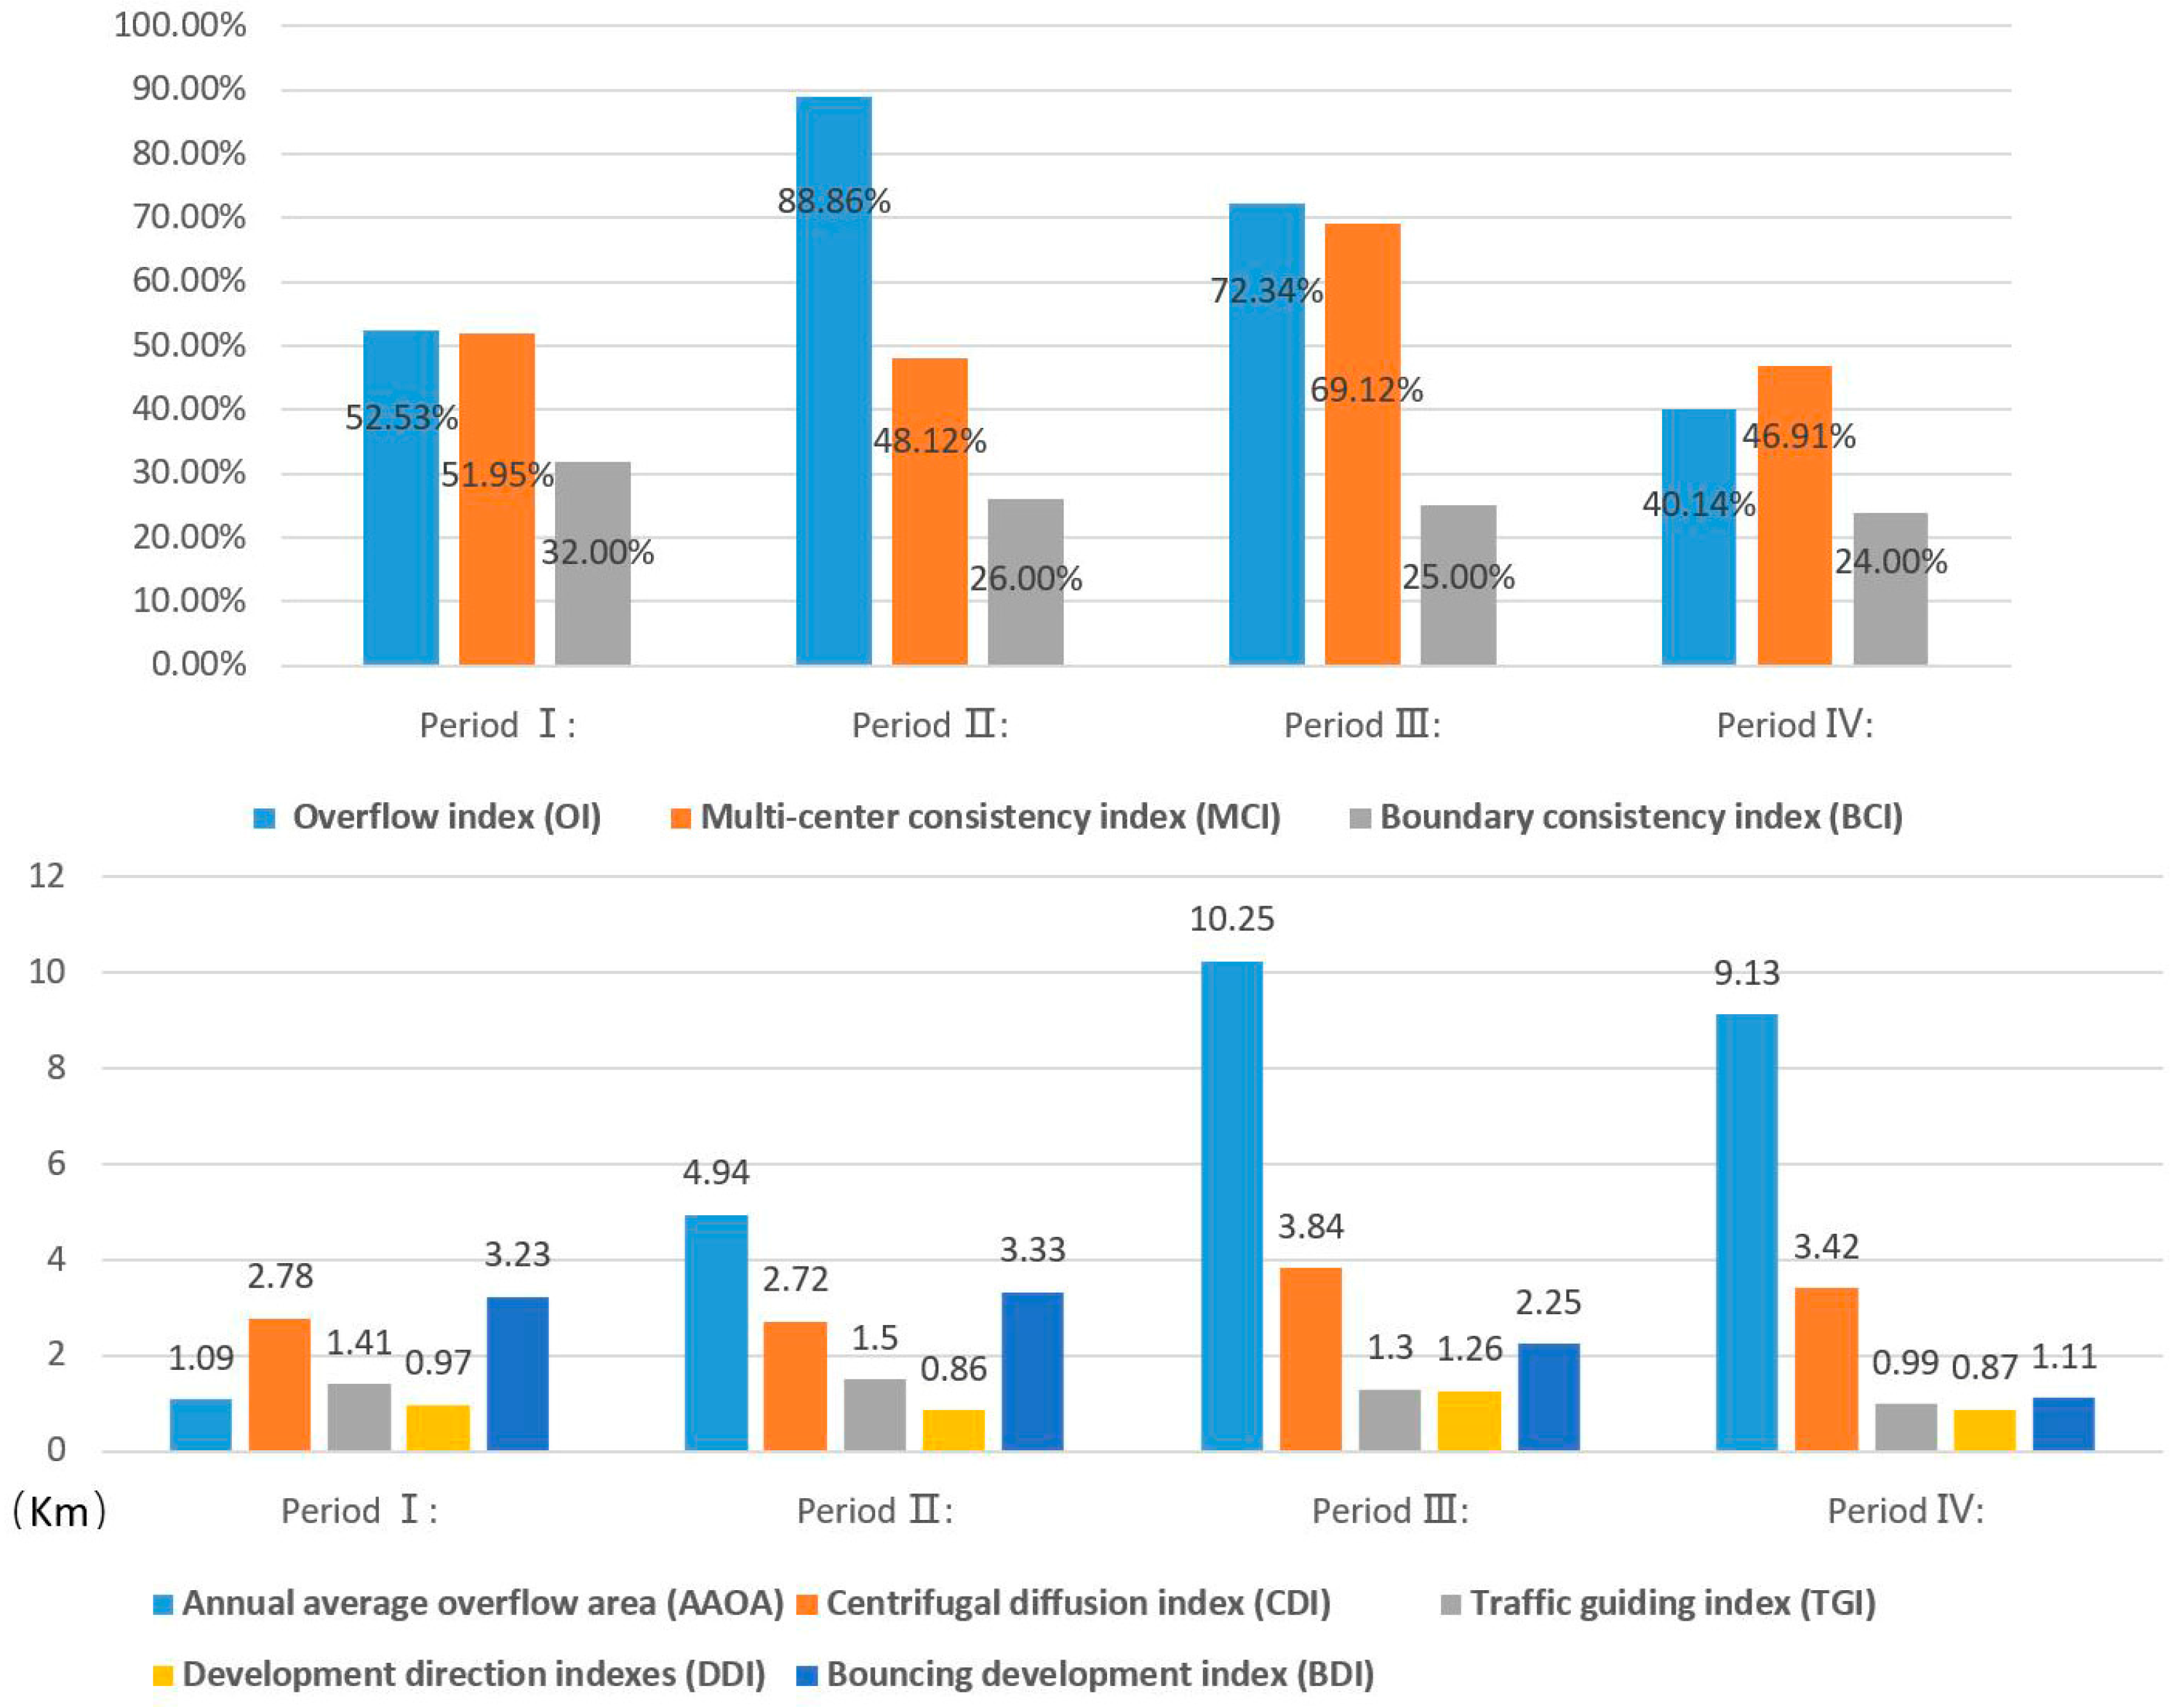
As suggested by various control effectiveness indicators, the master plans were effective in controlling the expansion of urban land in Hangzhou during the studied planning periods (Table 5, Figure 6 and Figure 7). The OI rose significantly in the first two periods, with the peak value reaching 88.86% and then dropping slowly in the next two periods. Therefore, planning period I was far from satisfactory with the actual development increasingly out of control and most urban development occurring beyond the designated planning boundary. The AAOA gradually became steadily larger in the first three periods and shrank slightly in period IV, indicating the accelerating development of urban land outside the designated planning boundary.
Much of the land development was close to the transportation routes, although it was inconsistent with the overall structural change in the city. The spatial structure indexes (MCI and TGI) showed similar trends. The MCI was satisfactory in period III, reaching 69.12%. However, it fluctuated between 46% and 52% in other periods, reflecting the overall poor effectiveness of the polycentric development strategy. The TGI also reached its peak at 3844.83 m in the same period, which was more evident in the first two periods.
The actual development was slightly centripetal compared with planning in the first two periods. Subsequently, more development took place in suburban areas in the form of sprawl. The CDI showed a gradual decline, from approximately 1.5 in period I and period II to about 1.0 in period IV. It also demonstrated that the outward expansion strategies for the economy and population were not successful.
An overall comparison between the planning and the practical results showed that more development occurred in the southeastern area under the influence of urban planning, which was concerned with its topographic features and the change in its spatial structure (Figure 6). The tendency for cross-river development progressed faster than we had expected. During the first two periods, the BDI was relatively high, but dropped significantly in the last two periods. The BCI was gradually declining, which showed not only the declining influence of the planning boundary but also the increasing length by which construction land overstepped the boundary. Considering the actual demand for urban development, the setting of the planning boundary was becoming impractical.
3.3. Comparison of Plan-Making Logic in Different Periods
Political and institutional backgrounds refer to the relevant institutional environment during the urban planning and historical events that exerted a significant influence on urban planning and construction. Designated functions indicate the primary function of the city in the political, economic, and social development of a certain region, country, or larger area. The macro-scale of the urban spatial structure is the system of urban spaces (including metro and satellite towns).
Urban planning in Hangzhou evolved with its political and economic context which can be divided into two distinct stages (Table 6). The first stage includes the first two planning periods, during which planning was implemented in the context of the planned economy system. The planned economy represented an economic mechanism based on a publicly owned economy that directly regulated the allocation of resources according to mandatory plans and administrative orders. The second stage includes the last two planning periods, during which planning was implemented under China’s transformation from a planned economy to a free market economy. The market economy represents an economic means to regulating the allocation of social resources through the market and achieves the goal of decentralizing decision-making through the exchange of commodities. In the planned economy, the property of the city belonged to the nation, so planning was accountable only to the municipal government. However, under the market economy, planning was inevitably under the influence of different interests groups. Furthermore, important historical events had a profound influence on urban development. During the Great Leap Forward period, urban industries experienced a rapid growth in scale. During the Cultural Revolution period, urban development occurred a masse. After the entry of the WTO, the proportion of both domestic and foreign investments in urban development increased drastically.
The actual development far exceeded the forecast, and the government had to modify master plans frequently. The typical time frame for urban master plans in China is 20 years, with the first 10 years dedicated to short-term controls and the last 10 years dedicated to long-term controls. When the short-term period of the planning process ended, there were already significant differences between the practical constraints to progress and the initial anticipated or predicted results.
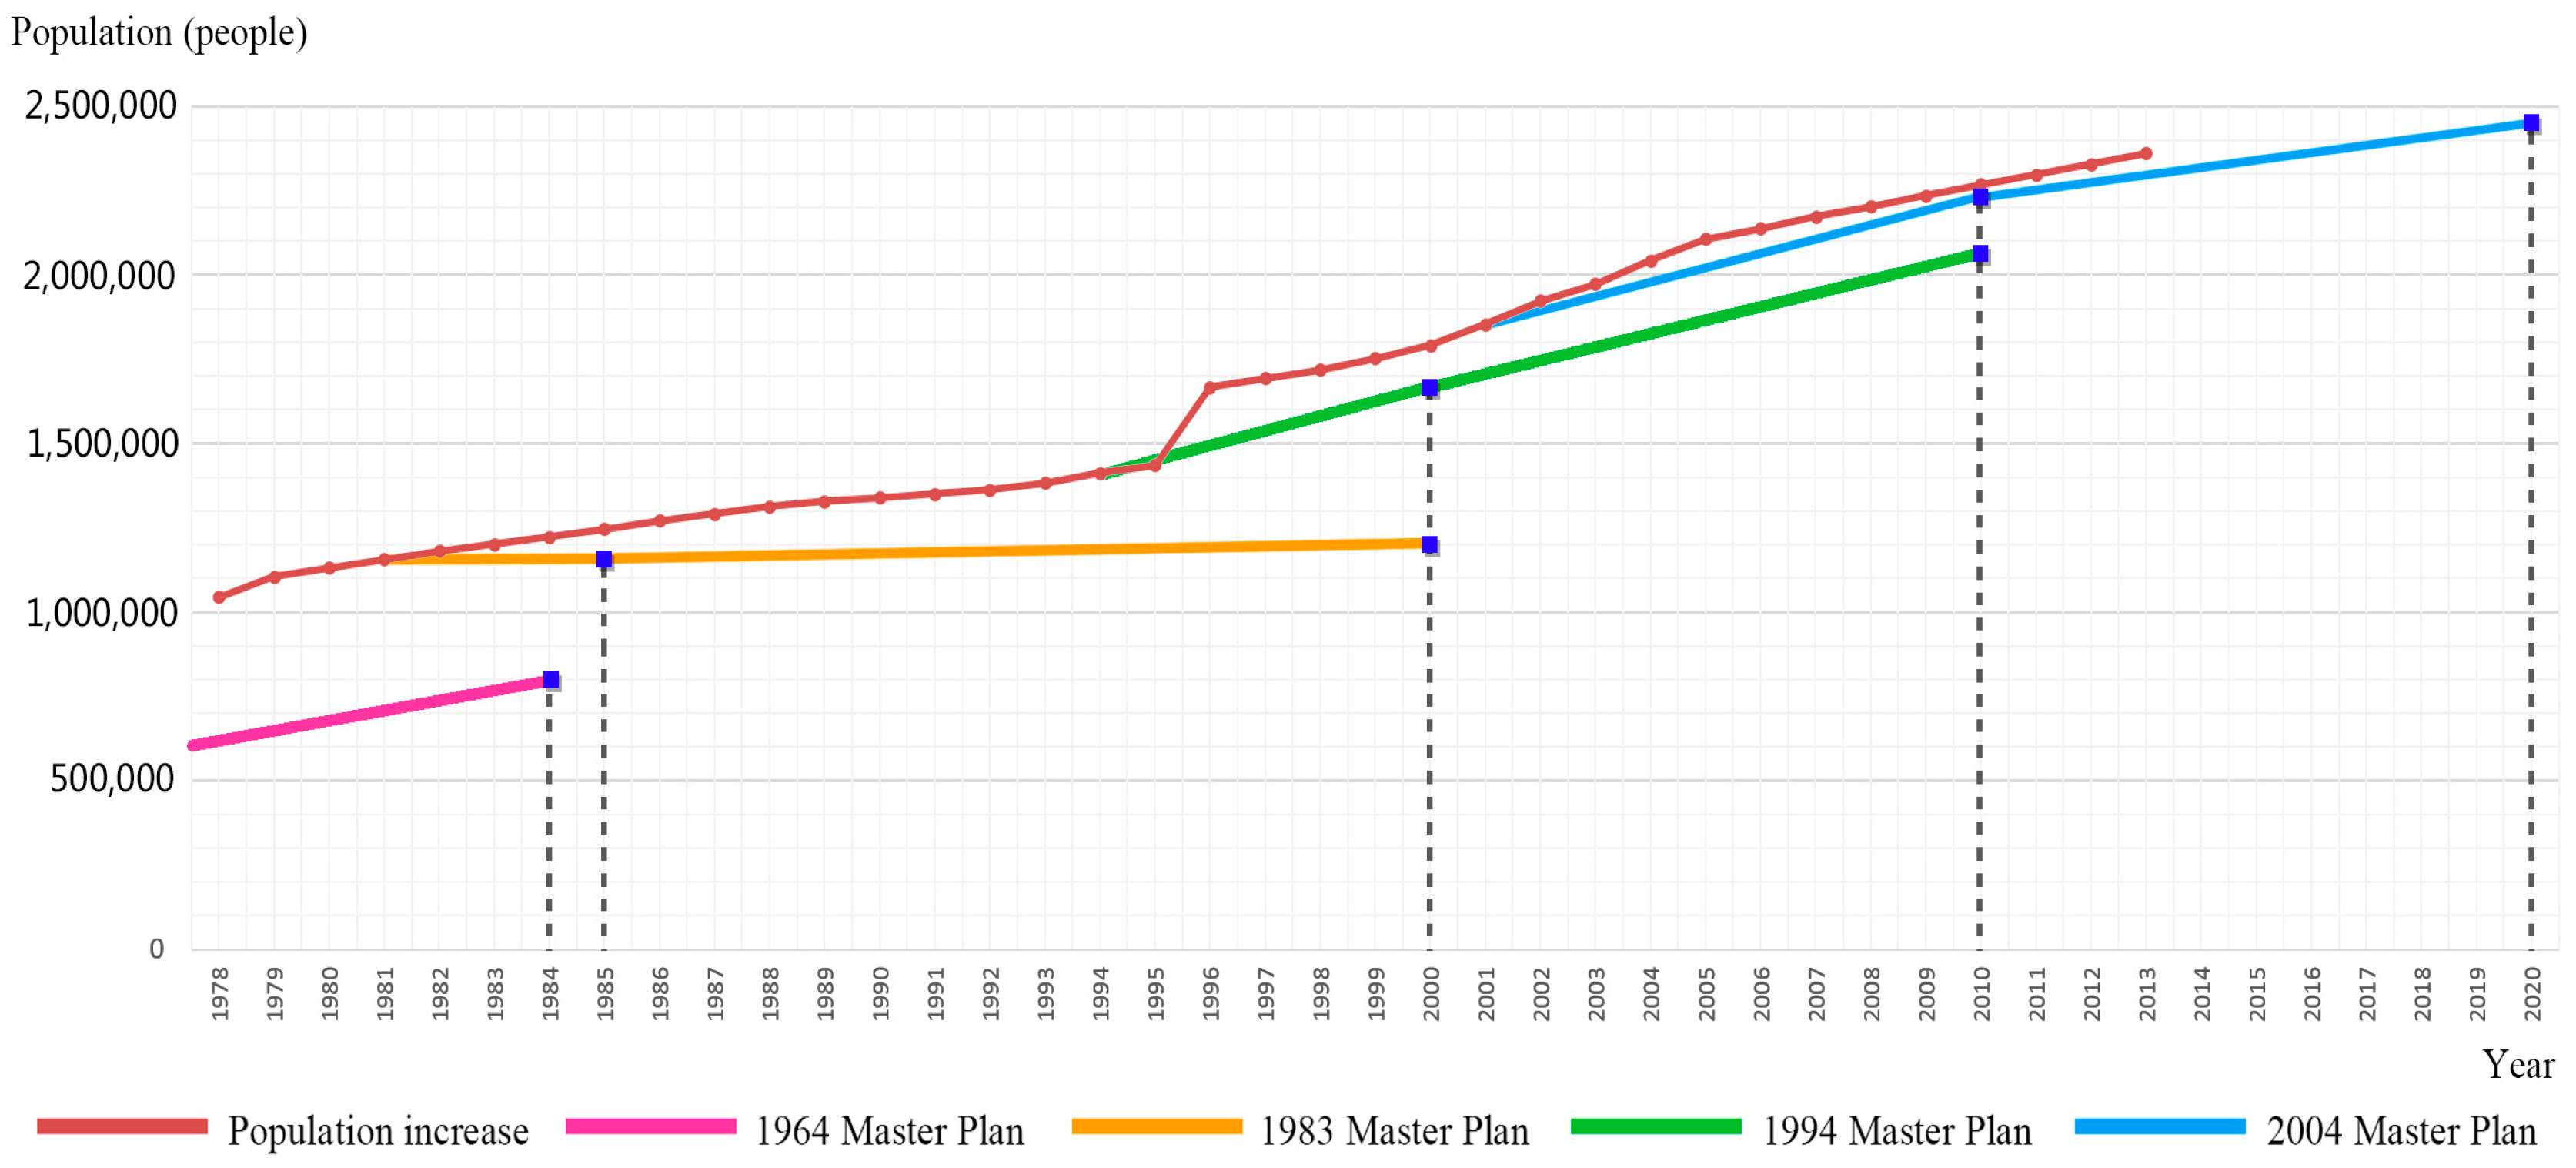
The forecasting methods did not reflect actual development conditions. Under the planning process, the expected growth was approximately linear and the growth rate tended to decrease as the annual growth amount had averaged 16,500 people in the planning period 1964–1984. However, the annual growth amount decreased to 40 people in the next planning period. The construction area of land, measured by the standard of 90 square meters per capita, was closely related to population. However, actual growth did not follow the planned linear trend. Unexpected growth in population and land was among the important reasons forcing governments to rectify the planning process.
The functional orientation of Hangzhou changed in response to different historical periods. Before 1983, the planning process attached great importance to industries in the city’s development strategy. After 1983, the industries received less attention in the planning process, and the focus had shifted to the service industry and tourism. For example, the 1964 master planning process emphasized industry development to build up a solid economic foundation for further development. This was due to the frailty of the Chinese economy after the founding of the People’s Republic of China (PRC), whereas the 2004 master planning process focused on the development of a multi-functional city, playing its part primarily in economic, social, and cultural affairs.
The general approach to spatial structure in all plans was to achieve a polycentricity to avoid over-concentration. This approach was based on two principles. First, the geographical features and terrain of Hangzhou affected the direction of city expansion. Second, Hangzhou’s historic development tended to concentrate in the city center. In fact, Hangzhou continued to concentrate primarily on development at the urban outskirts, although it has shown a trend toward suburbanization.
4. Discussion
4.1. Historical Features Causing Low-Cost and Unexpected Expansion
A historical economic event can stimulate urban expansion in unconventional ways [14]; therefore, the control effects of urban planning for Hangzhou tend to weaken under the effect of major events, such as the establishment of New China in 1949 and the economic reform and opening-up in 1978. The DDI shows that the deviation in the first and third planning periods is relatively large. The first period occurred after the liberation of the PRC in 1949 when cities in China were experiencing substantial growth because large numbers of rural residents were moving to urban communities. In the third period China launched economic reform and opening-up the country, late with the reform of the housing system that encouraged commercialized housing development. Thereafter, the development of land and real estate markets was accelerated and the construction of commodity houses developed rapidly. Much lower-cost farmland in suburban areas was converted to urban land [36]. This phenomenon is similar to the case study of Beijing in Han et al. (2009) [11], in which the urban expansion was based on the consumption of farmland in suburban. The rising trend indicated in the IJI means that the adjacency of land is generally decreasing and sprawl is still a relatively common means of urban land expansion. Geographical factors affecting urban expansion include the West Lake Scenic Spot in the middle west, farmland, and expressway gallery in the east, and limitation of administrative boundaries in the north (Figure 8). Due to these constraints, massive unexpected urban land expansion has occurred in the southern region across the Qiantang River.
4.2. Functional Orientation Driving Fragmented Suburbanization
The functional orientation in the planning process changed many times, leading to different types of urban development in each planning period. Evacuation of industrial functions for inner city started from 1990 and insufficient solid planning led to decentralized expansion for industrial land near field beyond planning boundaries.
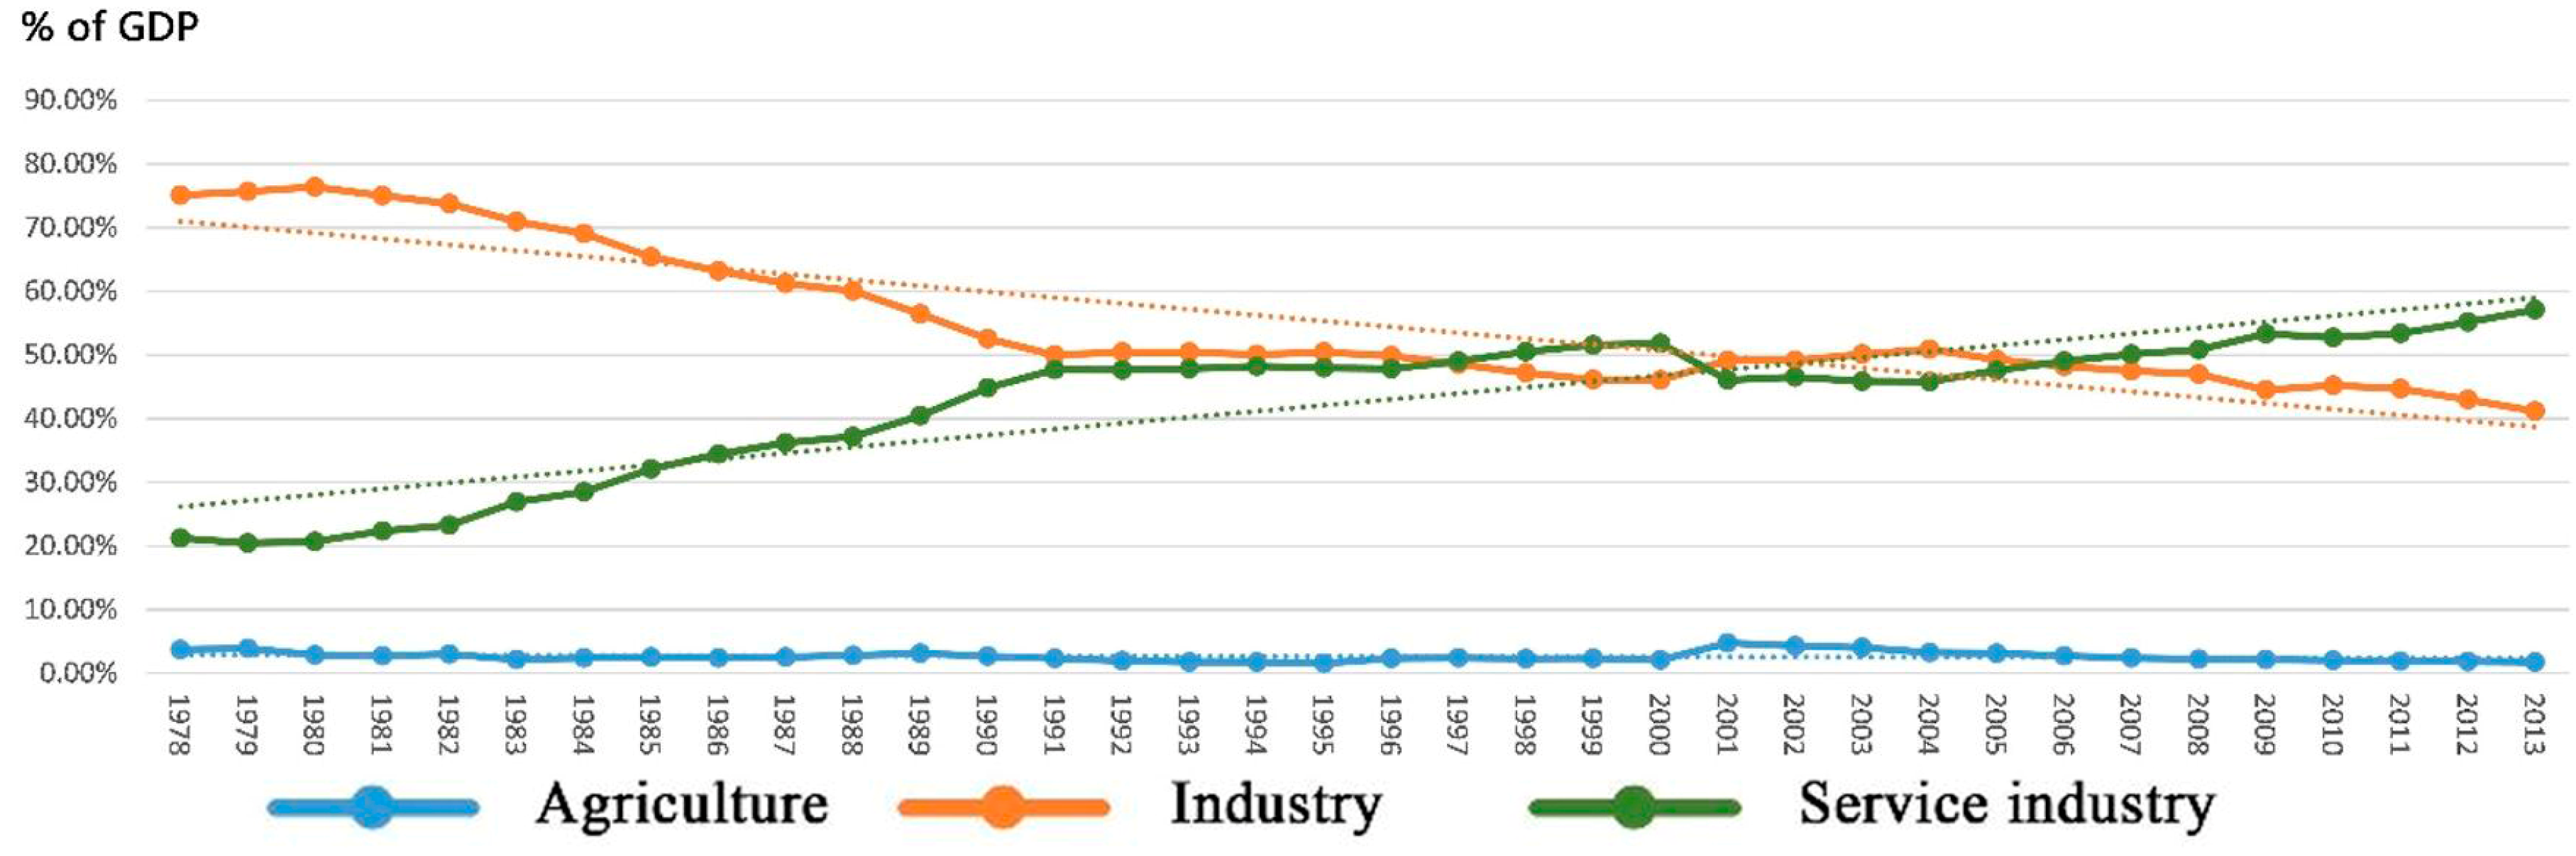
Prior to the 1990s, Hangzhou focused primarily on its industrial function. For more than 20 years from the 1960s to the 1980s, gross industrial output had accounted for the largest proportion of city’s GDP (Figure 9). It reached a peak of 78% when land for industrial use accounted for 33% of all developed land. Meanwhile, the service function of the city was rather weak, accounting for only 19% of total land use. Under the planned-economy system, the government took a leading role in planning the layout of urban development [37]. During that period, industrial projects were at a small scale and scattered in cities. As a result, the LPI and MPA were relatively low. According to AWMSI and AWMPFDI, the shapes of those construction projects were regular. OI, BDI, and CDI were relatively high, indicating that the industries were expanding very rapidly at the periphery of the city. Most of that development occurred in the form of enclaves, similar to American cities [49].
After the 1990s, the government came to realize the importance of Hangzhou’s unique natural scenery and focused on the service functions. The government paid more attention to making Hangzhou a scenic city and protecting its historical and cultural heritage. This is also consistent with the research of the transformation of China’s economy over the past 20 years [24,25]; that is, the industry structure is transferring to service industry oriented. Meanwhile, construction of the city center focused primarily on renewal or infill development for the service industry.
As a result, several industrial enterprises moved to the suburbs. However, similar to the research of the land use change of Beijing in Du et al. (2014) [27], several industrial enterprises are not allocated in planned industrial region because of high cost for land development. Enterprises built factories beyond the planning scope, leading to more severe expansion around the city center with the AAOA increasing. However, due to the rapid development in suburban areas, interspersed patches were integrated into large ones. The LPI during this period was much higher than that in the first two periods.
4.3. Inadequate Methods for Forecasting Population and Land Use Area
Population growth tends to be non-linear when social and economic environments change; the relation between population growth and land use expansion is not proportional. Therefore, population size predicted through linear methods using land size deviates from the actual development [42]. The scale of land use was measured using the per capita land-use standard in Urban and Rural Planning Law of the People’s Republic of China (2008). In the population forecast, a simple linear model is generally adopted and the trend derived from the model can be applied to other cases. However, in reality, cities, especially coastal cities like Hangzhou, do not follow this trend, and the population growth rate fluctuates several times at different levels because such cities have attracted people from central and western China in large numbers. This is similar to the case in western cities in Schneider et al. (2014) [14]. Figure 9 shows also that, since 1995 and during the last two periods, the predicted population tends more and more to fit the observed one (Figure 10).
Due to the complexity of the real world and the limited amount of information available at any particular time, using population projections alone to predict the spatial extent is unreasonable. As described in previous studies of Beijing and Guangdong cases [11,15], improper forecasting methods are also the main cause of urban sprawl and planning out of control. In China, urban planning is, in essence, a means to control the scale of land use and allocate different types of land uses. However, revisions usually were made when the land scale exceeds the number predicted before the deadline of the short-time planning period. As a result, the allocation of land uses had no direct links with population projections that were not under the control of the planning process [43]. AAOA showed a rising trend in these planning periods, indicating that the scale of land-use planning should have become larger. The OI for all planning periods was above 40%. There is still a gap between the UGB (Urban Growth Boundary) we established and the reality of current development trends. For example, the 1983 master plan predicted 139 km2 of land would be developed by the end of 2000. The 1994 plan reduced the projection to 126 km2. In reality, developed land had increased to 151 km2 by 2001. Planning should take into full account existing land use trends and conditions, analyze future trends in social and economic development and the demand for an improved quality of life, and assess the dynamic trends in the techniques and capabilities for new urban development [43].
4.4. Market Mechanisms Contributing to Inconsistency
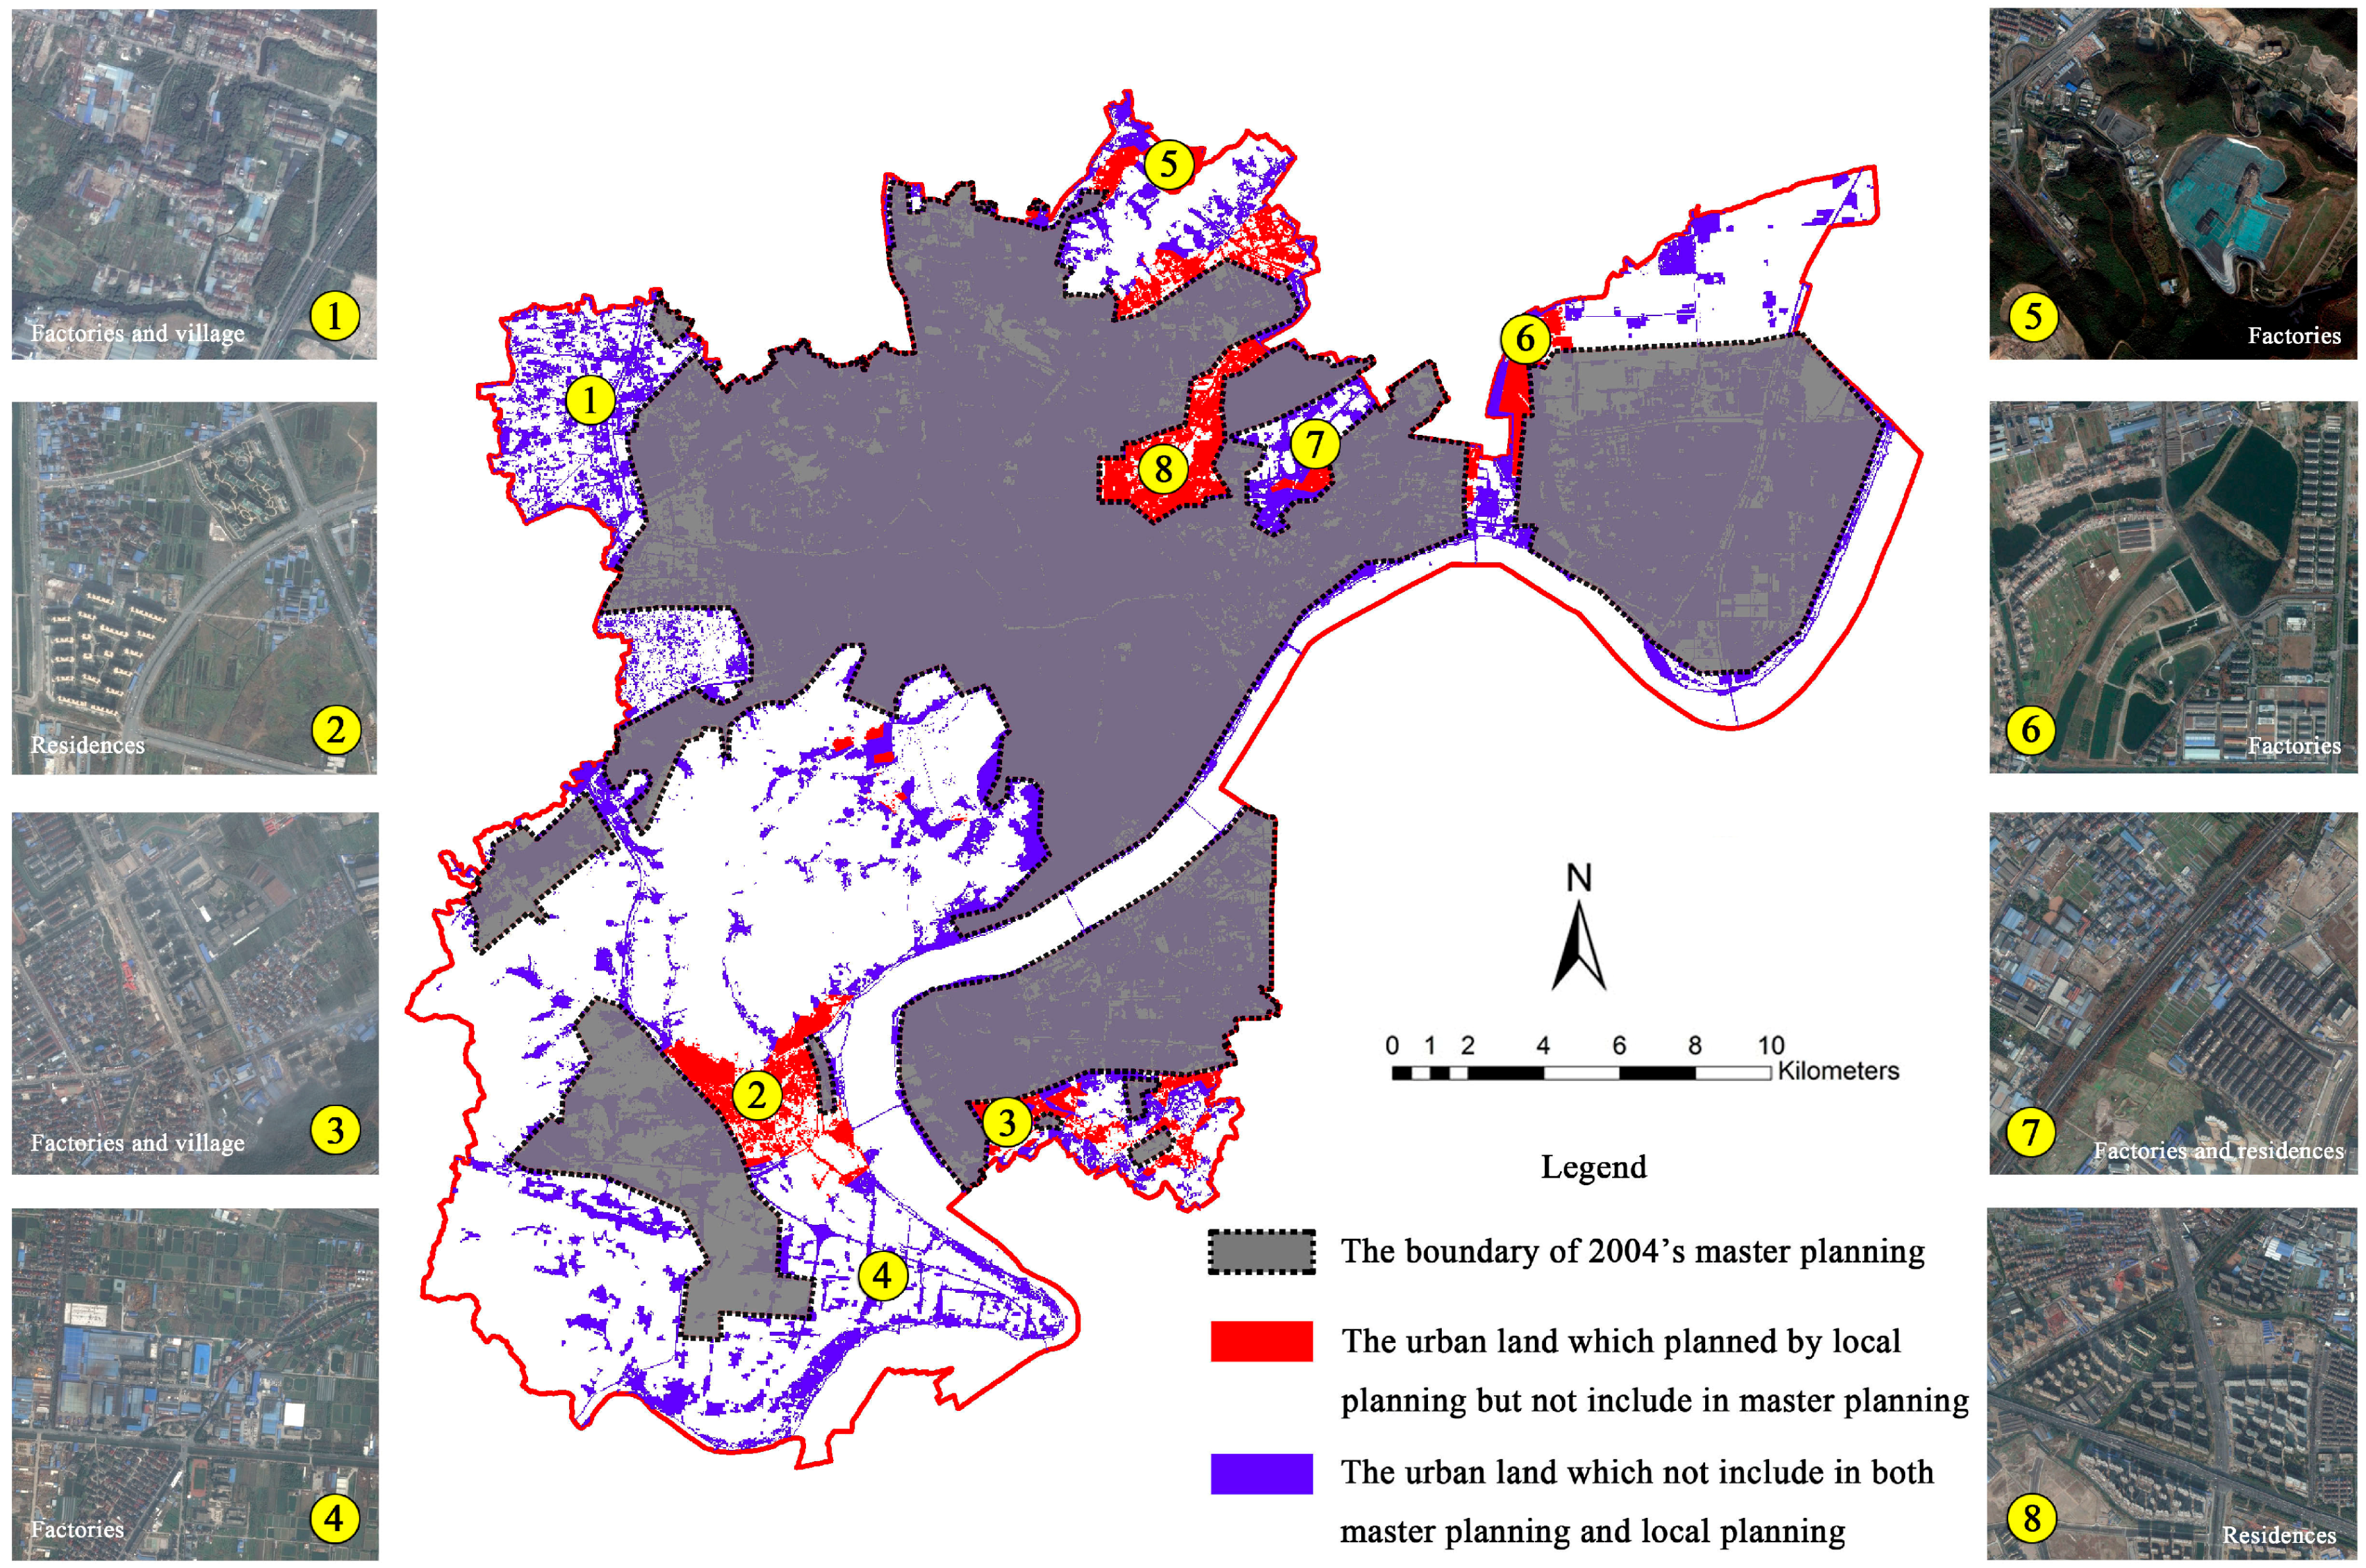
The primary reason for poor effectiveness in the last two periods was that, under the new market economy system, the diversity of resources for urban development had weakened the government’s control for implementing the plans [50,51]. The varying interests at different levels of government also led to a deviation in the plan-making and implementation process [52]. Generally, there are two levels of plan in China’s urban planning system [53]: master plan and detailed plan. Theoretically, detailed planning should be consistent with the boundary established during the master planning process. With multiple stakeholders in the decision network, the government’s decisions are being decentralized and weakened [54]. Various involved parties have different rules to guide their actions in implementing the plan. Farmland is the largest source of economy for urban land because of large differences in economic value between farmland and urban land. The fiscal incentives encourage local governments in China to use the “expropriation of agricultural land, and transfer of the city land” to gain financial benefits [27]. In the absence of legal system guarantees, a unified framework for action, and an effective mechanism for coordination, urban planning decisions are becoming divergent and difficult to manage effectively [26,50,55]. This phenomenon had detailed described in the planning comparison of different levels in Wei et al. (2009) [15]. The decline of the BDI also supports this argument. As shown in Figure 11, the boundaries in many local planning areas far exceed those established by the master plan, especially in suburban areas [56,57,58,59,60,61,62]. The main development types are industry and real estate, mixed with established villages [63,64].
4.5. Lack of Support for Polycentricity Development
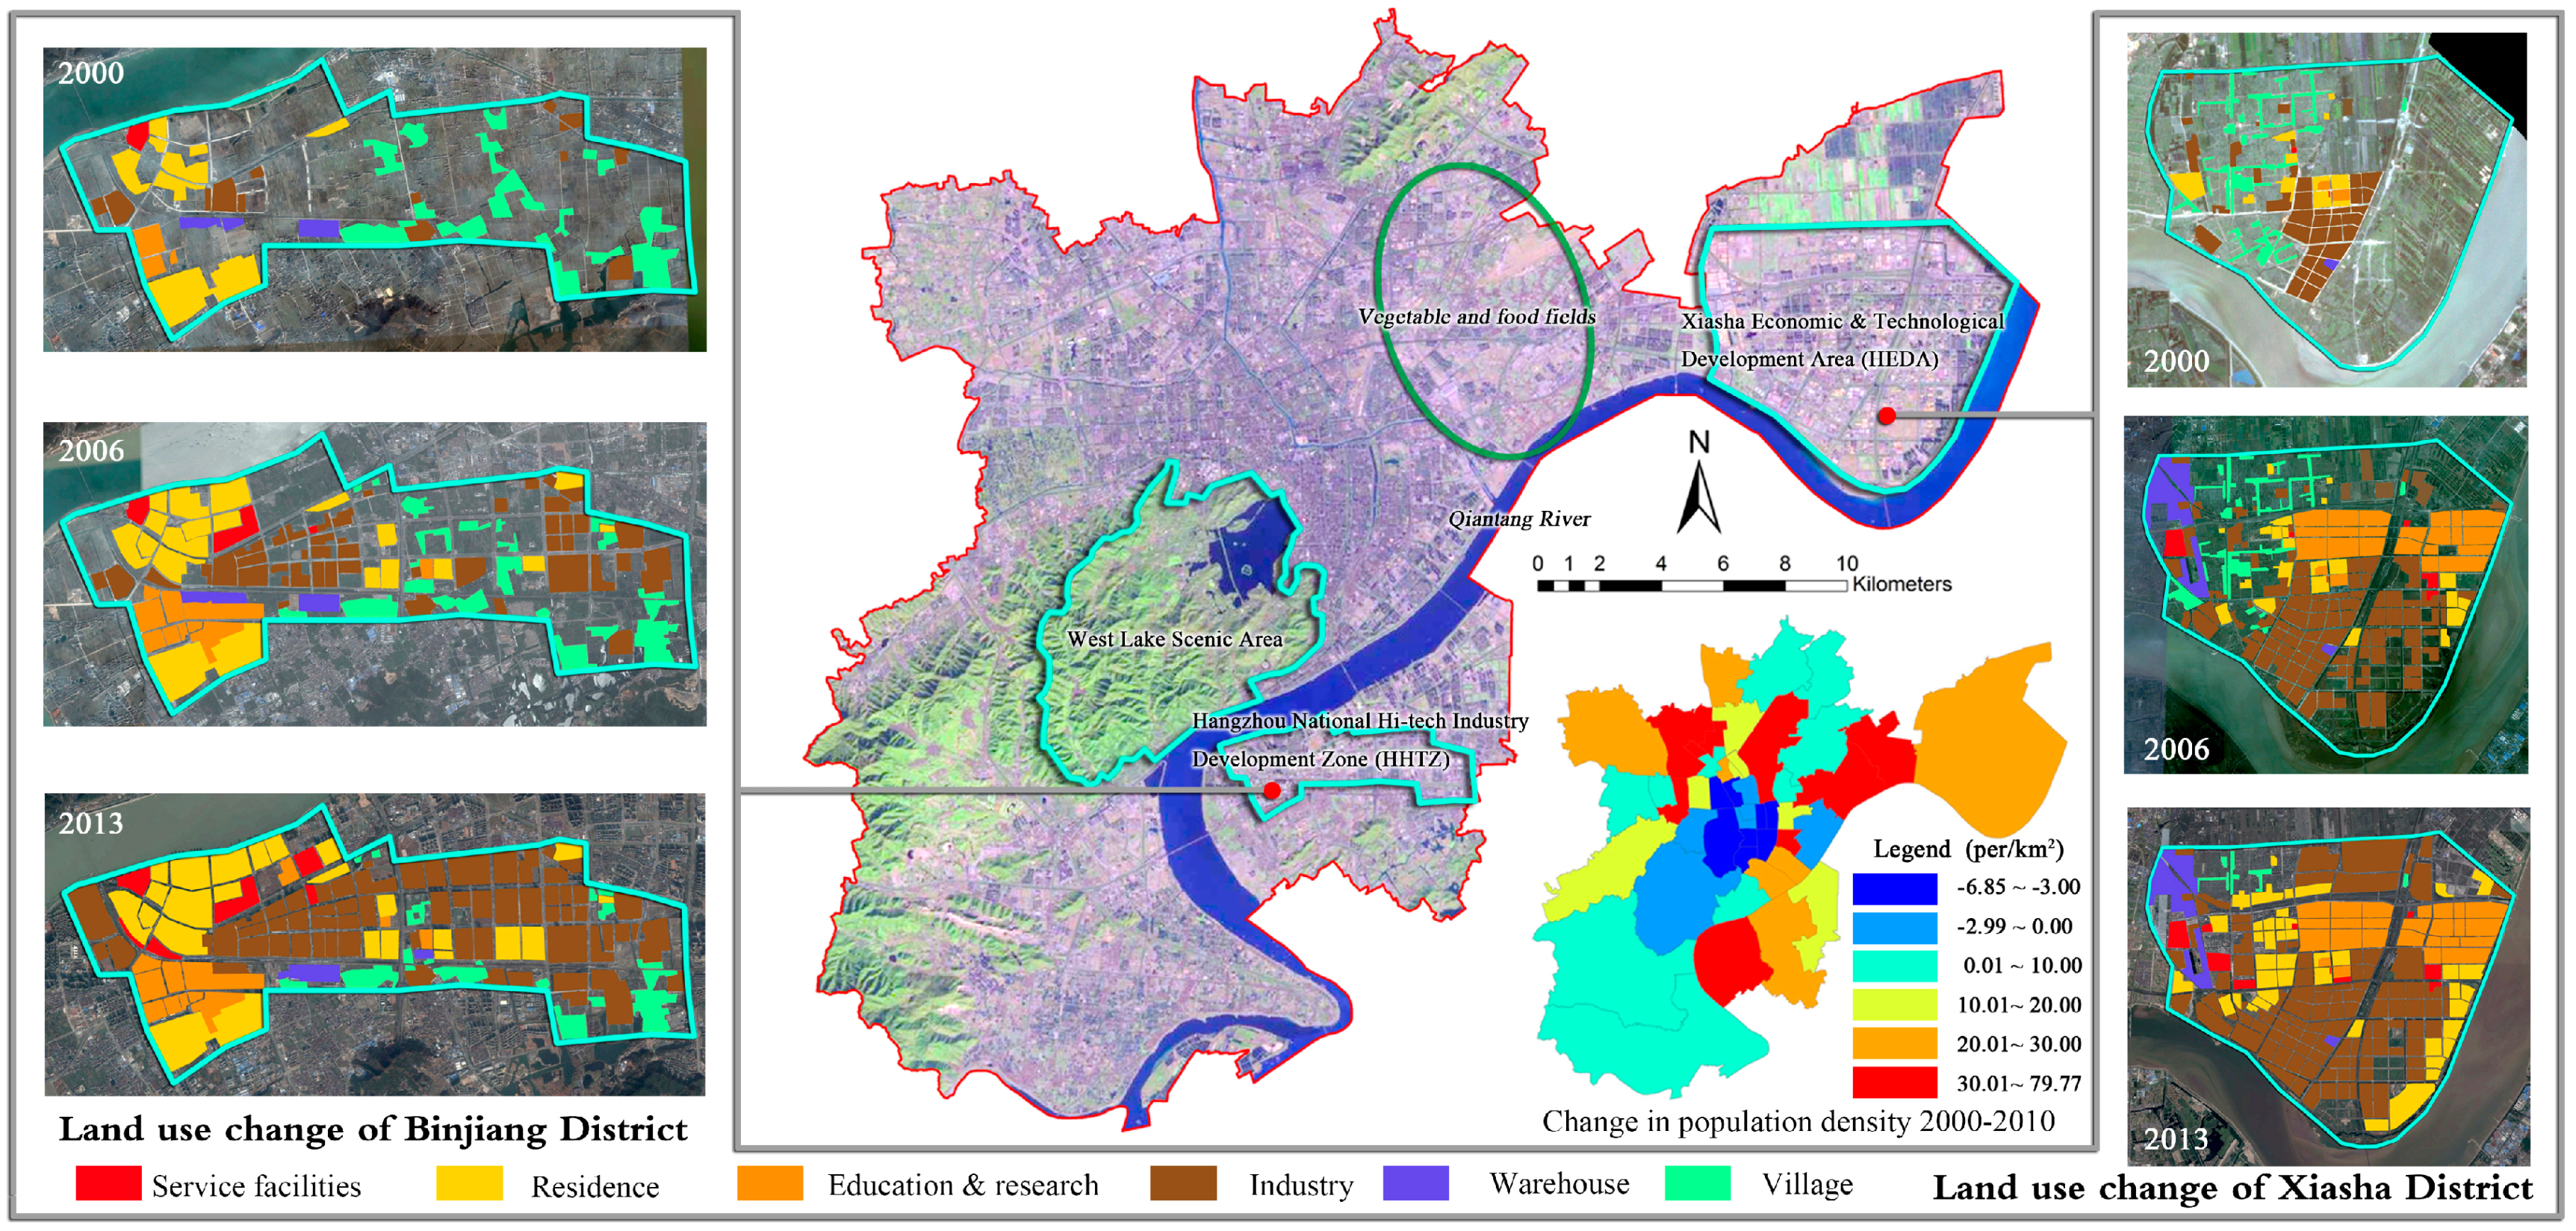
In the last two planning periods, government agencies began to implement the polycentric strategy to reconstruct the old city with the purpose of limiting expansion, changing their focus to service functions, and moving industrial factories from the old city to subordinate outlying districts. As shown in the research of Tian et al. (2017), it is similar to the change of function zones in Shanghai’s suburb [26]. In Hangzhou, this is especially the case in the Xiasha District (Figure 8). However, the suburban area still became a hot spot of the expansion of the new subcenter. As a result, the OI continued to increase. The MCI was consistently kept below 70%, although the best results were achieved in the last period. The primary reason was that, with the forming of the Xiasha District and its rapid expansion, the BCI and CDI had a tendency to drop, while the TGI did not.
Although urban land promotes expansion in sub-centers, due to lack of supports from social facilities and traffic facilities, the growth rate of population in sub-centers was still lagged urban fringes. In recent years, population density in the urban center of Hangzhou tended to decline, and most regions with high population density were hotspots of urban expansion; population density in suburbs increased with the fastest speed, followed by outer suburbs (Figure 8). This trend is not like those in European and American cities, where polycentric development stems from proximity to advanced transportation facilities and communication technology [65]. As a National Economic and Technological Development Zone, the development of the Xiasha subcenter depends primarily on preferential policies, especially in finance and land-use policies. In the early 1990s, Xiasha was designated as a pure industrial site in the planning process, and a large number of industries had moved out from the central city to the Xiasha District. However, the 2004 master plan used the concept of a Comprehensive New Town, which, in addition to the original industrial function, allocated large areas for higher education. However, the infrastructure and public transportation systems were not supplied at the same pace, making the district less attractive to new population. Another similar district is the Binjiang District in the south. It is also a National Economic and Technological Development Zone with preferential policies; however, with attention to service functions at the beginning, it attracted a large population. Meanwhile, the population density in peripheral areas increased significantly (Figure 8), demonstrating the trend of population suburbanization.
Based on the master plan data and urban spatial morphology from 1964 to 2013, this study revealed significant discrepancies between land-use plans and the development that actually occurred in Hangzhou. Like most research on urban sprawl, the evolution of the urban spatial form presents the nonlinear sprawl trend [5]. Overall, the effectiveness of planning control during the four planning periods was low, and the main driving forces for the “gap” are related to the transformational period [24]. On the one hand, in addition to improper methods for planning prediction, social and economic background has changed many times, resulting in large differences in prediction for future development. On the other hand, planning for many places deviates from the overall planning under the mechanism of market economy because of insufficient consideration for planning legislation and implementation mechanism. The rate of population growth in sub-centers for certain planning is also lower than the expansion speed of land use.
5. Conclusions and Policy Implications
5.1. Conclusions
This research evaluated the gap between planning and reality using the PCEIs. Combining the analysis of urban expansion and the logic of plan-making, this research also discussed the main factors that contributed to the poor effectiveness of planning implementation. Compared with the traditional methods that solely rely on land use analysis, this new approach incorporated PCEIs, which should helped better understand the causes of poor effectiveness. Instead of simply comparing the urbanized areas inside and outside the planning boundary, the PCEIs reflected the characteristics of physical outcomes. Furthermore, it is beneficial for decision making by analyzing the causes of planning ineffectiveness based on the logic of plan-making. This approach of PCEIs is also applicable in other rapidly developing cities in the world, which also show a huge gap between urban planning and the real urban development.
Our study also has some limitations. First, there exists inaccuracy of land-use classification based on remote sensing images, which will result in bias of the landscape and planning indexes. Second, our study did to assess the impacts of detailed urban planning system and planning permit system. Third, we did not consider the influence of topography in landscape indexes in Hangzhou. Further investigation of natural features should be conducted. Finally, with the rapid development of the remote sensing and satellite sensor technology, high spatial resolution data resources will be more accessible, low-cost, and generated quickly [66,67,68,69]. We will adopt these data resources to study urban sprawl, urban growth and other related issues for improving the accuracy and reliability of the results in our further researches. If interviews or social investigations can be conducted with the residents or business entities outside the non-planning area, this study will help to provide a better understanding of the failure of urban planning from a top-down perspective.
5.2. Policy Implications
The case study of Hangzhou has several policy implications for planning making. Firstly, under the uncertainties of rapid urbanization, planning requires flexibility to some extent. Using nonlinear models, such as system dynamics model, Scenario planning, comparing different scenarios for dealing with the uncertainty of the future, should be a better choice. In particular, spontaneous events, such as administrative annexation and establishment of new development zones, demand local government to amend its urban planning with flexible space for adapting to the new change. Secondly, it is necessary to reform the existing policy of financial regulation in order to encourage the behaviors of obeying master planning of local governments. Sprawl can be limited by establishing rigorous restrictions and heavy financial penalty policies of development activities outside the urban planning boundary. Thirdly, governments should adopt different planning control methods and incentive policy according to different regional features [70,71].
This study also has several policy implications for sustainable urban land management. Firstly, it is necessary to set the red line of ecological protection including prime farmlands, reservoirs, forest parks, wildlife habitats and geological disaster areas in urban planning. Secondly, smart growth should be encouraged by governments, and the urban land development should seek an intentional, comprehensive way. Thirdly, the land finance result in the rapid conversion of agricultural land into urban construction land in densely populated cites. Therefore, it is necessary to change the single-minded pursuit of GDP growth, and local governments should have not power in converting farmland for urban development. Fourthly, the land use policies should encourage redeveloping underutilized sites in densely populated cites. Meanwhile, the government should generalize the mixed land uses which mean houses, offices, schools, parks, shops and other types of land use patters near one another.
Acknowledgments
This work has been supported by the National Natural Science Foundation of China (No. 51578507, 51108405, 41101568 and 71403235), the National Aeronautics and Space Administration (NASA)’s Land Cover and Land Use Program (NNX09AI32G and NNX15AD51G), Zhejiang Province Natural Science Foundation (No. LY15E080024 and LY16G030015), and Philosophy and Social Science Planning Project of Zhejiang (No. 16NDJC203YB).
Author Contributions
Yizhou W. contributed to the manuscript by providing the initial concept development, research design, data collection and wrote the paper. Peilei F., Ouyang Z. and Yong L. conducted further development of conceptual framework and help revise the paper. Bo L. help design the analysis approach and analyzed the data. Heyuan Y. improved the English manner and revised the paper. All authors read and approved the final manuscript.
Conflicts of Interest
The authors declare no conflict of interest.
References
- Hammer, R.B.; Stewart, S.I.; Winkler, R.L.; Radeloff, V.C.; Voss, P.R. Characterizing dynamic spatial and temporal residential density patterns from 1940–1990 across the North Central United States. Landsc. Urban Plan. 2004, 69, 183–199. [Google Scholar] [CrossRef]
- Martinuzzi, S.; Gould, W.A.; Gonzalez, O.M.R. Land development, land use, and urban sprawl in Puerto Rico integrating remote sensing and population census data. Landsc. Urban Plan. 2007, 79, 288–297. [Google Scholar] [CrossRef]
- Wu, J. Urban ecology and sustainability: The state-of-the-science and future directions. Landsc. Urban Plan. 2014, 125, 209–221. [Google Scholar] [CrossRef]
- Todes, A. Urban growth and strategic spatial planning in Johannesburg, South Africa. Cities 2012, 29, 158–165. [Google Scholar] [CrossRef]
- Hamidi, S.; Ewing, R. A longitudinal study of changes in urban sprawl between 2000 and 2010 in the United States. Landsc. Urban Plan. 2014, 128, 72–82. [Google Scholar] [CrossRef]
- Huang, J.; Lu, X.X.; Sellers, J.M. A global comparative analysis of urban form: Applying spatial metrics and remote sensing. Landsc. Urban Plan. 2007, 82, 184–197. [Google Scholar]
- Wu, W.; Zhao, S.; Zhu, C.; Jiang, J. A comparative study of urban expansion in Beijing, Tianjin and Shijiazhuang over the past three decades. Landsc. Urban Plan. 2015, 134, 93–106. [Google Scholar] [CrossRef]
- Garouani, A.E.; Mulla, D.J.; Garouani, S.E.; Knight, J. Analysis of urban growth and sprawl from remote sensing data: Case of Fez, Morocco. Int. J. Sustain. Built Environ. 2017, in press. [Google Scholar] [CrossRef]
- Hasse, J. Using remote sensing and GIS integration to identify spatial characteristics of sprawl at the building-unit level. In Integration of GIS and Remote Sensing; Mesev, V., Ed.; John Wiley & Sons: Chichester, UK, 2007. [Google Scholar]
- Long, Y.; Han, H.; Tu, Y.; Shu, X. Evaluating the effectiveness of urban growth boundaries using human mobility and activity records. Cities 2015, 46, 76–84. [Google Scholar] [CrossRef]
- Han, H.; Lai, S.K.; Dang, A.; Tan, Z.; Wu, C. Effectiveness of urban construction boundaries in Beijing: An assessment. J. Zhejiang Univ. Sci. A 2009, 10, 1285–1295. [Google Scholar] [CrossRef]
- Hai, M.P.; Yamaguchi, Y.; Bui, T.Q. A case study on the relation between city planning and urban growth using remote sensing and spatial metrics. Landsc. Urban Plan. 2011, 100, 223–230. [Google Scholar]
- Gennaio, M.P.; Hersperger, A.M.; Bürgi, M. Containing urban sprawl—Evaluating effectiveness of urban growth boundaries set by the Swiss Land Use Plan. Land Use Policy 2009, 26, 224–232. [Google Scholar] [CrossRef]
- Schneider, A.; Chang, C.; Paulsen, K. The changing spatial form of cities in Western China. Landsc. Urban Plan. 2015, 135, 40–61. [Google Scholar] [CrossRef]
- Wei, Y.P.; Zhao, M. Urban spill over vs. local urban sprawl: Entangling land-use regulations in the urban growth of China’s megacities. Land Use Policy 2009, 26, 1031–1045. [Google Scholar]
- Torrens, P.M. A toolkit for measuring sprawl. Appl. Spat. Anal. Policy 2008, 1, 5–36. [Google Scholar] [CrossRef]
- Mubareka, S.; Koomen, E.; Estreguil, C.; Lavalle, C. Development of a composite index of urban compactness for land use modelling applications. Landsc. Urban Plan. 2011, 103, 303–317. [Google Scholar] [CrossRef]
- Wu, K.Y.; Zhang, H. Land use dynamics, built-up land expansion patterns, and driving forces analysis of the fast-growing Hangzhou metropolitan area, eastern China (1978–2008). Appl. Geogr. 2012, 34, 137–145. [Google Scholar] [CrossRef]
- Yue, W.; Liu, Y.; Fan, P. Measuring urban sprawl and its drivers in large Chinese cities: The Case of Hangzhou. Land Use Policy 2013, 31, 358–370. [Google Scholar] [CrossRef]
- Wei, Y.D.; Ye, X. Urbanization, land use, and sustainable development in China. Stoch. Environ. Res Risk Assess. 2014, 28, 757–765. [Google Scholar] [CrossRef]
- Weilenmann, B.; Seidl, I.; Schulz, T. The socio-economic determinants of urban sprawl between 1980 and 2010 in Switzerland. Landsc. Urban Plan. 2017, 157, 468–482. [Google Scholar] [CrossRef]
- Kline, J.D.; Thiers, P.; Ozawa, C.P.; Yeakley, J.A.; Gordon, S.N. How well has land-use planning worked under different governance regimes? A case study in the Portland, OR-Vancouver, WA metropolitan area, USA. Landsc. Urban Plan. 2014, 131, 51–63. [Google Scholar] [CrossRef]
- Sharifi, A.; Chiba, Y.; Okamoto, K.; Yokoyama, S.; Murayama, A. Can master planning control and regulate urban growth in Vientiane, Laos? Landsc. Urban Plan. 2014, 131, 1–13. [Google Scholar] [CrossRef]
- Yeh, A.G.O. Dual land market and internal spatial structure of Chinese cities. In Restructuring the Chinese City: Changing Society, Economy and Space; Ma, L.J., Wu, F., Eds.; Routledge: London, UK, 2005. [Google Scholar]
- Qi, Y.; Yang, Y.; Jin, F. China’s economic development stage and its spatiotemporal evolution: A prefectural-level analysis. J. Geogr. Sci. 2013, 23, 297–314. [Google Scholar] [CrossRef]
- Garau, C.; Zamperlin, P.; Balletto, G. Reconsidering the Geddesian Concepts of Community and Space through the Paradigm of Smart Cities. Sustainability 2016, 8, 985. [Google Scholar] [CrossRef]
- Du, J.; Thill, J.C.; Peiser, R.B.; Feng, C. Urban land market and land-use changes in post-reform China: A case study of Beijing. Landsc. Urban Plan. 2014, 124, 118–128. [Google Scholar] [CrossRef]
- Tao, R.; Su, F.; Liu, M.; Cao, G. Land leasing and local public finance in China’s regional development: Evidence from prefecture-level cities. Urban Stud. 2010, 47, 2217–2236. [Google Scholar]
- Tian, L.; Ge, B.; Li, Y. Impacts of state-led and bottom-up urbanization on land use change in the peri-urban areas of Shanghai: Planned growth or uncontrolled sprawl? Cities 2017, 476–486. [Google Scholar] [CrossRef]
- Thiers, P.; Stephan, M.; Walker, A. Differences in Regime and Structure within an Ecological Region: Comparing Environmental Governance in the Portland-Vancouver Metropolitan Area. In Proceedings of the 2011 Annual Meeting of the American Political Science Association, Seattle, WA, USA, 1–4 September 2011; SSRN: Rochester, NY, USA, 2011. [Google Scholar]
- Qian, H.; Wong, C. Master planning under urban-rural integration: The case of Nanjing, China. Urban Policy Res. 2012, 30, 403–421. [Google Scholar] [CrossRef]
- Xie, H.; Wang, W. Exploring the Spatial-Temporal Disparities of Urban Land Use Economic Efficiency in China and Its Influencing Factors under Environmental Constraints Based on a Sequential Slacks-Based Mode. Sustainability 2015, 7, 10171–10190. [Google Scholar] [CrossRef]
- Xie, H.; He, Y.; Xie, X. Exploring the factors influencing ecological land change for China’s Beijing-Tianjin-Hebei region using big data. J. Clean. Prod. 2017, 142, 677–687. [Google Scholar] [CrossRef]
- Zhao, P.; Lü, B.; Johan, W. Conflicts in urban fringe in the transformation era: An examination of performance of the metropolitan growth management in Beijing. Habitat Int. 2009, 33, 347–356. [Google Scholar] [CrossRef]
- Cheng, J.Q.; Turkstra, J.; Peng, M.J.; Du, N.; Ho, P. Urban land administration and planning in China: Opportunities and constraints of spatial data models. Land Use Policy 2006, 23, 604–616. [Google Scholar] [CrossRef]
- Wu, J.; Hobbs, R. Key issues and research priorities in landscape ecology: An idiosyncratic synthesis. Landsc. Ecol. 2002, 17, 355–365. [Google Scholar] [CrossRef]
- Feng, J.; Chen, Y. Spatiotemporal evolution of urban form and land-use structure in Hangzhou, China: Evidence from fractals. Environ. Plann. B Plann. Des. 2010, 37, 838–856. [Google Scholar] [CrossRef]
- Wang, J.; Cheng, Q.; Chen, J.A. GIS and remote sensing-based analysis of land use change using the asymmetric relation analysis method: A case study from the city of Hangzhou, China. Math. Geosci. 2011, 43, 435–453. [Google Scholar] [CrossRef]
- Liu, Z.; He, C.; Zhang, Q.; Huang, Q.; Yang, Y. Extracting the dynamics of urban expansion in China using DMSP-OLS nighttime light data from 1992 to 2008. Landsc. Urban Plan. 2012, 106, 62–72. [Google Scholar] [CrossRef]
- Taubenböck, H.; Wiesner, M.; Felbier, A.; Marconcini, M.; Esch, T.; Dech, S. New dimensions of urban landscapes: The spatio-temporal evolution from a polynuclei area to a mega-region based on remote sensing data. Appl. Geogr. 2014, 47, 137–153. [Google Scholar] [CrossRef]
- Zhu, J. Local developmental state and order in China’s urban development during transition. Int. J. Urban Reg. Res. 2004, 28, 424–447. [Google Scholar] [CrossRef]
- Schwarz, N. Urban form revisited—Selecting indicators for characterising European cities. Landsc. Urban Plan. 2010, 96, 29–47. [Google Scholar] [CrossRef]
- Kuang, W.; Chi, W.; Lu, D.; Dou, Y. A comparative analysis of megacity expansions in China and the US: Patterns, rates and driving forces. Landsc. Urban Plan. 2014, 132, 121–135. [Google Scholar] [CrossRef]
- Liu, Y.; Yue, W.; Fan, P.; Song, Y. Suburban residential development in the era of market-oriented land reform: The case of Hangzhou, China. Land Use Policy 2015, 42, 233–243. [Google Scholar] [CrossRef]
- Zhu, Q. Hangzhou. Cities 2015, 48, 42–54. [Google Scholar]
- McGarigal, K.; Cushman, S.A.; Ene, E. FRAGSTATS v4: Spatial Pattern Analysis Program for Categorical and Continuous Maps. Available online: http://www.umass.edu/landeco/research/fragstats/fragstats.html (accessed on 15 January 2016).
- Yu, X.J.; Ng, C.N. Spatial and temporal dynamics of urban sprawl along two urban-rural transects: A case study of Guangzhou, China. Landsc. Urban Plan. 2007, 79, 96–109. [Google Scholar] [CrossRef]
- Li, Y.; Zhu, X.; Sun, X.; Wang, F. Landscape effects of environmental impact on bay-area wetlands under rapid urban expansion and development policy: A case study of Lianyungang, China. Landsc. Urban Plan. 2010, 94, 218–227. [Google Scholar] [CrossRef]
- Kaza, N. The changing urban landscape of the continental United States. Landsc. Urban Plan. 2013, 110, 74–86. [Google Scholar] [CrossRef]
- Ma, L.J.C. Urban transformation in China, 1949–2000: A review and research agenda. Environ. Plan. A 2001, 34, 1545–1569. [Google Scholar] [CrossRef]
- Qian, Y.Y.; Weingast, B.R. China’s transition to markets: Market-preserving federalism, Chinese style. J. Policy Reform 1996, 1, 149–185. [Google Scholar] [CrossRef]
- Xie, H.; Wang, W.; Yang, Z.; Choi, Y. Measuring the sustainable performance of industrial land utilization in major industrial zones of China. Technol. Forecast. Soc. Chang. 2016, 112, 207–219. [Google Scholar] [CrossRef]
- Yeh, A.G.; Wu, F. The transformation of the urban planning system in China from a centrally-planned to transitional economy. Prog. Plan. 1999, 51, 167–252. [Google Scholar]
- Seto, K.C.; Fragkias, M. Quantifying spatiotemporal patterns of urban land-use change in four cities of China with time series landscape metrics. Landsc. Ecol. 2005, 20, 871–888. [Google Scholar] [CrossRef]
- Luo, X.; Shen, J. Why city-region planning does not work well in China the case of Suzhou-Wuxi-Changzhou. Cities 2008, 25, 207–217. [Google Scholar] [CrossRef]
- Su, S.; Liu, Z.; Xu, Y.; Li, J.; Pi, J. China’s megaregion policy: Performance evaluation framework, empirical findings and implications for spatial polycentric governance. Land Use Policy 2017, 63, 1–19. [Google Scholar] [CrossRef]
- Zhang, Q.; Su, S. Determinants of urban expansion and their relative importance: A comparative analysis of 30 major metropolitans in China. Habitat Int. 2016, 58, 89–107. [Google Scholar] [CrossRef]
- Su, S.; Jiang, Z.; Zhang, Q.; Zhang, Y. Transformation of agricultural landscapes under rapid urbanization: A threat to sustainability in Hang-Jia-Hu region, China. Appl. Geogr. 2011, 31, 439–449. [Google Scholar] [CrossRef]
- Su, S.; Hu, Y.; Luo, F.; Mai, G.; Wang, Y. Farmland fragmentation due to anthropogenic activity in rapidly developing region. Agric. Syst. 2014, 131, 87–93. [Google Scholar] [CrossRef]
- You, H. Quantifying megacity growth in response to economic transition: A case of Shanghai, China. Habitat Int. 2016, 53, 115–122. [Google Scholar] [CrossRef]
- You, H. Agricultural landscape dynamics in response to economic transition: Comparisons between different spatial planning zones in Ningbo region, China. Land Use Policy 2017, 61, 316–328. [Google Scholar] [CrossRef]
- You, H. Quantifying the coordinated degree of urbanization in Shanghai, China. Qual. Quant. 2016, 50, 1273–1283. [Google Scholar] [CrossRef]
- Wen, H.; Zhang, Y.; Zhang, L. Assessing amenity effects of urban landscapes on housing price in Hangzhou, China. Urban For. Urban Green. 2015, 14, 1017–1026. [Google Scholar] [CrossRef]
- Yao, G.; Xie, H. Rural spatial restructuring in ecologically fragile mountainous areas of southern China: A case study of Changgang Town, Jiangxi Province. J. Rural Stud. 2016, 47, 435–448. [Google Scholar] [CrossRef]
- Burger, M.; Meijers, E. Form follows function? Linking morphological and functional polycentricity. Urban Stud. 2012, 49, 1127–1149. [Google Scholar] [CrossRef]
- Lu, D.S.; Weng, Q.H. Spectral mixture analysis of the urban landscape in Indianapolis with landsat etm plus imagery. Photogramm. Eng. Remote Sens. 2004, 70, 1053–1062. [Google Scholar] [CrossRef]
- Masek, J.G.; Lindsay, F.E.; Goward, S.N. Dynamics of urban growth in the Washington DC metropolitan area, 1973–1996, from landsat observations. Int. J. Remote Sens. 2000, 21, 3473–3486. [Google Scholar] [CrossRef]
- Huang, S.L.; Wang, S.H.; William, W.B. Sprawl in Taipei’s peri-urban zone: Responses to spatial planning and implications for adapting global environmental change. Landsc. Urban Plan. 2009, 90, 20–32. [Google Scholar] [CrossRef]
- Hossein, S.M.; Marco, H. Spatiotemporal variability of urban growth factors: A global and local perspective on the megacity of Mumbai. Int. J. Appl. Earth Obs. Geoinf. 2015, 35, 187–198. [Google Scholar]
- Xie, H.; Yafen, H.E.; Zou, J.; Qun, W. Spatio-temporal difference analysis of cultivated land use intensity based on emergy in the Poyang Lake Eco-economic Zone of China. J. Geogr. Sci. 2016, 26, 1412–1430. [Google Scholar] [CrossRef]
- Xie, H.; Yao, G.; Liu, G. Spatial evaluation of the ecological importance based on GIS for environmental management: A case study in Xingguo county of China. Ecol. Indic. 2015, 51, 3–12. [Google Scholar] [CrossRef]
Figure 1.
Study framework.

Figure 2.
Study area location.

Figure 3.
Plan-making logic framework.
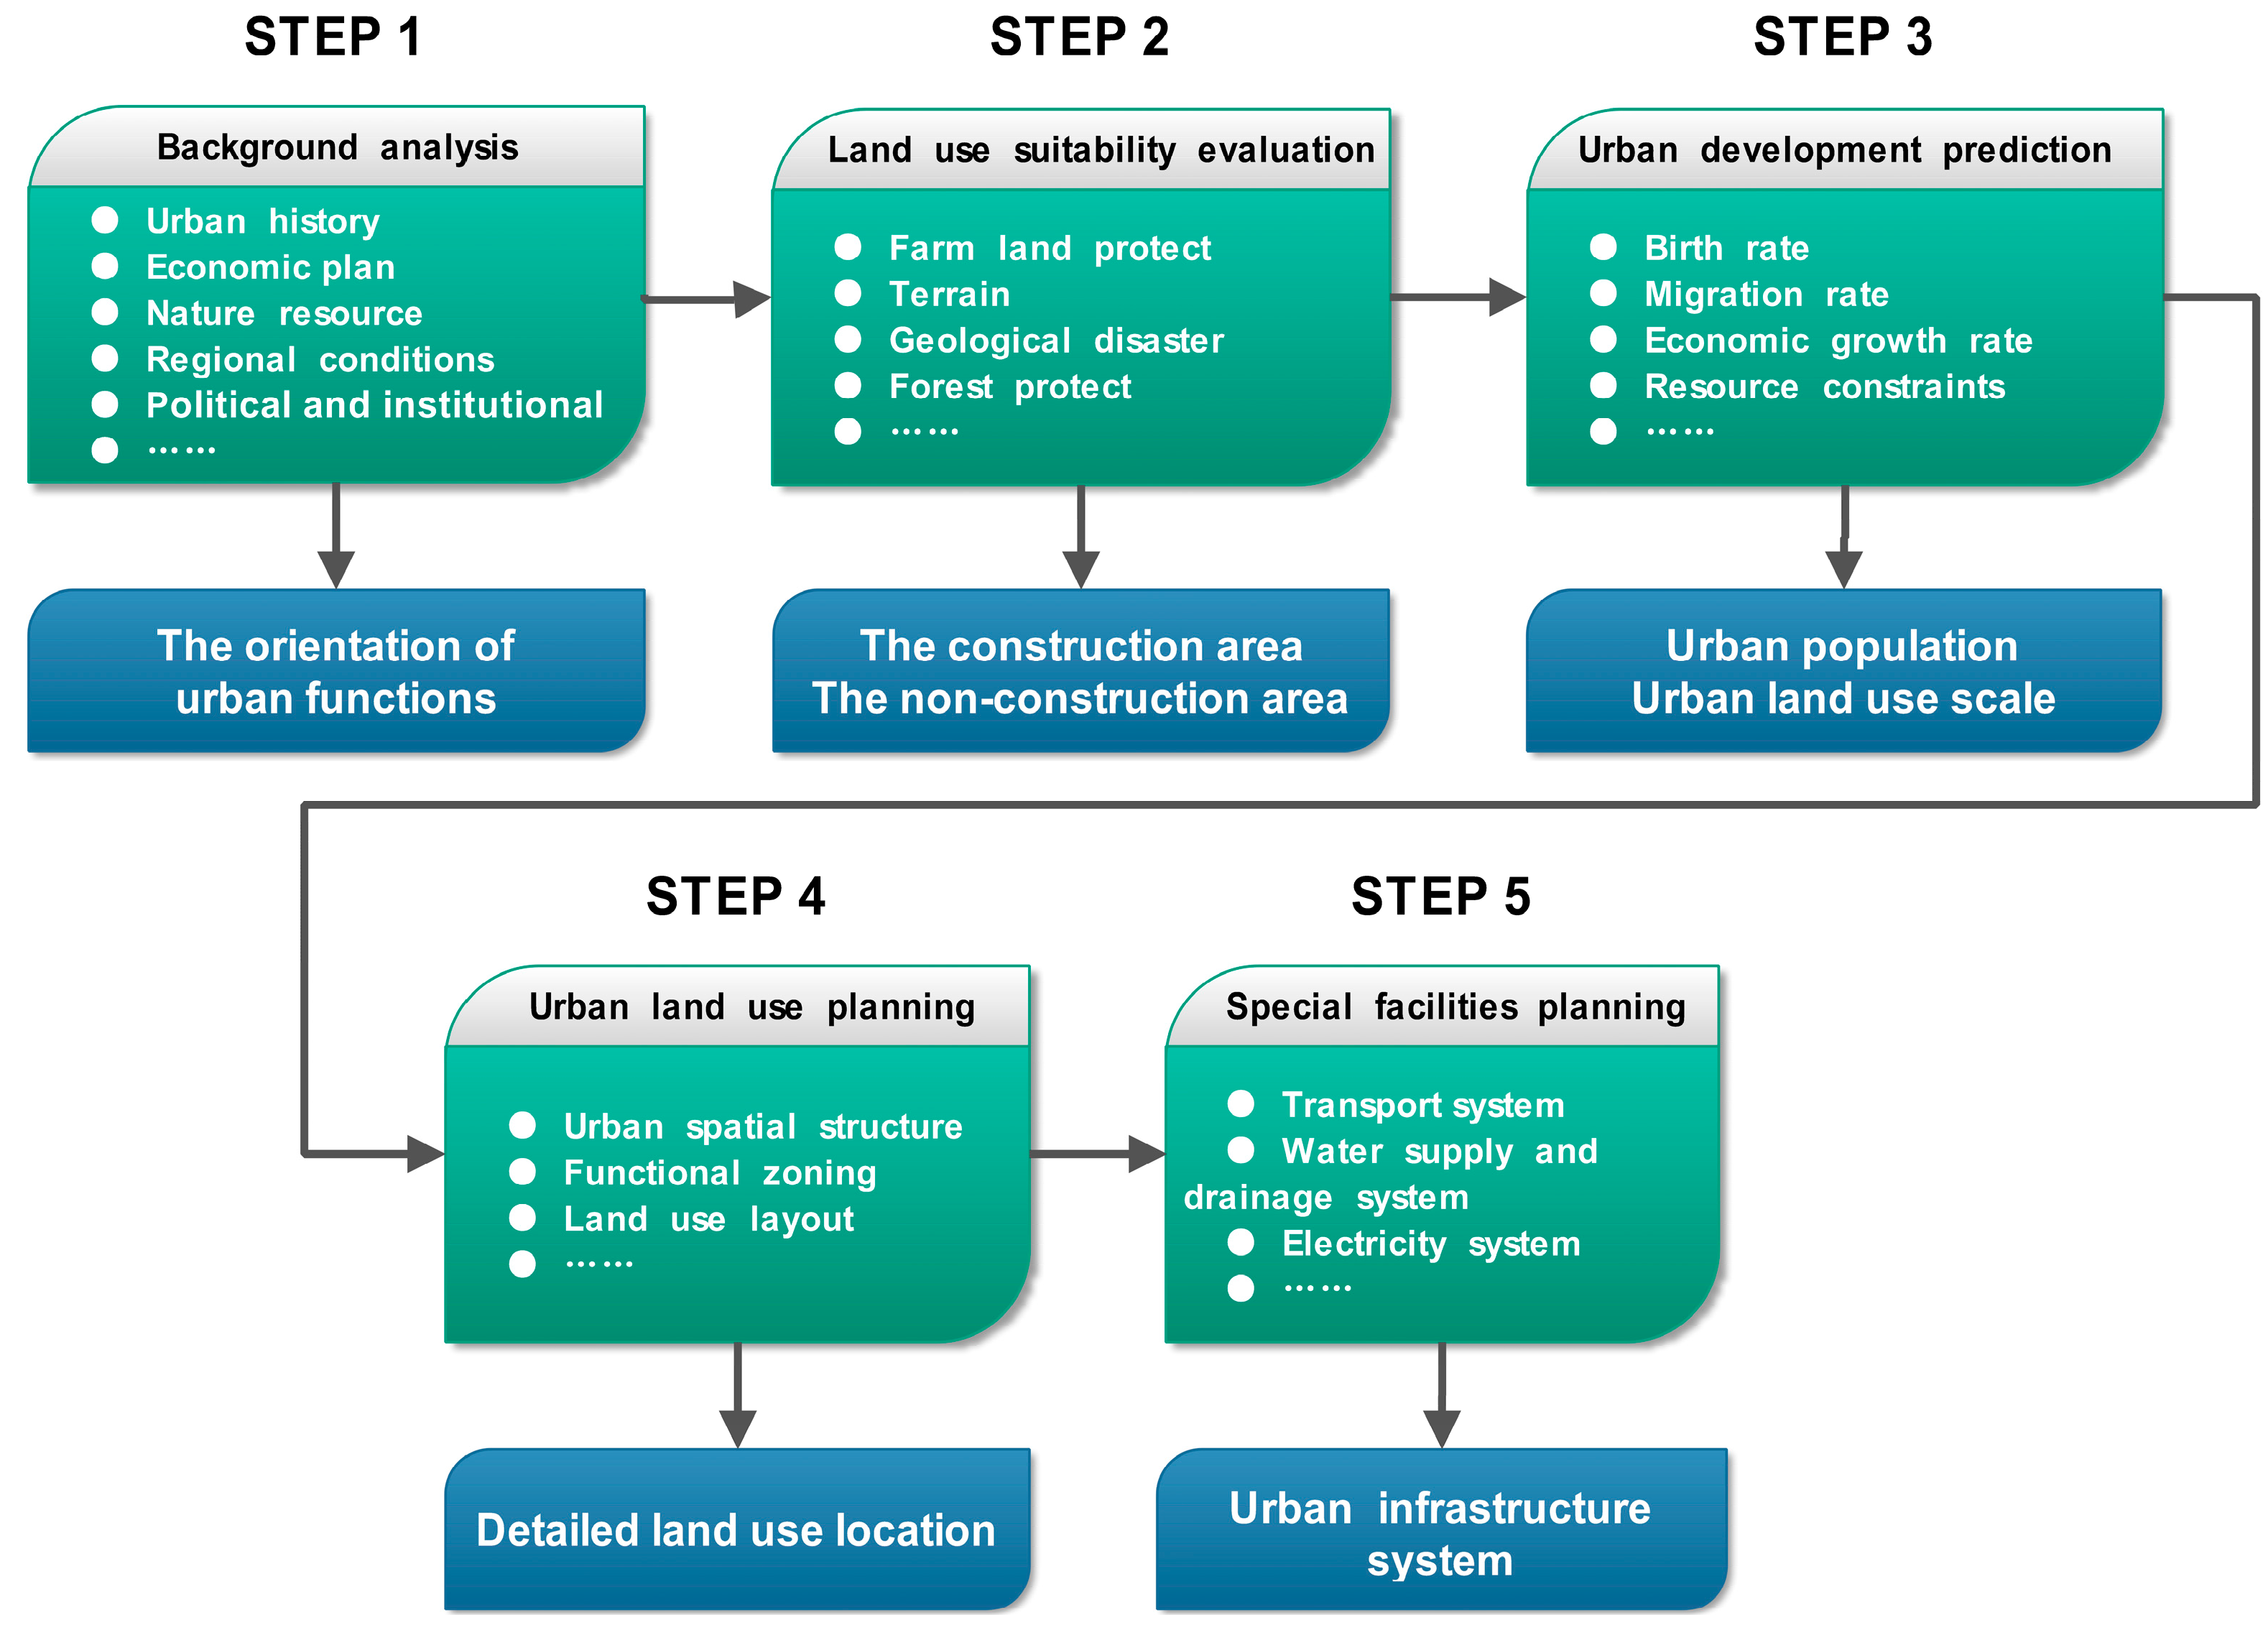
Figure 4.
Fluctuation of landscape metrics for Hangzhou’s spatial patterns (1985–2013). (a) Five metrics of urban land; (b) Five metrics of farm land; (c) Two metrics of urban land; (d) Two metrics of farm land; (e) Two metrics of the landscape level. Number of Patches (NP); Mean Patch Area (MPA); Largest Patch Index (LPI); Area Weight Mean Shape Index (AWMSI); Interspersion and Juxtaposition Index (IJI); Area Weight Mean Patch Fractal Dimension Index (AWMPFDI); Patch Cohesion Index (PCI); Contagion Index (CI); Shannon’s Diversity Index (SHDI).

Figure 5.
Fluctuation of landscape metrics for Hangzhou’s spatial patterns (1985–2013).
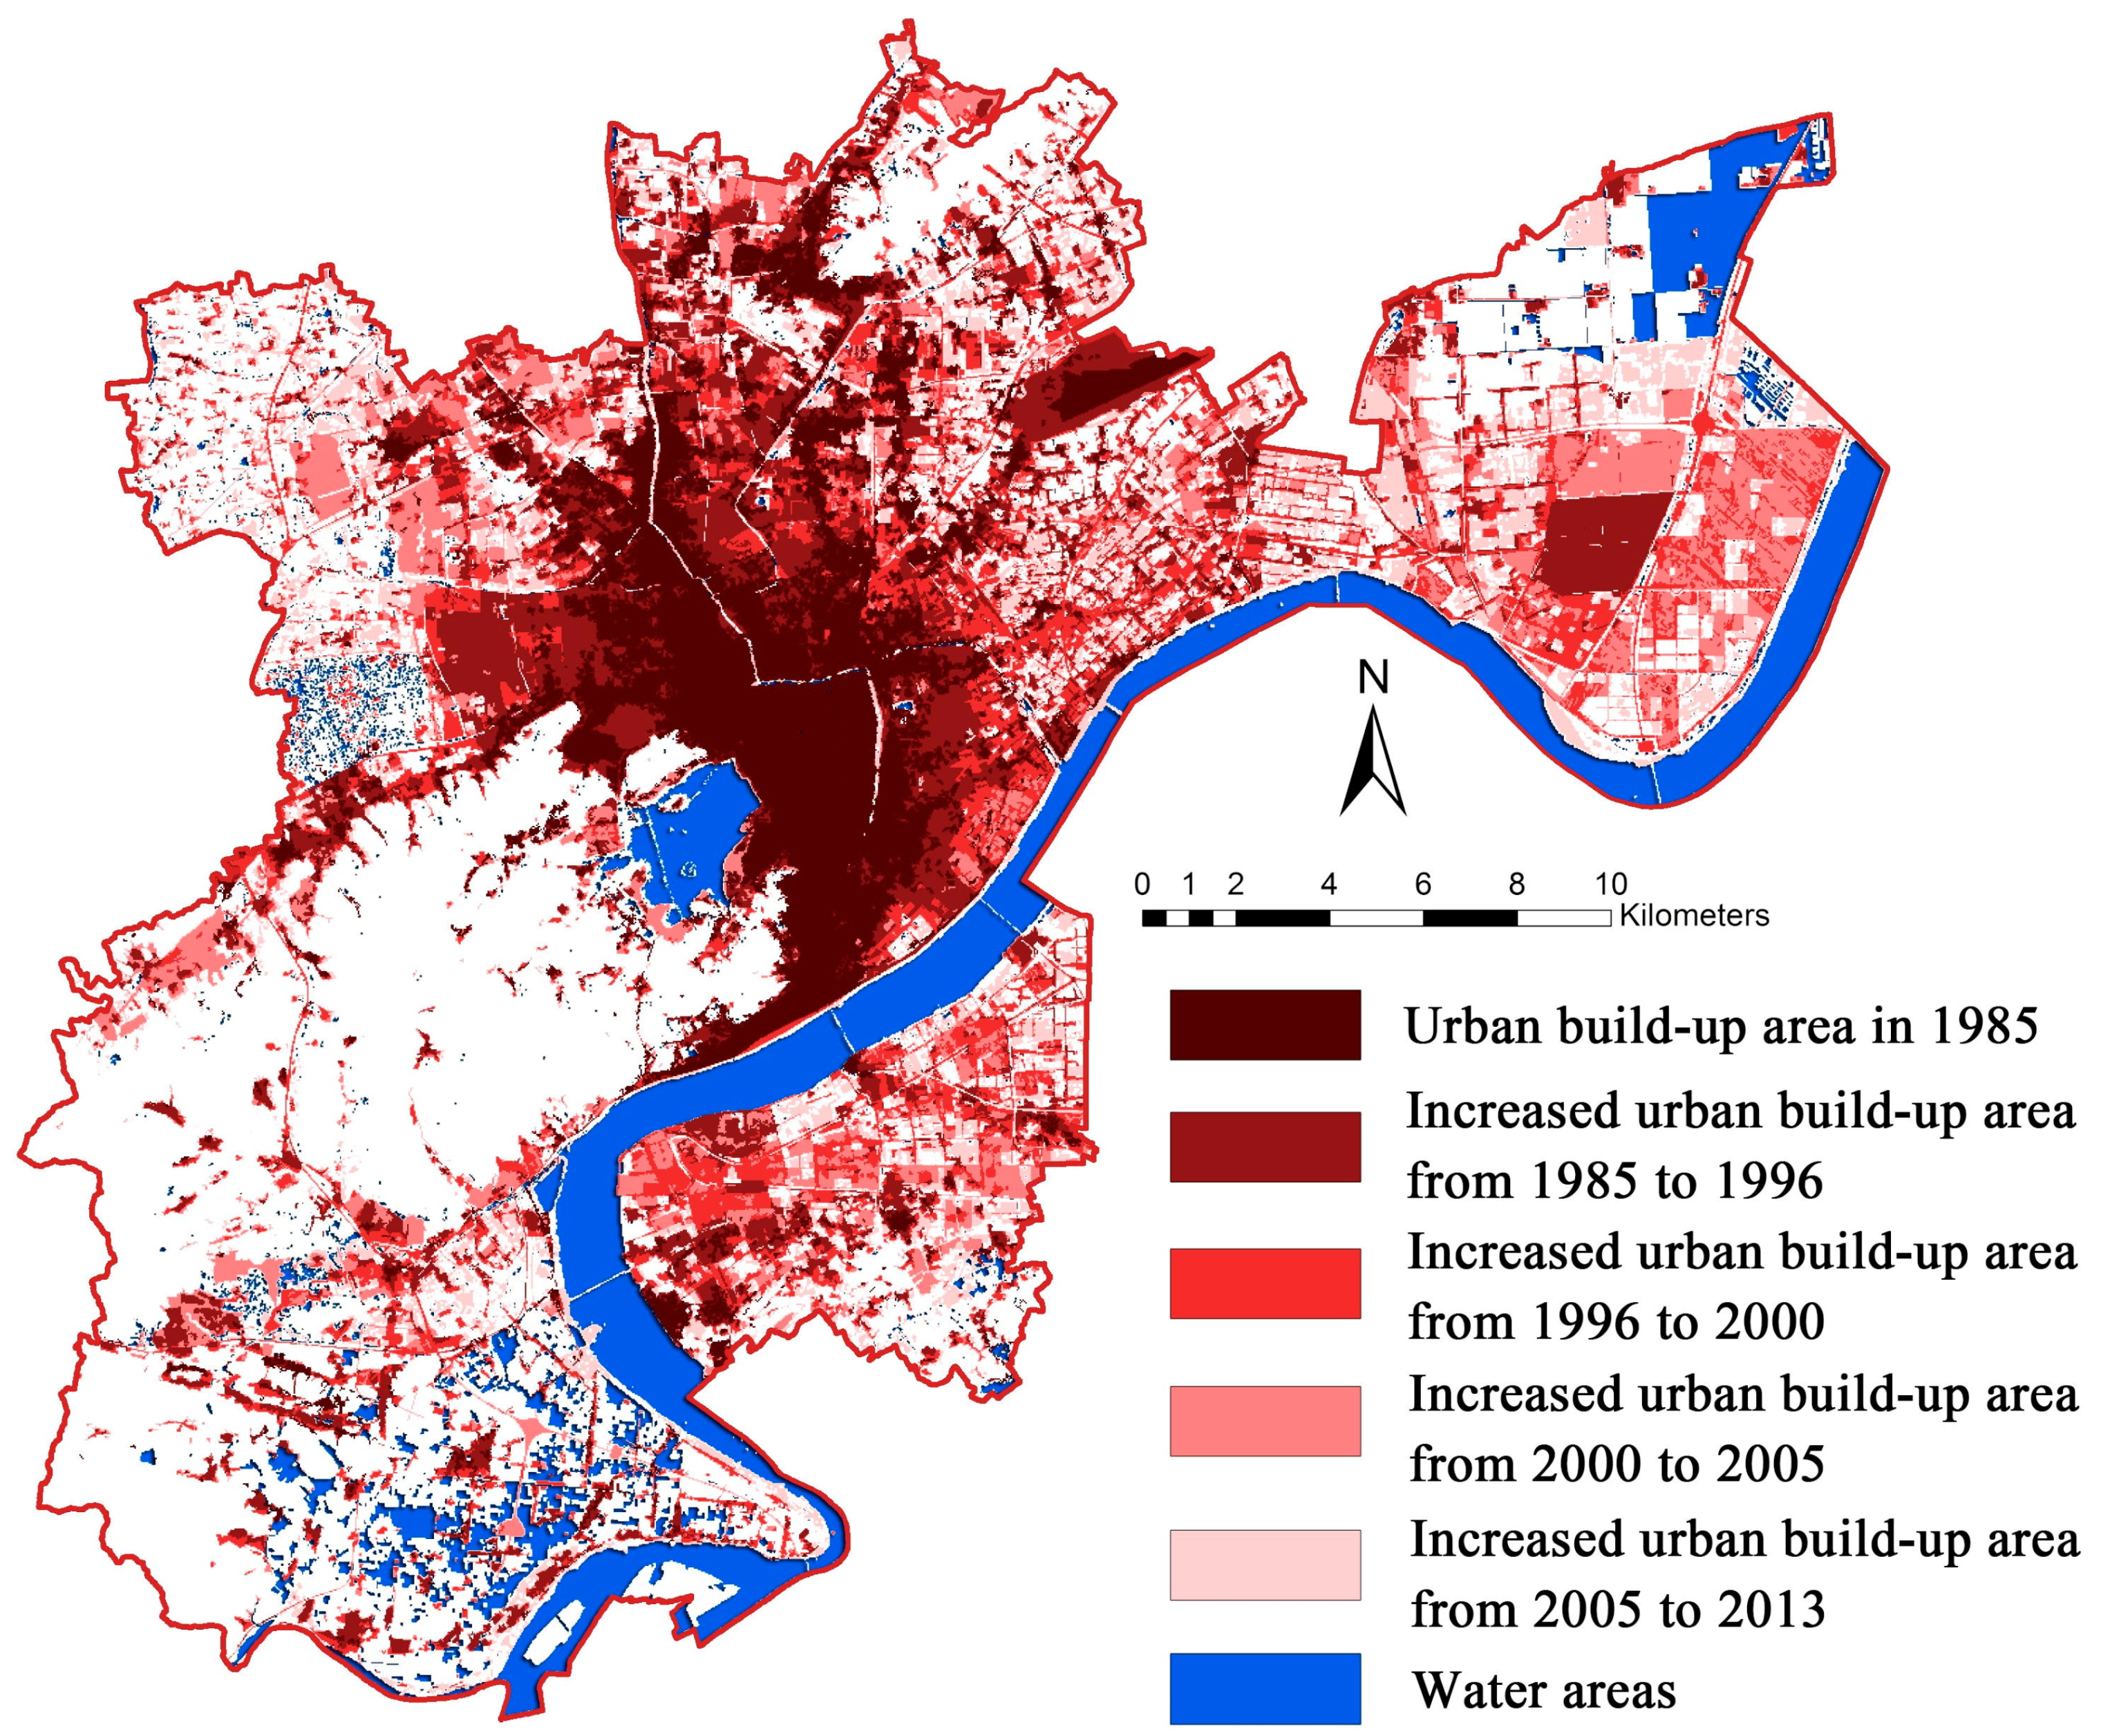
Figure 6.
Comparative analysis of planning and implementation in Hangzhou. Abbreviation: Urban growth boundary (UGB).
Figure 6.
Comparative analysis of planning and implementation in Hangzhou. Abbreviation: Urban growth boundary (UGB).
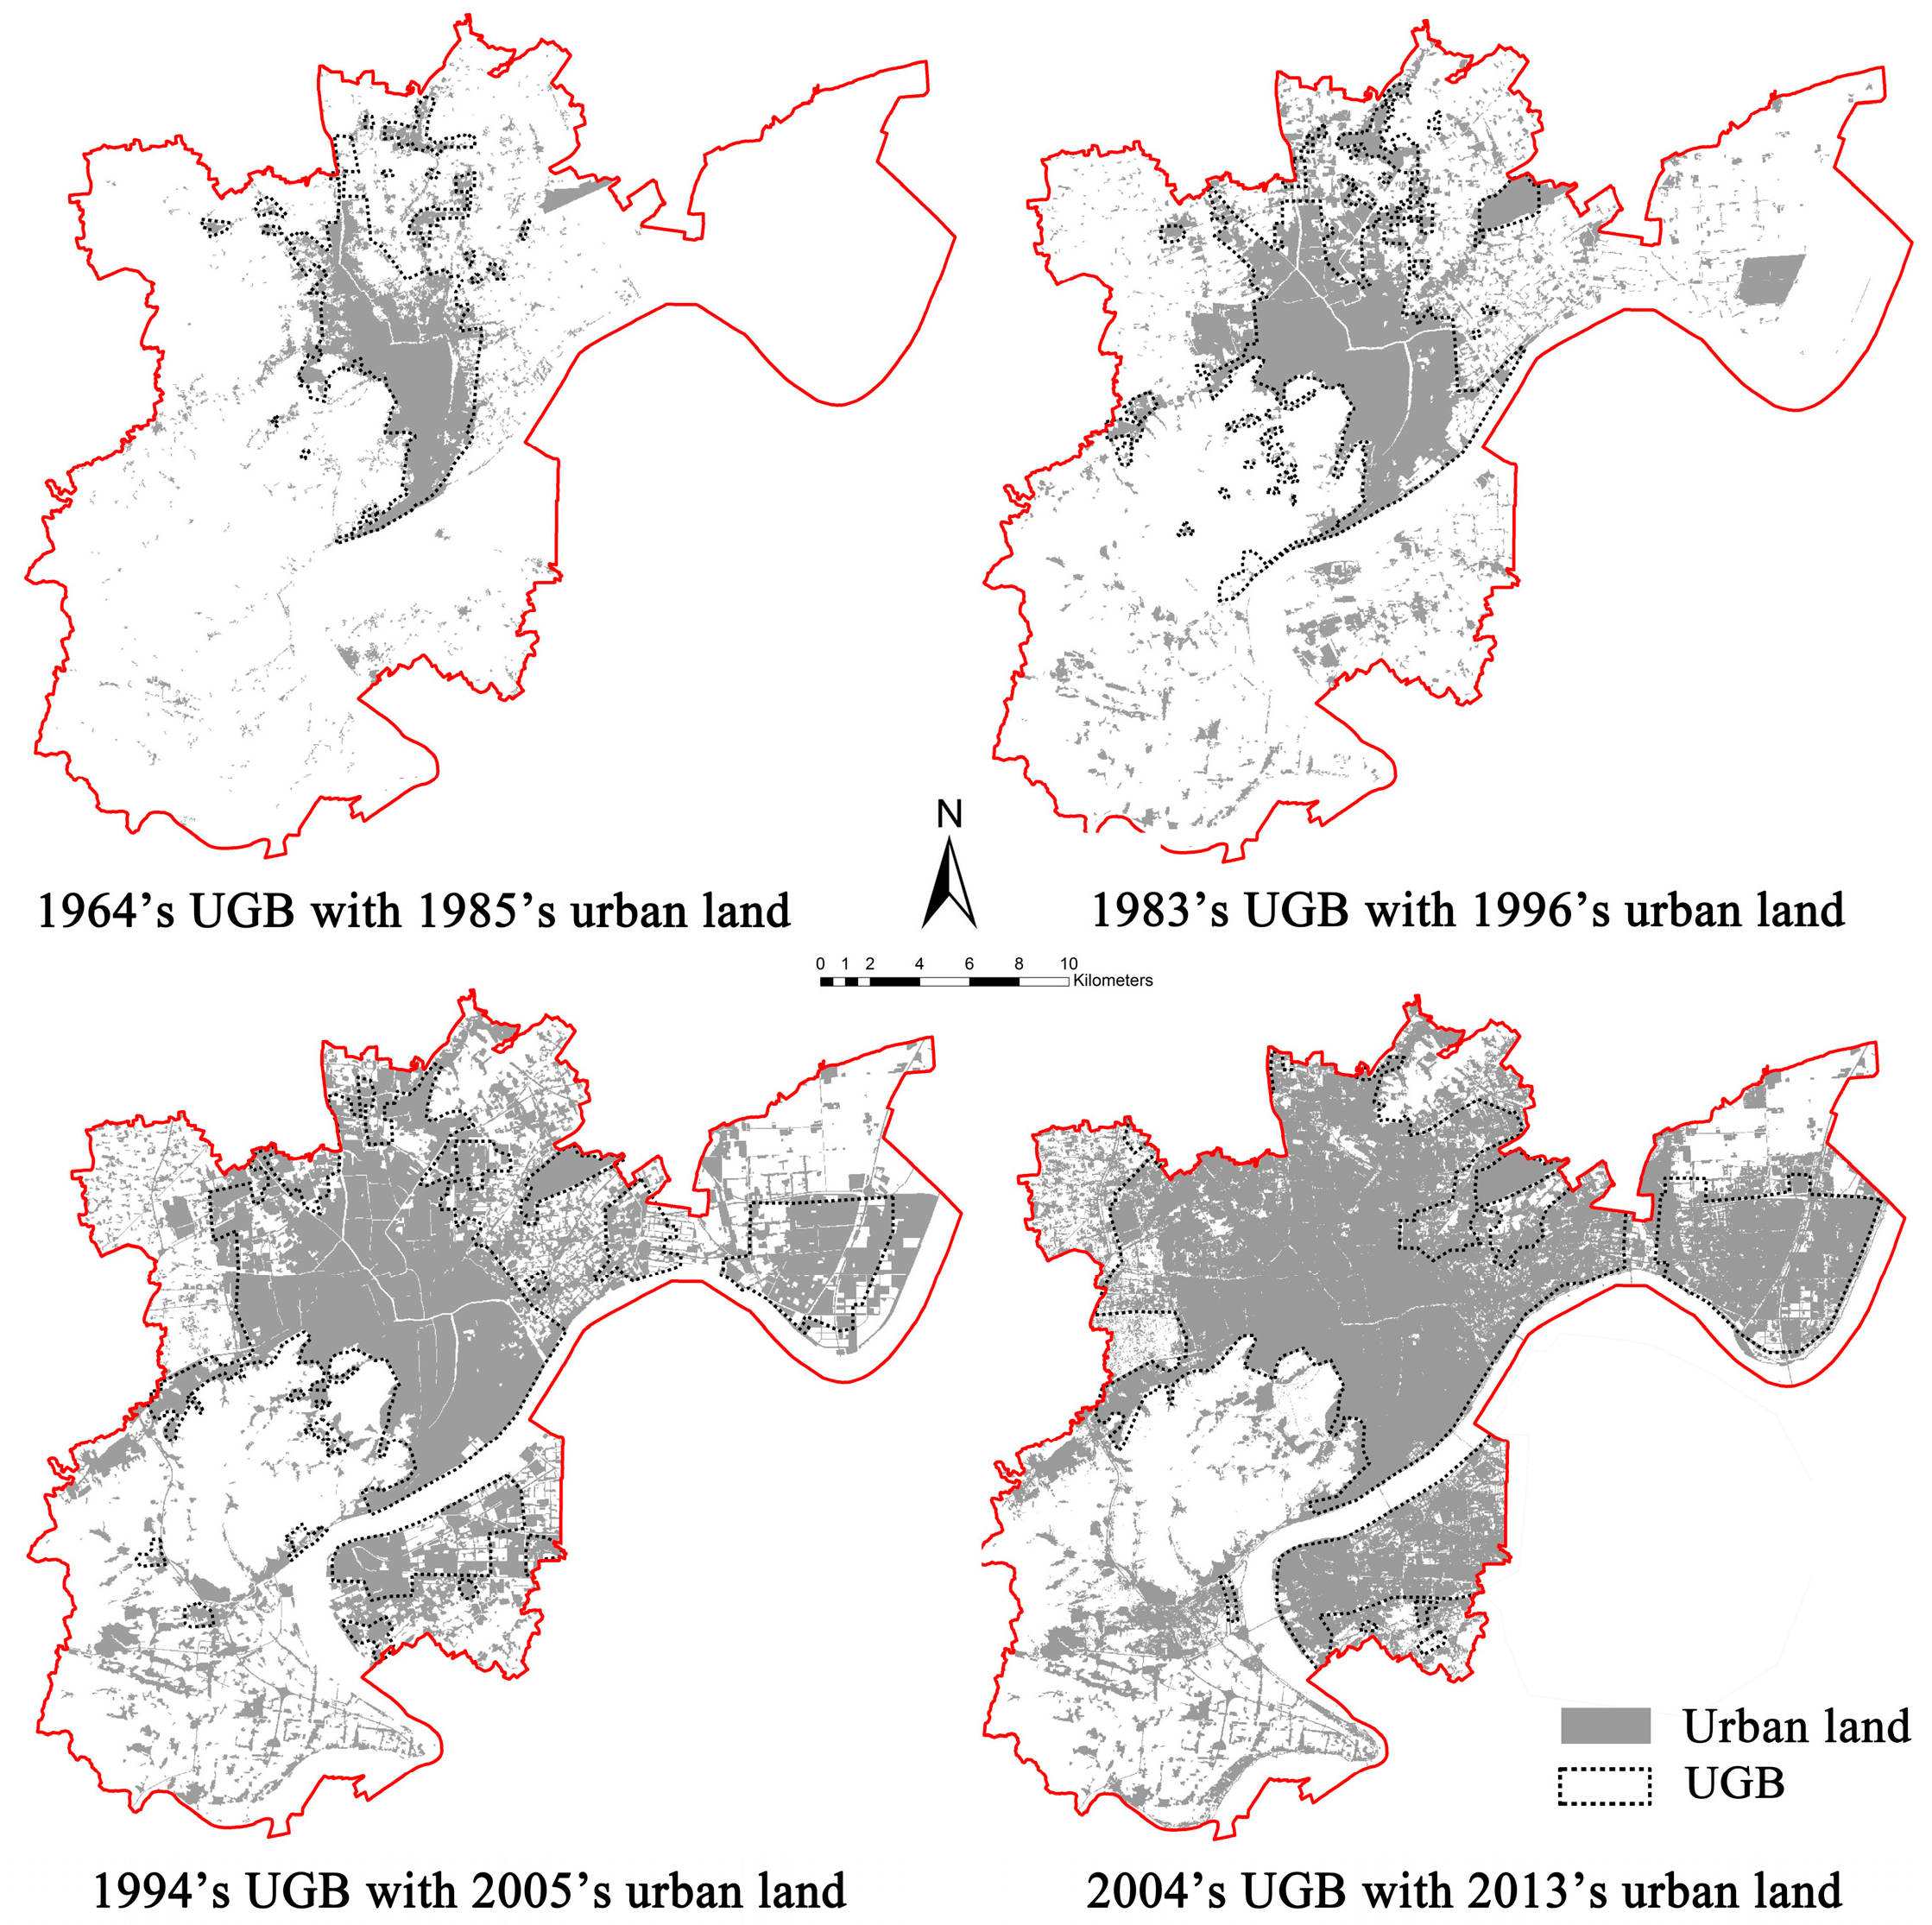
Figure 7.
Comparative analysis of the control effectiveness indicators.

Figure 8.
Change in population density and distribution of important functional zones.

Figure 9.
Evolution of Hangzhou’s GDP (Gross Domestic Product).

Figure 10.
The contradiction between population growth and prediction.

Figure 11.
Difference between master planning and local planning boundaries.


Table 1.
Remote sensing images.
| System | Satellite | Path/Row | Date of Acquisition | Band | Spatial Resolution (Pixel Size—Meters) |
|---|---|---|---|---|---|
| Landsat TM | Landsat-5 | P119/R39 | 11 January 1985 | 1, 2, 3, 4, 5, 7 | 30 |
| Landsat TM | Landsat-5 | P119/R39 | 9 December 1995 | 1, 2, 3, 4, 5, 7 | 30 |
| Landsat ETM+ | Landsat-7 | P119/R39 | 4 May 2000 | 1, 2, 3, 4, 5, 7 | 30 |
| Landsat ETM+ | Landsat-7 | P119/R39 | 17 October 2005 | 1, 2, 3, 4, 5, 7 | 30 |
| Landsat OLI | Landsat-8 | P119/R39 | 19 July 2013 | 2, 3, 4, 5, 6, 7 | 30 |
| Index | Formula | Level | Purpose of Use |
|---|---|---|---|
| Number of Patches (NP) | Class level | Measuring fragmentation | |
| Mean Patch Area (MPA) | Class level | Measuring fragmentation | |
| Largest Patch Index (LPI) | Class level | Measuring dominance | |
| Area-Weight Mean Shape Index (AWMSI) | Class level | Measuring fragmentation | |
| AreaWeight Mean Patch Fractal Dimension Index (AWMPFDI) | Class level | Measuring fragmentation | |
| Interspersion and Juxtaposition Index (IJI) | Class level | Measuring aggregation | |
| Patch Cohesion Index (PCI) | Class level | Measuring connectivity | |
| Contagion Index (CI) | Landscape level | Measuring aggregation | |
| Shannon’s Diversity Index (SHDI) | Landscape level | Measuring diversity |
Notes: A = total landscape area (m2); n = number of patches in the landscape of patch type i; j = 1, ..., n patches; aij = area (m2) of patch ij; Pij = perimeter (m) of patch ij; eik = total length (m) of edge in landscape between patch types i and k; Pi = proportion of the landscape occupied by patch type i; m = number of patch types present in the landscape, including the landscape border if present; gik = number of adjacencies between pixels of patch types i and k based on the double-count method; gii = number of like adjacencies between pixels of class type i based on the single-count method.
Table 3.
Planning control effectiveness indexes.
| Assessment Dimensions | Index | Formation and Note | Description |
|---|---|---|---|
| The control effect of spatial scale | Overflow index (OI) | OI is used to measure the control effectiveness of the spatial scale, and greater is the value of OI, more effective is the urban planning control measure [11]. | |
| ai is the ith urban land patch area inside the planned districts, bj is the jth urban land patch area outside the planned districts. (i = 1, 2, 3, …, m), (j = 1, 2, 3, …, n) | |||
| Annual average overflow area (AAOA) | AAOA is used to measure the control effectiveness of the spatial scale like OI, and greater is the value of OI, worse is the urban planning control effect. | ||
| bi is the ith urban land patch area outside the planned districts, myear is the planning period. (i = 1, 2, 3, …, n) | |||
| The control effect of spatial structure | Multi-centerconsistency index (MCI) | MCI is used to the control effectiveness of the spatial structure. Higher MCI indicates that the planning control of the urban spatial structure is more effective. | |
| aij is the jth urban land patch area inside the planned districts in the ith group, bi is the total urban land area of the ith group, m is the number of groups. (i = 1, 2, 3, …, m), (j = 1, 2, 3, …, n) | |||
| Centrifugal diffusion index(CDI) | CDI is used to the control effectiveness of the spatial structure. Higher is the value of CDI, more effective is the planning control effectiveness of the urban spatial structure. | ||
| (xi, yi) is the geographic center of the ith urban land patch, (xj, yj) is the geographic center of the planning urban land patch, (xo, yo) is the geographic center of the total urban land, m is the number of geographic centers of urban land patches, n is the number of geographic centers of the planning urban land patches. (i = 1, 2, 3, …, m), (j = 1, 2, 3, …, n) | |||
| Traffic guiding index (TGI) | TDI is used to the control effectiveness of the spatial structure and clarify the influences of the planning transport facilities on urban sprawl. Smaller is the value of TDI, more effective is the planning control effectiveness of the urban spatial structure. | ||
| (xi, yi) is the geographic center of the ith urban land patch, (xj, yj) is the coordinate of the major road, az is the parameter of the major road, n is the number of geographic centers of urban land patches. (i = 1, 2, 3, …, n), (z = 1, 2, 3, …, m) | |||
| The control effect of spatial pattern | Development direction indexes (DDI) | (notes of deviation orientation) | DDI is used to the control effectiveness of the spatial pattern. It reflects the accuracy of the planning’s prediction on urbanization. |
| (x1, y1) is the geographic center of the total urban land, (x2, y2) is the geographic center of the planning urban land. | |||
| Bouncing development index (BDI) | BDI is used to the control effectiveness of the spatial pattern. It reflects the planning control effects on the compactness of the urban development. Lower is BDI, higher is the efficiency of the planning control. | ||
| (xi, yi) is the geographic center of the ith urban land patch outside the planned districts, (xj, yj) is the coordinate of the planning boundary, az is the parameter of the planning boundary, n is the number of geographic centers of urban land patches outside the planned districts. (i = 1, 2, 3, …, n), (z = 1, 2, 3, …, m) | |||
| Boundary consistency index (BCI) | BCI is used to the control effectiveness of the spatial pattern. Higher is BCI, higher is the efficiency of the planning control [11]. | ||
| L1 is the length of coincidence lines of urban land patches and the planning urban land patches; L2 is the length of the planning boundary. |
Table 4.
Statistics of land use cover for different periods.
| Land Classification | 1985 | 1995 | 2000 | 2005 | 2013 | |||||
|---|---|---|---|---|---|---|---|---|---|---|
| Area (km2) | Ratio (%) | Area (km2) | Ratio (%) | Area (km2) | Ratio (%) | Area (km2) | Ratio (%) | Area (km2) | Ratio (%) | |
| Urban land | 69.54 | 9.85 | 146.9 | 20.80 | 223.2 | 31.60 | 293.07 | 41.50 | 318.72 | 45.13 |
| Farm land | 417.58 | 59.13 | 315.85 | 44.72 | 216.92 | 30.72 | 140.25 | 19.86 | 163.39 | 23.14 |
| Other lands (including water, forest, bare land, rural land, etc.) | 219.11 | 31.03 | 243.48 | 34.48 | 266.11 | 37.68 | 272.91 | 38.64 | 224.12 | 31.73 |
Table 5.
Calculated results for the control effectiveness indicators.
| Dimensions | Spatial Index of Planning Control Effectiveness | Period I: 1964–1985 | Period II: 1983–1995 | Period III: 1994–2005 | Period IV: 2004–2013 |
|---|---|---|---|---|---|
| The control effect of spatial scale | Overflow index (OI) | 52.53% | 88.86% | 72.34% | 40.14% |
| Annual average overflow area (AAOA) | 1.09 km2 | 4.94 km2 | 10.25 km2 | 9.13 km2 | |
| The control effect of spatial structure | Multi-center consistency index (MCI) | 51.95% | 48.12% | 69.12% | 46.91% |
| Centrifugal diffusion index (CDI) | 2782.93 m | 2723.27 m | 3844.82 m | 3423.02 m | |
| Traffic guiding index (TGI) | 1.41 km | 1.50 km | 1.30 km | 0.99 km | |
| The control effect of spatial pattern | Development direction indexes (DDI) | 974.18 m | 860.25 m | 1262.71 m | 872.43 m |
| Southeast | Southeast | Southwest | Southeast | ||
| Bouncing development index (BDI) | 3233.55 m | 3329.88 m | 2250.85 m | 1114.66 m | |
| Boundary consistency index (BCI) | 0.32 | 0.26 | 0.25 | 0.24 |
Table 6.
Comparison of key contents in planning of Hangzhou in different periods.
| Planning | Political and Economic Background | Planned Urban Population | Planned Urban Development Land Area | Functional Orientation | Key Focus of Spatial Layout | ||
|---|---|---|---|---|---|---|---|
| Population (Million) | Year for Predict | Land use Area (km2) | Year for Predict | ||||
| 1964 Master Plan (The forward period 1984) | The Great Leap Forward; Planned economy system; “the Great Cultural Revolution” | 0.80 | 1984 | 70 | 1984 | An industrial city and tourist city | Develop northward; build new urban center (Wulin CBD); Industries development in suburban. |
| 1983 Master Plan (The recent period 1985, The forward period 2000) | Since the reform and opening up, the planned economy system transformed to the market economy system | 1.13 1.15 (planned) 1.20 (planned) | 1981 1985 2000 | 102 111 (planned) 139 (planned) | 1981 1985 2000 | Provincial capital, famous historic and cultural city, National key scenic tourist city | Protect the West Lake; Build new urban center (Qianjiang CBD); Old city reconstruction; Outsourcing industries; develop satellite town. |
| 1994 Master Plan (The recent period 2000, The forward period 2010) | The planned economy system transformed to the market economy system (included land institutions reform) | 1.41 1.68 (planned) 2.08 (planned) | 1994 2000 2010 | No data 126 (planned) 156 (planned) | 1994 2000 2010 | International key scenic tourist city, famous historic and cultural city, important center city of Yangtze river delta, Provincial capital (Economic and cultural science and education center) | Focus on developing the third industry district; Develop northward and southward; Polycentric development and cross river development |
| 2004 Master Plan (The recent period 2010, The forward period 2020) | The planned economy system transformed to the market economy system, participate in WTO | 1.81 2.21 (planned) 2.45 (planned) | 2001 2010 2020 | 150.95 189.15 (planned) 221.48 (planned) | 2001 2010 2020 | Important center city of Yangtze river delta, Provincial capital (Economic and cultural science and education center), International key scenic tourist city, famous historic and cultural city | Major city and subcenters (Xiasha, Binjiang and Linping);Cross river development; Protect ecological zones |
Source: Compiled by the author based on the master plans from Hangzhou Urban Planning Bureau.
© 2017 by the authors. Licensee MDPI, Basel, Switzerland. This article is an open access article distributed under the terms and conditions of the Creative Commons Attribution (CC BY) license (http://creativecommons.org/licenses/by/4.0/).
Share and Cite
MDPI and ACS Style
Wu, Y.; Fan, P.; Li, B.; Ouyang, Z.; Liu, Y.; You, H. The Effectiveness of Planning Control on Urban Growth: Evidence from Hangzhou, China. Sustainability 2017, 9, 855. https://doi.org/10.3390/su9050855
AMA Style
Wu Y, Fan P, Li B, Ouyang Z, Liu Y, You H. The Effectiveness of Planning Control on Urban Growth: Evidence from Hangzhou, China. Sustainability. 2017; 9(5):855. https://doi.org/10.3390/su9050855
Chicago/Turabian StyleWu, Yizhou, Peilei Fan, Bo Li, Zutao Ouyang, Yong Liu, and Heyuan You. 2017. "The Effectiveness of Planning Control on Urban Growth: Evidence from Hangzhou, China" Sustainability 9, no. 5: 855. https://doi.org/10.3390/su9050855
Note that from the first issue of 2016, this journal uses article numbers instead of page numbers. See further details here.