Case Report

Lifting the Information Barriers to Address Sustainability Challenges with Data from Physical Geography and Earth Observation

1
enviroSPACE, Department F.-A. Forel for Environmental and Aquatic Sciences, Institute for Environmental Sciences, University of Geneva, 66 Bd. Carl-Vogt, CH-1205 Geneva, Switzerland
2
Natural Capital Project, Woods Institute for the Environment, Stanford University, 371 Serra Mall, Stanford, CA 94305, USA
3
GRID-Geneva, Institute for Environmental Sciences, University of Geneva, 66 Bd. Carl-Vogt, CH-1205 Geneva, Switzerland
4
Google, Mountain View, CA 94043-1351, USA
5
Berkeley Institute for Data Science, University of California, Berkeley, 190 Doe Library, Berkeley, CA 94720, USA
6
Marine Science Institute, University California of Santa Barbara, Santa Barbara, CA 93106-6150, USA
*
Author to whom correspondence should be addressed.
Sustainability 2017, 9(5), 858; https://doi.org/10.3390/su9050858
Submission received: 30 March 2017 / Revised: 1 May 2017 / Accepted: 5 May 2017 / Published: 19 May 2017
(This article belongs to the Special Issue Physical Geography and Environmental Sustainability)

Abstract

:
Sustainability challenges demand solutions, and the pace of technological and scientific advances in physical geography and Earth observation have great potential to provide the information needed to address these challenges. This paper highlights five online tools and initiatives that are lifting barriers to address these challenges. The enviroGRIDS project in the Black Sea catchment demonstrates how the use of spatial data infrastructures can facilitate data sharing. Google Earth Engine is providing solutions to challenges of processing big data into usable information. Additionally, application programming interfaces allow outsiders to elaborate and iterate on programs to explore novel uses of data and models, as seen in the Berkeley Ecoinformatics Engine. Finally, collaborative mapping tools, such as Seasketch/MarineMap and the InVEST software suite, allow engagement within and between groups of experts and stakeholders for the development, deployment, and long-term impact of a project. Merging these different experiences can set a new standard for online information tools supporting sustainable development from evidence brought by physical geography combined with socioeconomic conditions.

1. Introduction

With mounting pressure on lands, waters, and vital natural resources, information from physical geography about how to steward natural systems has never been more precious. The United Nations (UN) has agreed on a new agenda to address these challenges by proposing 17 Sustainable Development Goals (SDGs) and 169 associated targets for 2030 [1]. This is a plan of action to protect the planet from degradation, including through sustainable consumption and production, sustainably managing natural resources, and taking urgent action on climate change in order to support the needs of current and future generations.
Data from Earth observation (www.data4sdgs.org), combined with models from physical geography, demographics, and statistical data, can provide the necessary information to inform about the SDG targets by building indicators at various scales. The aim is to trigger action based on data-driven decision-making processes and inform the public. Indeed, Earth observations operate globally at higher and higher spatial and temporal resolutions, in real-time, becoming a cost-effective solution to monitor progress toward a more sustainable future. Inevitably, geography recognized the importance of location to most of the SDGs and related targets, bringing a new opportunity for geospatial information to play a key role in monitoring and informing about SDGs in the coming decades [2].
In order to avoid redundancy and dissonance, the new SDG framework should be linked to existing environmental policies. For instance, SDGs 14 and 15, which are about promoting the sustainable use of water and land ecosystems and halt biodiversity loss, should be in-line with the Aichi targets for 2020 defined by the Convention on Biological Diversity [3]. The Global Biodiversity Outlook gives an interim assessment of the progress towards these targets [4]. The Group on Earth Observation Biodiversity Observation Network further outlines the distributed network of databases [5] needed to measure the Essential Biodiversity Variables [6,7] that are useful to assess the Aichi targets. For policy links to the other SDGs presented in Figure 1, a table is provided in Annex 1.
In all of these cases, the SDG agenda recognizes that data needed for assessing several targets is not broadly available [8]. This means that data collection must be improved in order to establish national and international baselines. The UN calls for new ways to foster and promote innovation to fill data gaps, mobilize resources to overcome inequalities between developed and developing countries, and between data-poor and data-rich regions, and lead and coordinate the data revolution into its full role for sustainable development. The expectation is that existing international environmental institutions should regularly evaluate the progress toward sustainable development. Scientists have identified five priorities for better contributing to this process: devise metrics; establish monitoring mechanisms; evaluate progress; enhance infrastructures; and standardize and verify data [9]. These priorities are critical for improving policy and better informing decisions, but must go beyond traditional economic valuation to incorporate societal and environmental values. Furthermore, any measurements or models must be readily accessible, globally applicable, replicable, shareable, and relevant to specific decisions and the stakeholders making them.
However, against this backdrop of ambitious goal setting, the planet has already passed some of its own resource boundaries [10] through global changes, as demonstrated by physical geography, making the sustainability challenges greater and still more pressing to address (Figure 1). Among the main drivers of changes, the fifth IPCC synthesis report [11] demonstrated that greenhouse gas emissions are responsible for global warming in a range between 2 and 6 degrees on average, with more complex changes occurring in the distribution of extreme temperatures and seasonal and annual rainfall. These changes would severely impact numerous aspects of the natural environment, such as biodiversity and ecosystems, soils, freshwater water, and marine resources as well as human activities, such as agriculture, tourism, transport, and energy production [11]. A second driver of change is land use, which changes and fragmentation are severely impacting the environment, with habitat losses from development that cannot be offset by the creation of protected areas [12], maintenance of connectivity, ecological corridors [13], or extensive agriculture. Finally, the UN’s latest projections [14] suggest that the global population will reach between 9.4 and 10 billion by 2050 (key finding 2, p. 8). This review of worldwide demographic trends is essential for evaluating the progress toward achieving the SDGs and to guide policy and economic decision making in the 21st century.
The sustainability challenges laid out by international organizations are very challenging for society, but fortunately the available tools and approaches are steadily improving to help craft solutions to these challenges (e.g., cost-benefit analyses, ecosystem services, nexus, planetary boundaries; see Annex 2) (Figure 1). The objective of this paper is to present, through selected case studies and an original framework, the state of the art solutions to lifting the technical barriers to integrating scientific information into sustainable decision making. The aim is to improve the capacity to address complex and related sustainability challenges. The main barriers and solutions presented in Figure 2 to improve information flows are:
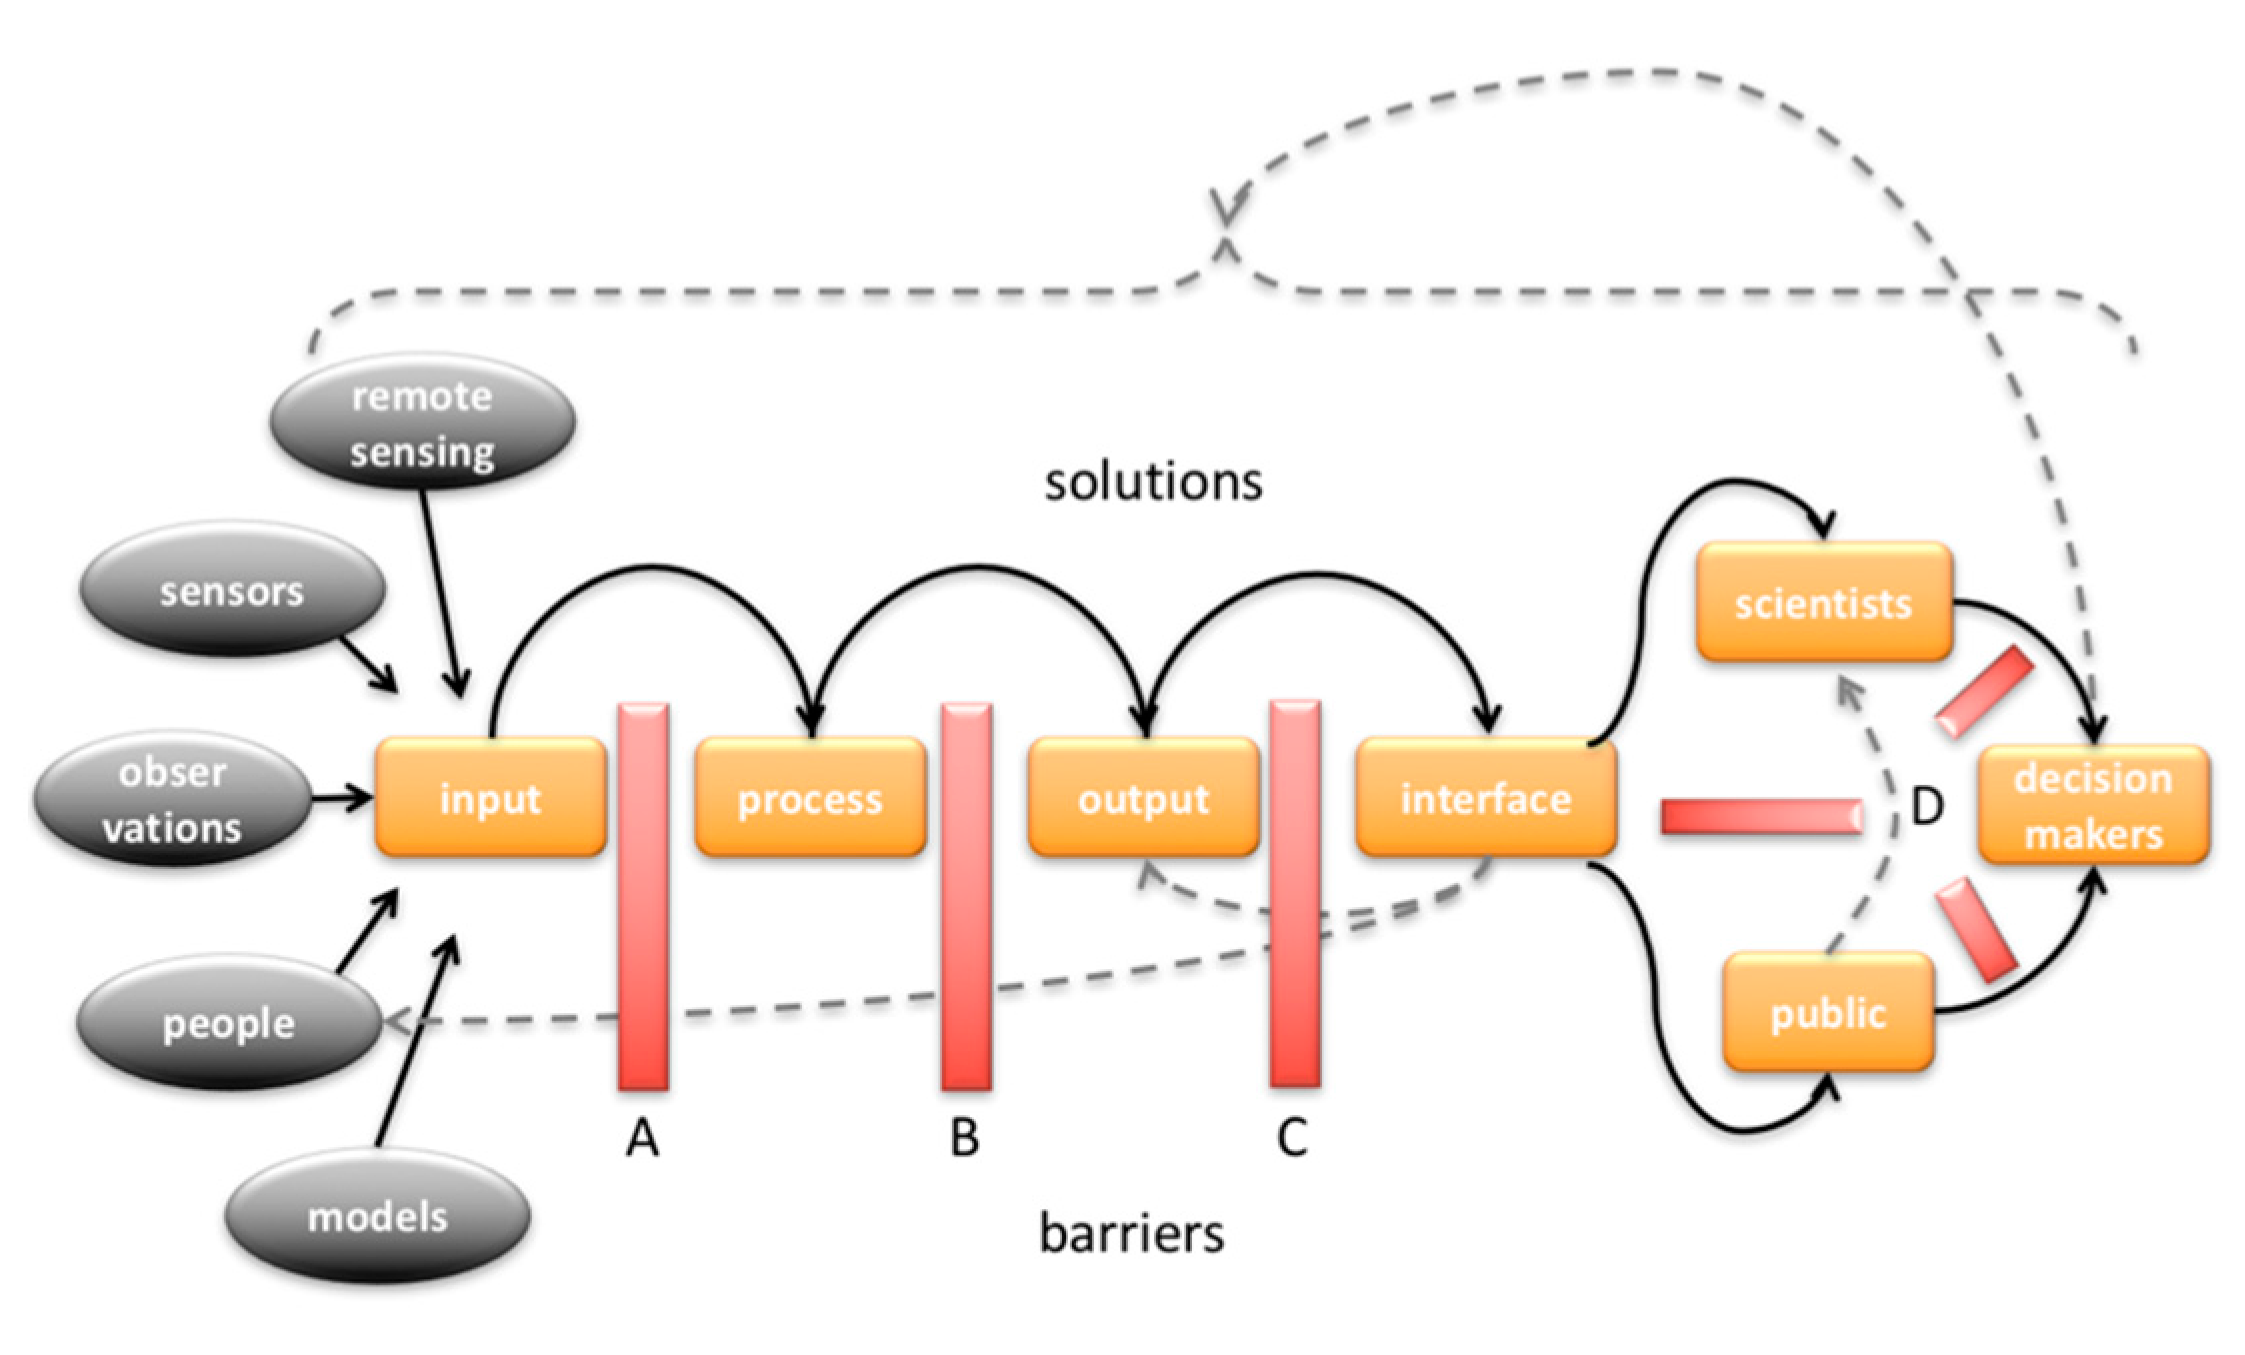
  • User access to data is limited and can be improved by data sharing based on web platforms and interoperability in order to facilitate the use and reuse of high-quality data on the environment.
  • The increasing size and complexity of data sources can be handled by improved data-processing capacities in order to make better sense of the amount of data confronting decision makers.
  • Individual software solutions can be improved by the ability to elaborate and iterate on and between them. Data processing, analysis, and reporting workflows can be enhanced by developing application programming interfaces (APIs) for software products in order to enhance third-party development without duplicated efforts.
  • Limited knowledge transmission and uptake can be enhanced through collaborative engagement, co-creating and applying scientific decision-support tools in order to identify solutions to problems faced by specific stakeholders.

2. Materials and Methods

2.1. Limited Access to Data

There are a variety of social, economic, security, and technological reasons that may limit access to data. But the problem, in general, is that data either do not exist or are scarce, restricted, or are not in a readily-usable format [15]. There are many emerging technologies that can be deployed to address limitations of data scarcity, such as sensor networks, which can make a once tedious and costly process simple to manage and inexpensive to implement. The pervasiveness of certain data, such as satellite imagery, can be combined with novel analysis techniques to provide modeled estimates of data that are scarcer [16]. There are a plethora of data formats and distribution methods; however, if the intention is to increase the ease of use and distribution, then a common interchange format must be used. The Open Geospatial Consortium (OGC) has established a method for this, with the creation of standardized web services as a way to access a dataset through a simple web address [17]. In order to provide quality and timely data to inform evaluation and decision processes, existing Earth Observation infrastructures must be improved. Data sharing is explored in the Black Sea catchment with Geonode, which is an Open Source Geospatial Content Management System [18] and Bringing GEOSS services into practice capacity, which is a capacity-building material that aims at teaching how to configure, use, and deploy a set of open source software to set up a spatial data infrastructure (SDI) [19]. Once data are acquired and shared, it can be more easily processed.

2.2. Increasing Size and Complexity of Data

The pace of advancement in information technology has been accelerating, and there is great potential to provide better support for the innumerable decisions that regularly affect the sustainability of coupled human and natural systems. For over a decade, the rate of online data storage has doubled every 2 years; Internet connection speeds have increased 50 %/year; and the price of computational hardware is dropping regularly. The problem in coming years will be to make sense out of this avalanche of data through improved capacity to access, store, and analyze it. Scalable solutions have emerged to address these challenges, ranging from improved personal computer capacities, clusters of computers, grid and cloud technologies [20]. Google Earth Engine presents a case study based on Python and JavaScript programs for developing geospatial analyses on Google cloud [21]. Once the output is acquired, it can then be shared and examined through a machine interface.

2.3. Ability to Elaborate on Software Solutions

Software is often developed in isolation. Application programming interfaces (API) allow software to work together and to share functionality without the need of knowing the implementation in the same way that a light bulb socket connects different types of light bulbs to diverse power sources. Many more environment-related APIs can be found on specialized platforms [22]. The development of an API can add significant complexity to software development, especially during the design process, but can also extend the usefulness of software far beyond any specific application. For example, the Geospatial Data Abstraction Library (GDAL) [23] is used primarily to read and write geospatial data in a variety of software products, including ArcGIS, QGIS, and many other software packages. This alleviates the need for those software products to implement their own code for reading and writing geospatial data, and instead focus on different tasks. APIs reduce the bottleneck in implementing customized software by providing access to preexisting implementations that would otherwise be resource intensive or prohibitive to develop. A clear demonstration of this solution is presented below with the Ecoinformatics Engine [24] case study that is built on an open source API serving UC Berkeley’s Natural History Data [25]. Once the output is shared and examined, it can be discussed through human interactive interfaces.

2.4. Knowledge Transmission

The transmission and use of knowledge is one of the most significant barriers that is often overlooked by the physical sciences. Advances in science, data, and interoperability have lifted many of the previous acknowledged barriers in order to enhance our understanding of the impact of human decisions on Earth ecosystems. There is an extensive literature on the ingredients for successful uptake of new information, which demonstrates that the information must be credible, salient, and legitimate [26]. Credibility requires a scientific rigor in the technical evidence presented. Salience means that the information is relevant to the needs of decision makers. Legitimacy involves the process of generating the information in the first place, ensuring that it has been unbiased with respect to opposing views and has incorporated all lines of evidence. While credibility is often the main focus of scientific scrutiny and research advancement, salience and legitimacy present significant barriers to the uptake of information [27]. There are promising new advances on these fronts, and more institutions are building these elements into their research programs. Salience and legitimacy can both be addressed by improving the interface and accessibility of information. Investments in monitoring, data sharing, and analytical infrastructure must be paired with the development of easy-to-use applications that accommodate everyone who can inform the policy process. There is a wide array of engagement platforms, ranging from mobile apps collecting voter opinions to high-end software tools that are tailor-made to specific decisions. This knowledge transmission issue is exemplified below by Seasketch, which is a powerful tool for ocean planners, stakeholders, and the public that enables participatory marine spatial planning [28]. InVEST is also presented as a suite of free open-source software models used to map and value the goods and services from nature [29]. Finally, RIOS is a support tool for the design of cost-effective investments in watershed services [30].

3. Results from Selected Case Studies and Discussion

Here is a selection of case studies based on our own work that exemplify the solutions that can be brought to lower the above described barriers. These case studies are then discussed by comparison with other existing solutions at various geographical scales.

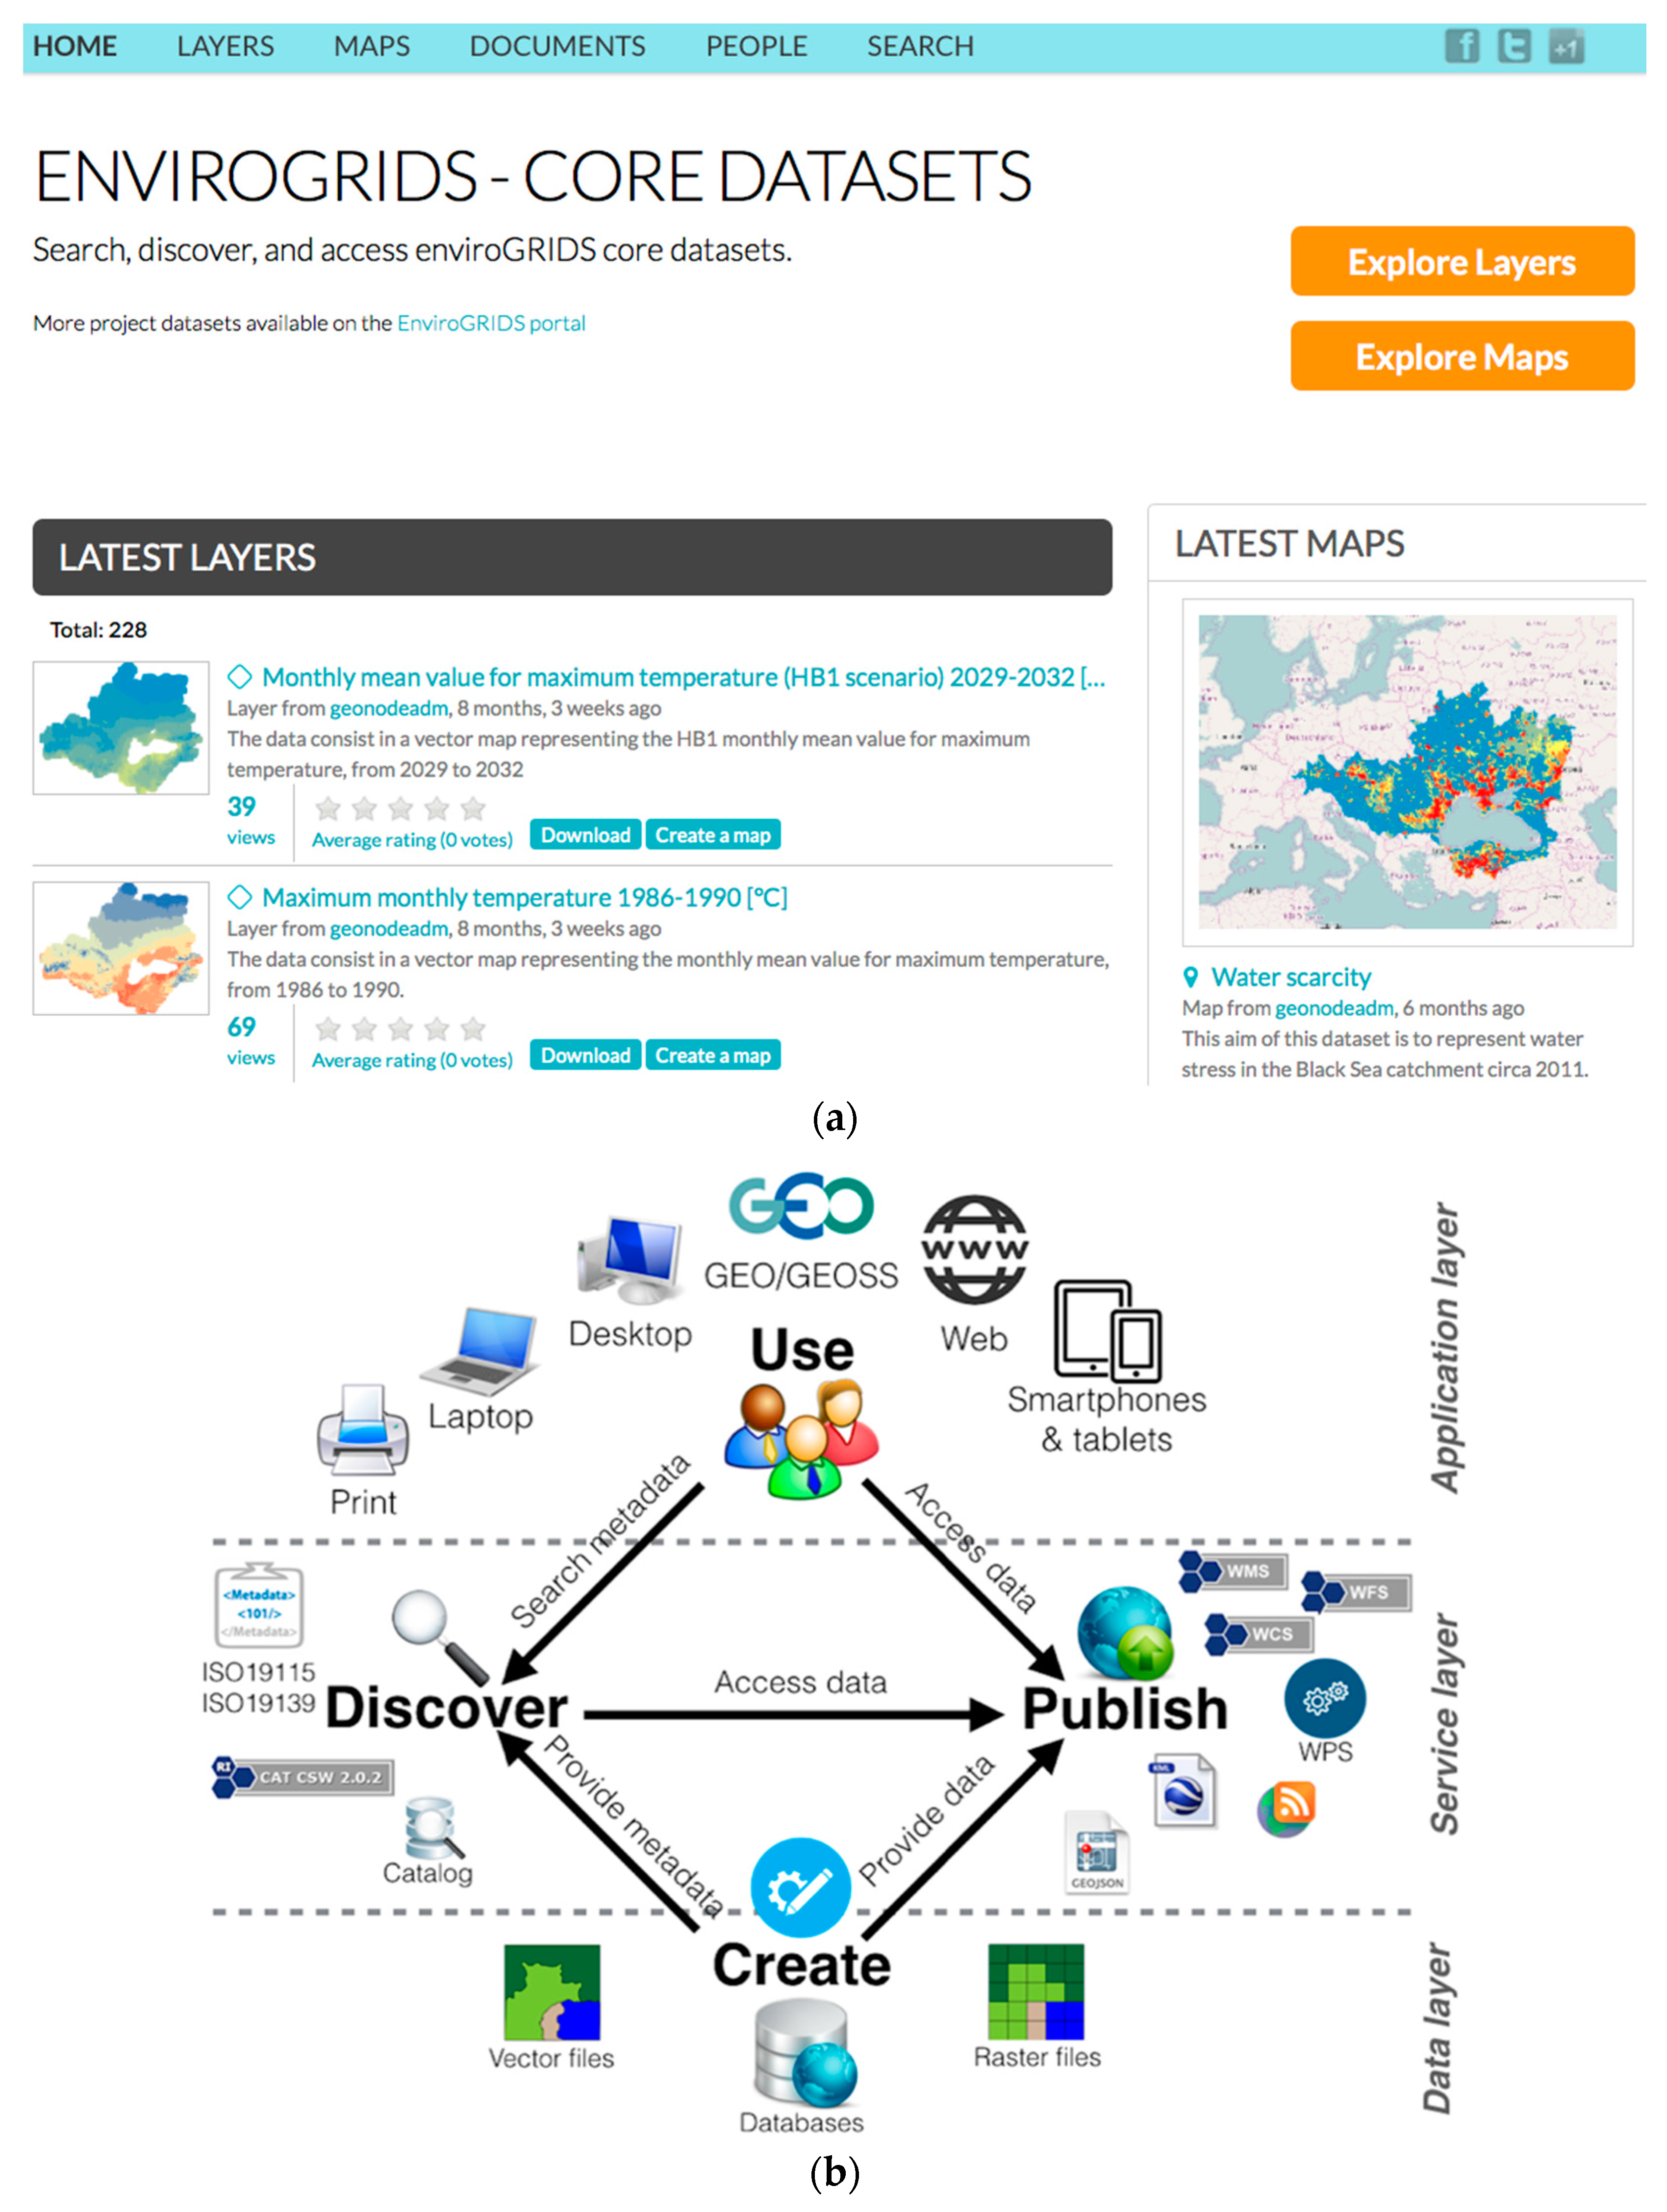
3.1. Data Sharing in the Black Sea Catchment

One example of rising to the challenge of data sharing is the enviroGRIDS project [31], which predicts land-use change in the Black Sea catchment [32], and models its hydrology [33] to predict future water-resource vulnerabilities [34] and scarcity [35]. The datasets produced by the project are made freely available through a geoportal built with Geonode (Figure 3a) [36] that is based on a Spatial Data Infrastructure (SDI) using OGC standards (Figure 3b).
Most physical geography and environmental data (e.g., hydrological, meteorological, and agricultural) remain difficult to find, access, and integrate because of various incompatibilities in formats, data models, and quality, missing documentation (metadata), data fragmentation, and non-existing or inappropriate data policies [37]. Improvements require common standards and adequate metadata [38]. EnviroGRIDS has its roots in data-sharing principles of international initiatives, such as the Global Earth Observation System of Systems (GEOSS [15]) and the European framework INSPIRE, which promote interoperability to maximize the reuse of geospatial data. These initiatives are supported by a brokering approach that interconnects different systems and provides a multidisciplinary framework [39]. SDI concepts, methods, and technologies represent an important step toward removing barriers to data availability, accessibility, integration, and modeling. Further steps depend on the use of distributed computing infrastructures that can handle complex and large datasets and models [40]. Additionally, web-processing services bring the flexibility to develop and execute models over the Internet [41,42], as demonstrated by the eHabitat tool to models species distribution [43].
Other good examples of data-sharing services exist at various scales. The Global Change Master Directory (GCMD [44]) contains more than 34,000 Earth science datasets and service descriptions. The aim of this NASA project is to improve the discovery and access of global change and Earth observation-related data, services, and instruments to researchers, policymakers, and the public. The Global Risk Data Platform [45,46] is a perfect example of the use of OGC standards to share information on natural risk disasters globally. At regional scales, the Water Information System for Europe [47] is based on OGC standards, and aims to improve the collection and dissemination of information related to European water policy. At a national level, the Swiss Federal Office of Topography is using WMS OGC services to integrate national maps, aerial photos, and other geospatial data into geographical information systems (GIS). Finally, at a local scale, there is the State of Geneva (Switzerland) information system, which is delivering its large catalog of open data as web services through ESRI-based web solutions.

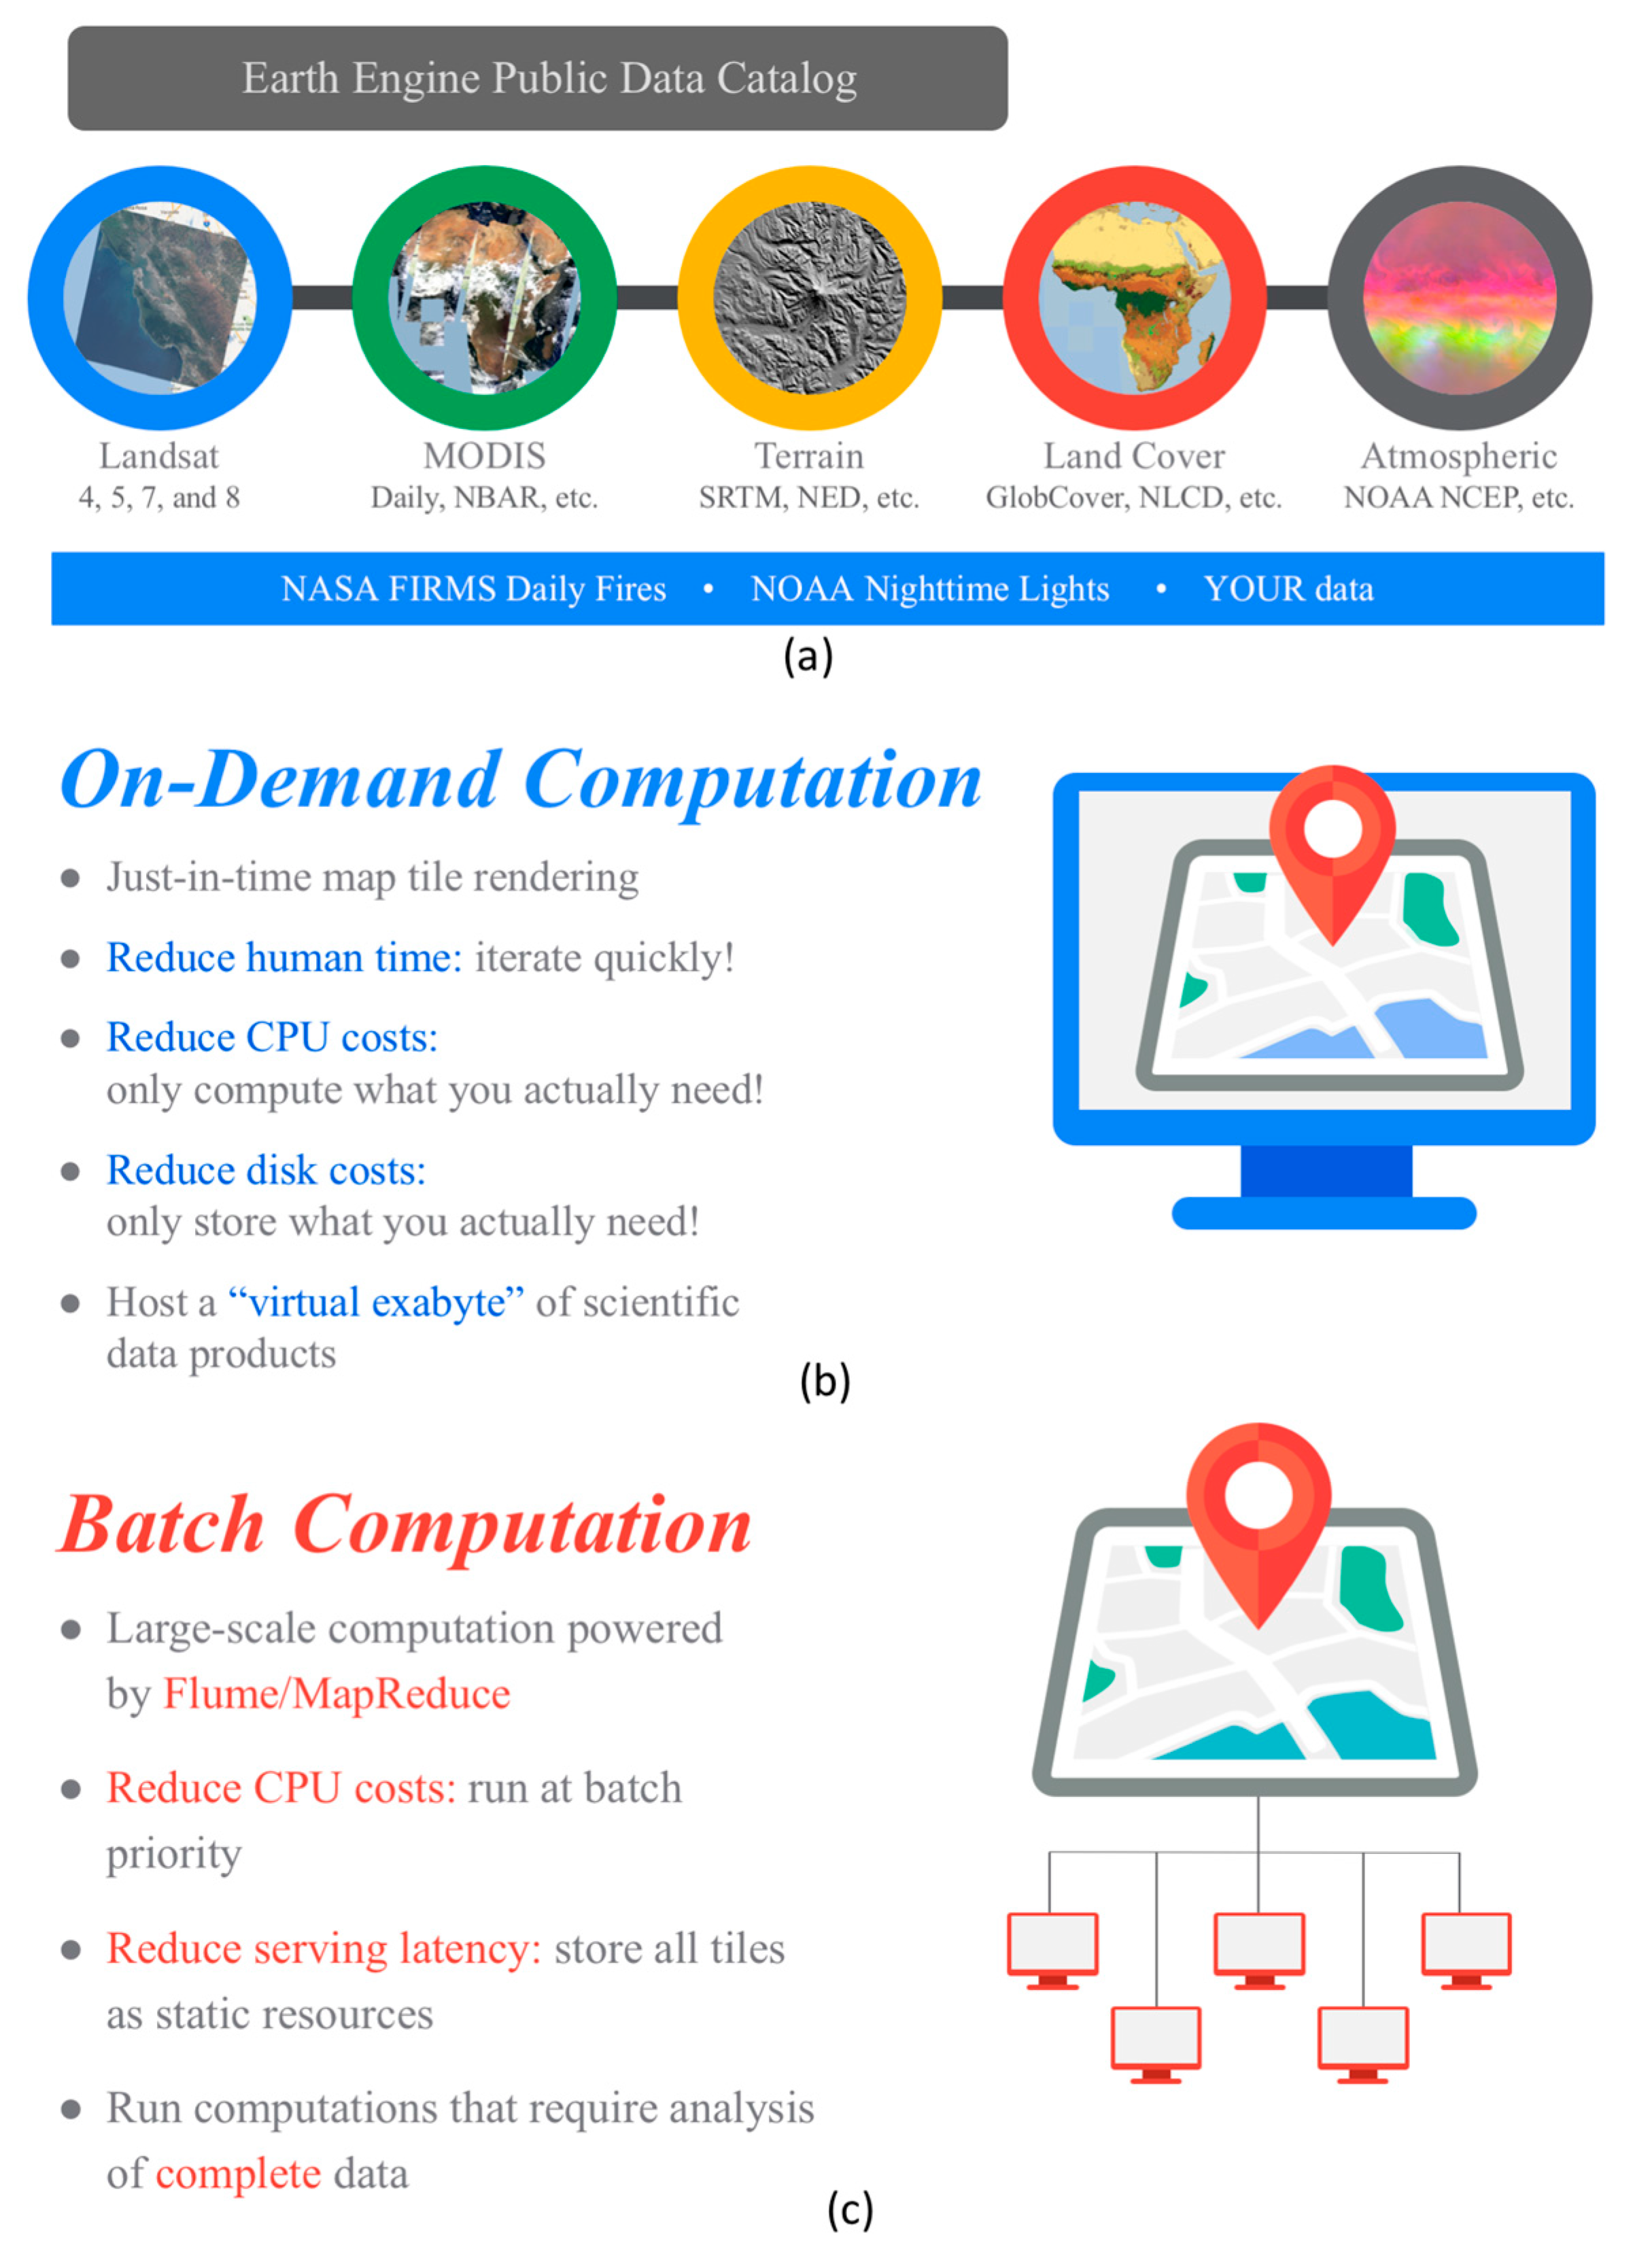
3.2. Addressing Size and Complexity with Google Earth Engine

Hansen et al. [48] analyzed approximately 20 trillion pixels extracted from 654,178 Landsat 7 scenes, which is close to half of the available Landsat 7 archive, to detect forest loss and forest gain for each 30-m pixel of land on the Earth from the year 2000 to 2012. Performing this task required immediate online access to all the relevant Landsat data in an environment that supported its analysis. In this case, Google Earth Engine was used because of the co-location of a copy of Landsat data with the processing capacity needed to perform the analysis. Google Earth Engine provides open access to a centralized repository of many such large collections of Earth observation data (Figure 4a), a programming interface to analyze those data, and a cluster of computers upon which the analyses are run (Figure 4b). Algorithmic development is important in the analysis of these data. They can range from relatively simple pixel stack operations, such as multiplication and addition of rasters, to complex landscapes spanning operations, such as machine-learning classification of land-cover types.
Large digital datasets of the Earth and its processes have become ubiquitous, but the computational complexity of analyzing those data can be challenging. For example, the NASA/USGS Landsat project has collected petabytes of global remote sensing data since its inception in 1965. Simply storing those data in an easily-accessible manner is a significant undertaking. Storing them in a way that makes them available for processing is even more complex. Global analyses of these data can require calculations over large percentages of these kinds of data collections.
Many applications of Google Earth Engine have emerged in recent years, such as in the analysis of urban growth [49], wetland extent [50], or crop mapping [51]. The solutions brought by Google Earth Engine are made possible by the evolution of parallel computing on grids and clouds [52]. With the “big data” revolution, these technologies are in constant progress [53].
Similarly, ArcGIS Online from ESRI, markets itself as a complete, cloud-based mapping platform providing both visualization and analysis. Other solutions exist, such as GISCloud [54], to create, upload, author, publish, and share spatial data. Existing geospatial solutions on the cloud were reviewed by Evangelidis et al. [55].

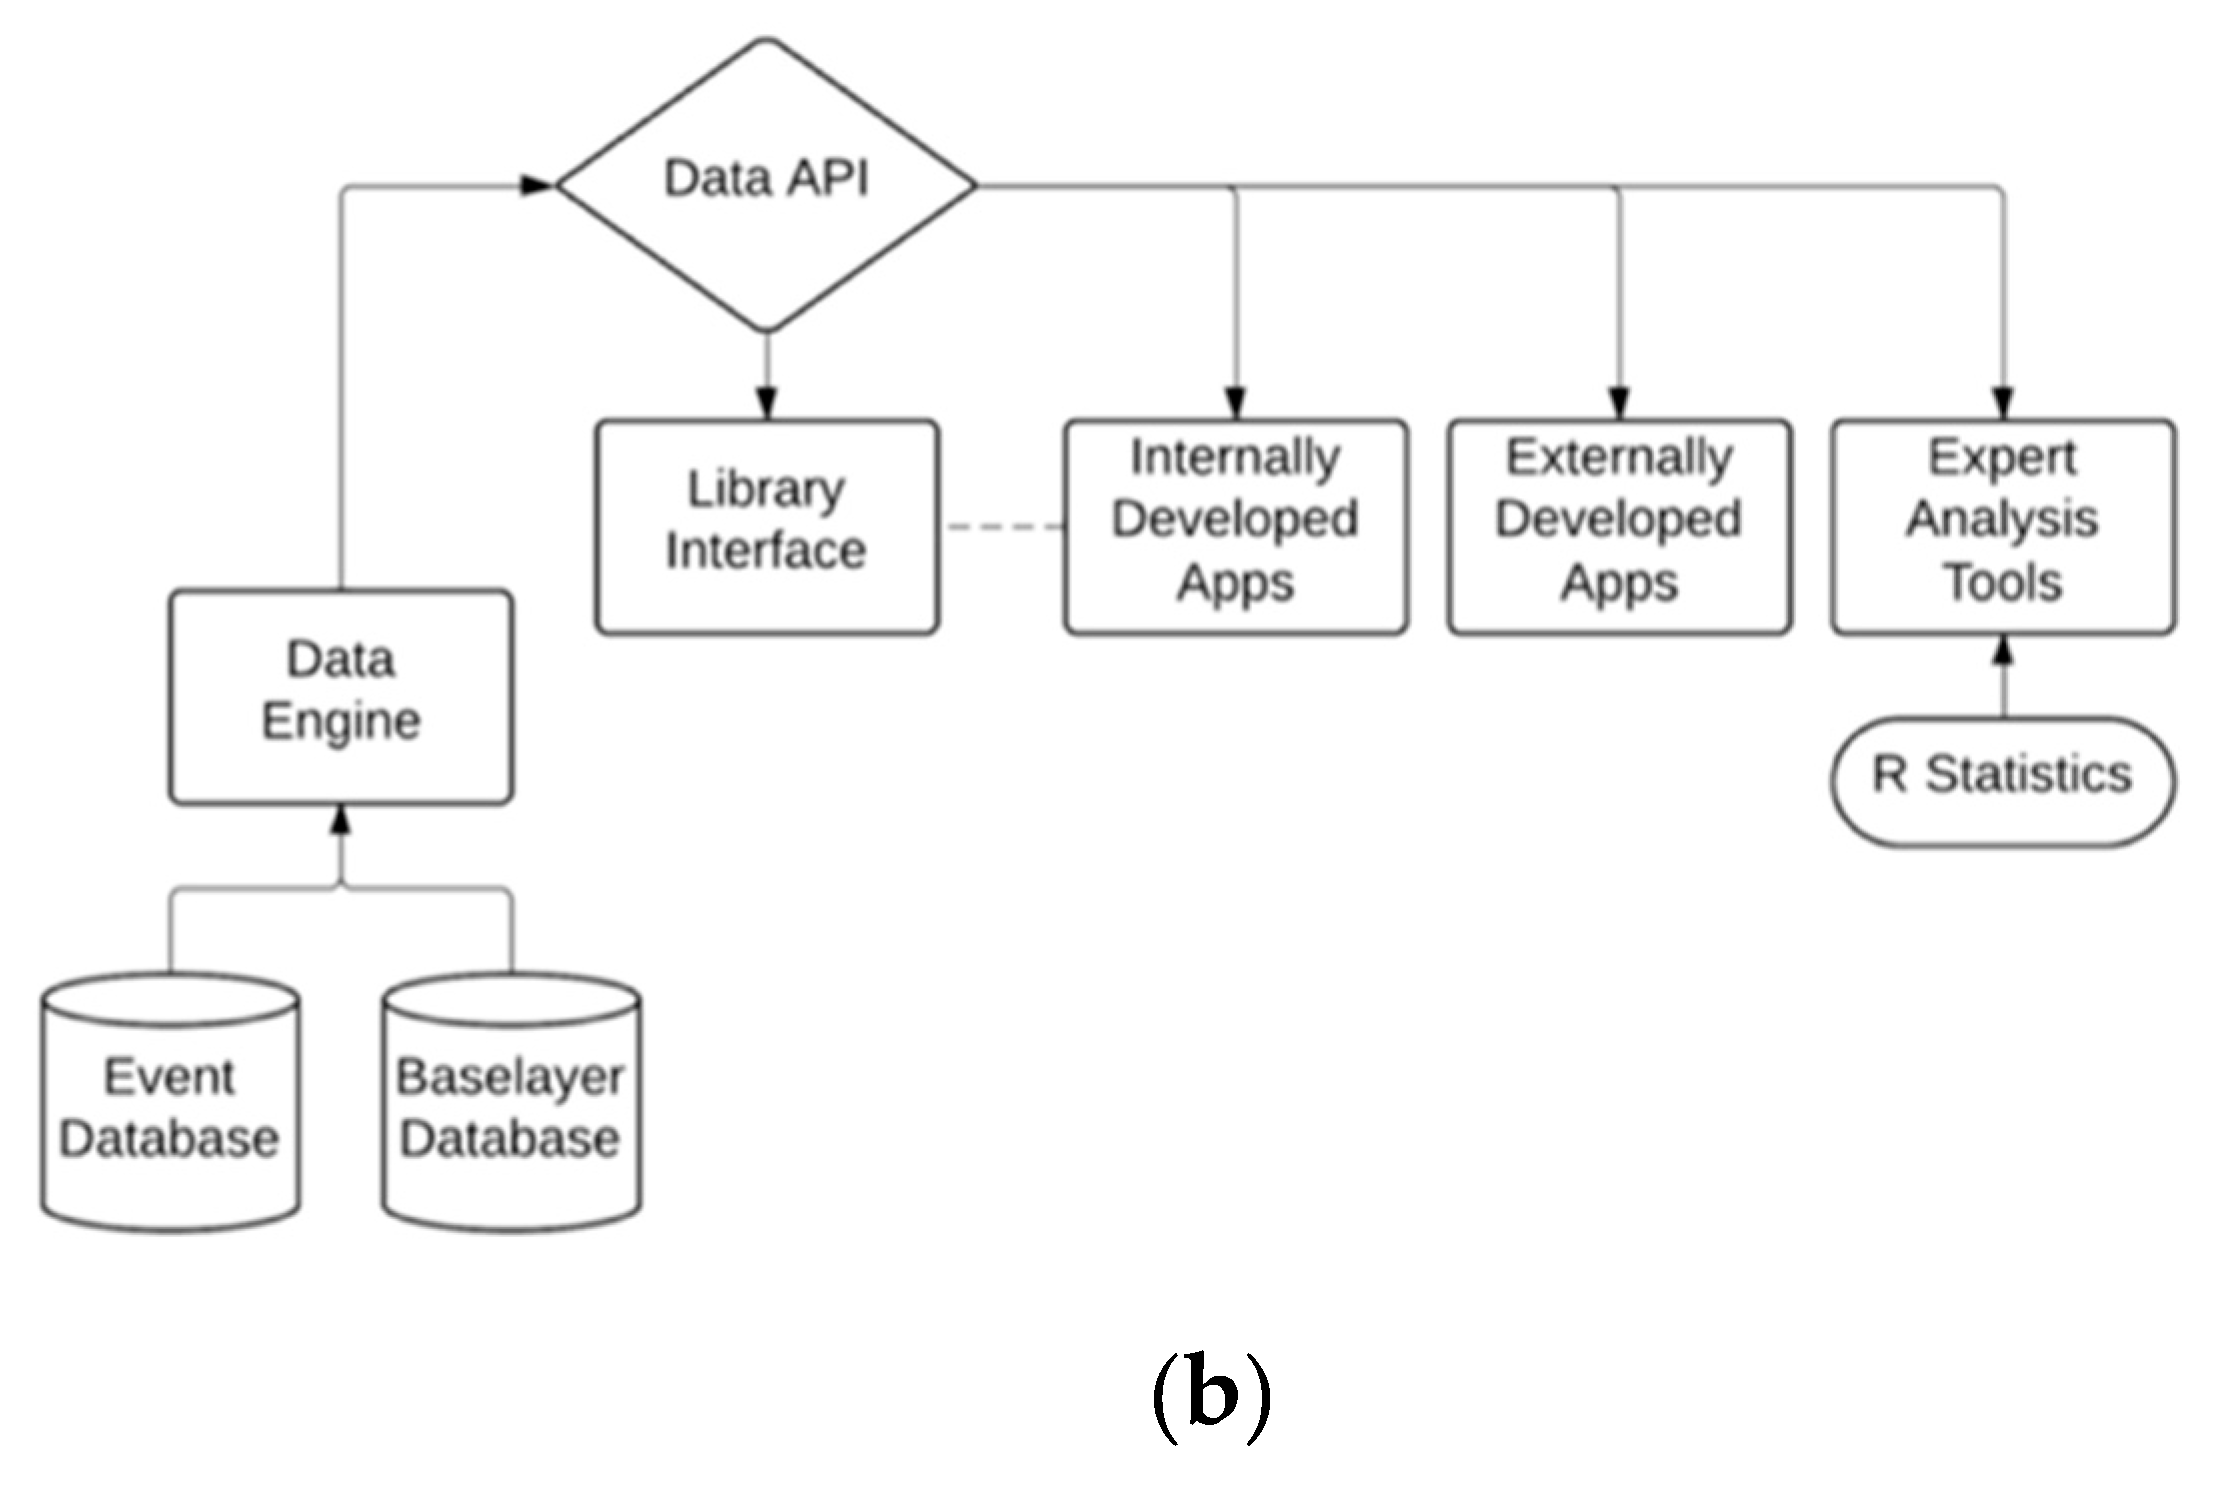
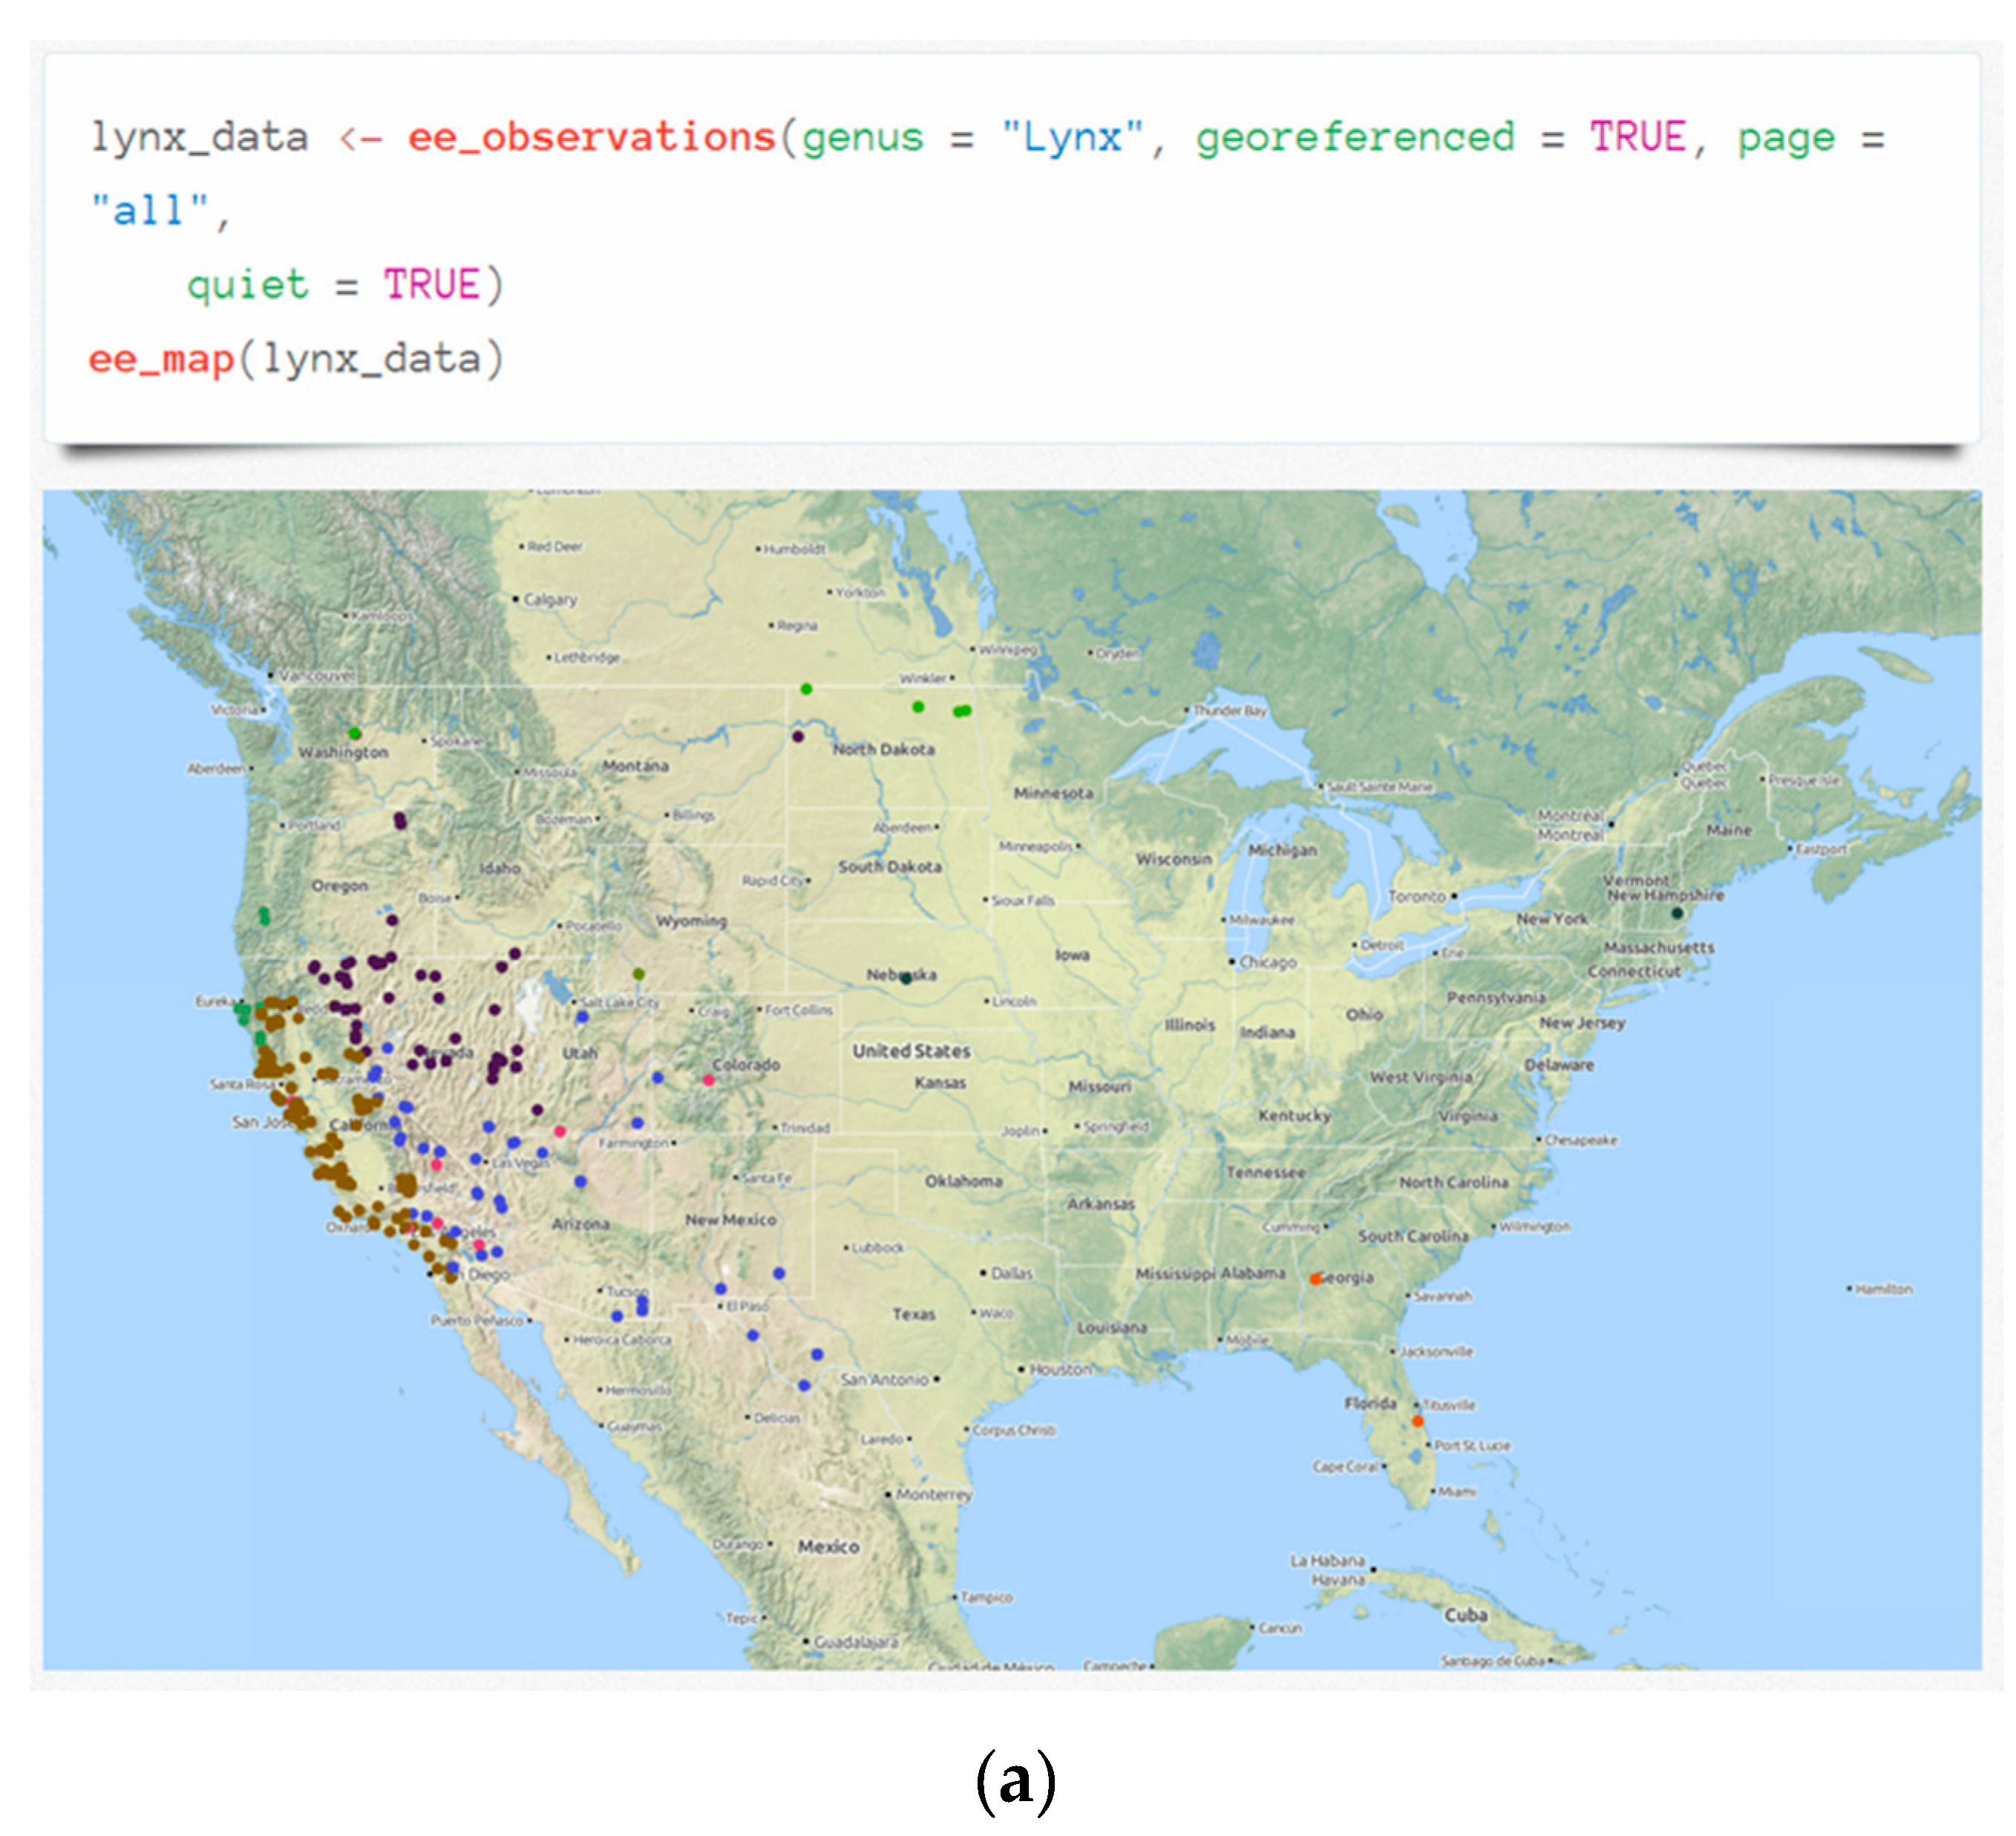
3.3. Accessing Biological and Geospatial Data from APIs

The Berkeley Ecoinformatics Engine (Figure 5b) provides an excellent example of how an open API allows researchers to explore, visualize, and analyze a wealth of biological and geospatial information on global change that is agnostic to the software platform (Figure 5a). It also liberates and integrates highly-complex data from specimens in natural history museums, field experiments and observations, aerial and satellite imagery, measurements from environmental sensor networks, and global change model predictions.
The flexibility of the platform allows for it to be used to drive a variety of applications meant for different users. The API drives a growing list of other visualization and programmatic use cases [56]. Providing an open API allows anyone to create similar rich interactive resources, as seen above, without the need to reproduce the entire infrastructure of this web application (Figure 5a).
In the environmental sciences, the use of APIs is becoming more and more common to improve access to an increasing amount of available information. The Food and Agriculture Organization of the UN (FAO) is, for instance, making its data available in a similar way with the FAOSTAT API and related R-package [57]. The Group on Earth Observation (GEO) has developed the GEO DAB API [58] to simplify cross- and multidisciplinary discovery, access, and use of disparate data and information [39]. NASA is also making available several data resources through dedicated APIs [59].

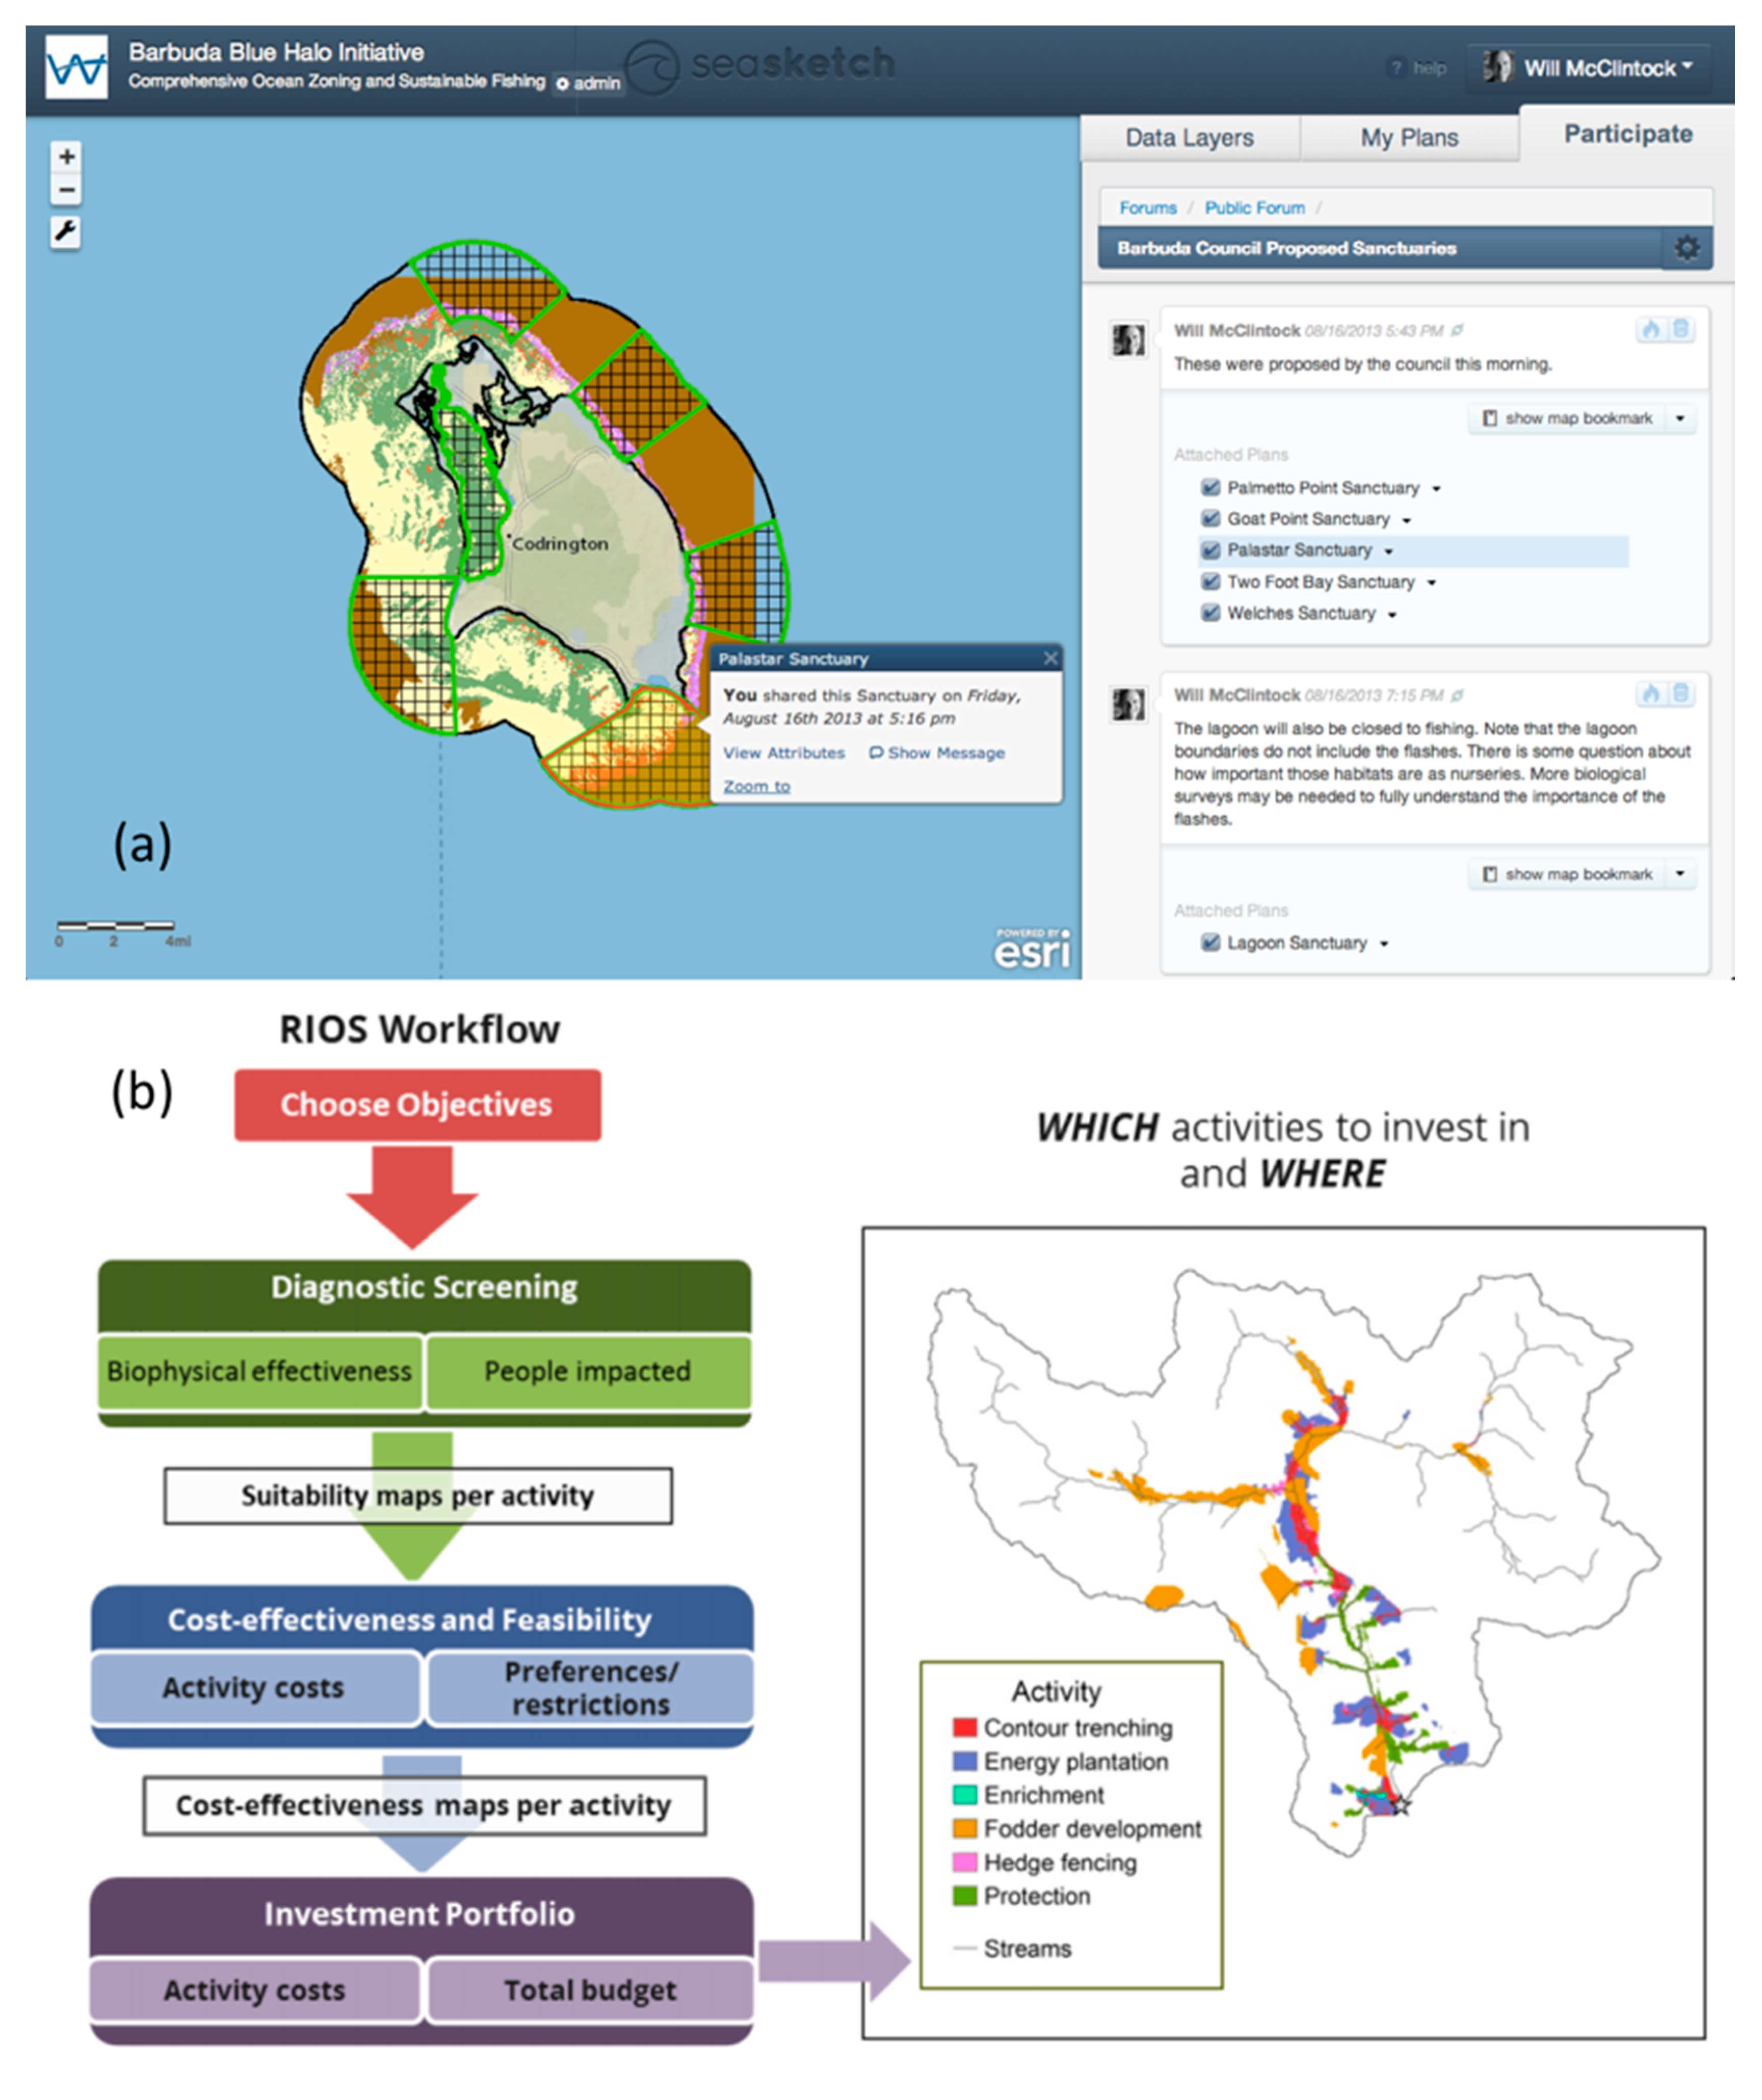
3.4. Transferring Knowledge through Participatory Approaches

Two excellent examples of building salience are SeaSketch (Figure 6a) and its predecessor MarineMap, which are participatory web-based tools for marine reserve design. MarineMap was used by the stakeholders of California’s Marine Life Protection Act Initiative for marine-protected area planning [60], to facilitate access to important datasets and automatically linking user-created designs to analysis of those reserves that met the science-based guidelines. The implementation of this tool facilitated the public process by giving participants a better understanding of the geography and science criteria, allowing them to concretely identify areas of converging and diverging interests [61]. SeaSketch extends MarineMap’s capabilities with a software as service architecture to simultaneously support dozens of projects, and greatly reducing costs and time requirements.
An increasingly successful way of building legitimacy is by coproducing knowledge with stakeholders. The Natural Capital Project maintains a suite of ecosystem services models called InVEST (Integrated Valuation of Ecosystem Services and Trade-offs) [62], that was developed through use cases to reflect outcomes of real decisions faced by a variety of actors [63]. One example of this process has been the ongoing creation of water funds throughout Latin America, and is now spreading to Africa and Asia. Water funds are conservation financing mechanisms that protect or improve the management of watersheds to secure water for downstream beneficiaries that pay into the fund [64]. Water funds often seek a science-based approach for targeting interventions to maximize cost-effectiveness [65], and for the past 5 years, scientists at The Natural Capital Project have engaged with local scientists, managers, and stakeholders in a collaborative process of evaluating scenarios for impacts on management objectives, learning that targeted investments could provide a return that is several times greater than random or ad hoc investments. This ultimately led to the creation of a new tool that was tailored to this specific context, namely RIOS (Resource Investment Optimization System [66], Figure 6b), which enables a transparent and legitimate process for designing water funds to equitably meets the needs and multiple uses of the diversity of actors involved in the water fund.
OpenStreetMap [67] is probably the best-known collaborative mapping system in the world, with more than 3 million registered users creating new geographic information. The MAP-X project [68] is using a Shiny server as a core component of its geospatial platform. Shiny [69] is another example of an interactive system that is based on an open source R-package that provides a powerful web framework for building interactive web applications.

4. General Discussion

Sustainable stewardship faces many challenges at the intersection of physical geography, Earth observation, and policy; and new technologies are needed to better manage information and the knowledge that it can produce. Limited information can come from too little or too much data, fragmented data repositories, and the lack of sharing due to cultural, legal, or technological limits. The use of spatial data infrastructures can facilitate data sharing in a manner that is efficient, scalable, and resilient. The ability to then process data into information and knowledge is critical, and a public platform for connecting developers is essential for innovation. The engagement among and between experts and stakeholders is critical for the development, deployment, and long-term impact of a project. Their success depends on the ability to gain funding from diverse sources, effectively manage projects, and convey the results and lessons learned.
The proposed approach of barriers and solutions for addressing sustainability challenges from physical geography and Earth observation represents a new and original framework based on the combined experience from the coauthors. However, similar challenges exist in many other fields of information systems, where different types of barriers and solutions have been identified, as for instance in the health domain [66,70] and also in the energy sector [71]. While the authors of this paper concentrated here on technical barriers, other domains are also addressing organizational, behavioral/human, and financial barriers. The adopted approach is also closely related to data-information-knowledge-wisdom (DIKW) pyramids [72], which could clearly be linked to different barriers and the transition from one level to another. Barrier A is about accessing data; Barrier B is essentially about transforming data into information; Barrier C is about generating knowledge; and Barrier D can be seen as a way to reach some kind of common wisdom.
Solutions exist that improve data sharing by exchanging data through web services using interoperability standards, but these solutions and standards are underused. Data sharing could greatly benefit from promoting multidimensional data standards with imbedded metadata, such as NetCDF. Web services should be discoverable by web browsers, as traditional Internet search tools are still mostly used when looking for data instead of dedicated geoportals, such as GEOSS or INSPIRE.
The need for improved data processing solutions will increase with the quantity of new datasets made available, their increased spatial and temporal resolution, and the arrival of data from distributed sensors and the Internet. In particular, choosing the right processing solution (single computer, clusters, grids, clouds) remains an issue when facing large data and/or processing challenges [73].
Many developments can be made available to other research groups if they carefully plan and implement APIs. However, a combination of physical and virtual networks is needed in order to improve the participation of various stakeholders in decision-making processes based on the best available scientific information. Finding solutions for measuring the progress towards SDGs, and especially for implementing solutions, depend on large interdisciplinary networks.
The sustainability of the online tools themselves remains a challenge, since there are usually very limited resources to develop and maintain complex information systems for end-users. Funding mechanisms common to academic and government entities are often not compatible with the needs of scoping, developing, and maintaining software and data infrastructure. A much greater priority should be given to environmental information systems that are capable of addressing the sustainability challenges at various geographical scales.
The solutions proposed in this paper represent important contributions toward transforming data into information and knowledge, feeding into the science-policy interface. Capacity-building is essential for this transformation [38], but the most difficult step remains bringing scientists and decision-makers to the same table to build their project together alongside an adaptive strategy. One way forward is building interdisciplinary projects, where several forms of knowledge (scientific, economic, social) are processed, compared, and integrated in order to provide a holistic context within which decisions may be informed and negotiated.

5. Conclusions

  • Interoperability (A) is the most important quality for improving accessibility to data, and this can be achieved through standardized protocols, data harmonization, and a sharing culture.
  • Scalability (B) is the most important quality for improving the ability to process data, and this can be achieved through grid computing.
  • Openness (C) is the most important quality for improving the ability to convey results, and this can be achieved through APIs.
  • Collaboration (D) is the most important quality for improving discussion among and between the public, scientists, and decision-makers.
Building information systems that lower all barriers by combining the proposed solutions will set a new standard for supporting sustainable development from evidence brought by physical geography and Earth observation, combined with socioeconomic conditions.

Acknowledgments

The authors would like to acknowledge the European Commission “Seventh Framework Program” that funded the enviroGRIDS (grant agreement No. 227640), IASON (No. 603534), and EOPOWER (No. 603500) projects, The Gordon and Betty Moore Foundation that supported the development of the InVEST, RIOS, and PyGeoprocessing tools at The Natural Capital Project. The authors wish to thank to Kai N. Lee for moderating the session “Information Accelerators: Using Online Tools to Address Sustainability Challenges” of the AAAS conference in San Jose, California, in February 2015 during which this paper was initiated.

Author Contributions

A.L., R.C.-K., and M.L. conceived and coordinated the writing of the manuscript. G.G. and A.L. wrote the enviroGRIDS case study. D.T. presented the Google Earth Engine case study. K.K. drafted the Berkeley Ecoinformatics Engine case study. G.G. described the marine case studies. R.C.-K. and R.S. wrote the NatCap case study.

Conflicts of Interest

The authors declare no conflict of interest. The founding sponsors had no role in the design of the study; in the collection, analyses, or interpretation of data; in the writing of the manuscript and in the decision to publish the results.

References

  1. UN. Transforming Our World: The 2030 Agenda for Sustainable Development. Available online: https://sustainabledevelopment.un.org/post2015/transformingourworld/publication (accessed on 5 May 2017).
  2. Scott, G.; Rajabifard, A. Integrating geospatial information Sustainable Development Goals. In Proceedings of the Twentieth United Nations Regional Cartographic Conference for Asia and the Pacific, Jeju Island, Korea, 6–9 October 2015. [Google Scholar]
  3. Brooks, T.M.; Butchart, S.H.M.; Cox, N.A.; Heath, M.; Hilton-Taylor, C.; Hoffmann, M.; Kingston, N.; Rodríguez, J.P.; Stuart, S.N.; Smart, J. Harnessing biodiversity and conservation knowledge products to track the Aichi Targets and Sustainable Development Goals. Biodiversity 2015, 16, 157–174. [Google Scholar] [CrossRef]
  4. CBD. Global Biodiversity Outlook 4. Available online: https://www.cbd.int/gbo/gbo4/publication/gbo4-en.pdf (accessed on 5 May 2017).
  5. Scholes, R.J.; Walters, M.; Turak, E.; Saarenmaa, H.; Heip, C.H.R.; Tuama, E.O.; Faith, D.P.; Mooney, H.A.; Ferrier, S.; Jongman, R.H.G.; et al. Building a global observing system for biodiversity. Curr. Opin. Environ. Sustain. 2012, 4, 139–146. [Google Scholar] [CrossRef]
  6. Pereira, H.M.; Ferrier, S.; Walters, M.; Geller, G.N.; Jongman, R.H.G.; Scholes, R.J.; Bruford, M.W.; Brummitt, N.; Butchart, S.H.M.; Cardoso, A.C.; et al. Essential Biodiversity Variables. Science 2013, 339, 277–278. [Google Scholar] [CrossRef] [PubMed]
  7. Kissling, W.D.; Hardisty, A.; García, E.A.; Santamaria, M.; De Leo, F.; Pesole, G.; Freyhof, J.; Manset, D.; Wissel, S.; Konijn, J.; et al. Towards global interoperability for supporting biodiversity research on essential biodiversity variables (EBVs). Biodiversity 2015, 16, 99–107. [Google Scholar] [CrossRef]
  8. UN. A World That Count; Independent Expert Advisory Group on a Data Revolution for Sustainable Development. Available online: http://www.undatarevolution.org/wp-content/uploads/2014/11/A-World-That-Counts.pdf (accessed on 10 May 2017).
  9. Lu, Y.L.; Nakicenovic, N.; Visbeck, M.; Stevance, A.S. Five priorities for the UN Sustainable Development Goals. Nature 2015, 520, 432–433. [Google Scholar] [CrossRef] [PubMed]
  10. Steffen, W.; Richardson, K.; Rockstrom, J.; Cornell, S.E.; Fetzer, I.; Bennett, E.M.; Biggs, R.; Carpenter, S.R.; de Vries, W.; de Wit, C.A.; et al. Planetary boundaries: Guiding human development on a changing planet. Science 2015, 347, 736–748. [Google Scholar] [CrossRef] [PubMed]
  11. IPCC. Climate Change 2014: Synthesis Report; Contribution of Working Groups I, II and III to the Fifth Assessment Report of the Intergovernmental Panel on Climate Change; IPCC: Geneva, Switzerland, 2014. [Google Scholar]
  12. Pouzols, F.M.; Toivonen, T.; Di Minin, E.; Kukkala, A.S.; Kullberg, P.; Kuustera, J.; Lehtomaki, J.; Tenkanen, H.; Verburg, P.H.; Moilanen, A. Global protected area expansion is compromised by projected land-use and parochialism. Nature 2014, 516, 383–386. [Google Scholar] [CrossRef] [PubMed]
  13. Samways, M.J.; Bazelet, C.S.; Pryke, J.S. Provision of ecosystem services by large scale corridors and ecological networks. Biodivers. Conserv. 2010, 19, 2949–2962. [Google Scholar] [CrossRef]
  14. UN. Population 2030: Demographic Challenges and Opportunities for Sustainable Development Planning; United Nation: New York, NY, USA, 2015. [Google Scholar]
  15. Giuliani, G.; Ray, N.; Schwarzer, S.; De Bono, A.; Peduzzi, P.; Dao, H.; Van Woerden, J.; Witt, R.; Beniston, M.; Lehmann, A. Sharing Environmental Data through GEOSS. Int. J. Appl. Geospat. Res. 2011, 2, 1–17. [Google Scholar] [CrossRef]
  16. Stone, R. Earth-Observation Summit Endorses Global Data Sharing. Science 2010, 330, 902. [Google Scholar] [CrossRef] [PubMed]
  17. Nogueras-Iso, J.; Zarazaga-Soria, F.J.; Bejar, R.; Alvarez, P.J.; Muro-Medrano, P.R. OGC Catalog services: A key element for the development of Spatial Data Infrastructures. Comput. Geosci. 2005, 31, 199–209. [Google Scholar] [CrossRef]
  18. Open Source Geospatial Content Management System. Available online: http://geonode.org/ (accessed on 5 May 2017).
  19. Giuliani, G.; Lacroix, P.; Guigoz, Y.; Roncella, R.; Bigagli, L.; Santoro, M.; Mazzetti, P.; Nativi, S.; Ray, N.; Lehmann, A. Bringing GEOSS Services into Practice: A Capacity Building Resource on Spatial Data Infrastructures (SDI). Available online: http://onlinelibrary.wiley.com/doi/10.1111/tgis.12209/epdf (accessed on 5 May 2017).
  20. Rodila, D.; Gorgan, D. Geospatial and Grid Interoperability Through OGC Services Gridification. IEEE J. Sel. Top. Appl. Observ. Remote Sens. 2012, 5, 1650–1658. [Google Scholar] [CrossRef]
  21. Google Earth Engine. Available online: https://earthengine.google.com/ (accessed on 5 May 2017).
  22. Search the Largest API Directory on the Web. Available online: http://www.programmableweb.com/category/environment/apis?keyword=environment (accessed on 5 May 2017).
  23. GDAL—Geospatial Data Abstraction Library. Available online: http://www.gdal.org/ (accessed on 5 May 2017).
  24. Koy, K. Berkeley Ecoinformatics Engine. In Proceedings of the AAAS 2015 Annual Meeting, San Jose, CA, USA, 12–16 February 2015. [Google Scholar]
  25. Berkeley Ecoinformatics Engine. An Open API Serving UC Berkeley’s Natural History Data. Available online: https://ecoengine.berkeley.edu/ (accessed on 5 May 2017).
  26. Cash, D.W.; Clark, W.C.; Alcock, F.; Dickson, N.M.; Eckley, N.; Guston, D.H.; Jäger, J.; Mitchell, R.B. Knowledge systems for sustainable development. Proc. Natl. Acad. Sci. USA 2003, 100, 8086–8091. [Google Scholar] [CrossRef] [PubMed]
  27. Rosenthal, A.; Verutes, G.; McKenzie, E.; Arkema, K.K.; Bhagabati, N.; Bremer, L.L.; Olwero, N.; Vogl, A.L. Process matters: A framework for conducting decision-relevant assessments of ecosystem services. Int. J. Biodivers. Sci. Ecosyst. Serv. Manag. 2015, 11, 190–204. [Google Scholar] [CrossRef]
  28. SeaSketch Supports Collaborative Planning for Our Oceans. Available online: http://seasketch.org/ (accessed on 5 May 2017).
  29. InVEST—Integrating Valuation of Ecosystem Services and Tradeoffs. Available online: http://naturalcapitalproject.org/invest (accessed on 5 May 2017).
  30. RIOS. Optimizing Cost-Effective Investments for Clean Water and Other Benefits. Available online: http://www.naturalcapitalproject.org/software/rios (accessed on 5 May 2017).
  31. Lehmann, A.; Giuliani, G.; Mancosu, E.; Abbaspour, K.C.; Soezen, S.; Gorgan, D.; Beel, A.; Ray, N. Filling the gap between Earth observation and policy making in the Black Sea catchment with enviroGRIDS. Environ. Sci. Policy 2015, 46, 1–12. [Google Scholar] [CrossRef]
  32. Mancosu, E.; Gago-Silva, A.; Barbosa, A.; de Bono, A.; Ivanov, E.; Lehmann, A.; Fons, J. Future land-use change scenarios for the Black Sea catchment. Environ. Sci. Policy 2015, 46, 26–36. [Google Scholar] [CrossRef]
  33. Rouholahnejad, E.; Abbaspour, K.C.; Srinivasan, R.; Bacu, V.; Lehmann, A. Water resources of the Black Sea Basin at high spatial and temporal resolution. Water Resour. Res. 2014, 50, 5866–5885. [Google Scholar] [CrossRef]
  34. Bar, R.; Rouholahnedjad, E.; Rahman, K.; Abbaspour, K.C.; Lehmann, A. Climate change and agricultural water resources: A vulnerability assessment of the Black Sea catchment. Environ. Sci. Policy 2015, 46, 57–69. [Google Scholar] [CrossRef]
  35. Fasel, M.; Brethaut, C.; Rouholahnejad, E.; Lacayo-Emery, M.A.; Lehmann, A. Blue water scarcity in the Black Sea catchment: Identifying key actors in the water-ecosystem-energy-food nexus. Environ. Sci. Policy 2016, 66, 140–150. [Google Scholar] [CrossRef]
  36. EnviroGRIDS. Core Datasets. Available online: http://blacksea.grid.unep.ch/ (accessed on 5 May 2017).
  37. Lehmann, A.; Giuliani, G.; Ray, N.; Rahman, K.; Abbaspour, K.C.; Nativi, S.; Craglia, M.; Cripe, D.; Quevauviller, P.; Beniston, M. Reviewing innovative Earth observation solutions for filling science-policy gaps in hydrology. J. Hydrol. 2014, 518, 267–277. [Google Scholar] [CrossRef]
  38. Giuliani, G.; Ray, N.; Lehmann, A. Building Regional Capacities for GEOSS and INSPIRE: A journey in the Black Sea Catchment. Int. J. Adv. Comput. Sci. Appl. 2013, 3, 19–27. [Google Scholar] [CrossRef]
  39. Nativi, S.; Craglia, M.; Pearlman, J. Earth Science Infrastructures Interoperability: The Brokering Approach. IEEE J. Sel. Top. Appl. Obs. Remote Sens. 2013, 6, 1118–1129. [Google Scholar] [CrossRef]
  40. Gorgan, D.; Bacu, V.; Mihon, D.; Stefanut, T.; Rodila, D.; Cau, P.; Abbaspour, K.; Giuliani, G.; Ray, N.; Lehmann, A. Software Platform Interoperability Throughout EnviroGRIDS Portal. IEEE J. Sel. Top. Appl. Observ. Remote Sens. 2012, 5, 1617–1627. [Google Scholar] [CrossRef]
  41. Giuliani, G.; Nativi, S.; Lehmann, A.; Ray, N. WPS mediation: An approach to process geospatial data on different computing backends. Comput. Geosci. 2012, 47, 20–33. [Google Scholar] [CrossRef]
  42. Castronova, A.M.; Goodall, J.L.; Elag, M.M. Models as web services using the Open Geospatial Consortium (OGC) Web Processing Service (WPS) standard. Environ. Model. Softw. 2013, 41, 72–83. [Google Scholar] [CrossRef]
  43. Dubois, G.; Schulz, M.; Skoien, J.; Bastin, L.; Peedell, S. eHabitat, a multi-purpose Web Processing Service for ecological modeling. Environ. Model. Softw. 2013, 41, 123–133. [Google Scholar] [CrossRef]
  44. NASA Global Change Master Directory. Available online: https://gcmd.nasa.gov/ (accessed on 5 May 2017).
  45. Giuliani, G.; Peduzzi, P. The PREVIEW Global Risk Data Platform: A geoportal to serve and share global data on risk to natural hazards. Nat. Hazards Earth Syst. Sci. 2011, 11, 53–66. [Google Scholar] [CrossRef]
  46. Global Risk Data Platform. Available online: http://preview.grid.unep.ch/ (accessed on 5 May 2017).
  47. Water Information System for Europe. Available online: http://water.europa.eu/ (accessed on 5 May 2017).
  48. Hansen, J.; Kharecha, P.; Sato, M.; Masson-Delmotte, V.; Ackerman, F.; Beerling, D.J.; Hearty, P.J.; Hoegh-Guldberg, O.; Hsu, S.L.; Parmesan, C.; et al. Assessing “Dangerous Climate Change”: Required Reduction of Carbon Emissions to Protect Young People, Future Generations and Nature. PLoS ONE 2013, 8, e81648. [Google Scholar] [CrossRef] [PubMed]
  49. Patel, N.N.; Angiuli, E.; Gamba, P.; Gaughan, A.; Lisini, G.; Stevens, F.R.; Tatem, A.J.; Trianni, G. Multitemporal settlement and population mapping from Landsat using Google Earth Engine. Int. J. Appl. Earth Obs. Geoinf. 2015, 35, 199–208. [Google Scholar] [CrossRef]
  50. Alonso, A.; Munoz-Carpena, R.; Kennedy, R.E.; Murcia, C. Wetland Landscape Spatio-Temporal Degradation Dynamics Using the New Google Earth Engine Cloud-Based Platform: Opportunities for Non-Specialists in Remote Sensing. Trans. ASABE 2016, 59, 1333–1344. [Google Scholar]
  51. Shelestov, A.; Lavreniuk, M.; Kussul, N.; Novikov, A.; Skakun, S. Exploring Google Earth Engine Platform for Big Data Processing: Classification of Multi-Temporal Satellite Imagery for Crop Mapping. Front. Earth Sci. 2017, 5, 1–10. [Google Scholar] [CrossRef]
  52. Mateescu, G.; Gentzsch, W.; Ribbens, C.J. Hybrid Computing-Where HPC meets grid and Cloud Computing. Future Gener. Comput. Syst. 2011, 27, 440–453. [Google Scholar] [CrossRef]
  53. Hajibaba, M.; Gorgin, S. A Review on Modern Distributed Computing Paradigms: Cloud Computing, Jungle Computing and Fog Computing. J. Comput. Inf. Technol. 2014, 22, 69–84. [Google Scholar] [CrossRef]
  54. GIS Cloud. Real-Time Mapping Platform for the Entire Workflow of Your Organization. Available online: http://www.giscloud.com/ (accessed on 5 May 2017).
  55. Evangelidis, K.; Ntouros, K.; Makridis, S.; Papatheodorou, C. Geospatial services in the Cloud. Comput. Geosci. 2014, 63, 116–122. [Google Scholar] [CrossRef]
  56. Holos Berkeley Ecoinformatics Engine. Available online: https://holos.berkeley.edu/resources/code-examples (accessed on 5 May 2017).
  57. Kao, M.C.J.; Gesmann, M.; Gheri, F. Download Data from the FAOSTAT Database of the Food and Agricultural Organization (FAO) of the United Nations; FAO: Roma, Italy, 2015. [Google Scholar]
  58. GEODAB—GEO Discovery and Access Broker. Available online: http://www.geodab.net/ (accessed on 5 May 2017).
  59. NASA API Portal. Available online: https://api.nasa.gov/ (accessed on 5 May 2017).
  60. Merrifield, M.S.; McClintockb, W.; Burtb, C.; Foxc, E.; Serpad, P.; Steinbacke, C.; Gleasona, M. MarineMap: A web-based platform for collaborative marine protected area planning. Ocean Coast. Manag. 2013, 74, 67–76. [Google Scholar] [CrossRef]
  61. Cravens, A.E. Negotiation and Decision Making with Collaborative Software: How MarineMap ‘Changed the Game’ in California’s Marine Life Protected Act Initiative. Environ. Manag. 2015, 57, 1–24. [Google Scholar] [CrossRef] [PubMed]
  62. Sharp, R.; Tallis, H.T.; Ricketts, T.; Guerry, A.D.; Wood, S.A.; Chaplin-Kramer, R.; Nelson, E.; Ennaanay, D.; Wolny, S.; Olwero, N.; et al. InVEST 3.2.0 User’s Guide; Stanford Woods Institute for the Environment: Stanford, CA, USA, 2015. [Google Scholar]
  63. Ruckelshaus, M.; McKenzie, E.; Tallis, H.; Guerry, A.; Daily, G.; Kareiva, P.; Polasky, S.; Ricketts, T.; Bhagabati, N.; Wood, S.A.; et al. Notes from the field: Lessons learned from using ecosystem service approaches to inform real-world decisions. Ecol. Econ. 2015, 115, 11–21. [Google Scholar] [CrossRef]
  64. Goldman-Benner, R.L.; Benitez, S.; Boucher, T.; Calvache, A.; Daily, G.; Kareiva, P.; Kroeger, T.; Ramos, A. Water funds and payments for ecosystem services: practice learns from theory and theory can learn from practice. Oryx 2012, 46, 55–63. [Google Scholar] [CrossRef]
  65. Bremer, L.; Auerbach, D.A.; Goldstein, J.H.; Vogl, A.L.; Shemie, D.; Nelson, J.L.; Kroeger, T.; Benítez, S.P.; Calvache, A.; Guimarães, J.; et al. One size does not fit all: Diverse approaches to natural infrastructure investments within the Latin American Water Funds Partnership. Ecosyst. Serv. 2016, 17, 217–236. [Google Scholar] [CrossRef]
  66. Vogl, A.L.; Tallis, H.; Douglass, J.; Sharp, R.; Wolny, S.; Veiga, F.; Benitez, S.; León, J.; Game, E.; Petry, P.; et al. A Resource Investment Optimization System: Introduction & Theoretical Documentation; Stanford University: Stanford, CA, USA, 2015; p. 76. [Google Scholar]
  67. OpenStreetMap. Available online: http://www.openstreetmap.org/ (accessed on 5 May 2017).
  68. MAP-X: Mapping and Assessing the Performance of Extractive Industries. Available online: http://www.mapx.io/ (accessed on 5 May 2017).
  69. Shiny—Easy Web Applications in R. Available online: http://www.rstudio.com/products/shiny (accessed on 5 May 2017).
  70. Stamatian, F.; Baba, C.O.; Timofe, M.P. Barriers in the Implementation of Health Information Systems: A Scoping Review. Transylv. Rev. Adm. Sci. 2013, 9, 156–173. [Google Scholar]
  71. Schwister, F.; Fiedler, M. What are the main barriers to smart energy information systems diffusion? Electron. Mark. 2015, 25, 31–45. [Google Scholar] [CrossRef]
  72. Rowley, J. The wisdom hierarchy: Representations of the DIKW hierarchy. J. Inf. Sci. 2007, 33, 163–180. [Google Scholar] [CrossRef]
  73. Rodila, D.; Ray, N.; Gorgan, D. Conceptual model for environmental science applications on parallel and distributed infrastructures. Environ. Syst. Res. 2015, 4, 23. [Google Scholar] [CrossRef]
Figure 1. Selected SDGs (Annex 1) at various scales and under numerous global changes, with some existing integrative approaches to address them (Annex 2).
Sustainability 09 00858 g001
Figure 2. Barriers and solutions in the workflow from data to decision making for sustainability. (A) data access; (B) data size; (C) ability to elaborate and iterate existing software; and (D) knowledge transmission. Plain arrows represent solutions to lift barriers and dotted arrows represent active feedback in the workflow.
Sustainability 09 00858 g002
Figure 3. EnviroGRIDS (a) Geoportal to expose the data produced by enviroGRIDS as OGC web services or to download, including metadata (blacksea.grid.unep.ch); and (b) typical SDI architecture and web services.
Sustainability 09 00858 g003
Figure 4. Google Earth Engine. (a) public data catalog, (b) on-demand, and (c) batch computation modes.
Sustainability 09 00858 g004
Figure 5. Berkeley Ecoinformatics Engine (a) open API giving direct access to data in a third-party statistical package (http://ropensci.org); and (b) the Ecoengine conceptual model.
Sustainability 09 00858 g005aSustainability 09 00858 g005b
Figure 6. Participatory approaches and tools (a) Screenshot depicting the SeaSketch interface, with map viewer (left), and the collaborative discussion forums (right); and (b) workflow of the RIOS tool for targeting ecosystem services in watershed management.
Sustainability 09 00858 g006

