
Decoupling and Decomposition Analysis of Carbon Emissions from Electric Output in the United States

1
State Key Laboratory of Desert and Oasis Ecology, Xinjiang Institute of Ecology and Geography, Urumqi 830011, China
2
College of Resources and Environment, University of Chinese Academy of Sciences, Beijing 100049, China
3
School of Economic & Management, China University of Petroleum (Huadong), No. 66 West Changjiang Road, Qingdao 266580, China
*
Author to whom correspondence should be addressed.
Sustainability 2017, 9(6), 886; https://doi.org/10.3390/su9060886
Submission received: 10 April 2017
/
Revised: 18 May 2017
/
Accepted: 19 May 2017
/
Published: 25 May 2017
(This article belongs to the Section Energy Sustainability)
Abstract
:The rapid growth of the electricity sector in the United States has been accompanied by a dramatic rise in CO2 emissions. To understand the driving effects that contribute to the increase in CO2 emissions during electricity generation, as well as the relationship between the emissions and electricity output, a novel decoupling index on the basis of the multilevel logarithmic mean divisia index (LMDI) method is presented in this paper. The results of our study indicate that, on the one hand, the electricity output effect played a crucial role in increasing CO2 emissions. On the other hand, the energy mix effect and the conversion efficiency effect made a contribution to curbing the related CO2 emissions in most of the years covered by our study. The power production structure effect and emission factor effect each played a negative role in the decoupling process. No decoupling was the main status during most of the years covered in our study, with a strong decoupling status being the least common state.
1. Introduction
The ever-increasing focus on climate change has caused both growing concern and heated debates on the issue of greenhouse gases (GHGs) [1,2,3,4,5]. As demonstrated by the Intergovernmental Panel on Climate Change (IPCC), GHGs consist of anthropogenic emissions of carbon dioxide (CO2), methane (CH4), nitrous oxide (N2O), hydrofluorocarbons (HFCs), perfluorocarbons (PFCs), sulfur hexafluoride (SF6), hydro chlorofluorocarbons (HCFCs), and chlorofluorocarbons (CFCs). Moreover, the increase in GHGs poses a threat to the economy and to society. As just one example, extreme weather has contributed to a decline in agriculture output. To curb GHG emissions, there is a desperate need to transform the world into a low-carbon energy environment [6,7,8,9,10,11,12]. The electricity sector burns 68% of global fossil fuels and produces 40% of global CO2 emissions [13]. In addition, energy consumption in the electricity sector increased by 40% between 1990 and 2008 [13,14]. Thus, understanding the drivers of carbon emissions and the decoupling status of the electricity sector can facilitate not only the electricity sector, but also the movement of modern energy systems to a low–carbon model [15]. In this paper, we attempt to explore the drivers of carbon emissions and the decoupling status of electricity in the United States. To accomplish these goals, we use a novel decoupling index on the basis of the multilevel logarithmic mean divisia index (LMDI) method.
2. Literature Review
The issue of CO2 emissions, the driving factors behind those emissions and the relationship between economic indicators, energy, and CO2 emissions have all been discussed in previous studies [16,17,18,19,20,21]. As for the emissions caused by electricity generation, scientists have also focused their attention on the emissions of the electricity sector in various areas [10,20,22,23]. Ali found that carbon dioxide (CO2) emissions coming from fossil fuel-fired power plants are a major focus for emissions abatement advocates, and created an optimization model to assess and explore Singapore’s various CO2 emission reduction strategies, particularly with regard to electricity generation in Singapore up to the year 2020 [24]. Fumitaka (2017) examines the relationship between renewable and non-renewable electricity consumption and economic development in three transition economies in the Baltic region. This study employs homogeneous and heterogeneous panel methods. Then, a unidirectional causality from the region’s economic development to renewable electricity consumption was found [25]. Byun estimated Korean consumers’ marginal utility and studied an appropriate generation mix, which was derived using the hierarchical Bayesian logit model in a discrete choice experiment, and found that consumers consider the danger posed by the source of electricity as the most important factor among the effects of electricity generation sources [26]. Cabral proposed an alternative method for applying the Moran’s I test in exploratory analyses for spatial autocorrelation. Cabral found evidence which indicates that regional electricity consumption in Brazil is spatially dependent, presenting a spatial pattern of dissimilarity between regions to ensure consistent, unbiased and efficient estimates to obtain electricity use forecasts [27]. Da Silva (2017) assessed the main drivers of household electricity prices in the European Union (EU), throughout a period of deep sector transformation. This was accomplished by analyzing the long-term progress of household electricity prices across the EU, in relation to the variable of household electricity prices with variables related to sector liberalization. Da Silva did this by developing a dynamic model with panel data through the GMM proposal method [28]. When it comes to reducing carbon dioxide emissions and the use of renewable energy resources, Aquila analyzed long-term policies that have been applied in several countries. These policies include feed-in tariffs, shares with commercialization of certificates, auctions, and net metering. This study also discussed the main advantages and disadvantages of these incentive strategies from the perspective of renewable sources [29]. Some studies have taken the US as an example, exploring carbon emissions from different sources, such as land-use changes [15,30,31,32,33], farm operations [34], agriculture and forestry [35], and international trade [36]. Fatih Bayrak and Nidal Abu-Hamdeh published a comprehensive review of an exergy analysis and performance assessment relating to a wide range of solar electricity production. They also evaluated solar electricity options, including photovoltaics (PVs) and hybrid (PV/Twater or PV/Tair) solar collectors [37]. Scientists have also paid close attention to the emissions of the electricity sector in various areas [10,20,22,23]. Ciarreta, for example, proclaimed that no significant change in behavior was found for nuclear, hydropower and coal emissions. However, a change was observed with regard to combined cycle bidding strategies after the entry of renewable generators. The analysis showed that the massive expansion in the use of renewable energy sources made other power generators’ behavior more competitive in the short run, but the effect was not persistent or prolonged [38].
In terms of the similarities and differences between structural decomposition analysis and index decomposition analysis based on the available information [39], Andreoni (2016) conducted a decomposition analysis of the energy-related CO2 emissions of 33 countries [40]. Decoupling analysis has become a significant issue recently. Ren explored the impacts of industry structure, economic output, energy structure, energy intensity, and emission factors on the total carbon dioxide emissions from China’s manufacturing industry. Ren also analyzed the decoupling elasticity of the manufacturing industry during the period from 1996 to 2010 [41]. Yu and Zhou (2017) discussed the environmental pressures caused by economic growth, which has occurred in cities undergoing rapid economic growth and a decoupling relationship in Chongqing, China [42].
Some researchers take the US as an example, exploring the carbon emissions from different sources, such as land-use change [30,31,32,33], farm operations [34], agriculture and forestry [35], and international trade [36]. The changes in carbon emissions in the US partly related to the extraction of natural gas from shale rock in the United States (US). The development of this new process is one of the landmark events in the 21st century [15,43,44] and is being heralded as a transition fuel which will lead to a low-carbon future [15,45,46,47,48,49,50,51,52,53]. Table 1 summarizes some typical studies of the US, which are closely related to our research. The main features of these studies include the methodology employed and the main findings [54,55,56,57,58,59,60,61,62].
Most previous studies have tended to decompose the energy-related CO2 emissions of a sector from an economic aspect, using gross domestic product (GDP) or per capita GDP as one of the influencing factors. However, we conduct the research by using electricity production as the output of the electricity sector when launching our decomposition and decoupling analysis and research. In view of the characteristics of the electricity sector, a novel decoupling method was applied, in order to determine the relationship between emissions and the output of the electricity sector. The LMDI method was applied, in order to determine the influencing factors of the energy-related CO2 emissions of the electric power generation, and in this paper, compare the attribution of each effect.
3. Methodologies and Data
3.1. Methodologies
3.1.1. Multilevel Index Decomposition for Decoupling
As stated above, a decomposition method can detect the driving factors behind the changes in carbon dioxide emissions and, even more significantly, in the overall trend of change. Based on an expanded Kaya identity and the research of Ang [63,64], the LMDI method was used in this paper. Meanwhile, both additive LMDI and multiplicative LMDI were applied to more precisely probe the factors driving the CO2 emissions caused by electricity generation [65,66,67,68]. The total CO2 emissions caused by electricity generation can be decomposed into five factors: (1) electric power production (electricity power output effect); (2) electricity power generation structure (structure effect); (3) the gross coal consumption rate (energy conversion efficiency effect); (4) energy mix (mix effect); and (5) CO2 emission factors (emission factor effect).
First, the additive LMDI method is shown in Equation (1):
where represents the total energy-related CO2 emissions from electricity generation in the US (Mt); G is the electric power production (Mtce); refers to fire power production (Mtce); and are the energy consumption of thermal power generation (Mtce) and energy consumption by fuel type i (Mtce), and represents the CO2 emissions by fuel type i (Mt).
Equation (1) can also be stated as:
Here, S (G0/G) means electricity power generation structure, and I (E0/G0) denotes the gross coal consumption rate; (Ei/E0) refers to the share of fuel i; (Ci/Ei) represents the emission factor of fuel i:
Each effect can be calculated as below:
where:
and stand for the CO2 emissions in a target year and base year, respectively. The contribution of each effect is as follows: the electricity power output effect (), power production structure effect (), energy conversion efficiency effect (), energy mix effect (), and the emission factor effect ().
We applied the multiplicative LMDI to obtain a deeper analysis and identify the driving factors of the contribution of each effect, as follows:
where DG, DS, DI, DM, and MF refer to the growth rates of CO2 emissions corresponding to the electricity power production effect, power production structure effect, energy conversion efficiency effect, energy mix effect and emission factor effect, respectively.
3.1.2. Decoupling Index and Status Analysis
Previous researchers tended to focus on the relationship between environmental issues and economic factors (such as GDP). Since we chose the electricity sector as the object upon which to conduct the discussion, we presented a novel decoupling method for a theoretical framework, in order to analyze the relationship between the development of the electricity sector and the environmental changes, which is advanced on the basis of D. Diakoulaki [69]:
Here, represents the efforts made by the government (or society) to decrease the level of carbon dioxide emissions. In addition, the changes in the CO2 emissions caused by the output of the electricity sector can influence the decoupling status. If , then the decoupling index can be defined as the proposition of the output effect, which is shown in Equation (18), as follows:
When , this means that the output effect has played a negative role, which also indicates that the reduction efforts did not outweigh the CO2 emissions caused by the output effect. Therefore, extra efforts must be made. In this case, the decoupling can be calculated as Equation (19):
where represents the fraction of the additional efforts needed to offset the total output effect. In both of the two situations, if , this denotes strong decoupling efforts. If , this represents moderate decoupling efforts. When , this indicates the existence of no decoupling efforts. Additionally,, , , and indicate the contribution to the total decoupling state of each effect [10,15,20].
3.2. Data
This study uses the energy-related electricity generation CO2 emissions of each source data, as well as the data pertaining to the energy consumption of each source, as obtained from the Energy Information Administration (EIA) [70]. The electricity generation data are derived from the BP Statistical Review of World Energy [71]. It should be noted that, in order to make our findings more applicable to the electricity sector, we calculate from the type of coal (i = 1), oil (i = 2) and natural gas (i = 3), after the merger of various fuels.
4. Results and Discussion
4.1. Energy-Related Electricity CO2 Emission
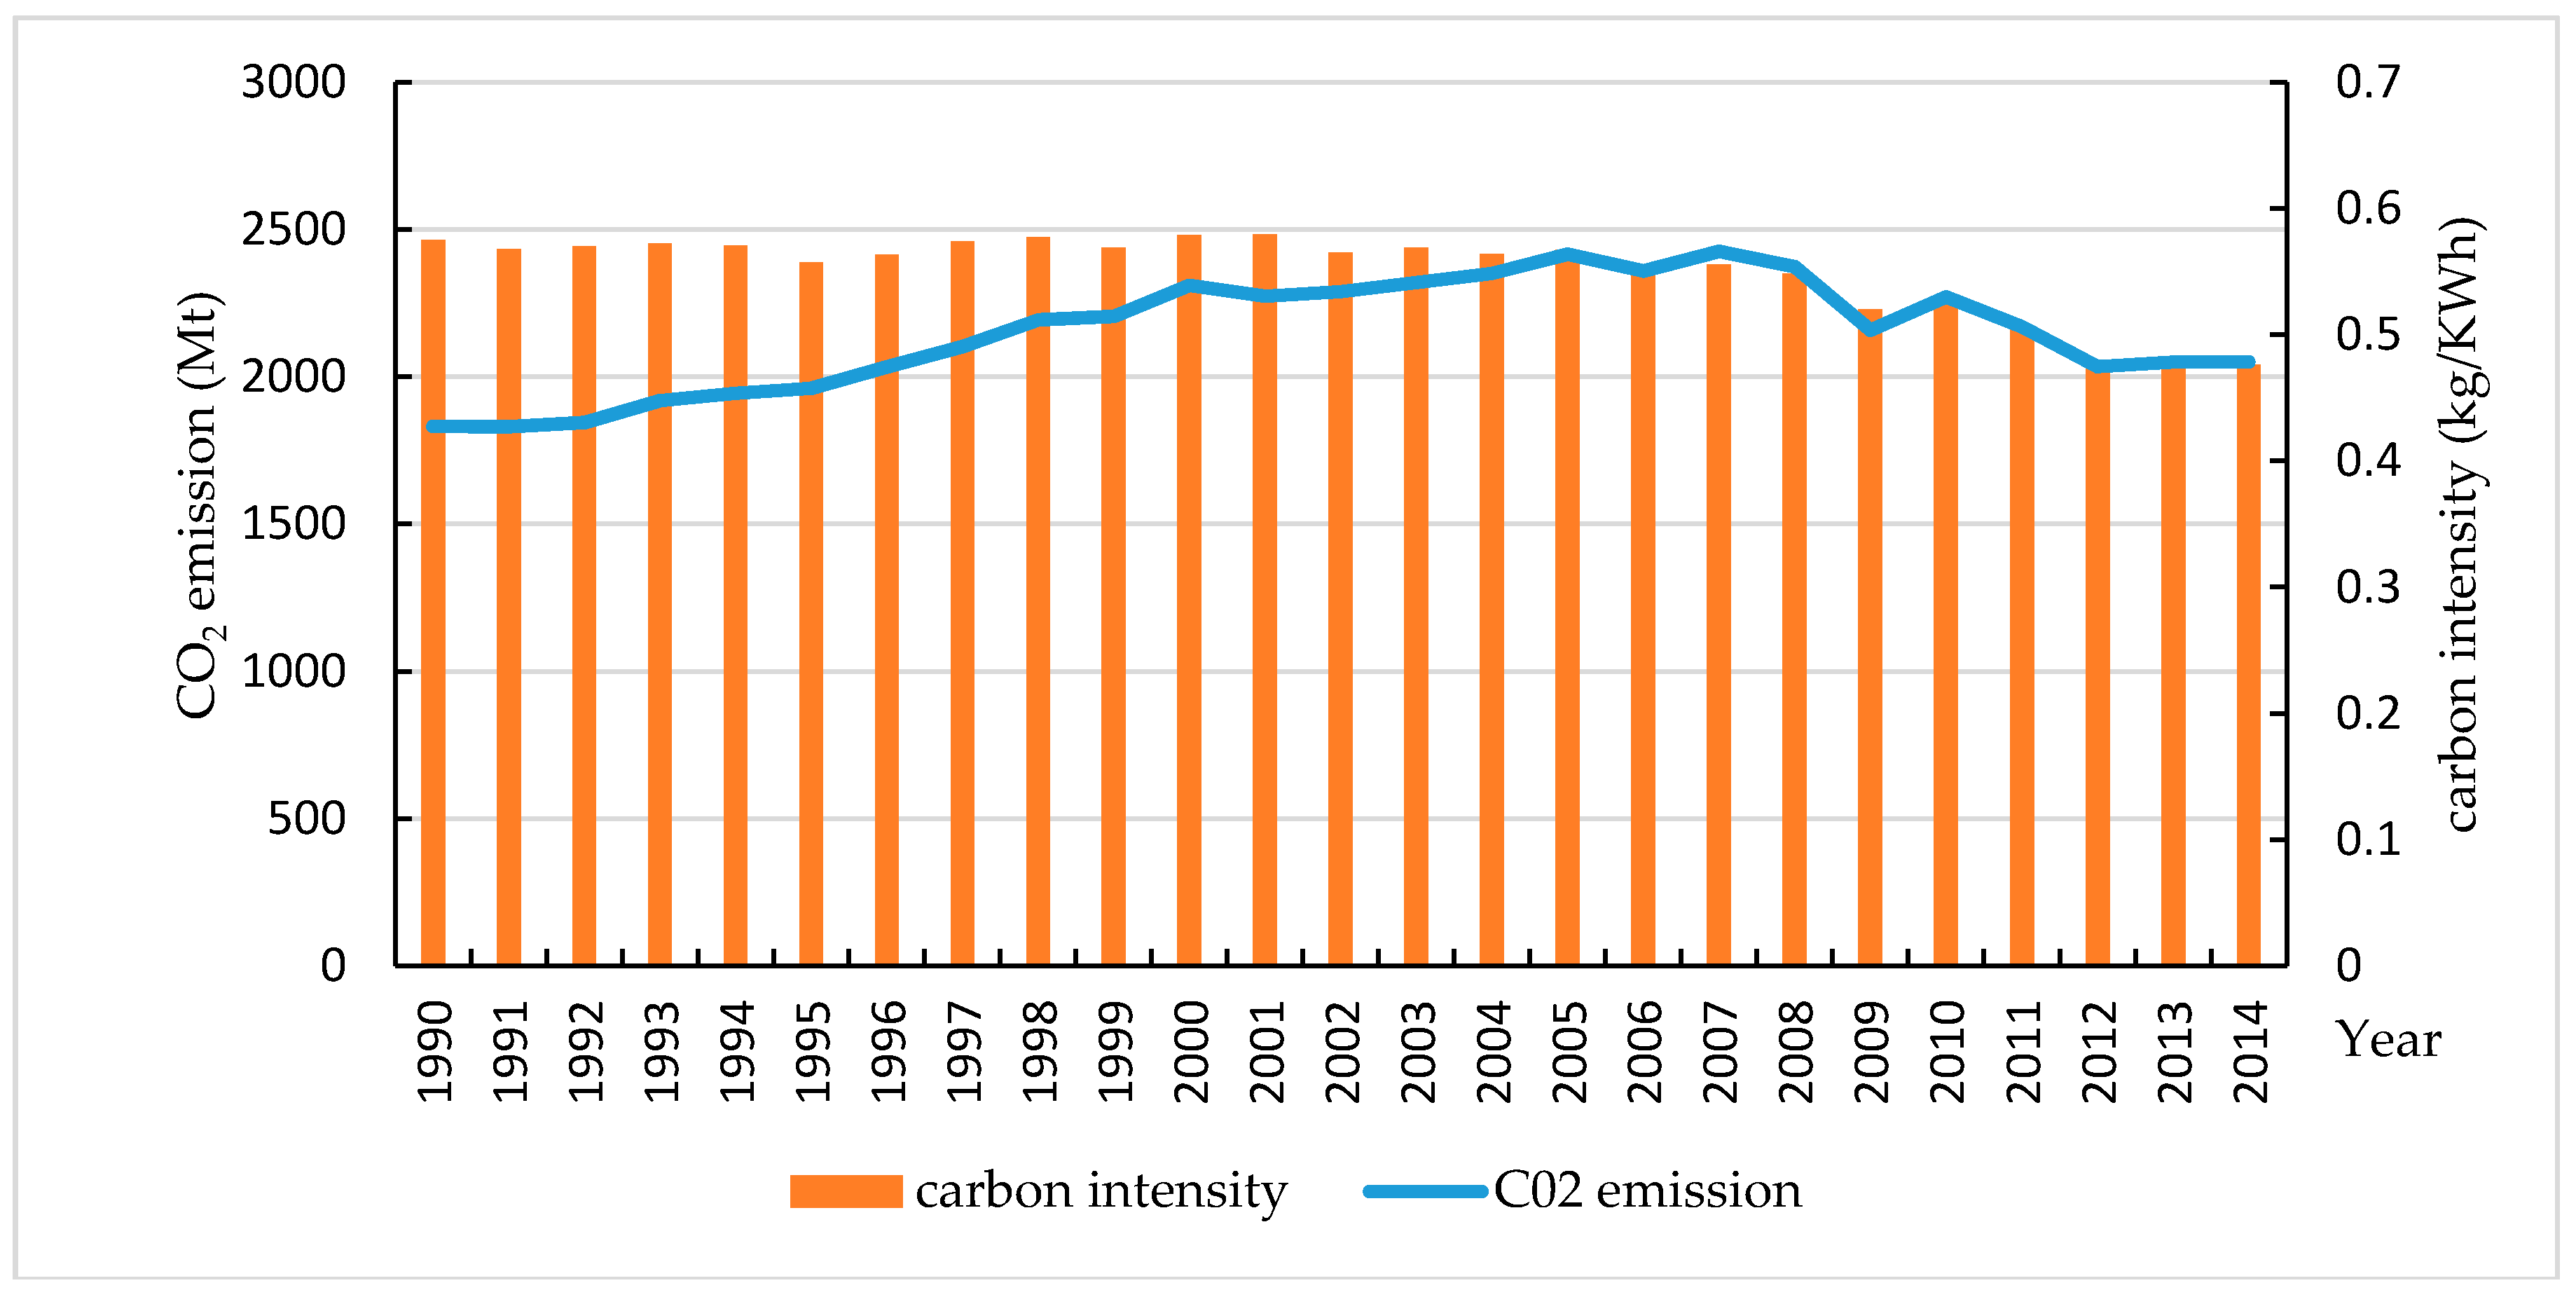
The changes in energy-related CO2 emissions and carbon intensity (defined as the energy-related CO2 emissions in electricity generation divided by the electricity produced) are shown in Figure 1. On the whole, annual energy-related CO2 emissions from electricity generation, as well as the aggregate carbon intensity, were on the decrease during the period covered by our study. As for CO2 emissions, the study span can be divided into two phases: 1990–2005 and 2006–2014. The corresponding emissions tended to increase during the first phase, while in the second phase, the emission levels began to show a decreasing trend. The annual growth rate of energy-related CO2 emissions was 0.47%, and the carbon intensity decreased at an average change rate of 0.78%.
4.2. Decomposition Results
The decomposition results shown in Figure 2 and Table 2 indicate to what extent the five effects influence the changes of carbon dioxide emissions. Various indicators posed different effects in the US in different years. Generally speaking, among the five factors, the electric power production effect played a positive role in the increase of CO2 emissions. The energy mix effect and the conversion efficiency effect both contributed to curbing the related CO2 emission in most years. However, the influence of the other factors varied from year to year. This finding implies that, when the electricity plants work, high levels of carbon dioxide emissions were still common. In other words, the increase in electricity generation directly contributed to an emissions growth trend in the US. However, the improvement of conversion efficiency can decrease the level of CO2 emissions. As a consequence, a shift to less energy-intensive ways to generate power, and switching to low-emission fuels, are both feasible measures to combat climate change. In addition, the energy mix effect showed an ability to curb the increase in CO2 emissions during most of the observed years, while the emission factor effect did not exert any significant influence, compared to other indicators, in most years. In general, the levels of CO2 emissions increased between 1990 and 2014, except for the following periods: 1990–1991, 2000–2001, 2005–2006, 2007–2009, and 2010–2012. Moreover, the total change in CO2 emission levels from 1990 to 2014 was 218.853 Mt. Additionally, since electricity output played a significant role in influencing the overall trend, the relationship between this effect and other effects should be determined. In addition, the additive LMDI and multiplicative LMDI results are not only a means to detect how the driving factors influence the overall changing trend of CO2 emissions, but they also serve as the prerequisite and an indispensable part of the calculation and analysis of the decoupling index.
4.3. Decoupling Index State
According to the decoupling index, the relationship between CO2 emissions and the output of the electricity sector in the US from 1990 to 2014 has been analyzed. The decoupling results are shown in Table 3, and some insightful results have been acquired. According to the method presented in the decoupling effort index formulation section, we divide the decoupling effort indices into three states: strong decoupling, relative decoupling, and no decoupling. Generally speaking, the most common state is one of no decoupling. This “no decoupling” state occurred in 12 years of the study period. Since the decoupling index can test whether or not the development or generation of the electricity sector synchronizes with the protection of the environment, a no decoupling status indicates that the development of the electricity sector must rely, to a large extent, on the burning of fossil fuels.
A strong decoupling status was the least common of the three decoupling states during our study period. This indicates that government efforts to curb the increase or even to reduce the levels of CO2 emissions were greatly effective. The policies and measures taken by the government or society outweigh the emissions caused by the increased output of the electricity sector. In addition, because the decoupling index can also demonstrate and reflect the reactions of the government when confronted with environmental pressure, a strong decoupling status also indicates a relatively harmonious relationship between the government and environmental groups.
As for the contribution of each effect, the power production structure effect () and emission factor effect () played a negative role in the decoupling process. In other words, the more the thermal electricity plants use fossil fuels to generate electricity, the more likely that there will be a relationship. However, the degree of the influence of other effects varied from year to year during our study period. It should be noted that coal-fired generation still accounts for 70.83% of total electricity output. For this reason alone, finding methods to improve the degree of fuel conversion efficiency or of switching to low-carbon fuels is necessary.
5. Conclusions and Policy Implications
In this paper, we analyze the changes in CO2 emissions from five different aspects, as well as the decoupling states, by using both additive and multiplicative LMDI methods and a decoupling index analysis. We applied a novel decoupling index to probe the relationship between the CO2 emissions from electricity generation and electricity output. We also analyzed the changes of decoupling indicators by dividing the index into four factors (based on the LMDI approach), in order to investigate the factors that affect the decoupling process. We arrived at a number of conclusions.
By using the decomposition method to determine the driving factors that influenced the changes in the levels of energy-related CO2 emissions in the United States, we found that the electricity output effect played a positive role in increasing the energy-related CO2 emissions in the US. In addition, the energy mix effect and the conversion efficiency effect contributed to curbing the energy-related CO2 emissions in the US during most of the years covered by our study. The power production structure effect and emission factor effect played a negative role in the overall decoupling process. Moreover, the electricity output effect played a crucial role in increasing CO2 emissions.
According to the decoupling effort index, we came to the conclusion that a no decoupling status was the main status in most of the studied years (1990 to 2014), while a strong decoupling status was the least common state.
In view of the emission reduction targets of the US, effective measures and policies should be taken to achieve the goal of reducing greenhouse gas emissions by 28% by 2025. As such, some recommendations are put forward here, as follows:
- (1)
- With the current rapid economic growth, the total demand for electricity is on the rise. Generally speaking, carbon emissions are proportional to the amount of thermal power plants, because thermal power plants contribute most of the carbon emissions. Measures pertaining to these thermal power plants are essential in view of this situation. For example, shutting down the smaller thermal power units would be an effective way to reduce emissions.
- (2)
- Most of the thermal power plants in US generate electricity by burning coal. This coal has high carbon content and low combustion efficiency, thereby resulting in more carbon emissions. However, as far as the current status is concerned, thermal power remains in the dominant position. As such, the energy intensity effect should be treated as a key issue. As stated above, the energy intensity effect contributed to reducing CO2 emissions. Studies on improving the efficiency of energy should be encouraged. Correspondingly, policies to improve energy efficiency and promote the use of renewable fuels or clean energy sources should be introduced and implemented. Moreover, developing a low-carbon economy and adjusting the industry structure are also sensible options.
- (3)
- Though the electricity power generation structure effect did not seem to be the fundamental element influencing carbon emissions, upgrading the power generation structure could be a beneficial way to limit the growth of CO2 emissions and diminish the harm being caused to the environment. There is no doubt that fossil fuels still provide the majority of energy consumption in electricity generation. This factor constricts the diminution of CO2 emissions. As a consequence, measures to optimize the energy mix are urgently required to be put into practice. According to the US Energy Information Administration (EIA), US nuclear power was used to generate nearly 20% of all US electricity in 2015. However, the proportion of coal-fired electricity generation still cannot be adequately controlled when coal plays such a vital role in electricity generation. Therefore, improvements need to be made in the design of conventional power stations, and new combustion technologies need to be expanded in order to reach the efficiency target of producing more electricity from less coal possible.
- (4)
- Generally speaking, opportunities for reducing CO2 emissions were taken in some cases, as follows: energy efficiency, energy conservation, fuel switching, and carbon capture and sequestration.
As for power plants, increasing fuel costs could force energy-intensive power plants to make substantial efficiency improvements (in order to avoid the additional fuel costs). In addition, switching to renewable fuels helps power plants to reduce their potential environmental liabilities, by replacing fossil fuels with renewable fuels, such as hydropower and nuclear power. The amount of CO2 emissions from electricity generation is extremely large. For this reason, additional policies and measures should be put into practice, as there is a desperate need for the current environmental state of the electric power sector to be improved.
Acknowledgments
The current work is supported by the fund of Xinjiang Institute of Ecology and Geography, Chinese Academy of Sciences (Y655021001) and “the Fundamental Research Funds for the Central Universities” (27R1706019B) and the Recruitment Talent Fund of China University of Petroleum (Huadong) (05Y16060020).
Author Contributions
Xue-Ting Jiang conceived, designed the experiments, performed the experiments, and wrote the paper; Rongrong Li analyzed the data and contributed reagents/materials/analysis tools; and all authors read and approved the final manuscript.
Conflicts of Interest
The authors declare no conflict of interest.
References
- Véliz, K.D.; Kaufmann, R.K.; Cleveland, C.J.; Stoner, A.M.K. The effect of climate change on electricity expenditures in Massachusetts. Energy Policy 2017, 106, 1–11. [Google Scholar] [CrossRef]
- Roinioti, A.; Koroneos, C. The decomposition of CO2 emissions from energy use in Greece before and during the economic crisis and their decoupling from economic growth. Renew. Sustain. Energy Rev. 2017, 76, 448–459. [Google Scholar] [CrossRef]
- Jiang, X.-T.; Dong, J.-F.; Wang, X.-M.; Li, R.-R. The Multilevel Index Decomposition of Energy-Related Carbon Emission and Its Decoupling with Economic Growth in USA. Sustainability 2016, 8, 857. [Google Scholar] [CrossRef]
- Intergovernmental Panel on Climate Change. Contribution of Working Group III to the Fourth Assessment Report of the Intergovernmental Panel on Climate Change Cambridge. In Climate Change 2007; Cambridge University Press: London, UK, 2007. [Google Scholar]
- Wang, Q.; Chen, Y. Barriers and opportunities of using the clean development mechanism to advance renewable energy development in China. Renew. Sustain. Energy Rev. 2010, 14, 1989–1998. [Google Scholar] [CrossRef]
- Weitzman, M.L. Voting on Prices vs. Voting on Quantities in a World Climate Assembly. Res. Econ. 2016. [Google Scholar] [CrossRef]
- Campiglio, E. Beyond carbon pricing: The role of banking and monetary policy in financing the transition to a low-carbon economy. Ecol. Econ. 2016, 121, 220–230. [Google Scholar] [CrossRef]
- Gössling, S.; Scott, D.; Hall, C.M. Challenges of tourism in a low-carbon economy. Wiley Interdiscip. Rev. Clim. Chang. 2013, 4, 525–538. [Google Scholar] [CrossRef]
- Jabbour, C.J.C.; Neto, A.S.; Gobbo, J.A.; de Souza Ribeiro, M.; de Sousa Jabbour, A.B.L. Eco-innovations in more sustainable supply chains for a low-carbon economy: A multiple case study of human critical success factors in Brazilian leading companies. Int. J. Prod. Econ. 2015, 164, 245–257. [Google Scholar] [CrossRef]
- Wang, Q.; Chen, X. Energy policies for managing China’s carbon emission. Renew. Sustain. Energy Rev. 2015, 50, 470–479. [Google Scholar] [CrossRef]
- Wang, Q. China should aim for a total cap on emissions. Nature 2014, 512, 115. [Google Scholar] [CrossRef] [PubMed]
- Wang, Q.; Chen, Y. Energy saving and emission reduction revolutionizing China’s environmental protection. Renew. Sustain. Energy Rev. 2010, 14, 535–539. [Google Scholar] [CrossRef]
- International Energy Agency. Electricity Information 2010: (Edition complète—ISBN 9789264084193—En Angl. Seulement). In SourceOCDE Energie; OECD—Organisation for Economic Co-operation and Development: Paris, France, 2010; ISBN 9789264084193. [Google Scholar]
- Turconi, R.; Boldrin, A.; Astrup, T. Life cycle assessment (LCA) of electricity generation technologies: Overview, comparability and limitations. Renew. Sustain. Energy Rev. 2013, 28, 555–565. [Google Scholar] [CrossRef]
- Wang, Q.; Chen, X.; Jha, A.N.; Rogers, H. Natural gas from shale formation—The evolution, evidences and challenges of shale gas revolution in United States. Renew. Sustain. Energy Rev. 2014, 30, 1–28. [Google Scholar] [CrossRef]
- Magazzino, C. The relationship between CO2 emissions, energy consumption and economic growth in Italy. Int. J. Sustain. Energy 2014, 35, 844–857. [Google Scholar] [CrossRef]
- Magazzino, C. A Panel VAR Approach of the Relationship Among Economic Growth, CO2 Emissions, and Energy Use in the ASEAN-6 Countries. Int. J. Energy Econ. Policy 2014, 4, 546–553. [Google Scholar]
- Magazzino, C. Economic growth, CO2 emissions and energy use in Israel. Int. J. Sustain. Dev. World Ecol. 2015, 22, 89–97. [Google Scholar] [CrossRef]
- Magazzino, C. The relationship between real GDP, CO2 emissions, and energy use in the GCC countries: A time series approach. Cogent Econ. Financ. 2016, 4, 1152729. [Google Scholar] [CrossRef]
- Wang, Q.; Li, R. Journey to burning half of global coal: Trajectory and drivers of China’s coal use. Renew. Sustain. Energy Rev. 2016, 58, 341–346. [Google Scholar] [CrossRef]
- Wang, Q. Cheaper oil challenge and opportunity for climate change. Environ. Sci. Technol. 2015, 49, 1997–1998. [Google Scholar] [CrossRef] [PubMed]
- Wang, Q. Nuclear safety lies in greater transparency. Nature 2013, 494, 403. [Google Scholar] [CrossRef] [PubMed]
- Wang, Q. China’s citizens must act to save their environment. Nature 2013, 497, 159. [Google Scholar] [CrossRef] [PubMed]
- Ali, H.; Sanjaya, S.; Suryadi, B.; Weller, S.R. Analysing CO2 emissions from Singapore’s electricity generation sector: Strategies for 2020 and beyond. Energy 2017, 124, 553–564. [Google Scholar] [CrossRef]
- Furuoka, F. Renewable electricity consumption and economic development: New findings from the Baltic countries. Renew. Sustain. Energy Rev. 2017, 71, 450–463. [Google Scholar] [CrossRef]
- Byun, H.; Lee, C.-Y. Analyzing Korean consumers’ latent preferences for electricity generation sources with a hierarchical Bayesian logit model in a discrete choice experiment. Energy Policy 2017, 105, 294–302. [Google Scholar] [CrossRef]
- Cabral, J.D.A.; Legey, L.F.L.; Freitas Cabral, M.V.D. Electricity consumption forecasting in Brazil: A spatial econometrics approach. Energy 2017, 126, 124–131. [Google Scholar] [CrossRef]
- Da Silva, P.P.; Cerqueira, P.A. Assessing the determinants of household electricity prices in the EU: A system-GMM panel data approach. Renew. Sustain. Energy Rev. 2017, 73, 1131–1137. [Google Scholar] [CrossRef]
- Aquila, G.; Pamplona, E.D.O.; Queiroz, A.R.D.; Rotela Junior, P.; Fonseca, M.N. An overview of incentive policies for the expansion of renewable energy generation in electricity power systems and the Brazilian experience. Renew. Sustain. Energy Rev. 2017, 70, 1090–1098. [Google Scholar] [CrossRef]
- Searchinger, T.; Heimlich, R.; Houghton, R.A.; Dong, F.; Elobeid, A.; Fabiosa, J.; Tokgoz, S.; Hayes, D.; Yu, T.-H. Use of US croplands for biofuels increases greenhouse gases through emissions from land-use change. Science 2008, 319, 1238–1240. [Google Scholar] [CrossRef] [PubMed]
- Houghton, R.; Hackler, J.; Lawrence, K. The US carbon budget: Contributions from land-use change. Science 1999, 285, 574–578. [Google Scholar] [CrossRef] [PubMed]
- Fargione, J.; Hill, J.; Tilman, D.; Polasky, S.; Hawthorne, P. Land clearing and the biofuel carbon debt. Science 2008, 319, 1235–1238. [Google Scholar] [CrossRef] [PubMed]
- Hertel, T.W.; Golub, A.A.; Jones, A.D.; O’Hare, M.; Plevin, R.J.; Kammen, D.M. Effects of US maize ethanol on global land use and greenhouse gas emissions: Estimating market-mediated responses. BioScience 2010, 60, 223–231. [Google Scholar] [CrossRef]
- Lal, R. Carbon emission from farm operations. Environ. Int. 2004, 30, 981–990. [Google Scholar] [CrossRef] [PubMed]
- McCarl, B.A.; Schneider, U.A. Greenhouse gas mitigation in US agriculture and forestry. Science 2001, 294, 2481–2482. [Google Scholar] [CrossRef] [PubMed]
- Weber, C.L.; Matthews, H.S. Embodied Environmental Emissions in U.S. International Trade, 1997–2004. Environ. Sci. Technol. 2017, 41, 4875–4881. [Google Scholar] [CrossRef]
- Bayrak, F.; Abu-Hamdeh, N.; Alnefaie, K.A.; Öztop, H.F. A review on exergy analysis of solar electricity production. Renew. Sustain. Energy Rev. 2017, 74, 755–770. [Google Scholar] [CrossRef]
- Ciarreta, A.; Espinosa, M.P.; Pizarro-Irizar, C. Has renewable energy induced competitive behavior in the Spanish electricity market? Energy Policy 2017, 104, 171–182. [Google Scholar] [CrossRef]
- Su, B.; Ang, B.W. Structural decomposition analysis applied to energy and emissions: Some methodological developments. Energy Econ. 2012, 34, 177–188. [Google Scholar] [CrossRef]
- Andreoni, V.; Galmarini, S. Drivers in CO2 emissions variation: A decomposition analysis for 33 world countries. Energy 2016, 103, 27–37. [Google Scholar] [CrossRef]
- Ren, S.; Yin, H.; Chen, X. Using LMDI to analyze the decoupling of carbon dioxide emissions by China’s manufacturing industry. Environ. Dev. 2014, 9, 61–75. [Google Scholar] [CrossRef]
- Yu, Y.; Zhou, L.; Zhou, W.; Ren, H.; Kharrazi, A.; Ma, T.; Zhu, B. Decoupling environmental pressure from economic growth on city level: The Case Study of Chongqing in China. Ecol. Indic. 2017, 75, 27–35. [Google Scholar] [CrossRef]
- Wang, Q.; Li, R. Natural gas from shale formation: A research profile. Renew. Sustain. Energy Rev. 2016, 57, 1–6. [Google Scholar] [CrossRef]
- Wang, Q.; Li, R. Research status of shale gas: A review. Renew. Sustain. Energy Rev. 2017, 74, 715–720. [Google Scholar] [CrossRef]
- Hughes, J.D. Energy: A reality check on the shale revolution. Nature 2013, 494, 307–308. [Google Scholar] [CrossRef] [PubMed]
- Hondo, H. Life cycle GHG emission analysis of power generation systems: Japanese case. Energy 2005, 30, 2042–2056. [Google Scholar] [CrossRef]
- Dones, R.; Heck, T.; Hirschberg, S. Greenhouse Gas Emissions from Energy Systems: Comparison and Overview. Energy 2003, 100, 2300. [Google Scholar]
- Bhat, I.; Prakash, R. LCA of renewable energy for electricity generation systems—A review. Renew. Sustain. Energy Rev. 2009, 13, 1067–1073. [Google Scholar] [CrossRef]
- Lund, C.; Biswas, W. A review of the application of lifecycle analysis to renewable energy systems. Bull. Sci. Technol. Soc. 2008, 28, 200–209. [Google Scholar] [CrossRef]
- Van De Vate, J.F. Comparison of energy sources in terms of their full energy chain emission factors of greenhouse gases. Energy Policy 1997, 25, 1–6. [Google Scholar] [CrossRef]
- Weisser, D. A guide to life-cycle greenhouse gas (GHG) emissions from electric supply technologies. Energy 2007, 32, 1543–1559. [Google Scholar] [CrossRef]
- Wang, Q.; Chen, X. China’s electricity market-oriented reform: From an absolute to a relative monopoly. Energy Policy 2012, 51, 143–148. [Google Scholar] [CrossRef]
- Wang, Q. Effective policies for renewable energy—The example of China’s wind power—Lessons for China’s photovoltaic power. Renew. Sustain. Energy Rev. 2010, 14, 702–712. [Google Scholar] [CrossRef]
- Aldy, E.J. An Environmental Kuznets curve analysis of U.S. state-level carbon dioxide emissions. J. Environ. Dev. Rev. Int. Policy 2005, 14, 48–72. [Google Scholar] [CrossRef]
- Aldy, J.E. Divergence in State-Level Per Capita Carbon Dioxide Emissions. Land Econ. 2006, 83, 353–369. [Google Scholar] [CrossRef]
- Aldy, J.E. Energy and Carbon Dynamics at Advanced Stages of Development: An Analysis of the U.S. States, 1960–1999. Energy J. 2006, 28, 91–111. [Google Scholar] [CrossRef]
- Auffhammer, M.; Steinhauser, R. Forecasting the path of U.S. CO2 emissions using state-level information. Rev. Econ. Stat. 2012, 94, 172–185. [Google Scholar] [CrossRef]
- Baldwin, J.G.; Wing, I.S. The Spatiotemporal Evolution of U.S. Carbon Dioxide Emissions: Stylized Facts and Implications for Climate Policy. J. Reg. Sci. 2013, 53, 672–689. [Google Scholar] [CrossRef]
- Lakshmanan, T.R.; Han, X. Factors underlying transportation CO2 emissions in the U.S.A.: A decomposition analysis. Transp. Res. Part D Transp. Environ. 1997, 2, 1–15. [Google Scholar] [CrossRef]
- Lutsey, N.; Sperling, D. America’s bottom-up climate change mitigation policy. Energy Policy 2008, 36, 673–685. [Google Scholar] [CrossRef]
- Shahiduzzaman, M.; Layton, A. Changes in CO2 emissions over business cycle recessions and expansions in the United States: A decomposition analysis. Appl. Energy 2015, 150, 25–35. [Google Scholar] [CrossRef]
- Shahiduzzaman, M.; Layton, A. Decomposition analysis for assessing the United States 2025 emissions target: How big is the challenge? Renew. Sustain. Energy Rev. 2017, 67, 372–383. [Google Scholar] [CrossRef]
- Ang, B.W.; Pandiyan, G. Decomposition of energy-induced CO2 emissions in manufacturing. Energy Econ. 1997, 19, 363–374. [Google Scholar] [CrossRef]
- Kaya, Y. Impact of Carbon Dioxide Emission Control on GNP Growth: Interpretation of Proposed Scenarios. IPCC Energy and Industry Subgroup, Response Strategies Working Group, Paris. Available online: http://www.ipcc.ch/ipccreports/sres/emission/index.php?idp=48 (accessed on 23 May 2017).
- Wang, Q.; Jiang, X.-T.; Li, R. Comparative decoupling analysis of energy-related carbon emission from electric output of electricity sector in Shandong Province, China. Energy 2017, 127, 78–88. [Google Scholar] [CrossRef]
- Wang, Q.; Li, R.; Jiang, R. Decoupling and Decomposition Analysis of Carbon Emissions from Industry: A Case Study from China. Sustainability 2016, 8, 1059. [Google Scholar] [CrossRef]
- Wang, Q.; Li, R.; Liao, H. Toward Decoupling: Growing GDP without Growing Carbon Emissions. Environ. Sci. Technol. 2016, 50, 11435–11436. [Google Scholar] [CrossRef] [PubMed]
- Baležentis, A.; Baležentis, T.; Streimikiene, D. The energy intensity in Lithuania during 1995–2009: A LMDI approach. Energy Policy 2011, 39, 7322–7334. [Google Scholar] [CrossRef]
- Diakoulaki, D.; Mandaraka, M. Decomposition analysis for assessing the progress in decoupling industrial growth from CO2 emissions in the EU manufacturing sector. Energy Econ. 2007, 29, 636–664. [Google Scholar] [CrossRef]
- Energy Information Administration. Carbon Dioxide Emissions from Electricity Generation; Energy Information Administration: Washington, DC, USA, 2017; Volume 2017. [Google Scholar]
- BP Statistical Review of World Energy. 2013. Available online: bp.com/statisticalreview (accessed on 13 June 2013).
Figure 1.
Energy-related CO2 emissions and carbon emission intensity of electric sector during 1990–2014 (1990 is the baseline year).
Figure 1.
Energy-related CO2 emissions and carbon emission intensity of electric sector during 1990–2014 (1990 is the baseline year).

Figure 2.
Decomposition of changes of electricity generation CO2 emission in the US.


Table 1.
Summary of previous studies on the CO2 emission in the US.
| Study | Methodology | Content or Subject |
|---|---|---|
| Lakshmanan (1997) [ 59] | Divisia decomposition | U.S. transportation |
| Aldy (2005) [ 54] | Estimated EKCs | Pre-trade(production-based) and post-trade (consumption-based) CO2 EKCs |
| Aldy (2006) [ 56] | Estimated EKCs and Kaya Identity | The relationship between economic development and energy consumption |
| Aldy (2006) [ 55] | Cross-sectional and stochastic convergence tests | State-level CO2 emissions per capita—production (pre-electricity trade) CO2 and consumption (post-electricity trade) CO2 |
| Lutsey (2008) [ 60] | Investigate three types of GHG policy actions | Local, state, and regional policy actions |
| Auffhammer (2012) [ 57] | Test the squared out-of-sample prediction error of aggregate CO2 emissions | Compare the most common reduced form models used for emissions forecasting, point out shortcomings and suggest improvements |
| Baldwin (2013) [ 58] | Kaya Identity and a novel vector autoregression (VAR) | The evolution driving forces |
| Shahiduzzaman (2015) [ 61] | Decomposition models | Examines the changes in CO2 emissions over business cycle phases |
| Shahiduzzaman (2017) [ 62] | LMDI decomposition | Make quantitative judgment of the challenge to achieve a reduction of net GHGs emissions by 26–28% below its 2005 level by 2025 |
Table 2.
Multiplicative LMDI decomposition of electricity CO2 emissions.
| Year | DG | DS | DI | DM | DF |
|---|---|---|---|---|---|
| 1990–1991 | 1.0119 | 0.9971 | 0.9917 | 0.9984 | 1.0001 |
| 1991–1992 | 1.0038 | 1.0100 | 0.9960 | 0.9974 | 1.0005 |
| 1992–1993 | 1.0365 | 1.0086 | 0.9976 | 1.0025 | 0.9958 |
| 1993–1994 | 1.0161 | 1.0017 | 1.0033 | 0.9943 | 0.9976 |
| 1994–1995 | 1.0321 | 0.9793 | 1.0031 | 0.9934 | 1.0011 |
| 1995–1996 | 1.0267 | 0.9952 | 1.0081 | 1.0085 | 0.9986 |
| 1996–1997 | 1.0139 | 1.0299 | 0.9906 | 0.9990 | 1.0002 |
| 1997–1998 | 1.0372 | 1.0107 | 0.9949 | 0.9980 | 1.0021 |
| 1998–1999 | 1.0207 | 0.9911 | 0.9965 | 0.9969 | 1.0008 |
| 1999–2000 | 1.0296 | 1.0134 | 1.0034 | 0.9978 | 1.0030 |
| 2000–2001 | 0.9834 | 1.0085 | 0.9991 | 0.9985 | 0.9944 |
| 2001–2002 | 1.0322 | 0.9832 | 0.9975 | 0.9954 | 0.9991 |
| 2002–2003 | 1.0063 | 1.0043 | 1.0012 | 1.0081 | 0.9937 |
| 2003–2004 | 1.0227 | 1.0014 | 0.9827 | 0.9996 | 1.0076 |
| 2004–2005 | 1.0214 | 1.0101 | 0.9963 | 0.9980 | 1.0019 |
| 2005–2006 | 1.0021 | 0.9892 | 0.9965 | 0.9900 | 0.9982 |
| 2006–2007 | 1.0232 | 1.0090 | 0.9994 | 0.9959 | 1.0007 |
| 2007–2008 | 0.9910 | 0.9920 | 1.0026 | 0.9987 | 0.9941 |
| 2008–2009 | 0.9588 | 0.9728 | 0.9904 | 0.9918 | 0.9926 |
| 2009–2010 | 1.0446 | 1.0119 | 0.9971 | 0.9977 | 1.0005 |
| 2010–2011 | 0.9936 | 0.9735 | 1.0023 | 0.9944 | 0.9913 |
| 2011–2012 | 0.9880 | 1.0065 | 0.9671 | 0.9794 | 0.9954 |
| 2012–2013 | 1.0051 | 0.9850 | 1.0112 | 1.0101 | 0.9965 |
| 2013–2014 | 1.0074 | 0.9952 | 0.9910 | 1.0009 | 1.0056 |
Table 3.
The Decoupling between CO2 emissions and electricity output.
| Year | Decoupling State | |||||
|---|---|---|---|---|---|---|
| 1990–1991 | 0.2446 | 0.7017 | 0.1315 | −0.0113 | 1.0664 | strong decoupling |
| 1991–1992 | −2.6367 | 1.0721 | 0.6918 | −0.1312 | −1.0041 | no decoupling |
| 1992–1993 | −0.2377 | 0.0679 | −0.0709 | 0.1187 | −0.1219 | no decoupling |
| 1993–1994 | −0.1063 | −0.2055 | 0.3567 | 0.1501 | 0.1949 | relative decoupling |
| 1994–1995 | 0.6609 | −0.0969 | 0.2098 | −0.0361 | 0.7377 | relative decoupling |
| 1995–1996 | 0.1810 | −0.3068 | −0.3194 | 0.0536 | −0.3915 | no decoupling |
| 1996–1997 | −2.1343 | 0.6816 | 0.0736 | −0.0122 | −1.3914 | no decoupling |
| 1997–1998 | −0.2900 | 0.1406 | 0.0549 | −0.0582 | −0.1527 | no decoupling |
| 1998–1999 | 0.4380 | 0.1705 | 0.1503 | −0.0394 | 0.7194 | relative decoupling |
| 1999–2000 | −0.4576 | −0.1175 | 0.0739 | −0.1042 | −0.6054 | no decoupling |
| 2000–2001 | 0.5017 | −0.0558 | −0.0895 | −0.3322 | −1.0243 | no decoupling |
| 2001–2002 | 0.5345 | 0.0778 | 0.1451 | 0.0293 | 0.7868 | relative decoupling |
| 2002–2003 | −0.6743 | −0.1908 | −1.2858 | 1.0017 | −1.1493 | no decoupling |
| 2003–2004 | −0.0603 | 0.7811 | 0.0193 | −0.3358 | 0.4043 | relative decoupling |
| 2004–2005 | −0.4727 | 0.1757 | 0.0963 | −0.0901 | −0.2908 | no decoupling |
| 2005–2006 | 5.0965 | 1.6399 | 4.7038 | 0.8235 | 12.2637 | strong decoupling |
| 2006-2007 | −0.3907 | 0.0276 | 0.1784 | −0.0318 | −0.2165 | no decoupling |
| 2007–2008 | −0.8852 | 0.2892 | −0.1457 | −0.6550 | 0.3966 | relative decoupling |
| 2008–2009 | −0.6551 | −0.2289 | −0.1962 | −0.1765 | 0.2567 | relative decoupling |
| 2009–2010 | −0.2713 | 0.0663 | 0.0530 | −0.0114 | −0.1634 | no decoupling |
| 2010–2011 | −4.1883 | 0.3582 | −0.8807 | −1.3671 | 5.0779 | strong decoupling |
| 2011–2012 | 0.5392 | −2.7776 | −1.7287 | -0.3786 | 3.3457 | strong decoupling |
| 2012–2013 | 3.0044 | −2.2055 | −1.9993 | 0.6938 | −0.5066 | no decoupling |
| 2013–2014 | 0.6484 | 1.2156 | −0.1156 | −0.7488 | 0.9995 | relative decoupling |
© 2017 by the authors. Licensee MDPI, Basel, Switzerland. This article is an open access article distributed under the terms and conditions of the Creative Commons Attribution (CC BY) license (http://creativecommons.org/licenses/by/4.0/).
Share and Cite
MDPI and ACS Style
Jiang, X.-T.; Li, R. Decoupling and Decomposition Analysis of Carbon Emissions from Electric Output in the United States. Sustainability 2017, 9, 886. https://doi.org/10.3390/su9060886
AMA Style
Jiang X-T, Li R. Decoupling and Decomposition Analysis of Carbon Emissions from Electric Output in the United States. Sustainability. 2017; 9(6):886. https://doi.org/10.3390/su9060886
Chicago/Turabian StyleJiang, Xue-Ting, and Rongrong Li. 2017. "Decoupling and Decomposition Analysis of Carbon Emissions from Electric Output in the United States" Sustainability 9, no. 6: 886. https://doi.org/10.3390/su9060886
Note that from the first issue of 2016, this journal uses article numbers instead of page numbers. See further details here.