Article

Predicting Bio-indicators of Aquatic Ecosystems Using the Support Vector Machine Model in the Taizi River, China

1
College of Water Science, Beijing Normal University, Beijing 100875, China
2
State Key Laboratory of Environmental Criteria and Risk Assessment, Chinese Research Academy of Environmental Sciences, Beijing 100012, China
3
College of Resources Science and Technology, Beijing Normal University, Beijing 100875, China
*
Authors to whom correspondence should be addressed.
Sustainability 2017, 9(6), 892; https://doi.org/10.3390/su9060892
Submission received: 25 April 2017 / Revised: 15 May 2017 / Accepted: 20 May 2017 / Published: 24 May 2017

Abstract

:
Numerous studies have sought to clarify the link between biological communities and environmental factors in freshwater, but an appropriate model is still needed to predict the effect of water quality and hydromorphology improvement on biological communities and to provide useful information for ecological restoration planning. In this study, a support vector machine (SVM) was used to predict the bio-indicators of an aquatic ecosystem (i.e., macroinvertebrates, fish, algae communities) in the Taizi River, northeast China. Environmental factors, including physico-chemical (i.e., dissolved oxygen (DO), electricity conductivity (EC), ammonia nitrogen (NH3-N), chemical oxygen demand (COD), biological oxygen demand in five days (BOD5), total phosphorus (TP), total nitrogen (TN)) and hydromorphology parameters (i.e., water quantity, channel change, morphology diversity) were used as the input variables to train and validate the SVM model. The sensitivity of the input variables for the prediction was examined by removing a variable from the SVM model. Results revealed that the SVM model reproduced the variation in bio-indicators of fish and algae communities well, based on the input variables. The sensitivity for the input variables applied in SVM showed that in the Taizi River the most sensitive variables for predicting macroinvertebrate and algae communities were channel change, DO, TN, and TP, while the most sensitive variables for predicting fish communities were DO and BOD5. This study proposed an effective method for predicting biological communities, which will improve freshwater quality and hydromorphology management schemes. The outputs can guide the decision-making process in river basin management, support the prioritization of actions and resource allocation, and help to monitor and evaluate the effectiveness of interventions.

1. Introduction

Biological communities in freshwater ecosystems provide goods and services of critical importance to human societies [1,2]. Their measurement provides the predominant indicators reflecting the ecological state of a waterbody and can promote effective improvements in river conservation. River pollution and hydromorphology destruction, resulting from human activities such as dam construction, are increasing problems that affect biological diversity and community structure of aquatic ecosystems [3]. In recent decades, there has been great interest in directly studying the effects of pollution and hydromorphology destruction on biological community structure indicators. Clarifying the relationship between biological community and environmental factors can help decision-makers to develop appropriate water pollution control and ecological restoration measures, with protecting the integrity of freshwater biology as the final restoration goal. The bio-indicators of aquatic ecosystems have been proven to be effective in reflecting long-term disturbance in rivers. The response of biological communities to different types of anthropogenic stress varies significantly. For example, the bio-indicators of an algae community are widely used in the monitoring of eutrophication, because low concentrations of nitrogen and phosphorus will increase algae growth and, to some extent, its biodiversity, but will have little effect on fish and macroinvertebrate communities [4]; while the bio-indicators of a fish community are more widely used in monitoring impacts of dam construction [5]. Nevertheless, the bio-indicators of a macroinvertebrate community are frequently used in monitoring organic pollution [6] or heavy metal pollution [7]. Therefore, by clarifying the response of the bio-indicators of aquatic communities to an environmental stress, the main factors causing the ecological destruction of aquatic ecosystems can be identified, making river ecological restoration measures more specific. To establish a river management strategy that aims to improve the ecological status of rivers rather than simply reducing pollutant emissions, scientists in China are seeking to understand the changes in aquatic organisms caused by pollutant emission reduction and ecological rehabilitation. However, studies and national environmental protection action in China in the last few years have remained focused on the individual evaluation of physico-chemical parameters when considering water quality [8,9,10], such as indicators of COD and NH3-N. These may not be able to completely reflect the ecological status of rivers and so lead to effective improvement in river management measures.
The relationship between diverse environmental factors and bio-indicators is complex, which increases the difficulty in predicting the community structure of freshwater biology [11]. Models that have been used can be categorized according to their deterministic and stochastic approaches [12]. Process-based mathematical models have been widely used to predict the general ecological response of biological community structure to environmental factors. However, the physical dynamics of community structure are not well understood as there are some uncertainties, such as inadequate observations and the complex interactions of the biological communities [12,13,14]. This limits the development of an appropriate formulation for simulating community structure of freshwater biology and demands an alternative modeling approach, such as the promotion of a data-driven methodology [11].
Support vector machines has provided a rigorous method for uncertainty analysis and presented key information for management decision-making [15,16]. They have the ability to extract temporal or spatial patterns and to describe highly nonlinear and complex data. In the past few years, there has been a lot of interest in support vector machines because they have yielded excellent generalization performance on a wide range of problems [17,18]. SVMs produce very competitive results when compared with the best accessible classification methods and they need only the smallest amount of model tuning because there are only a few parameter settings that need to be adjusted. A SVM maintains steady performance regardless of input dimensionality and correctly determines the global optimum during the regression process [19,20]. However, there is still not much experience with or application of SVM in ecological study. Therefore, we used a SVM for regression to develop a predictive model of freshwater biology community structure.
A complete analysis of SVM entails three steps: model selection, fitting, and validation. Beginning with inclusion of a previously selected set of input variables, data normalization was carried out to reduce the complexity of the model and decrease its computational requirements. A radial basis function (RBF) kernel, which is widely used in nonlinear fitting, was implemented to build the SVM models. The performance of SVM based model was finally evaluated by 10-fold cross-validation. The Taizi River, which flows through mountains in northeast China, is under pressure because of environmental pollution and ecological damage, as is the case with rivers elsewhere in China. The local government is working to restore its water quality, but without significant success. Knowledge of the community structure would benefit more effective restoration and management of the river basin ecosystem.

2. Materials and Methods
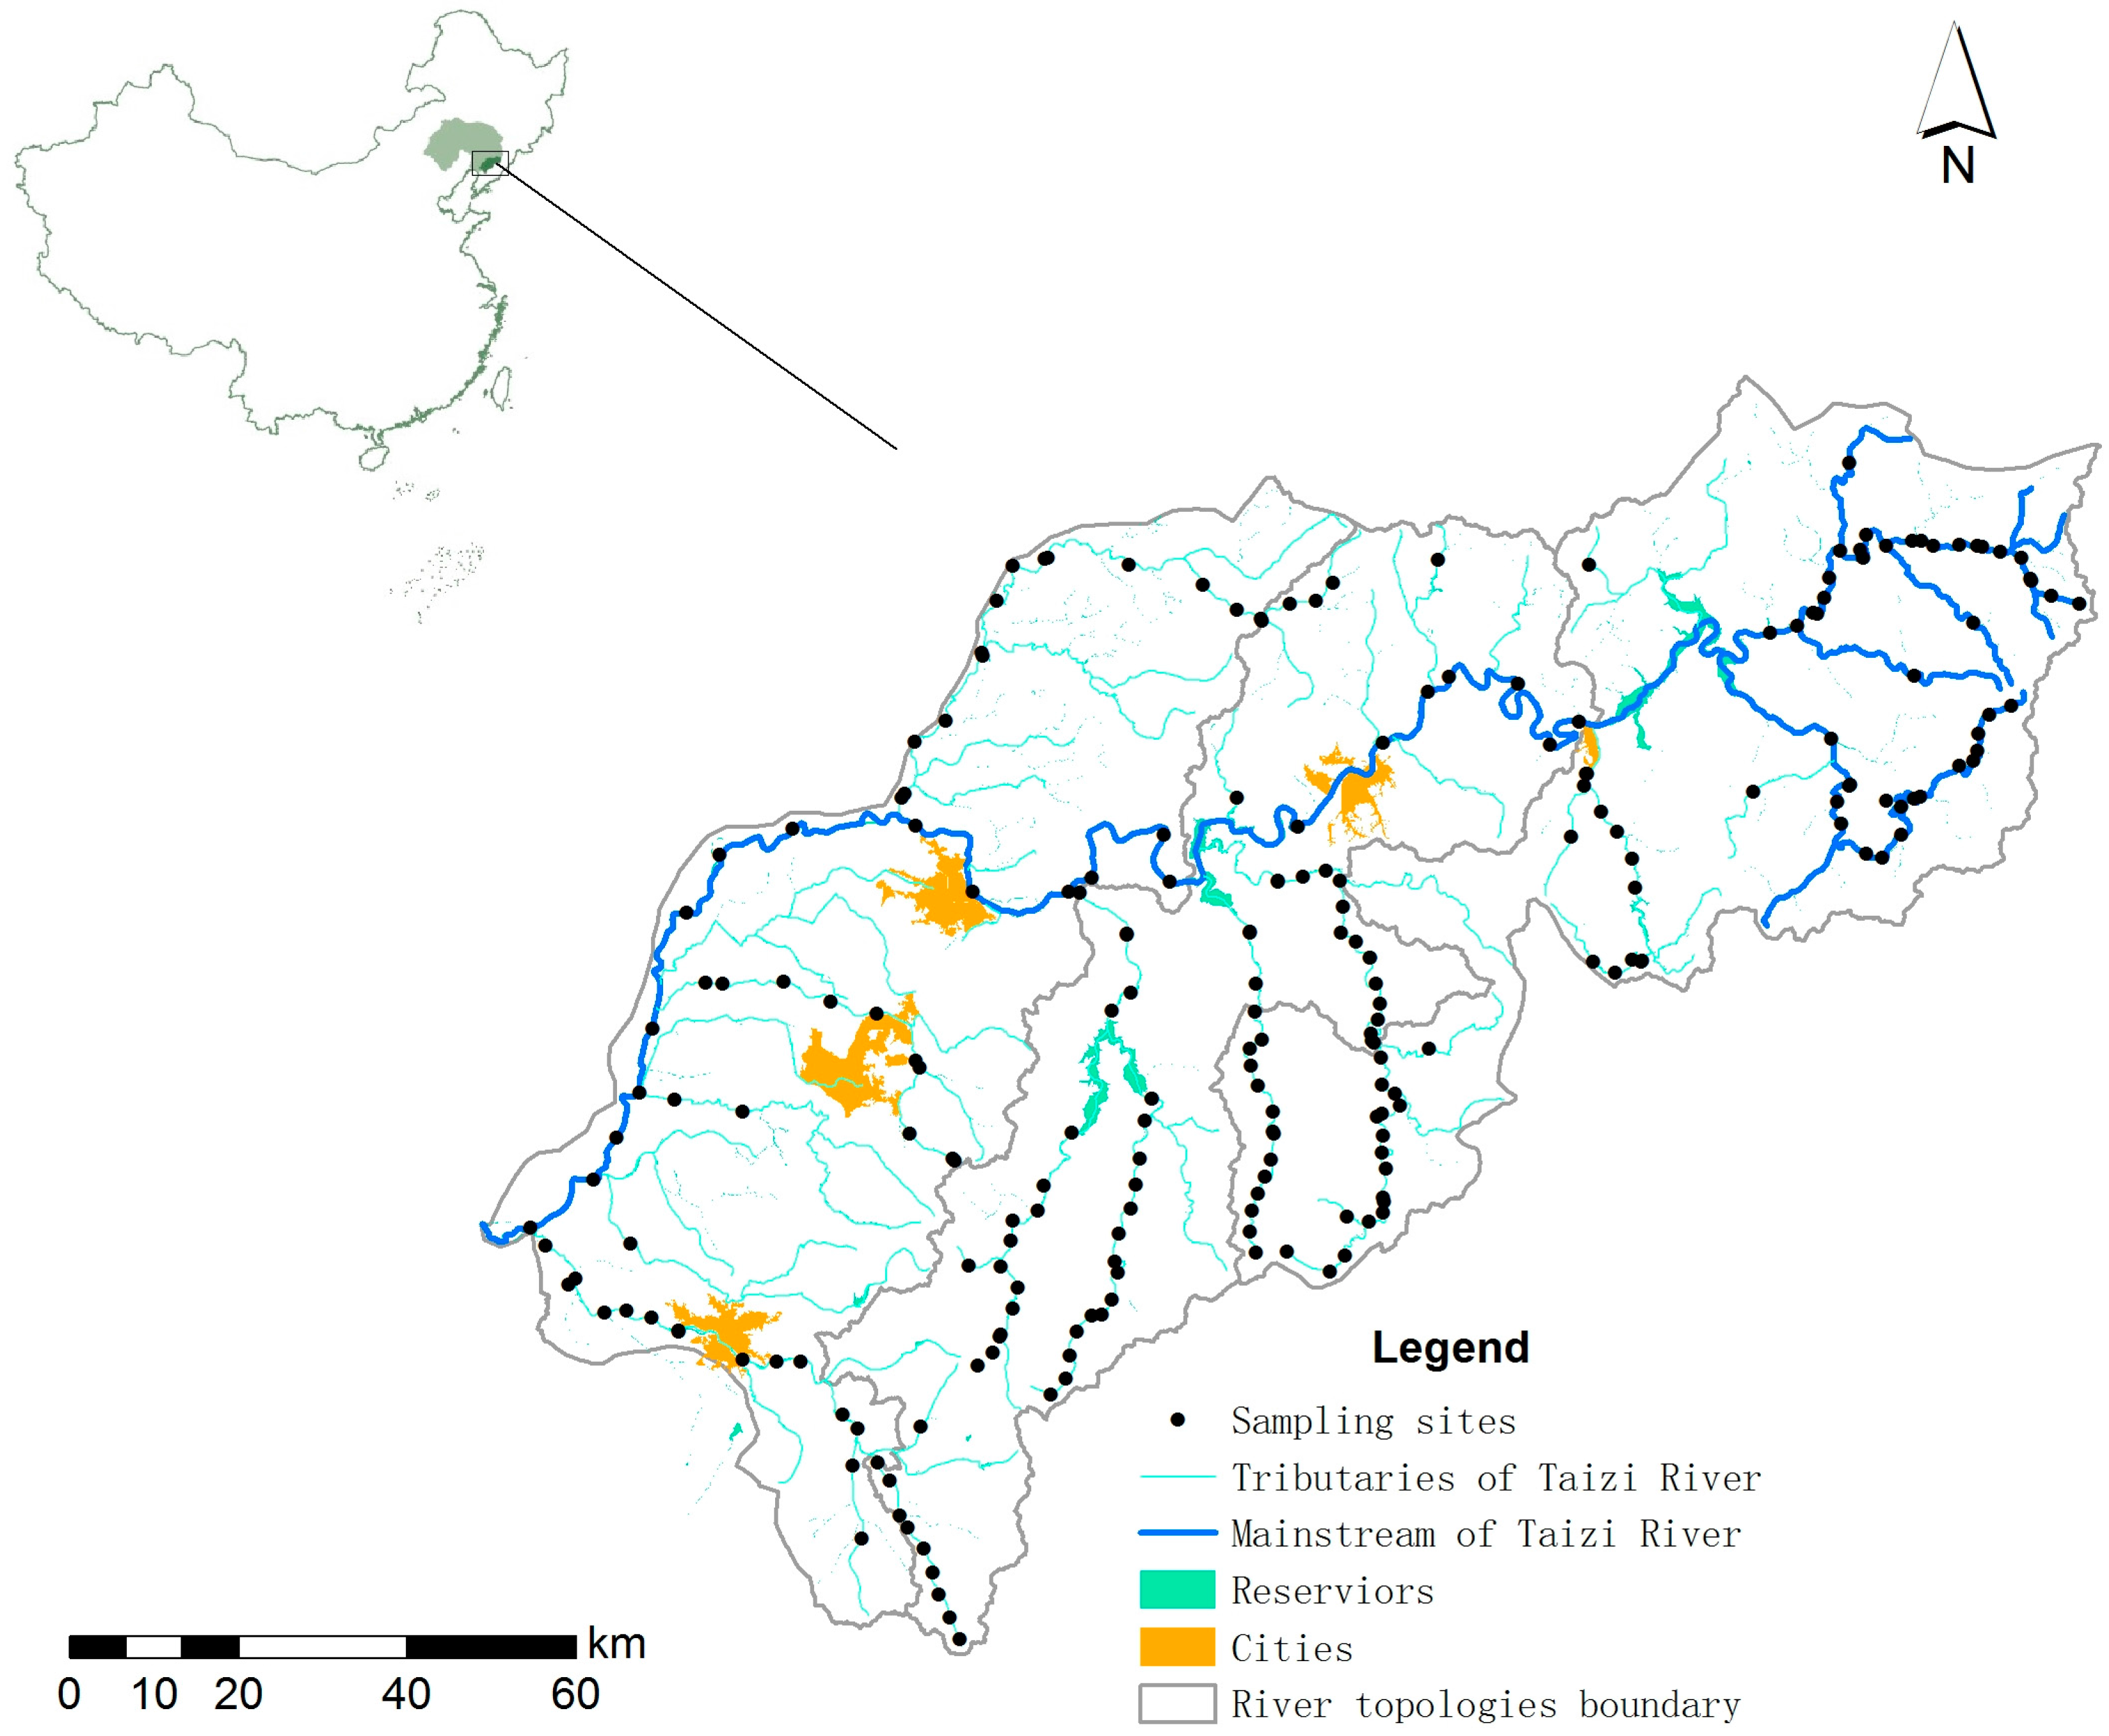
2.1. Study Area

The Taizi River is located in northeast China (40°30′–41°40′ N, 122°20′–124°55′ E) and is one of the main tributaries of the Liaohe River Basin. The Taizi River, with a length of about 400 km, has nine tributaries, and a catchment area of about 1.39 × 10⁴ km2 (Figure 1) [21]. The area is characterized by a warm, temperate continental climate [22]. The Taizi River Basin has experienced industrial development within Liaoning province since the 1950s. The basin is now an important area for industry (including metallurgical, petrochemical, and equipment manufacturing) and agriculture (dryland and paddy farming). Water from the Taizi River is mainly used for the domestic, industrial, and agricultural needs of the three biggest cities (Benxi, Liaoyang, and Anshan) and the surrounding areas. Currently, land use is dominated by agriculture and forestry [22]. The major threats to ecosystem quality in the Taizi River Basin have been identified as urban and industrial point source pollution, as well as diffuse pollution related to agriculture and other activities (road construction, waste disposal, etc.) [21]. There are nine reservoirs and several river weir gates on the Taizi River, and these have significantly altered its natural flow regime and interfered with solid transport and fish migration. The ecological quality of the Taizi River has also been extensively influenced by the clearing of riparian vegetation and the channeling of rivers and streams related to land use changes, as well as to the extraction of riverbed materials [21,22].

2.2. The Available Dataset

The dataset for the application of the SVM model was obtained from the results of the National Key Science and Technology Special Program of China on Water Pollution Control and Treatment in the Taizi River Basin. This program included 163 sampling sites monitored in 2009, and 60 sites monitored in 2010, along the main channel and tributaries of the Taizi River Basin (Figure 1).
The available dataset included data on biological communities (i.e., fish, algae, and macroinvertebrates), physico-chemical parameters (i.e., DO, EC, NH3-N, COD, BOD5, pH, TP, TN), and hydromorphological parameters (i.e., water quantity, channel change, morphology diversity). These indicators were selected for ecological status classification of the Taizi River Basin [23]. The results of previous studies showed that there was a negative trend in the ecological status from the highlands to the lowlands of the Taizi River Basin, and that the biological communities were significantly impaired, with varying degrees of damage to each species caused by environmental pressure. The macroinvertebrate fauna was most badly damaged, while the fish community was less impaired. The algae community received the best evaluation compared to other communities. Organic pollution (i.e., COD, BOD5) from agriculture and domestic sources; an unstable hydrological regime (i.e., water quantity shortage); and chemical pollutants (i.e., PAHs and metals) from industry were found to be the main stressors impacting the ecological status of the Taizi River Basin.
The available dataset included data on biological communities (i.e., fish, algae, and macroinvertebrates), physico-chemical parameters (i.e., dissolvedoxygen (DO), electricity conductivity (EC), ammonia nitrogen (NH3-N), chemical oxygen demand (COD), biological oxygen demand in fivedays (BOD5), total phosphorus (TP), total nitrogen (TN)), and hydromorphological parameters (i.e., water quantity, channel change, morphology diversity). These indicators and their indications were showed in Table 1, and abbreviated as species richness (F_S), index of biotic integrity (F_IBI), Berger–Parker index (F_BP), familiesrichness (M_S), biological monitoring working party score (M_BMWP), ephemeroptera, plecoptera, and trichopterafamily richness (M_EPT), species richness (A_S), Berger–Parker index (A_BP).

2.3. Theoretical Background of Applied Models

The SVM is a kernel-based learning algorithm that is widely used for pattern classification and regression [28,29]. When used for regression, the SVM finds a function that estimates the network output (si) that represents the deviation from the real values for all training data. Initially, the input data Xi were mapped into a higher-dimensional feature via a linear mapping function φ (Xi); linear regression is then implemented in this space. The SVM subsequently approximates the function (Equation (1))
s ( X i ) = i = 1 T w i φ ( X i ) + b
where wi and b were the coefficients determined through minimizing the regularized risk function based on the network outputs and real values. In this process, a kernel function approach is applied to carry out the nonlinear mapping. The kernel function κ (Xi, X) is computed using the inner product between the nonlinear mapping data ( φ (Xi), φ (X)) [16,30]. In this study, a radial basis function (RBF) is used as the kernel function in the SVM model (Equation (2))
κ ( X i , X ) = exp ( γ X i X 2 )
In this study, data normalization was used to adjust values measured on different scales to a notionally common scale. Because the units and scales of the parameters were different, this ensured that all parameters had the same scale for a fair comparison. Unity-based normalization was used to bring all parameter values into the range [0, 1], using Equation (3)
X ¨ i = X i X min X max X min
where i is the normalized value; Xi is the original value; Xmin is the minimum value; and Xmax is the maximum value.

2.4. Performance

The performances of the SVM for regression in this study depended on parameters: C, sigma (σ), and epsilon (ε). The hyper-parameter C is a regularized constant used to determine the trade-off between the complexity of the decision rule and the frequency of error [31]. σ is a parameter of the kernel, which controls the amplitude of the RBF, and therefore controls the generalization ability of the SVM. For the SVM with the RBF kernel, C, and σ were the two basic parameters involved in optimization. In the SVM for regression, ε determines the complexity by adjusting the number of support vectors as a prescribed parameter to determine training error. In each subset, 90% of samples were used for training and the 10% of samples for validation. The value of the different statistical descriptors mentioned above was calculated as the arithmetic mean of the 10 validation subsets. It should be noted that overfitting is one of the main issues in the development of SVM based models. Overfitting occurs when a model achieves an outstanding performance on the training data but it is unable to generalize. However, the cross-validation method has been found as an outstanding technique for avoiding overfitting [32], and thus for achieving good generalization capability. Genetic algorithm was applied to determine optimal parameters for the SVM model based on the lower values of the root-mean-square error (MSE) in the validation subset. The MSE was determined by Equation (4)
M S E = 1 N i = 1 N ( y ^ i y i ) 2
where yi is the observed value; ŷi is the predicted value; and N is the number of units in the summation. The cross-validation method is an outstanding technique for avoiding over fitting [33,34], with a good generalization capability.
Currently, most approaches to determine model parameters are based on prior knowledge, users’ expertise, or experimental trial, such that there is no guarantee that the selected parameters are optimal [19]. However, no general guideline is available to select these parameters. In this study, three parameter optimizations (C, σ, and ε) were considered by genetic algorithm (GA). GA are stochastic search techniques that can search large and complicated spaces using ideas from nature genetics the evolution principle. Here, the values of the SVM parameters C, ε, and σ are directly coded in the chromosome with real-value data; we dynamically optimize the values of the SVM parameters through the GA evolutionary process, and use the acquired parameters to construct an optimized SVM model in order to proceed with the prediction. Details of GA procedure can be referenced by Liu et al. [15]. A search range of [0.1, 100] was used for both C and σ, while [0,1] was taken as the range for ε.
The squared correlation coefficient (R2) was chosen to describe the overall model performance. This indicator represented the proportion of the observed variance explained by the model. MSE was selected to characterize the overall model error.

2.5. Sensitivity Analysis

In this study, a sensitivity analysis was applied to investigate sensitive input variables that influence the prediction of bio-indicators. The one-factor-at-a-time (OAT) method was used as the assessment tool for checking sensitivity of model variables. The SVM models were running by removing a variable at a time with other parameters constant, resulting in new output. The variation in overall model performance (squared correlation coefficient, R2) for a given variable was subsequently calculated to obtain the effects of the variable on the model performance; this process was repeated for every variable.

3. Results

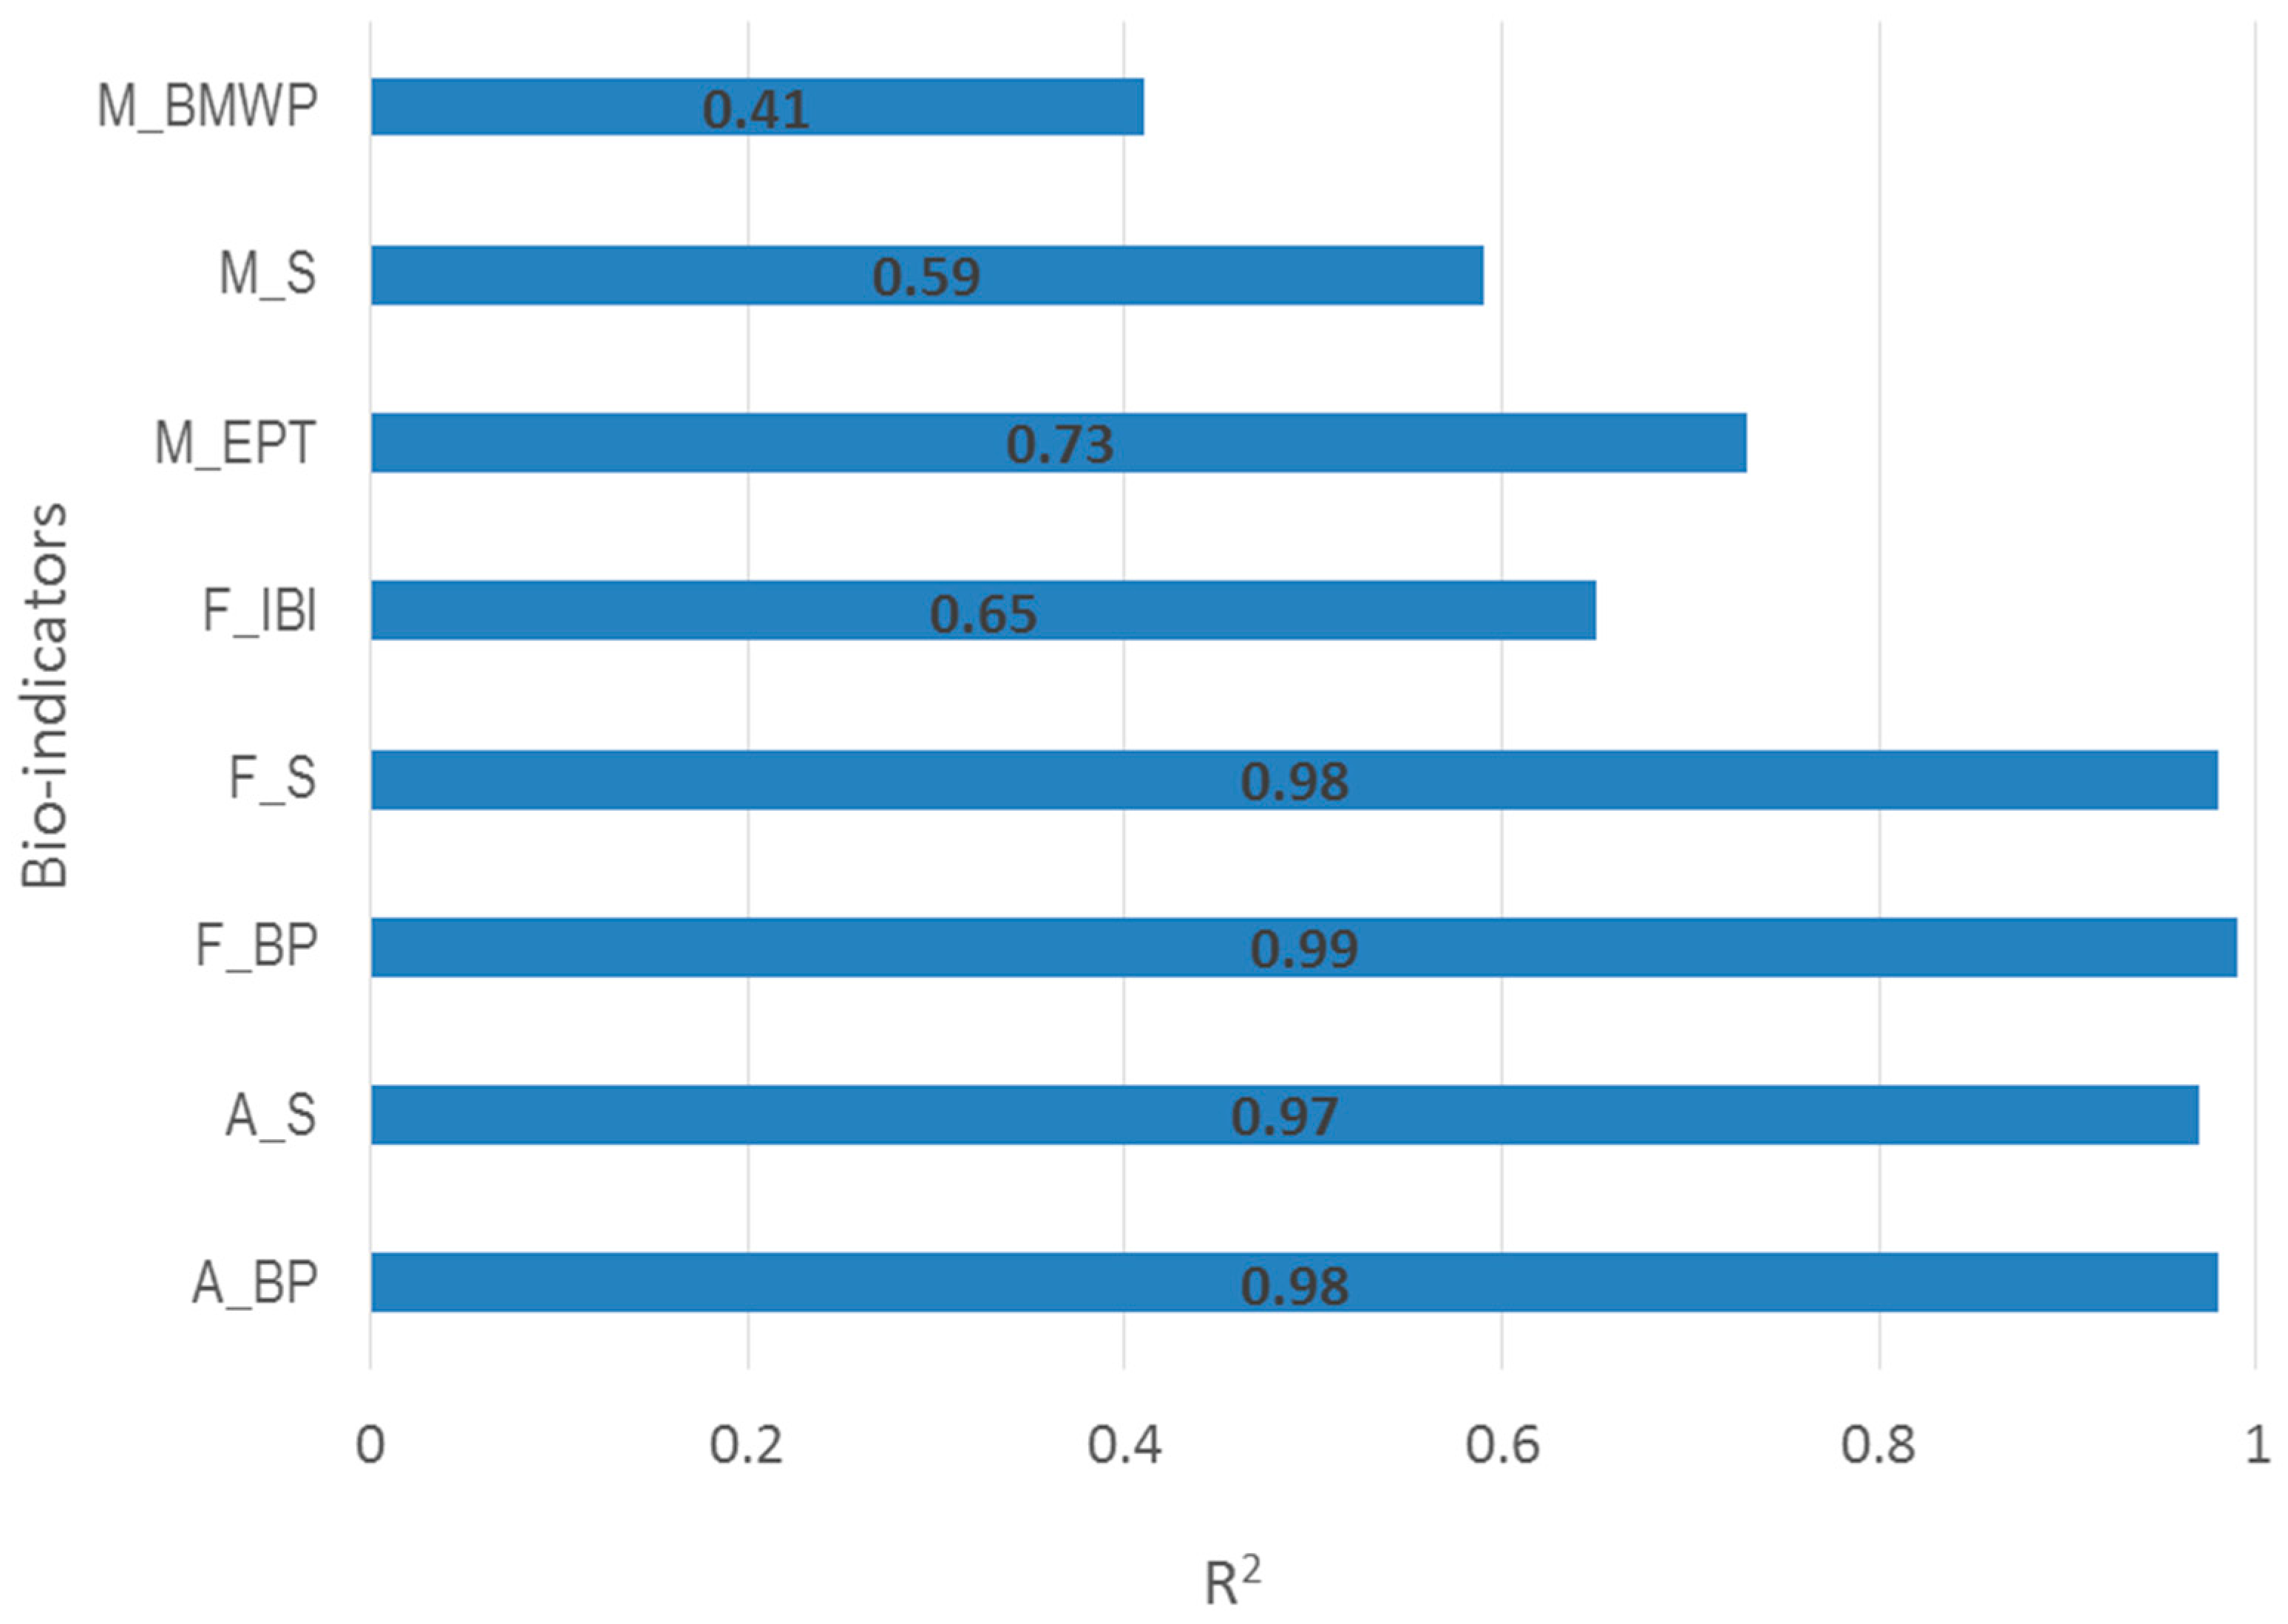
3.1. Determination of Optimal Model

In parameter optimization, MSE was calculated as the arithmetic mean of 10 validation subsets for each different regression model. Results for the three optimized parameters are shown in Table 2; the values of R2 for each different regression model are shown in Figure 2. The values of C varied from 0.48 (M_S) to 87.72 (F_S); values of σ varied from 0.08 (M_BMWP) to 99.88 (A_S). The optimal values of ε obtained from the genetic algorithm were from 0.001 (F_BP) to 0.33 (M_BMWP).
Figure 2 shows that the GA-based models gave different values for the squared correlation coefficient (R2); all these models achieved high values of explained variance (R2 > 0.6) except for M_BMWP and M_S, which had values of 0.41 and 0.59, respectively. Compared with models A_BP, A_S, F_BP, and F_S, models F_IBI, M_BMWP, M_EPT, and M_S resulted in worse regressing fitting. The performance of these models, in decreasing order, was F_BP>F_S=A_BP>A_S>M_EPT>F_IBI>M_S>M_BMWP, using R2 as an evaluator (Figure 2).

3.2. Sensitivity Analysis

Table 3 shows the R2 for every input variable applied in the SVM model. R2 was used to indicate the model performance. The R2 value was greater, indicating a better model fit. OAT analysis checked the model fitting changes by removing a variable and, if the value of R2 became smaller (indicating a greater impact of this variable on the model fit, which meant a smaller R2 value), the more sensitive was the variable. For the algae community, the smallest values of R2 for A_BP and A_S were 0.94 (TP) and 0.91 (CC), respectively. For the fish community, the values of R2 for F_BP, F_IBI, and F_S were 0.93 (BOD5), 0.62 (CC), and 0.93 (BOD5), respectively. For the macroinvertebrate community, the values of R2 for M_BMWP, M_EPT, and M_S were 0.35 (BOD5), 0.65 (CC), and 0.54 (TP), respectively.

4. Discussion

The result of SVM model showed that the bio-indicators of the fish community (i.e., F_BP, F_S) and algae community (i.e., A_BP, A_S) are better fitted with the environmental variables, compared with the indicators of the macroinvertebrate fauna (i.e., M_BMWP, M_S). This indicates that, in the Taizi River, the SVM model can be a reliable prediction tool for fish and algae communities using the selected environmental factors, while the ability of the model to predict the macroinvertebrate community was poor. The result of ecological status classification of the Taizi River reveals that the macroinvertebrate fauna was significantly impaired, while the fish community and algae community were less damaged [23]. This indicates that species with considerable or moderate tolerance occurred among the macroinvertebrate fauna, so their sensitivity to environmental stress was not very great.
Agricultural activities, which are major types of human disturbance in the Taizi River, are known to contribute significant pollution to waterways in the form of nutrients, which are likely to affect the algae community. Previous studies showed that the quality of the physical habitat (i.e., water quantity, substrate), as well as the chemical pollutants (i.e., COD, EC, TN) structured the fish communities at the local scale, and played a crucial role in the reproduction and predation of fish communities [35,36]. This study considered both the physical habitat and chemical pollutants as environmental pressures in the SVM model, as apparently they can both impact the structure of the fish community. Nevertheless, some uncertainties are not considered in the model, for example, the very complicated connection between the different aquatic communities (i.e., the food webs among fish, macroinvertebrates, and algae)—which can also influence the model result in this study—should not be ignored.
The sensitivity for the input variables applied in the SVM showed that the most sensitive variables for predicting macroinvertebrate and algae communities were CC, DO, TN, and TP, while DO and BOD5 were the most sensitive variables for predicting fish communities relative to macroinvertebrate and algae communities. Studies have shown that nutrients play an important role in the photosynthetic production of a lake, as a limiting factor for the algae community [8]. With respect to the macroinvertebrate community, the hydromorphology dynamics of the river also played a key role in the small-scale distribution of the benthic community. For example, a higher velocity of river flow is usually associated with a richer and more abundant macroinvertebrate assemblage. This could be attributable to the river flow velocity, which plays a key role in water oxygenation and functional feeding of some macroinvertebrate groups, such as filter feeders. A study of the diversity and abundance of macroinvertebrates in a stream in Brazil reported that the sampling station with the highest DO level also had the highest Shannon diversity index [37]. DO could be also a key factor impacting the structure of a fish community, a slow levels of DO will influence the tolerance limit of fish [38]. Previous studies have shown that many marine fish became stressed at a DO level of 4.5 mg·L−1 [39]. In the Taizi River, DO and other physico-chemistry indicators (such as TN and pH) had a significant effect on fish spatial distribution at the reach scale [40].
The results of sensitivity analysis can provide a reference for ecological restoration with the aim of aquatic organism protection in the Taizi River. The restoration of river continuity, especially reach sinuosity and nutrient control at the reach scale, should take priority when improving the quality of algae and macroinvertebrate communities. However, control of organic pollution should be given priority when fish community restoration is taken into account. When developing an ecological restoration plan for the Taizi River, the importance of DO improvement to benefit all biological communities should not be overlooked.

5. Conclusions

The main purpose of this study was to provide a rational model for prediction of freshwater biology community structure. Here, a SVM model was applied to predict the biology community structure using biological communities and physico-chemical parameters. They were then compared in terms of prediction accuracy and sensitivity, depending on changes in the model input variables. The SVM based model was successfully set up, with optimal model parameters determined using GA, showing a reasonable prediction accuracy during both the training and validation process. The results of this study suggest that SVM scan reveal the key variables to predict biology community structure and may be a promising tool for water ecosystem management.

Acknowledgments

The research was funded by the National Key Science and Technology Special Program of China—“Water Pollution Control and Treatment” (2015ZX07202012) and the China Postdoctoral Science Foundation (No. 2016M591106).

Author Contributions

All co-authors assisted with manuscript writing. J.F., Y.Z. and W.M. conceived and designed the experiments; J.F. and J.W. performed the experiments, analyzed the data, and wrote this paper; W.K., Y.Z., M.L. and M.Z. contributed analysis tools and provide fund support, and modified the paper according to expert opinion.

Conflicts of Interest

The authors declare no conflict of interest.

References

  1. Postel, S.; Carpenter, S. Freshwater ecosystem services. In Nature’s Services: Societal Dependence on Natural Ecosystems; Daily, G.C., Ed.; Island Press: Washington, DC, USA, 1997. [Google Scholar]
  2. Writing, C.; Walter, T.; Mooney, H.; Cropper, A. Millennium Ecosystem Assessment Synthesis Report; Island Press: Washington, DC, USA, 2005. [Google Scholar]
  3. Giorgio, A.; Bonis, S.D.; Guida, M. Macroinvertebrate and diatom communities as indicators for the biological assessment of river Picentino (Campania, Italy). Ecol. Indic. 2016, 64, 85–91. [Google Scholar] [CrossRef]
  4. Stevenson, R.J.; Pan, T.D. Assessing environmental conditions in rivers and streams with diatoms. In The Diatoms: Applications for the Environmental and Earth Sciences; Stoermer, E.F., Smol, J.P., Eds.; Cambridge University Press: Cambridge, UK, 2004. [Google Scholar]
  5. Arthington, A.H.; Bunn, S.E.; Poff, L.R.; Naiman, R.J. The challenge of providing environmental flow rules to sustain river ecosystems. Ecol. Appl. 2006, 16, 1311–1318. [Google Scholar] [CrossRef]
  6. Álvarez-Cabria, M.; Barquín, J. Macroinvertebrate community dynamics in a temperate European Atlantic river. Do they conform to general ecological theory? Hydrobiologia 2011, 658, 277–291. [Google Scholar] [CrossRef]
  7. Qu, X.D.; Wu, N.C.; Tang, T. Effects of heavy metals on benthic macroinvertebrate communities in high mountain streams. Int. J. Lim. 2010, 46, 291–302. [Google Scholar] [CrossRef]
  8. Zhang, Y.; Guo, F.; Meng, W.; Wang, X.Q. Water quality assessment and source identification of Daliao river basin using multivariate statistical methods. Environ. Monit. Assess. 2009, 152, 105–121. [Google Scholar] [CrossRef] [PubMed]
  9. Wan, J.; Bu, H.M.; Zhang, Y.; Meng, W. Classification of rivers based on water quality assessment using factor analysis in Taizi River basin, northeast China. Environ. Earth. Sci. 2013, 69, 909–919. [Google Scholar] [CrossRef]
  10. MEP (Ministry of Environmental Protection of the People’s Republic of China). National 12th Fiver-Year Environment Protection Plan 2012. Available online: http://zfs.mep.gov.cn/fg/gwyw/201112/t20111221_221570.htm (accessed on 24 May 2017). (In Chinese)
  11. Lee, J.H.W.; Huang, Y.; Dickman, M.; Jayawardena, A.W. Neural network modeling of coastal algal blooms. Ecol. Model. 2003, 159, 179–201. [Google Scholar] [CrossRef]
  12. Park, Y.; Cho, K.H.; Park, J.; Cha, S.M.; Kim, J.H. Development of early-warning protocol for predicting chlorophyll-a concentration using machine learning models in freshwater and estuarine reservoirs, Korea. Sci. Total Environ. 2015, 502, 31–41. [Google Scholar] [CrossRef] [PubMed]
  13. Lee, H.S.; Lee, J.H.W. Continuous monitoring of short term dissolved oxygen and algal dynamics. Water Res. 1995, 29, 2789–2796. [Google Scholar] [CrossRef]
  14. Yabunaka, K.; Hosomi, M.; Murakami, A. Novel application of a back-propagation artificial neural network model formulated to predict algal bloom. Water. Sci. Technol. 1997, 36, 89–97. [Google Scholar] [CrossRef]
  15. Liu, S.Y.; Tai, H.J.; Ding, Q.S.; Li, D.L.; Xu, L.Q.; Wei, Y.G. A hybrid approach of support vector regression with genetic algorithm optimization for aquaculture water quality prediction. Math. Comput. Model. 2013, 3–4, 458–465. [Google Scholar] [CrossRef]
  16. Singh, K.P.; Basant, N.; Gupta, S. Support vector machines in water quality management. Anal. Chim. Acta 2011, 703, 152–162. [Google Scholar] [CrossRef] [PubMed]
  17. Granata, F.; Papirio, S.; Giovanni, E.; Gargano, R.; Marinis, G.D. Machine Learning Algorithms for the Forecasting of Wastewater Quality Indicators. Water 2017, 9, 105. [Google Scholar] [CrossRef]
  18. Granata, F.; Gargano, R.; Marinis, G.D. Support Vector Regression for Rainfall-Runoff Modeling in Urban Drainage: A Comparison with the EPA’s Storm Water Management Model. Water 2016, 8, 69. [Google Scholar] [CrossRef]
  19. Hoang, T.H.; Lock, K.; Mouton, A.; Goethals, P.L.M. Application of classification trees and support vector machines to model the presence of macroinvertebrates in rivers in Vietnam. Ecol. Inf. 2010, 5, 140–146. [Google Scholar] [CrossRef]
  20. Michaela, B.; Han, D. Identification of support vector machines for runoff modelling. J. Hydroinform. 2004, 6, 265–280. [Google Scholar]
  21. Leigh, C.; Qu, X.; Zhang, Y.; Kong, W.J.; Meng, W.; Hanington, P.; Speed, R.; Gippel, C.; Bond, N.; et al. Assessment of River Health in the Liao River Basin (Taizi. Subcatchment.); International Water Centre: Brisbane, Australia, 2012. [Google Scholar]
  22. CRAES (Chinese Research Academy of Environmental Sciences). Taizi. Basin Background Report; Report to ACEDP Project; International Water Centre: Brisbane, Australia, 2010. [Google Scholar]
  23. Fan, J.; Semenzin, E.; Meng, W.; Giubilato, E.; Zhang, Y.; Critto, A.; Zabeo, A.; Zhou, Y.; Ding, S.; Wan, J.; et al. Ecological status classification of the Taizi River Basin, China: A comparison of integrated risk assessment approaches. Environ. Sci. Pollut. Res. 2015, 22, 14738–14754. [Google Scholar] [CrossRef] [PubMed]
  24. Moyle, P.B.; Cech, J.J. Fishes: An Introduction to Ichthyology, 2nd ed.; Prentice Hall: Englewood Cliffs, NJ, USA, 1988. [Google Scholar]
  25. Flores, M.J.L.; Zafaralla, M.T. Macroinvertebrate Composition, Diversityand Richness in Relation to the Water Quality Status of Mananga River, Cebu, Philippines. Philipp. Sci. Lett. 2012, 5, 103–113. [Google Scholar]
  26. Armitage, P.D.; Moss, D.; Wright, J.F.; Furse, M.T. The performance of a new biological water quality score system based on macroinvertebrates over a wide range of unpolluted running-water sites. Water Res. 1983, 17, 333–347. [Google Scholar] [CrossRef]
  27. Mandaville, S.M. Benthic Macroinvertebrates in Freshwaters-Taxa Tolerance Values, Metrics, and Protocols; Soil & Water Conservation Society of Metro Halifax (Project H-1): New York, NY, USA, 2002. [Google Scholar]
  28. Cortes, C.; Vapnik, V. Support-vector networks. Mach. Learn. 1995, 20, 273–297. [Google Scholar] [CrossRef]
  29. Vapnik, V.N. Statistical Learning Theory; Wiley: New York, NY, USA, 1998. [Google Scholar]
  30. Varley, A.; Tyler, A.; Smith, L.; Dale, P.; Davies, M. Remediating radium contaminated legacy sites: Advances made through machine learning in routine monitoring of “hot” particles. Sci. Total Environ. 2015, 521, 270–279. [Google Scholar] [CrossRef] [PubMed]
  31. Wang, W.; Xu, Z.; Lu, W.; Zhang, X.Y. Determination of the spread parameter in the Gaussian kernel for classification and regression. Neurocomputing 2003, 55, 643–663. [Google Scholar] [CrossRef]
  32. Cherkassky, V.; Ma, Y. Practical selection of SVM parameters and noise estimation for SVM regression. Neural Netw. 2004, 17, 113–126. [Google Scholar] [CrossRef]
  33. Verrelst, J.; Muñoz, J.; Alonso, L.; Delegido, J.; Rivera, J.P.; Camps-Valls, G.; Moreno, J. Machine learning regression algorithms for biophysical parameter retrieval: opportunities for sentinel-2 and -3. Remote Sens. Environ. 2012, 118, 127–139. [Google Scholar] [CrossRef]
  34. Bäck, T. Evolutionary Algorithms in Theory and Practice: Evolution Strategies, Evolutionary Programming, Genetic Algorithms; Oxford University Press: Oxford, UK, 1996. [Google Scholar]
  35. Fischer, P. An experimental test of metabolic and behavioural responses of benthic fish species to different types of substrate. Can. J. Fish. Aquat. Sci. 2000, 57, 2336–2344. [Google Scholar] [CrossRef]
  36. Gao, X.; Zhang, Y.; Ding, S.; Zhao, R.; Meng, W. Response of fish communities to environmental changes in an agriculturally dominated watershed (Liao River Basin) in northeastern China. Ecol. Eng. 2015, 76, 130–141. [Google Scholar] [CrossRef]
  37. Silva, F.L.; Moreira, D.C.; Ruiz, S.S.; Bochini, G.L. Diversity and abundance of aquatic macroinvertebrates in a lotic environment in Midwestern São Paulo State, Brazil. Ambient. AguaInterdiscip. J. Appl. Sci. 2009, 4, 37–44. [Google Scholar] [CrossRef]
  38. Marshall, S.; Elliott, M. Environmental influences on the fish assemblage of the Humber estuary, UK. Estuar. Coast. Shelf Sci. 1998, 46, 175–184. [Google Scholar] [CrossRef]
  39. Poxton, M.G.; Allouse, S.B. Water quality criteria for marine fisheries. Aguacult. Eng. 1982, 1, 153–191. [Google Scholar] [CrossRef]
  40. Li, Y.L.; Li, Y.F.; Xu, Z.X. Effect of Environmental Factors on Fish Community Structure in the Huntai river Basin at Multiple Scales. Environ. Sci. 2014, 35, 3504–3512. (In Chinese) [Google Scholar]
Figure 1. Map of the Taizi River Basin and location of sampling sites.
Sustainability 09 00892 g001
Figure 2. Squared correlation coefficient (R2) values for SVM model performance.
Sustainability 09 00892 g002
Table 1. Indicators of freshwater biology community structure (a) and environmental indicators (b) applied to the Taizi River Basin.
(a)
Community Structure of Freshwater Biology
Biological CommunitiesIndicators of Community StructureIndication
FishSpecies richness (F_S)These indicators are related to physical, chemical, biological and zoogeographic factors and long-term pressures [21,24]
Index of biotic integrity (F_IBI)
Berger–Parker index (F_BP)
MacroinvertebrateFamilies richness (M_S)A measure of diversity of macroinvertebrate families, which reflects the general deterioration of water quality [25]
Biological monitoring working party score (M_BMWP)A procedure based on macroinvertebrate communities assessment for measuring water quality related to organic pollution [26]
Ephemeroptera, Plecopter,a and Trichopterafamily richness (M_EPT)Displaying the taxa richness within the insect groups, which are considered to be sensitive to pollution [27]
AlgaeSpecies richness (A_S)Both reflecting the water quality deterioration related to eutrophication and organic pollution [21]
Berger–Parker index (A_BP)
(b)
Environmental indicatorsImpact typologies
Physico-Chemistry
Electricity conductivity (EC)Salinization
Dissolvedoxygen (DO)Organic pollution
Biological oxygen demand in fivedays (BOD5)Organic pollution
Chemical oxygen demand (COD)Organic pollution
Ammonia nitrogen (NH3-N)Eutrophication
Total phosphorus (TP)Eutrophication
Hydromorphology
Water quantity (WQ)Alteration of hydrological regime
Channel change (CC)Alteration of river continuity
Morphology diversity (MD)Morphological alteration
Table 2. Values of each optimized parameter calculated by genetic algorithm in SVM.
Regression ModelCεσ
A_BP12.540.149.87
A_S41.190.0199.88
F_BP10.530.00113.62
F_IBI1.510.10.25
F_S87.720.1311.52
M_BMWP3.7140.330.08
M_EPT0.640.222.27
M_S0.480.240.44
Notes: C = Regularization parameter; ε = Slack variables; σ = Kernel parameter.
Table 3. Squared correlation coefficient (R2) values for sensitivity analysis.
VariablesECDOBOD5CODNH3-NTPTNWQCCMD
A_BP0.980.960.960.970.970.940.980.970.950.98
A_S0.960.920.950.960.950.930.930.950.910.95
F_BP0.970.940.930.980.970.950.940.980.970.98
F_IBI0.650.640.630.650.640.630.630.640.620.64
F_S0.960.940.930.960.970.980.960.980.970.98
M_BMWP0.400.390.350.360.410.380.390.90.400.40
M_EPT0.690.670.660.660.710.670.690.720.650.71
M_S0.570.550.580.580.570.540.560.570.570.58

