More Energy and Less Work, but New Crises: How the Societal Metabolism-Labour Nexus Changes from Agrarian to Industrial Societies


1
Institute of Social Ecology, Alpen Adria Universitaet, 1070 Vienna, Austria
2
Department of Geography and Environmental Studies, Debre Berhan University, 445 Debre Berhan, Ethiopia
*
Author to whom correspondence should be addressed.
Sustainability 2017, 9(7), 1041; https://doi.org/10.3390/su9071041
Submission received: 30 January 2017
/
Revised: 3 May 2017
/
Accepted: 4 June 2017
/
Published: 26 June 2017
(This article belongs to the Special Issue Social Ecology. State of the Art and Future Prospects)
Abstract
:The scientific finding that humanity is overburdening nature and thus risks further ecological crises is almost uncontroversial. Main reason for the crises is the drastic increase in the societal metabolism, which is accomplished through labour. In this article, we examine the societal metabolism-labour nexus in two energy regimes: a valley in the Ethiopian highlands, typical of an agrarian society, and a village in Austria, typical of an industrial society. In the Ethiopian village, the supply of food demands almost the entire labour force, thus limiting the capacity to facilitate material flows beyond food provision. In the Austrian village, fewer working hours, lower workloads but 50 times higher useful energy allow to accumulate stocks like buildings 70 times higher than the Ethiopian case. With fossil energy, industrial societies decisively expand their energy supply and reduce labour hours at the cost of high carbon emissions, which are almost non-existent in the Ethiopian case. To overcome the resulting ecological crises, there is a call to drastically reduce fossil fuel consumption. Such an abandonment of fossil fuels might have as far reaching consequences for the societal metabolism-labour nexus and consequently human labour as the introduction of fossil fuels has had.
1. Introduction: Human Labour and the Sociometabolic Transition
Global ecological crises such as climate change or the progressive loss of species have already crossed the planetary boundaries for a safe operating space for humanity [1]. Scientific analyses even go so far as to characterize mankind as a geological factor in the newly-defined Anthropocene [2]. In this epoch, humans have become the dominant influence on biological, geological and atmospheric processes of the earth system. The insight that this increasing human dominance of the earth system is due to the rapidly growing societal metabolism, global society’s material and energetic exchange with nature, becomes more and more accepted [3]. Main driver of this development are especially industrialized and emerging economies.
The growing social metabolism has become possible due to an energy transition, namely a shift away from the biomass-based energy regime of agrarian societies to fossil fuel-based industrial societies [4,5]. In this article, we want to show that such energy transitions go hand in hand with a transition of human labour itself. This is important, since intensifying global ecological crises, sooner or later, require a new transition away from the use of fossil fuels which is expected to have as many and equally far-reaching implications for human labour as the previous transition to a fossil-fuel based industrial society had [6]. Thus, it seems to be rewarding to better understand the interplay between material use, energy consumption, and labour in the context of the different energy regimes. To investigate what we call the societal metabolism-labour nexus, we make use of a sociometabolic perspective. To this end, in a first step, we develop a simple analytical scheme in the following section (Section 2). In a second step, before presenting two case studies, we briefly introduce methods and describe surveys as well as data generation for the cases (Section 3). In a third step, we apply the scheme to two local cases, one as illustration for an agrarian (Section 4) and one as illustration for a rural village in an industrial society (Section 4). The first local case is in Ethiopia, in a valley in the highlands. The local agrarian community is based on biomass as the primary energy source and uses fossil energy carriers only to a minor extent. The second case is an Austrian village which is part of an industrial society based on the use of fossil energy. After a detailed presentation of the two cases, in a forth step, we contextualise the results on the societal metabolism-labour nexus with average data taken from literature and compare the two cases with each other for better understanding the societal metabolism-labour nexus (Section 5).
2. The Social Metabolism-Labour-Nexus
Society changes nature both in an intentional and an unintentional way, and the changes in turn affect society. These society-nature interactions are analysed with the concepts of social metabolism, society’s material and energetic exchange with nature, and the colonization of nature [7,8,9,10,11]. Based on the idea of the metabolism developed by Marx [12], the concept was further developed analogously to the economic perspective in the national accounts. It is not simply humans, taken on their own, who are dependent and have an impact on nature, but the societal mode of production and consumption which we call sociometabolic regime. Key to metabolic regimes is the energy availability quantitatively across space which on the one hand largely determines the capacity of humans to change nature and to remove, transport and process resources and on the other hand makes a big difference for the societal conditions e.g., how much time remains for other activities than food provisioning. In the history of mankind, several sociometabolic regimes can be distinguished with distinctive transitions between them, often referred to as revolutions. The Neolithic revolution marks the transition from the regime of hunting and gathering to the agrarian society, and the industrial revolution the transition from the agrarian to the industrial regime. Apart from very few exceptions (e.g., small island states where wind as drive energy for sailing boats used for trading and fishing could make up a significant share in the societal energy supply), biomass is by far the most important source of energy until the industrial revolution. As a rule, biomass provides about 99% of the primary energy in preindustrial societies. Food and feed for humans and animals comprises by far the largest share of this energy input. By using biomass, humans make use of solar energy flows through land management. The German environmental historian Rolf Peter Sieferle [4] called this the controlled solar energy system of agricultural societies. Work of a population on a given territory is invested to transform ecosystems and to increase the amount of usable biomass that can be harvested per unit of area. A minimum prerequisite for the long-term functioning of such an energy system is that the harvested biomass at least provides the necessary energy for human and animal work in the form of food and feed. The higher the surplus, the more complex societal structures are possible. However, in agrarian societies, this surplus is quite limited and is around ten % in average years [6] thus limiting the number of people who are not tied to work for society’s food provision.
The still ongoing industrialization of agriculture since the 16th century [3] has led to a massive transformation of the agricultural landscape, which has to be made machine-friendly. Large fields have been created, from which all the species-rich field margins with ditches and shrubs, and land morphological obstacles have been removed. Working with heavy equipment promoted soil compaction and erosion. Large-scale monocultures require a high use of agrochemicals [13,14,15] Consequently, the role of agriculture within society changed dramatically during the transition from an agrarian to an industrial society. While agriculture in agrarian societies is mainly an energy supplier by providing food and animal labour, industrialized agriculture consumes more energy than is ultimately obtained from it [16,17,18]. This is made possible by fossil fuels, which can be mined in large quantities of deposits as required. Further, fossil fuels have very favourable features like the combination of easy portability with trucks and pipelines, and a high energy density which is about three times as high as the one of biomass. Thus, access to fossil fuels enables high energy availability almost anytime and anywhere.
Today, half of the world’s population still lives under more or less agrarian conditions [3], and what is usually called development or progress can be understood as a transition from the agrarian to an industrial regime [19]. To discuss the interplay between work, energy and material more specifically in the two different regimes, we introduce two empirical cases: an agrarian community in a valley of the Ethiopian highlands and an industrialized Austrian rural village. These two examples serve as illustrative cases for the two regimes. In agrarian societies, there are notable differences between local cases with variations in soil fertility, climatic conditions, agricultural practices, favoured plants, importance of livestock, population density and others. The same can be stated for rural cases in industrial societies. However, despite these remarkable differences in their metabolic rates, this is material and energy use per capita, variations within in one energy regime are not as significant as the differences from one to another energy regime [3,4,20,21]. Further, despite the differences between cases of one and the same energy regime, they display noteworthy communalities how they change in the transition like the building up of growing stocks, the increased use of technology hand in hand with less and less man power needed to supply societies with the necessary food, feed and technical energy. Therefore, our analysis is less concerned about differences within one energy regime, but focusses on the more fundamental differences in the relation between work, energy and material in two cases illustrative for two different energy regimes.
To investigate these differences, we use a simple analytical scheme consisting of the following dimensions [6,22]:
- (A)
- Societal stocks: human population, domesticated animals, colonized land and man-made artefacts.
- (B)
- Sociometabolic material flows like extraction, trade flows and material consumption.
- (C)
- Primary energy and useful energy related to human labour, animal labour and technology.
Based on this scheme and the methods described in the following section, we discuss the societal metabolism-labour nexus in two cases, one in an agrarian and one in an industrial society.
3. Methods Used and Data Sources
The two case studies follow standard Material Flow Accounting principles. Therefore, we present here only a summary and provide an overview of the references used. In this description, we pay special attention to issues especially relevant for the cases or where the cases slightly deviate from the standards. Further, we describe the surveys performed to generate these data and give references for more detailed information on the case studies. Further, we provide some background on the methodology for calculating useful energy and provide the references, where these method is discussed in more detail. Finally, we briefly describe how carbon emissions are estimated for the two cases.
3.1 Material Flow Accounting (MFA)
The base of the analysis relies on the conceptual framework and the system boundaries applied in economy-wide material flow accounting at national level (MFA) [9,11,23,24,25]. The guide and further references consistently provide detailed information relevant for accounting.
3.1.1. Methodological and Conceptual Considerations
Societal metabolism is based on the premise that any social system reproduces itself biophysically through a constant flow of materials and energy with its natural environment as well as with other social systems. Thus, size and composition of flows are intricately linked to the biophysical stocks of the social system; therefore, we are especially interested in stocks. To measure the biophysical flow characteristic, we use domestic material consumption as a key indicator, which is material extraction plus imports minus exports within a year. This indicator includes not just the consumption of people, but also the feed for livestock and all materials to maintain or expand societal stocks as well as all losses occurring during the processing of materials. Further, flows in the two cases are broken down into main material groups in accordance with material flow accounting conventions (cf. [25]). We usually distinguish into biomass (like cereals, grass, wood, etc.), mineral materials (non-metallic minerals like sand, gravel, stones, cement etc. mainly for construction and metals) and fossil energy carriers (like oil, gas, coal). Practically, flows are measured in tonnes for a specific year and all flows like biomass are reported in fresh weight. Standard moisture contents are provided in the guide. Biggest uncertainties exist for construction minerals since these materials are consumed in large quantities but in irregular intervals. Thus, accounting annual flows in small local communities via surveys or observations might provide an accurate but misleading result, especially if main construction work was performed just in the studied year or, in contrast, in many years but not in the studied year. In our cases, we provide an average picture and therefore asked people about stock changes in the previous years and estimated an annual average of additions to stocks, which still has higher uncertainties than other flow data.
In social metabolism research boundaries are not territorial ones but functional ones. While this issue is of minor relevance for the economy-wide material flow accounting, this becomes quite a tricky issue at the local level. To account for this, further standards were applied as discussed in the local studies manual [26]. In order to follow a functional understanding of system boundaries in both cases, we first defined who belongs to the community or village in accordance to political or economic membership as well as simply by factual presence. Thus, people, a stock of the social system, is defined. If the boundaries are functional and not territorial, it needs to be clarified which land, another societal stock, belongs to the social system. The land under consideration is the land that is under legitimate control of the members of the community. In our two specific cases, land was involved which was positioned so to say outside the territory but under legitimate control of members of the community. In Bahskurit outside the territory means outside the valley respectively the watershed and in Theyern outside means outside the political boundaries of the village. Thus, flows related to this land under legitimate control of the Bashkurit Valley were accounted for. Consequently, land and its related flows under legitimate control of persons not belonging to the respective local society but within the political borders of Theyern or the geographic boundary of Bashkurit Valley was not considered. A social system’s livestock is determined by belonging to people of the social system or when their reproduction like feeding, health care and breeding is controlled by local people. Analogous, whether artefacts belong to a social system or not is defined via belonging to or maintenance by a member of the social system.
These are in brief the principles applied in these studies to identify societal stocks and flows for the two cases. All these decisions to identify a social system’s stock is discussed in more detail in manuals for the national as well as the local level, also including practical conventions such as definitions where the boundary between society and nature is drawn [23,24,25,26].
3.1.2. Surveys and Data
While economy-wide material flow accounting at the country level can rely mainly on statistical data, the local level mostly can’t use any statistical information since they are not accurate enough or simply are not available at all. Therefore, in both local case studies presented here a survey for generating primary data was performed. In Bashkurit Valley the survey was done during a one year field trip. Based on the data requirements for the analysis of land, material, energy and time use, the researcher and his research assistant applied different survey methods. Based on existing maps from previous studies an inspection of the land was performed to establish the different types of land use. This information was later verified in group discussions. Number of livestock was established during a household survey and cattle numbers were verified by counting animals in stables. Extraction of harvest and fire wood was estimated by weighing the bundles typically put together by inhabitants. In combination with results from household surveys about the number of bundles produced during a year, harvest and fire wood amounts were calculated. This was cross-checked with yield factors from the local university in Gondar. Grazing amounts were estimated by feed requirements per head of the different types of domestic animals minus the fodder provided by the farmers. Information on the later was gathered during the household survey. Time use data were obtained by a mix of in-depth participatory observations of a variety of different persons (representing different age groups, gender, family sizes and wealth), household surveys and group discussions. The data on the household possessions was gained during the household survey by weighing the typical artefacts in some households and by counting number of artefacts in all surveyed households. Weight of buildings was calculated by estimating the weight of each material component (wood, grass, metal, stone, clay, bricks and cement) used for two different types of houses (rectangular tin-roof houses and circular thatched-roof houses). Tin-roof houses are mainly used as residential houses, while thatched-roof houses are mainly used as kitchen buildings and stables. Detailed information is documented in Andarge [27].
In Theyern data were mainly gained by household surveys and methods and data described in detail in Haas and Krausmann [28]. About 80% of the households were interviewed and almost all of them were very collaborative. Each interview was performed by two interviewers who were part of a research team with very good knowledge on the method of material flow accounting. Since an official map with demarcation lines was prepared in the year before the interview, it was used to discuss with each household which land is under their control and what is the actual land use (in case of fields farmed crops were inquired). Several data on the buildings like square meters, floors, roof type, key materials used and date of construction were collected. This information was cross-checked with aerial photographs. Weight of buildings was estimated by using a factor related to the habitable area of the buildings [29]. Data on vehicles like type and brand of vehicle, mileage per year, fuel consumption per 100km was collected. With these figures and standard factors for vehicle weights the overall stocks of vehicles as well as the annual fuel consumption was estimated. Estimating the household possession was a difficult task, since a vast number of artefacts were present in the houses. Thus, possessions were established by a check list containing different product groups, with heavier products being listed in more detail. Electricity bills were analysed together with the interviewees to obtain the kilowatt hours per year. Harvest data from agricultural fields as well as the local forests were well known by farmers and thus data collection was simple. Cross-checking with typical yield data confirmed the information. Local consumption of locally produced food was surveyed as well. Food requirements for the local population was estimated on the base of average nutrition data including average food waste losses for Austria. Thus, imports of food were estimated by deducting the consumed food locally produced from the food requirements, since this can be assumed to be purchased elsewhere. Regarding time use only time spent for economic activities was inquired (employment, farming, assistance in farming activities).
In principle time use was surveyed on an annual base, this means that weekly and seasonal differences including holidays (in the case of Austria) were specifically asked for to estimate the annual time spent for labour. The daily time use for labour was then the division of the annual time spent by 365.
3.2. Primary and Useful Energy
In principle, the method applied here follows the detailed description presented in a two-part article by Haberl [20,30]. In addition to materials, the biophysical reproduction of social systems (and thus it’s societal stocks) requires a continuous supply with energy, which can be provided by materials in the form of material energy carriers like biomass or fossil fuels or by electricity, which flows without material. In our study, we distinguish between primary energy and useful energy.
Primary energy is defined as the energy in the form in which it is extracted from the natural environment, for example, extracted energy-rich materials (biomass, fossil fuels), harnessed flows of mechanical energy (hydropower, wind power, etc.), nuclear energy transformed to heat, or radiant solar energy used to produce heat or electricity [30]. To highlight two case-specific examples: primary energy is the energetic value of fire wood for cooking/heating or of cereals for human nutrition at the point the respective energy carrying materials are collected from forests or harvested from fields. When we account for primary energy in our two cases, we always consider the energy content at the point of extraction, even if it is imported. For example, in the case of local electricity consumption, we consider the related primary energy harnessed in a hydropower plant or the oil extracted from nature which was used to produce electricity in a thermal power plant.
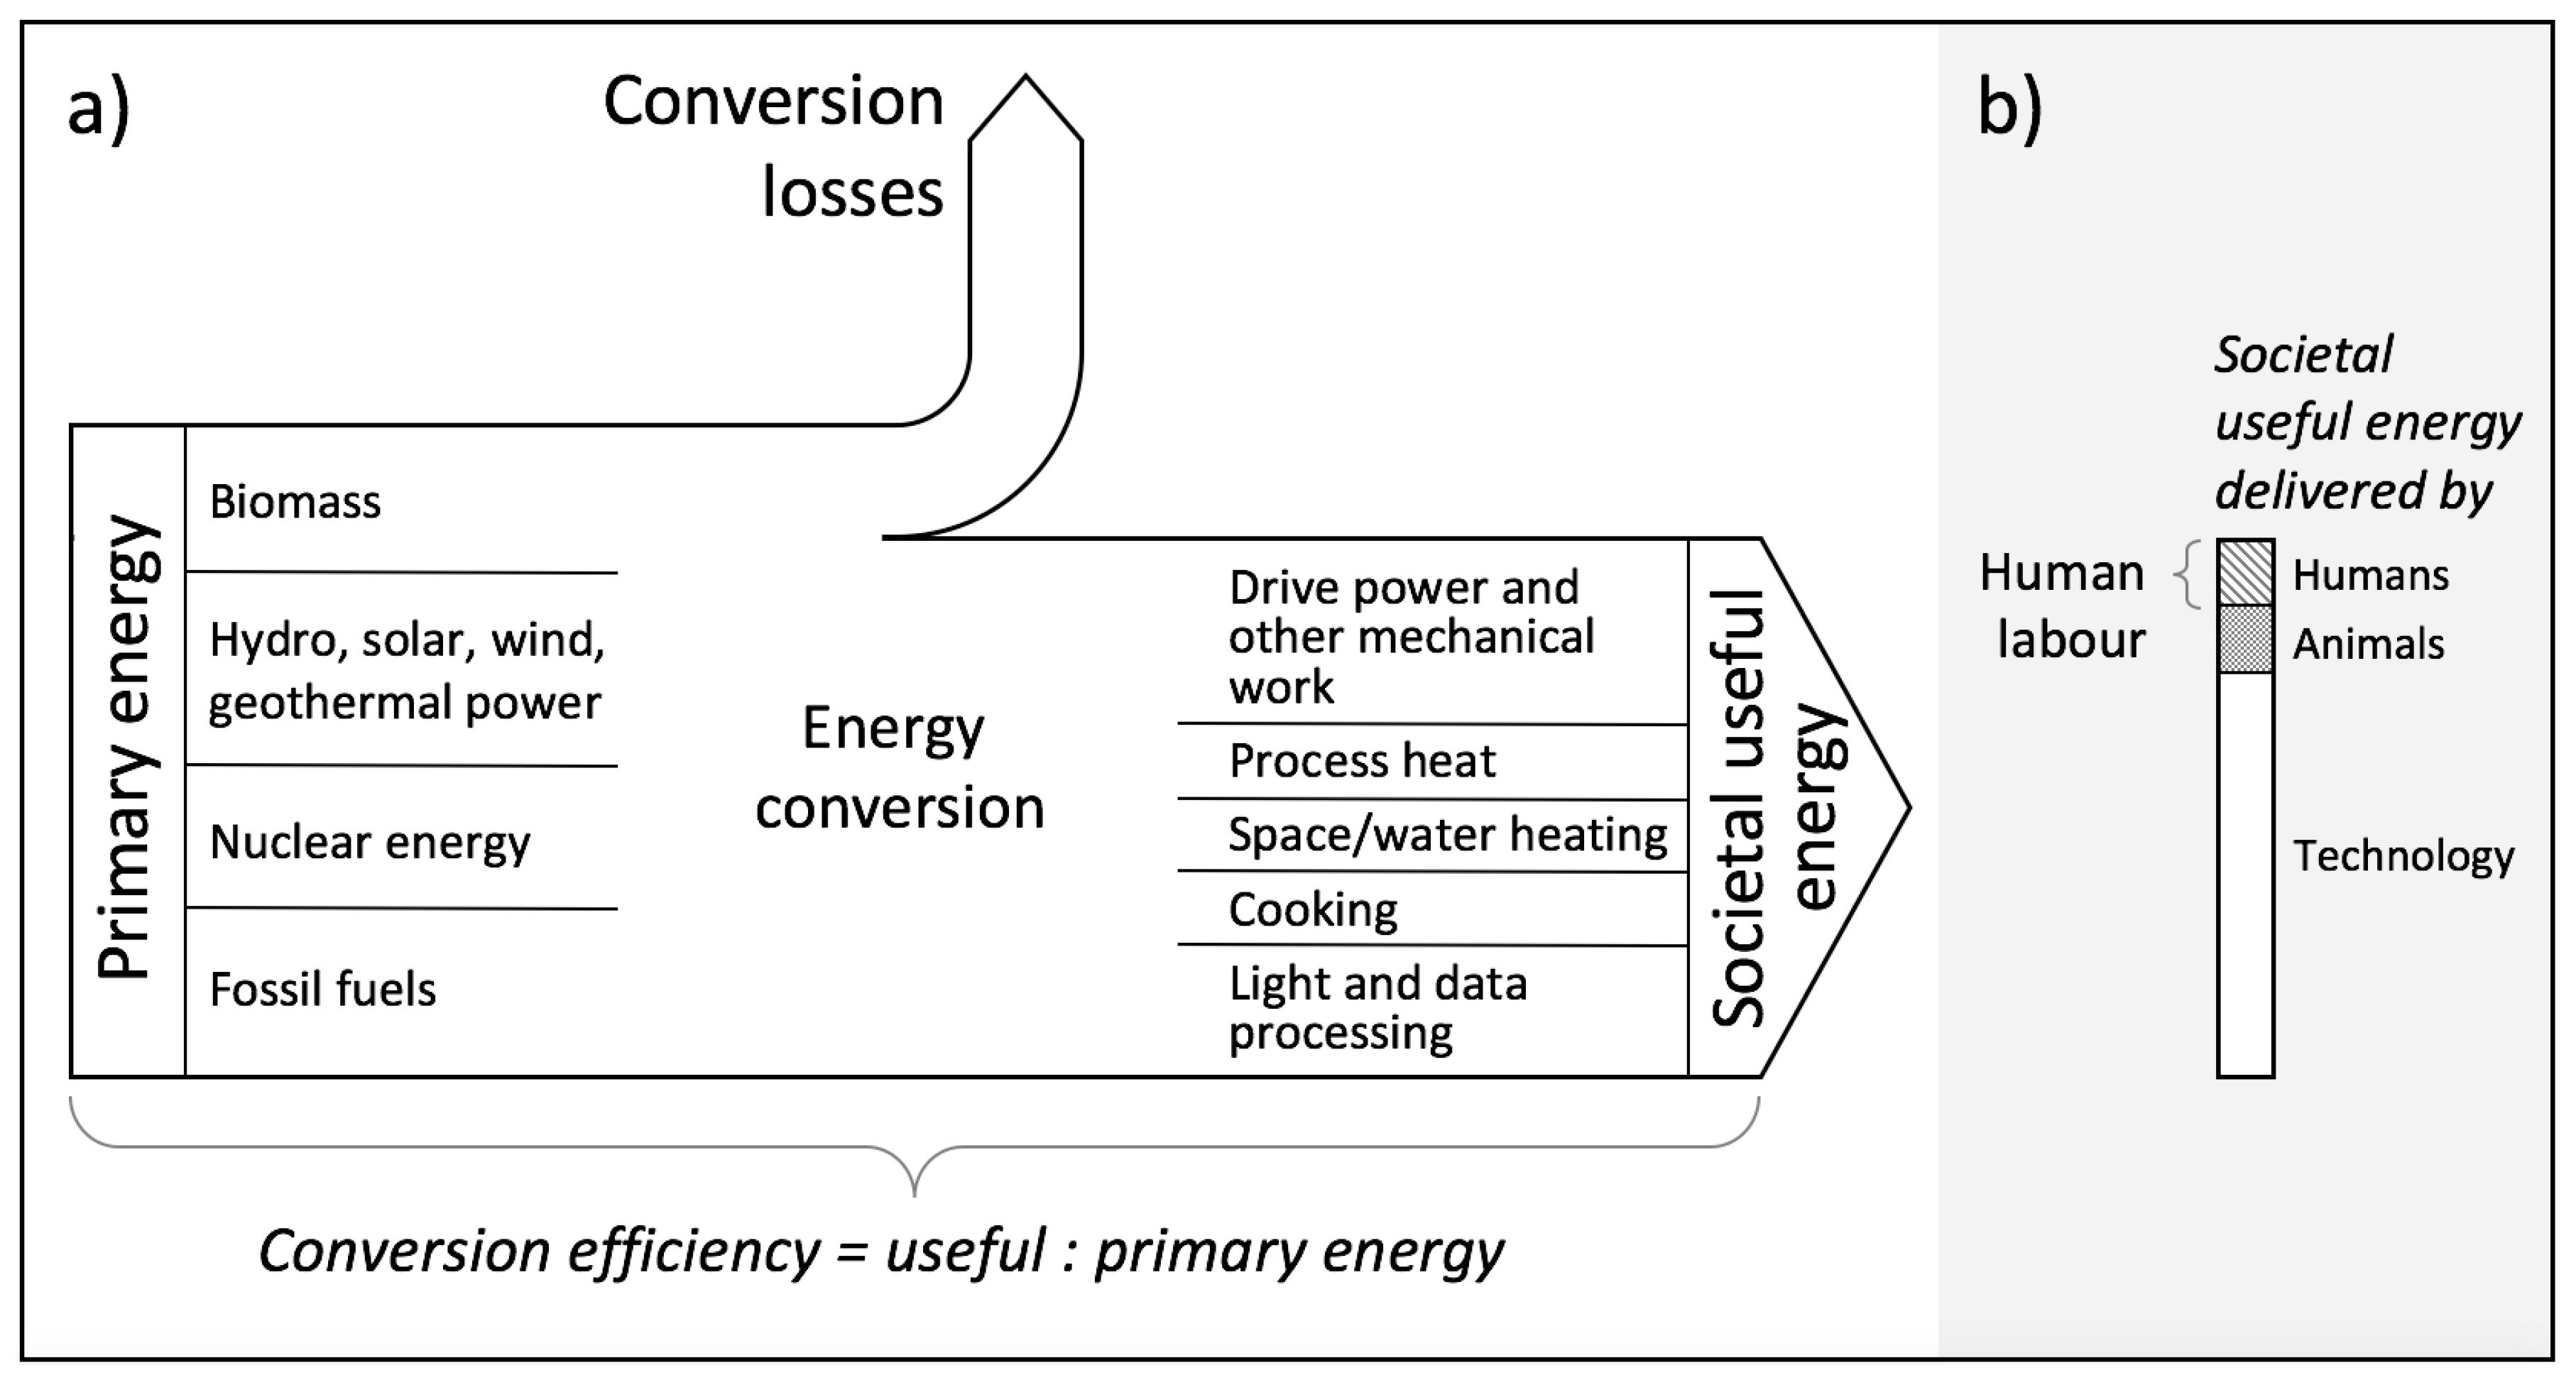
Useful energy (“exergy”) is the energy that is ultimately used or available to society (see Figure 1). This refers to the actually useful work such as moving a pile of sand from one place to another or the physical drive power pulling a plough for a certain distance, or the thermal energy that heats the food in the cooking pot. Societies dispose over useful energy delivered by humans, domesticated animals and technology. These different types of work taken together, we call societal useful energy. Of special interest is how much useful energy is invested by humans in the form of human labour. Useful work including human and animal labour as well as work performed by technologies can be quantitatively recorded in joule [31,32]. In addition, human labour spent in the economic system like for agriculture or wage labour can be expressed in average hours worked per person and day [26]. In practice, all hours annually worked in a local community are surveyed and divided by total population and 365 days. The useful energy provided by humans is then the product of hours worked and the average work load per hour (J/hour) [20].
Technically, useful energy is the remaining energy after all conversion losses are deducted from the primary energy and the conversion efficiency is the ratio between useful to primary energy.
In the case of human labour in Bashkurit Valley (agrarian society) the assumptions are that humans can deliver up to 100 Watt per hour in continuous work [33]. This is, however, a maximum. A continuous delivery of 40–50 Watt useful power per hour may be an appropriate guess; based on the 5 h of work per day in Bashkurit Valley this equals about 300 MJ per capita and year. In Theyern (industrialized society), it is estimated that the continuous delivery for farming activities is about 50% of the one in agricultural societies and for desk work about 30% of agrarian farming; based on 2.5 h of work per day in average in Theyern, this equals about 50 MJ per capita and year. In a similar way, the useful energy for animals in Bahskurit was calculated according to Haberl [20]. In the case of Theyern the animal labour of horses was calculated by assuming 250 Watt of useful energy per hour of horseback riding [34]. With one hour of daily riding for both horses this adds up to 5 MJ per person and year. Useful energy delivered by vehicle motors was calculated assuming an efficiency of 15% (from final energy to useful energy) [35] and the efficiency from primary to final energy was assumed with 65% [20]; the efficiency of cooking was assumed to be 6% for Bashkurit valley [36]. In view of the three-stone cooking technology used, this assumption seems to be realistic. If the cooking takes place in the hut, the fire for cooking also heats the hut. This could increase the efficiency of the energy use to as much as 80% albeit only in cold seasons. In this calculation, this was neglected, also because the warmth rapidly escapes in the draughty huts. Due to the indoor pollution, huts need to be draughty to limit harmful health effects. Main reason for not considering the waste heat of cooking has heating is that the heat is mainly required in the residential houses, while the warmth is generated in the kitchen huts. The cooking efficiency for Theyern was estimated to be 30% (according to Haberl). Space heating in Theyern was calculated according to assumptions made by Haberl but adjusted to the local energy mix (biomass, oil, electricity, solar energy for hot water). In a similar way, the conversion from petroleum to lighting in the Bashkurit Valley is based on Haberl’s assumptions but adjusted to petroleum as the only source.
3.3. Carbon Emissions
For estimating the carbon emissions a simple calculator was used [37]. The country-specific emissions factors applied here are 2.8 kg CO2/litre gasoline, 3.2 kg CO2/litre diesel or heating oil and 0.184 kg CO2/kWh electricity for Theyern. Petroleum used in the Bashkurit Valley was calculated with 2.8 kg CO2/litre. Biomass was assumed to be carbon neutral in both cases.
4. No Time: Insights into an Agrarian Society of the Ethiopian Bashkurit Valley
The first case is located in Ethiopia, a country that has seen fast growth in recent years, but GDP per capita is with 500 US$ (in current prices for 2012) [38] one of the lowest in the world. The agricultural sector accounts for about 47% of national GDP and 85% of employment [39]. Agriculture is mainly rain-fed, dominated by smallholders (Lavers 2012) and shows due to the very low use of fossil energy and machinery typical patterns of an agrarian society [40].
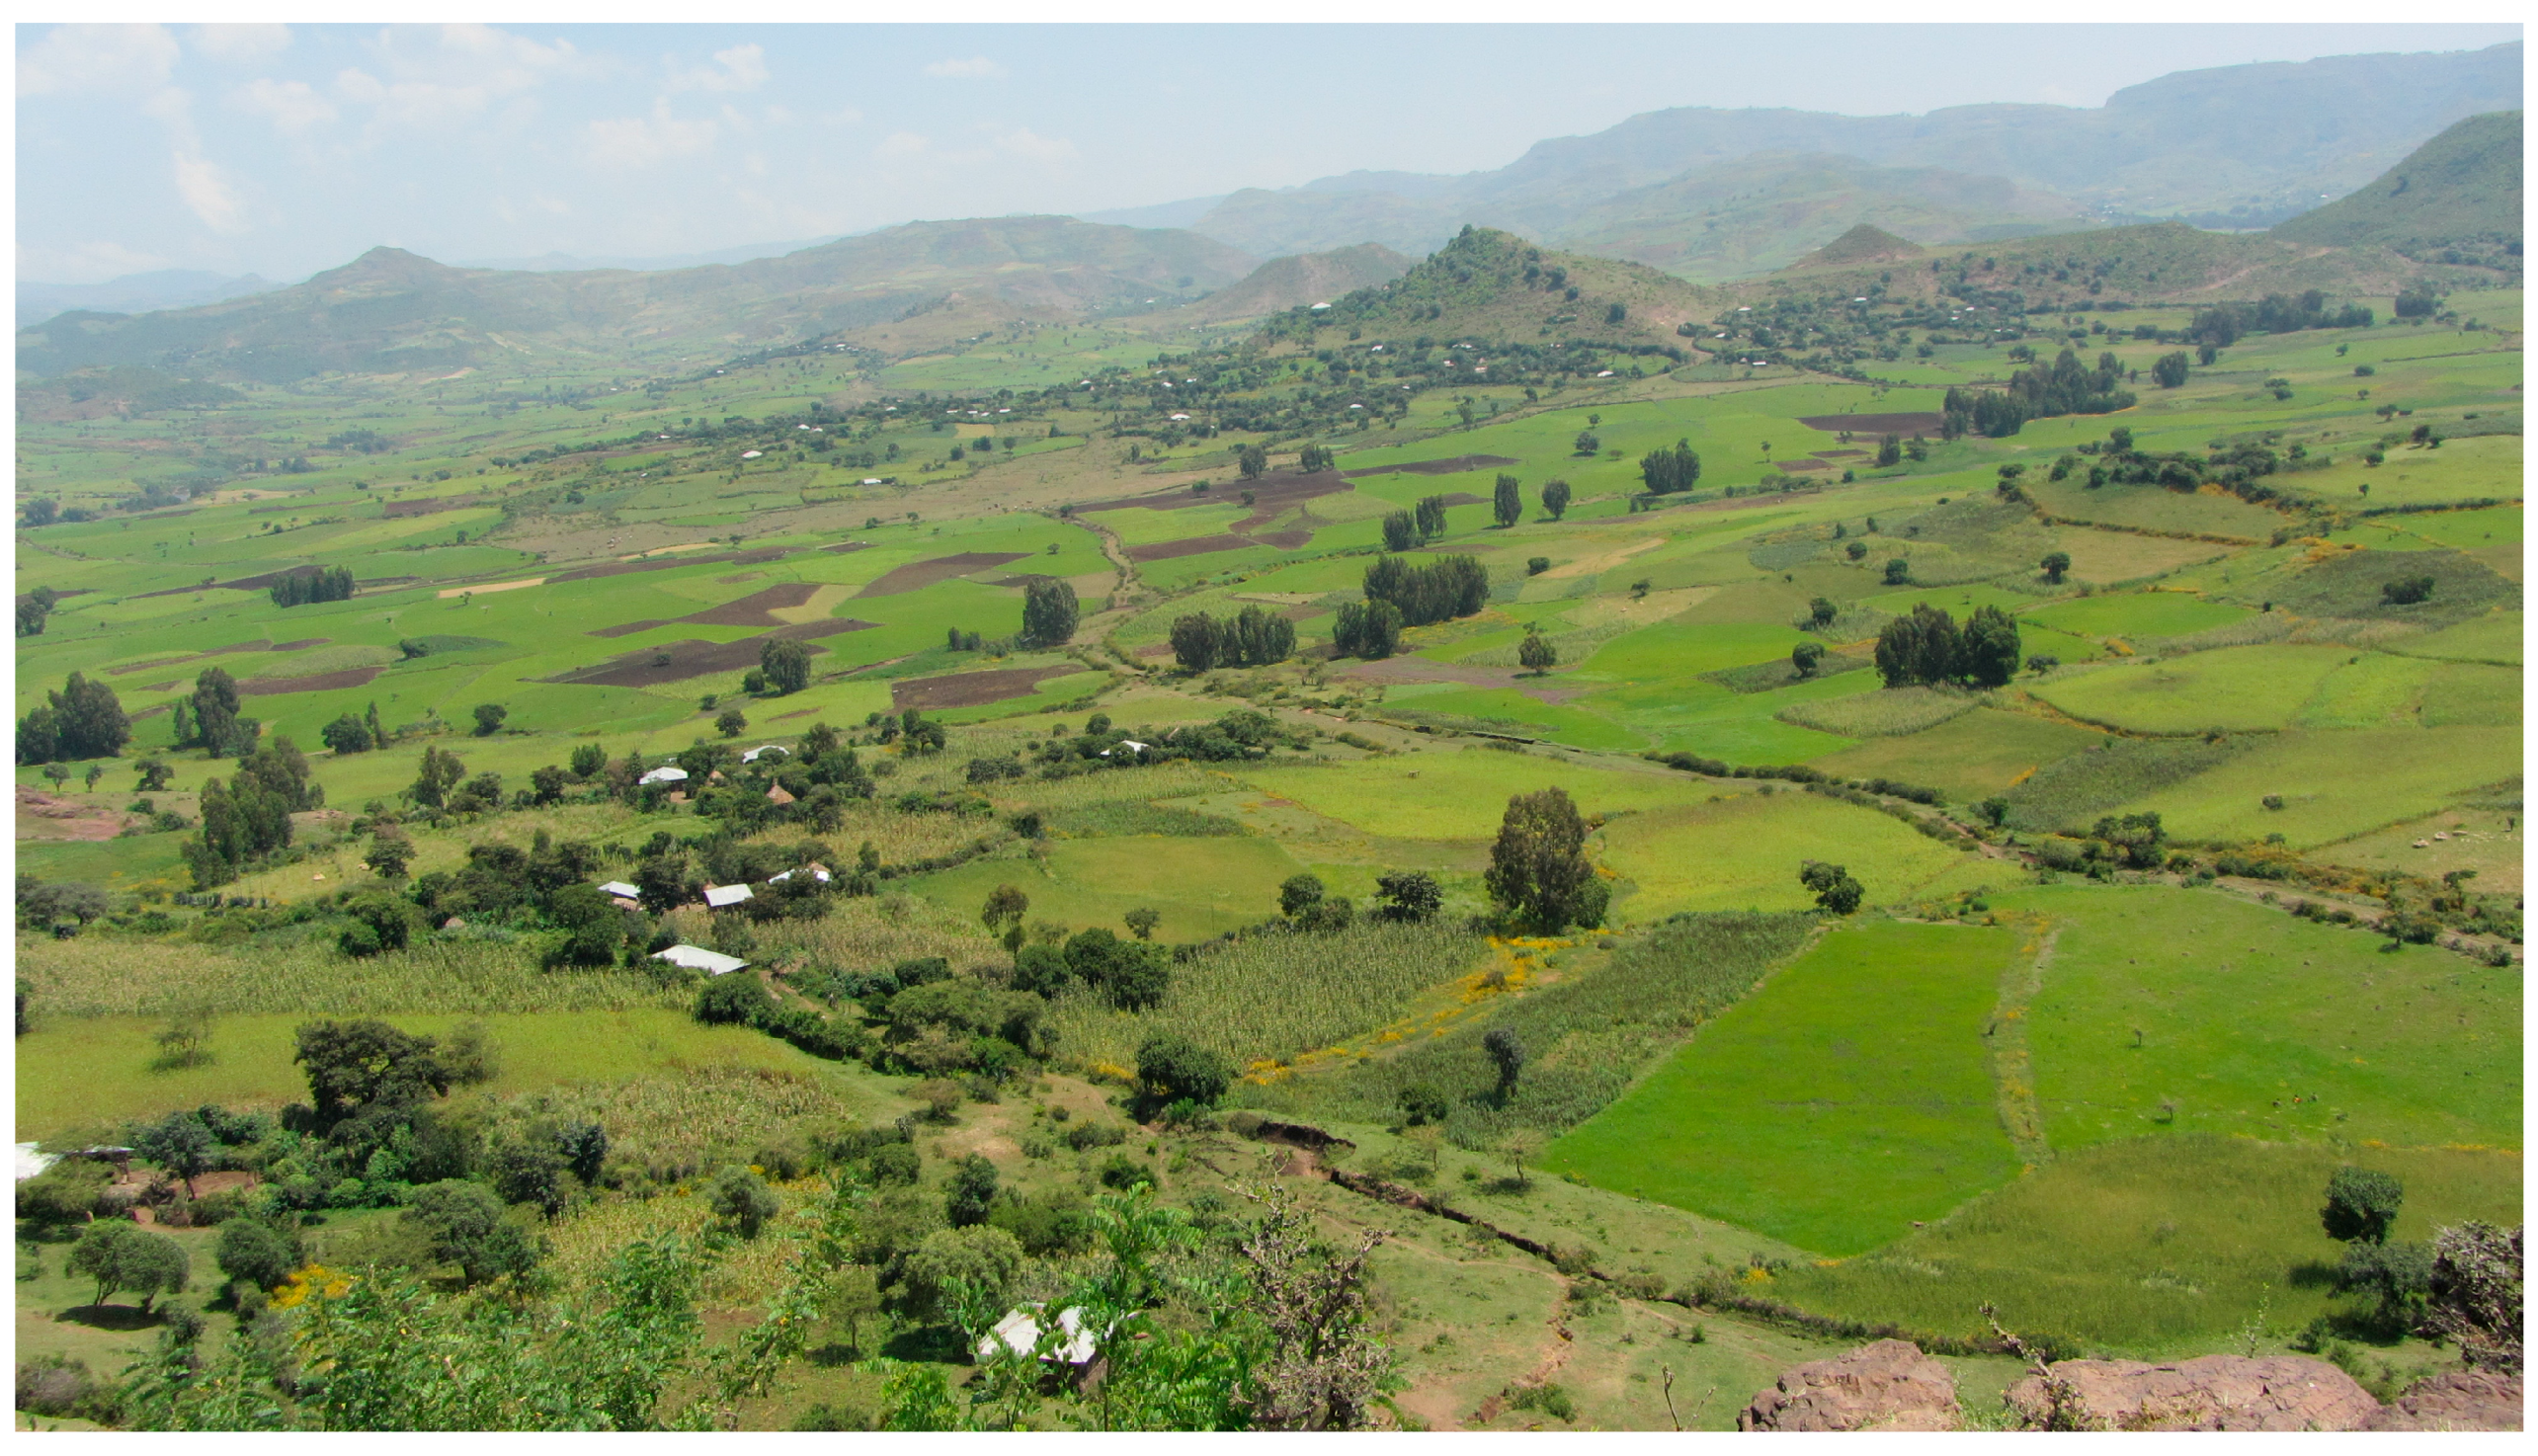
The case study area itself is a valley called Bashkurit and located in the northwest of Ethiopia. It lies north of Gondar (population approximately 200,000), the fourth largest city in Ethiopia (see Figure 2). The closest road to Gondar is a few kilometres away and can only be reached on foot paths. The landscape is about 2300 m above sea level, is slightly hilly and barren in all seasons except for summer (June to September). The inhabitants feed themselves by means of a sophisticated system of field and livestock farming and use fossil fuels for lighting only. As in many agrarian societies, rain is of existential importance in the Bashkurit Valley as it determines whether the next harvest is sufficient for local food supplies and whether—in the best case—a surplus can be sold in the market. In Bashkurit, the precipitation is a yearly average of 1200 mm per year, much more than in the low-precipitation north-east of Austria (450 mm) and roughly at the level of the Austrian average (1100 mm). However, rain falls more concentrated in a shorter time, namely 80% of the rainfall in four summer months (June to September). In addition, rainfall is subject to strong annual fluctuations, and both severe rainfall and droughts occur frequently. The daily temperature maximum ranges from seven degrees Celsius in November to 32 degrees Celsius in April. In accordance with this climate, the Bashkurit Valley is harvested once per year.
We prepared a complex material and energy flow calculation for the valley. For a year, the people in the valley witnessed and participated in weighing, measuring, observing, counting and recording for a detailed stock taking exercise of the material stocks, material and energy flows as well as time use [27]. All data refer to the year 2012.
4.1. Societal Stocks: People, Livestocks, Land and Artifacts
In 2012, 2200 people lived in six villages of two to 13-person families (an average of seven persons live in about 310 households) in the valley. The annual population growth in the valley is between two and three %, the population has doubled in the last 25 years. Life expectancy at birth in Ethiopia is despite improvements with 61 years still low [41]. A national strategy from 1993 aims at a birth rate reduction: for women, instead of 7.7, only 4.0 children are to be born [27]. Because of this strategy, the Bashkurit Valley has recently seen a slight decline in the birth rate, in effect growth continues albeit slower. In the 1700 hectares of the valley, about one third of the area is forest and scrubland, about a third are fields, a quarter are hedges, and the remaining roughly eight % are rocky or used for paths and buildings [27]. The 2200 people in 2012 held more than 400 oxen, 900 cows, 300 donkeys, 1500 sheep and goats as well as 1000 poultry animals. The families lived in over 500 houses (some families had more than one house), 80% of which are covered with corrugated iron. The remaining houses have grass roofs. 2.4 tonnes of material per person are used for houses, about half of the material is biomass and the other half consists of minerals such as stones, clay and iron (for the corrugated iron roofs). By way of comparison, for Europe, the values are between 130 and 325 tonnes per capita [42]. Household and personal possessions add up to about 130 kg per person in Bashkurit. Due to the absence of a power supply network, there are neither electric household appliances nor electronic devices such as mobile phones or computers, except for a few radios. Much of the household items consist of kitchen utensils, furniture and agricultural tools such as pickaxes and ploughs. Some of the households also have petroleum lamps. Aside from clothing, personal possession is minimal and consists mainly of school supplies for children. For adults, possession of the Bible is of high personal importance.
4.2. Metabolic Flows of a Valley in an Agrarian Society
In the Bashkurit valley, approximately 7000 tonnes of material or 3.2 tonnes per person are extracted annually from the local environment (Table 1). These consist almost entirely of biomass, roughly 40% of harvested field crops (three-fourths are millet, wheat, corn, teff and barley), 40% of biomass grazed by animals and 20% of collected wood, mainly used as firewood. In addition, very small amounts of honey are taken from nature. The only minerals extracted locally are loam and stones for the construction of huts (less than 1% of the extraction).
The local community imports 165 kg of material per person and year. The bulk of this, 80%, is biomass in the form of seed, feed and food. Food mainly consists of sugar and cooking oil. Other imports are mineral materials such as salt, iron, cement and fertilizer. About nine kilograms of fertilizer per person per year are imported, which amounts to 35 kg per hectare of farmed land (in industrial agriculture this is 100 to 200 kg per hectare). Twelve kilograms of artifacts (kitchen utensils, tools and clothes) and about three kg of fossil fuels are imported per person and year.
Exports amount to about 284 kg per person, accounting for just under 10% of the local extraction. Exports are about 40% unprocessed wood and grain. Furthermore, straw and dried cow dung are exported as fuel. Quantitatively insignificant, but of economic importance, is the export of honey and mud furnaces. For the latter, clay is removed locally and mixed with imported cement and processed into small cooking stoves. Most of the exported goods are brought to nearby markets. Although the income is low, it is necessary to import goods or to finance health care and school education.
The study of the per capita food supply shows an intake by humans of 2127 kcal/cap/day [27]. An estimate of the energy requirements based on FAO data of kcal/kg body mass for different age groups [43] and the body mass per age group in the Bashkurit valley shows that 2250 kcal/cap/day are required. Thus, there is slightly too little food available compared to the requirements which constitutes a situation of food scarcity.
4.3. Primary Energy, Societal Useful Energy and Human Labour
Day-to-day life in the Bashkurit Valley is extremely labour-intensive, as is clear from a statement from Wagaw, a local farmer: “We daily struggle with nature to fill our stomachs and the stomachs of our cattle. Even in the heat of the sunshine, we do not interrupt our work, but protect our heads with caps” ([27], p. 98).
When people are asked about the cultural significance of work, one quickly finds that work is closely linked to food procurement. This is illustrated by the frequently used Amharic saying “Yalsera aybla”, which means “no work, no food”. Subjectively, work creates two opposing meanings for the inhabitants, depending on the harvest. If there is enough food, the residents are proud of their work. If the food is not sufficient, they feel it as a burden.
If we examine human labour quantitatively, we base this analysis on functional time use studies [44]. These studies treat human time as a key resource of social systems. A social system’s available time per average day is characterized by 24 h per day and individual multiplied by population size. This time is spent for four different functional subsystems: the person system (PS), the household system (HS), the economic system (ES) and the community system (CS). According to literature, the time invested in the economic system is what we refer to as labour time [26].
Table 2 provides some impressions of daily routines and ascribes the activities to the four functional subsystems.
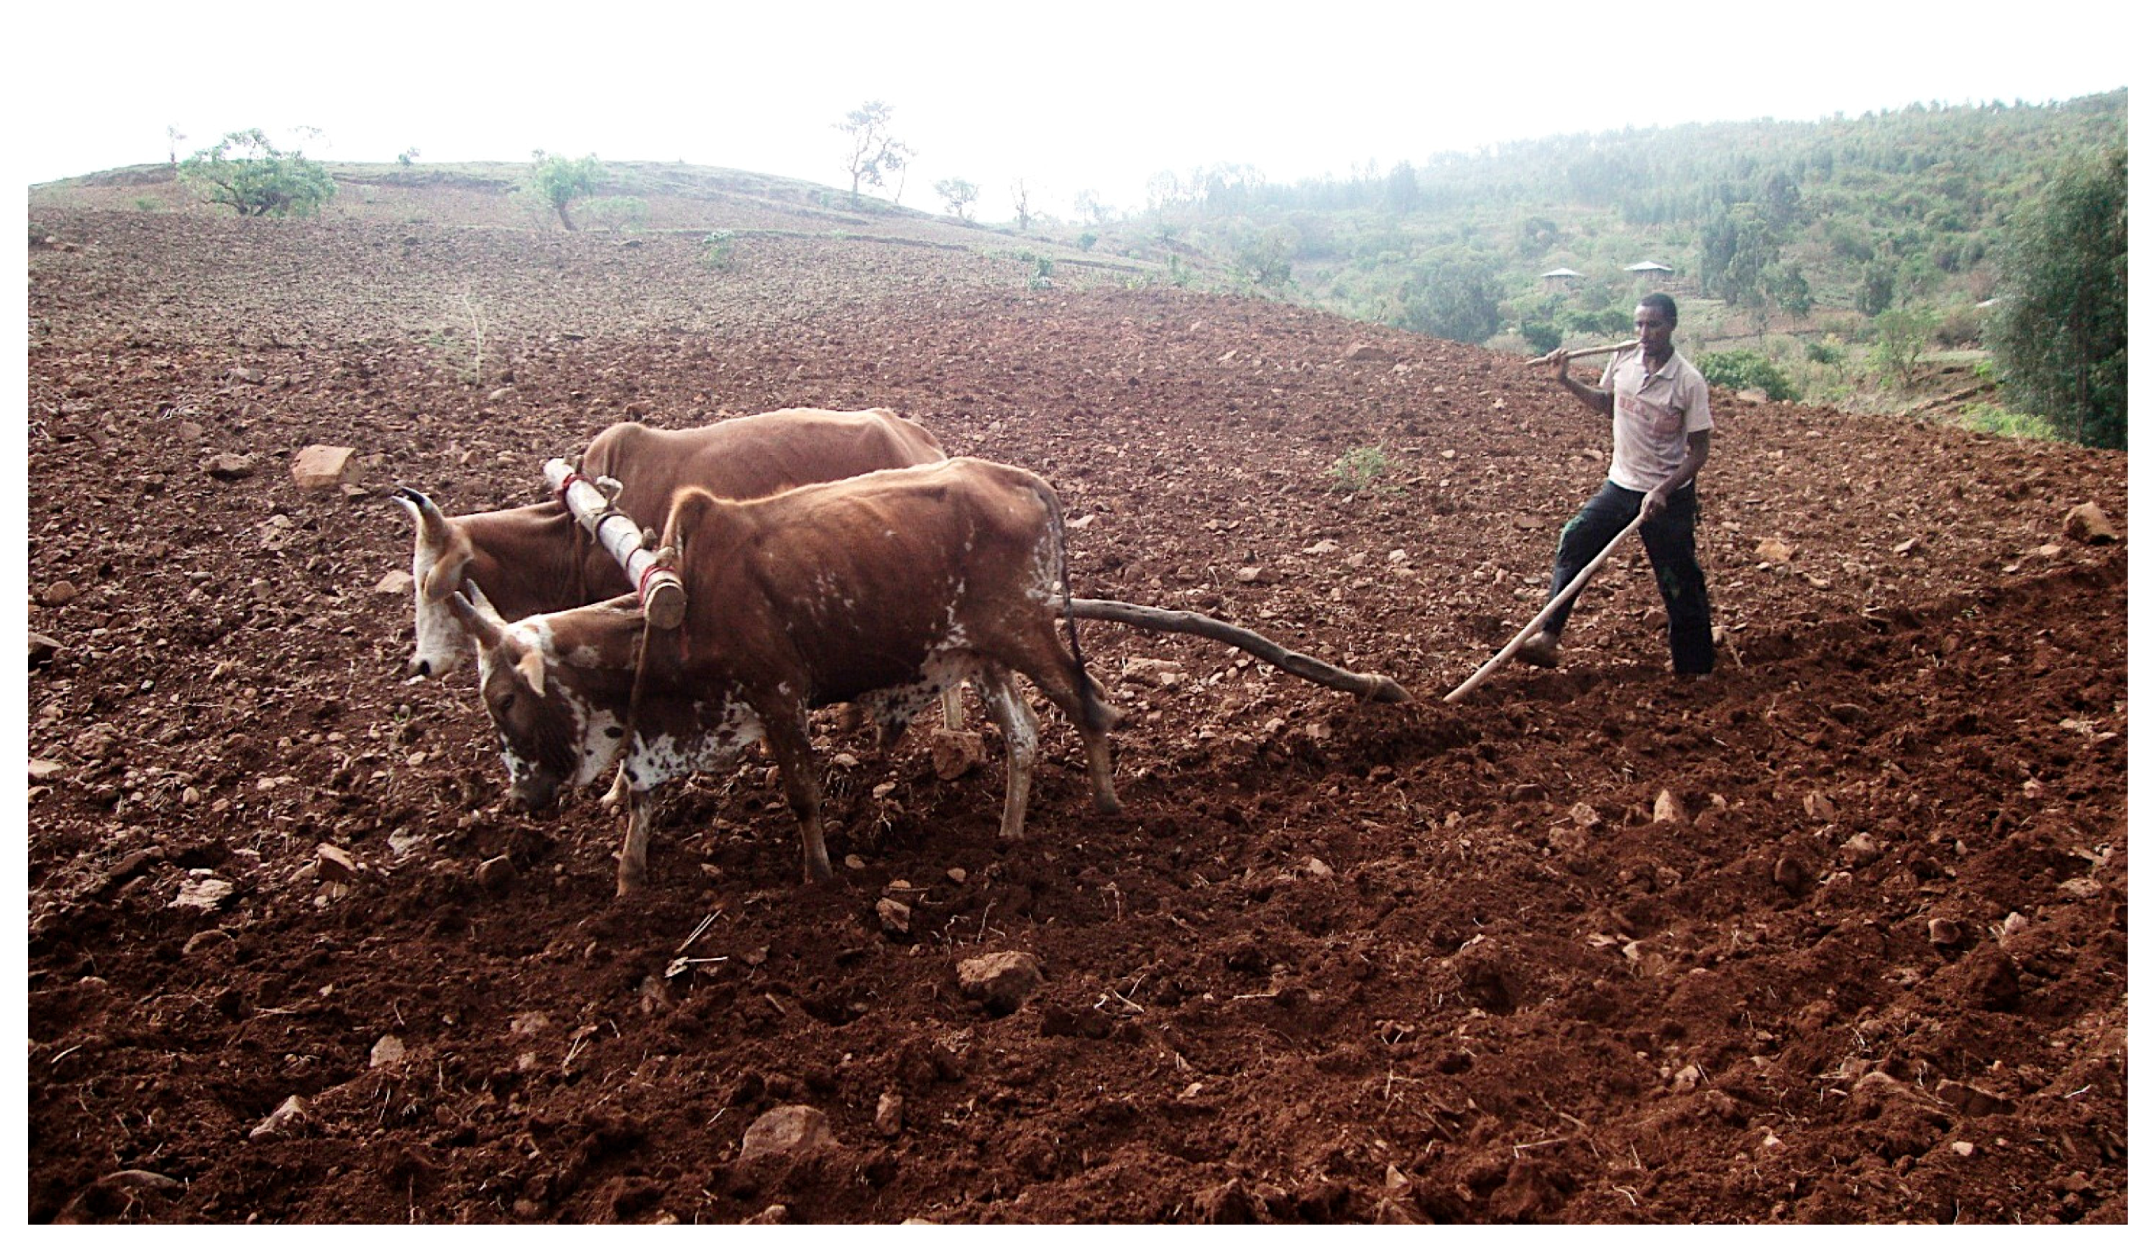
In Bashkurit the annual average human labour time in the economic system of all persons, whether old or young, is about five hours per day and person, mainly in agriculture (including market walks, making baskets, and other smaller wage labour). In addition to the work in the economic system, two and a half hours are spent for household chores and a little more than two hours are spent for community affairs (work for shared infrastructure or care for neighbours, church visits and meetings). This leaves about 14 h for sleeping, eating, body hygiene and leisure. At the age of six years, children work four hours a day on average. The greatest time demand for work, be it in the economic or in the household system, is on 25 to 50-year-old adults with over ten hours a day, with women more burdened than men. Especially the age group of 25 to 40-year-old women has less than ten hours for sleeping, eating, body hygiene and leisure (PS), men of the same age eleven hours. Compared to other agrarian societies, this is an extremely low level of time for personal reproduction (PS). In Nalang (Laos), a subsistence economy dominated by rain-fed rice farming, and in Campo Bello (Bolivia), a swidden agriculture with fishing, hunting, gathering and raising poultry, the work load in the economic system (ES) is between 2 and 3 h (in Bashkurit five hours) and the time for personal recreation is 18 h (in Bashkurit 14 h) [27,45]. In addition to human labour, oxen and cows provide work for the farmers. The domesticated animals are used for ploughing, sowing, harvesting, threshing and transporting.
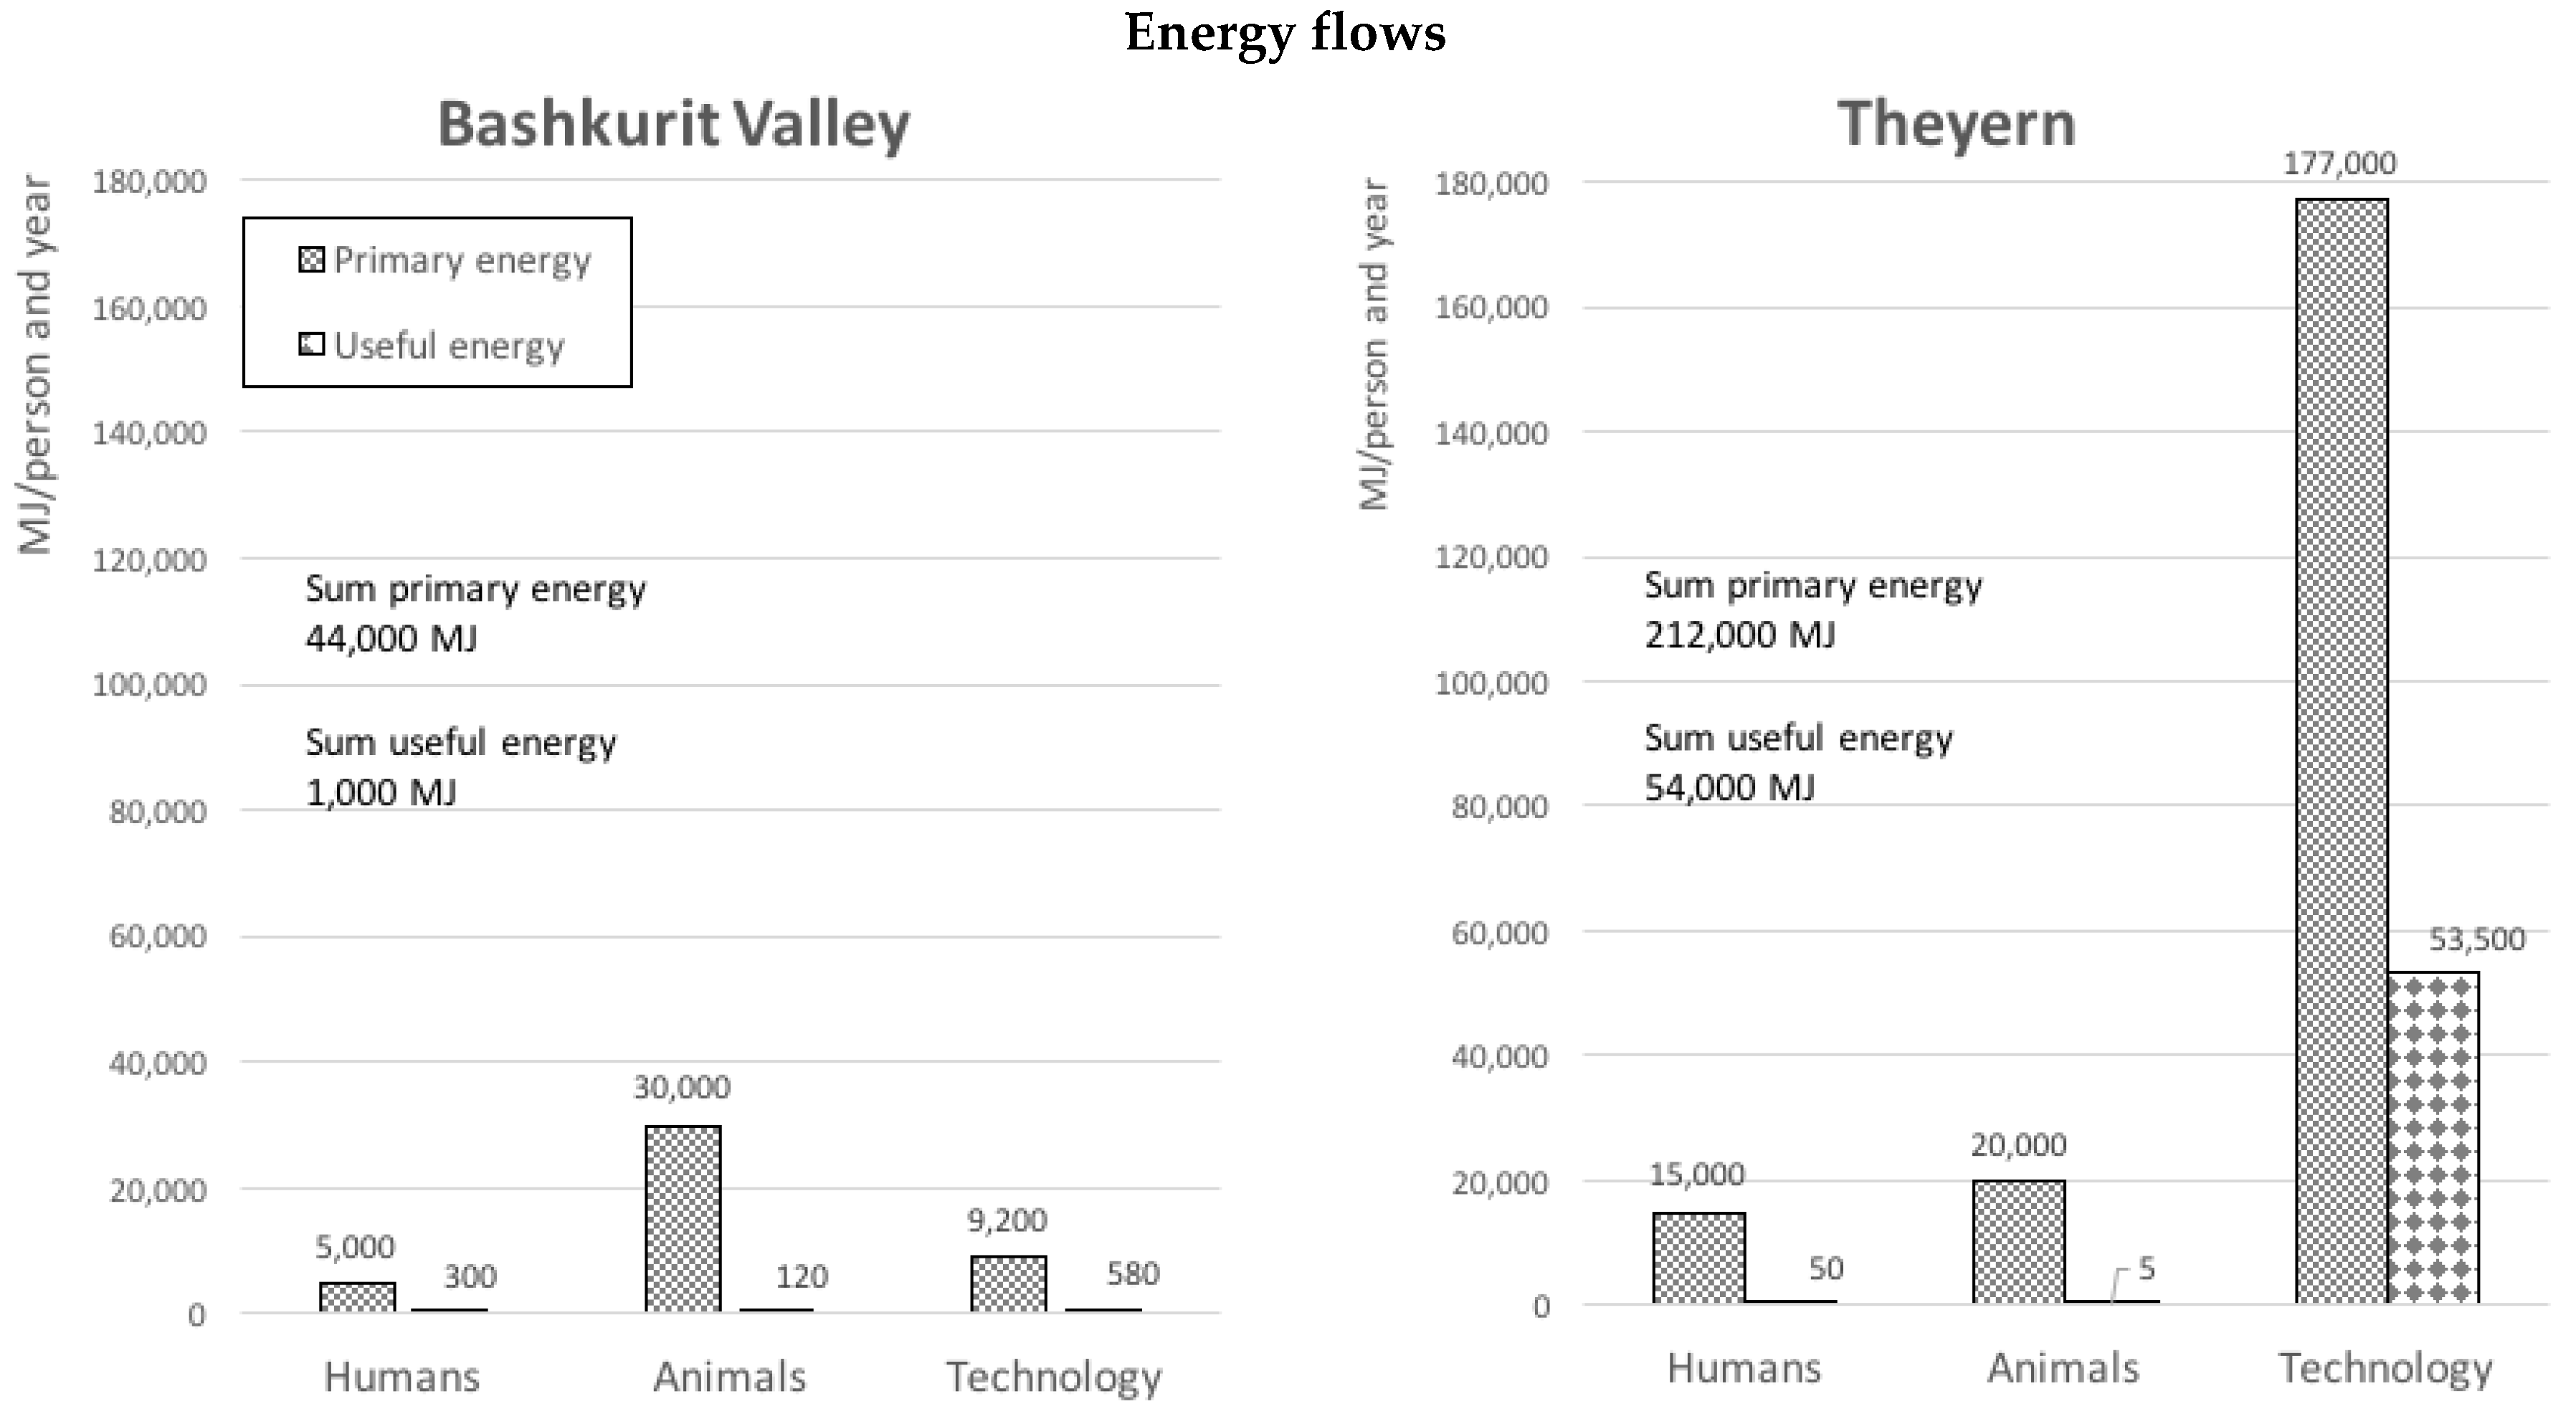
In the Bashkurit Valley, people provide around 650 Gigajoule of useful energy per year in the economic system (300 Megajoule per person per year; calculation is based on the hours worked and assumptions on the physical work delivered per hour in accordance to [20]), the energy provided by animals is about 300 Gigajoule (see Figure 3). To make it comparable on the level of communities, we express animal labour per human capita, this is 120 Megajoule per person per year. A further considerable amount of useful energy is consumed for cooking where 1200 Gigajoule are used (about 550 Megajoule per person and year). Apart from battery powered radios and petroleum lamps for lighting, there are neither fossil-fuelled nor electrically operated devices, which provide significant work for the reproduction of the local community. The total useful energy thus amounts to about 2200 Gigajoules (1000 Megajoule per person and year). To provide this useful energy, approximately 100,000 Gigajoules of primary energy per year (or 44,200 Megajoule (MJ) per person and year) must be expended (see Table 3).
Looking at the conversion efficiency indicates that humans next to stoves have the highest conversion efficiency. Despite this relatively high conversion efficiency of stoves, compared to other technologies it is very low in the Baskurit valley, since cooking can be done with three times higher conversion efficiencies [46]. Animals consume the highest amount of energy with a very limited return, thus having a very low conversion efficiency. It should be noted that human food does not only serve to allow people to work. To feed people is a value in itself. Likewise, the animals provide not only mechanical work but also food (albeit to a very low level) and cow dung (as fertilizer and fuel for cooking). In addition, the number of cattle is very important for the owner’s status, a service not reflected in the conversion efficiency since it cannot be expressed in energy terms.
4.4. An Intermediate Resume: Built-In Dynamics of the Societal Metabolism-Labour Nexus
Agrarian societies have the potential for ecological sustainability in energy terms because they consume nearly only locally available renewable resources. At the same time, these limited resources hinder them from organising material flows much beyond food provision. However, and this is well visible in the Bashkurit Valley, agrarian societies are in danger of initiating a downward spiral [47]. First, the scarcity of useful energy for food production must be overcome. Since three quarters of the necessary energy for food provision is provided by human labour, the local population hopes that more offspring will lead to a rise in the workforce, thus reducing the workload per person. Second, more people also require more food. Since the amount of food available in agrarian societies is essentially dependent on the area, which usually remains constant, this is likely to lead to soil degradation. Third, in turn, this results in reduced soil fertility, lower yields and thus reduced primary energy in terms of food. The alleged solution of the problem thus exacerbates the original energy shortage and calls into question the viability of survival, since the daily work already affects the population to its physical limits. This labour burden as well as the food insecure situation contributes to a low number of old people. Only eight % of the population in the Bashkurit Valley is older than 50 years (In Ethiopia, the life expectancy at birth in 2012 is 61 years [41]).
Looking at Bahskurit from a biophysical system perspective, reduced animal husbandry could release labour time, reduce food scarcity and mitigate environmental pressures. Currently, there is a cow for each person older than 15 years. Cattle do little work and animal products contribute very little to the human diet (less than two % of the calorie requirement). At the same time, however, cows devour 85% of the primary energy in the form of feed and demand a significant portion of the populations labour time. A reduction of the number of livestock, together with a halt to population growth, would therefore be a biophysically option to overcome food scarcity. However, the high symbolic importance of having a high number of children and the status related to a large cattle herd size counters such a change. Alternatively, an industrialization of agriculture is often supposed to solve the problem of energy shortages and soil degradation. However, this is not feasible without external resources such as financial development aid and is associated with a series of follow-up problems as known from industrial societies (see Section 6).
5. Energy in Abundance: A village in Industrialized Lower Austria
The second case is located in Austria. In contrast to Ethiopia Austria’s GDP per capita is with 24,380 US$ (in current prices for 2001, the year of study) relatively high [38]. The agricultural sector accounts for about 1.7% of national GDP [38] and 6% of employment [48]. Agriculture in Austria is characterized by small-scale farm operations and comparatively low-technical input as compared to other Central European land use systems. However, compared to Ethiopia it can be described as highly intensified with high input of fossil energy and machinery.
The case study itself takes us to a comparatively small village of about 60 people called Theyern. It is located in Lower Austria, ten kilometres from the next major city Krems (population approximately 20,000) and 15 km from the Lower Austrian state capital St. Pölten. The distance to Vienna, the capital of Austria, is around 50 km. The place itself is located within a landscape of gently rolling hills on a plateau on almost 400 m altitude. The basic structure of the village dates to a 13th century clearing island, which can still be seen on today’s aerial images (see Figure 4). In the middle of the clearing is a compact settlement structure, surrounded by fields and finally surrounded by forest. The residential area covers 76 hectares and is dominated by orchards. This case study was carried out by means of qualitative and quantitative data collection [28]. The research team consulted nearly all households, interviewed several representatives of the local council and the mayor of the municipality. All data refer to the year 2001.
5.1. Societal Stocks: People, Animals, Land and Artifacts
Of the 63 villagers at the time of the survey, around 13% are full-time farmers and 6% are part-time farmers. As their main source of income, the part-time farmers work in a beverage factory some ten kilometres from the village. A further 15% have full-time jobs as workers, in technical professions, in administration and as teachers, mainly in Krems and St. Pölten. Altogether, about a third of the inhabitants are employed. A quarter of the inhabitants are children or in training and another quarter pensioners. A little over 10% of the people are mainly concerned with household chores. This is a very typical profile for an industrialized society (the Austrian average for 2001 is 8% [49]). A historic reconstruction of the village shows that around 1830, about 100 people lived there. For them, work in agriculture started in early childhood and continued all through life. Since 1830, the population size has dropped (due mainly to outmigration), but is now stable again (the number of inhabitants in 2016 [50] was still the same as in 2001 [51], indicating a population growth of zero %). The high level of mobility and the proximity to urban centres combined with a high quality of life in the countryside lead to the return of many inhabitants after their secondary, tertiary education or further trainings.
The cattle population is modest compared to the Bashkurit Valley: two cows, three horses, 25 pigs and 161 chickens in the entire village (0.1 cattle per resident, in Bashkurit Valley this is 1 cattle per person aged 15 or older). In contrast, possessions in Theyern are difficult to grasp due to the wide range and large number of artefacts. There are 55 buildings (17,000 tonnes of material in stock), 40 cars, six motorcycles and 35 tractors/combine harvesters/trucks (all vehicles together are 86 tonnes) and 286 larger household appliances (e.g., washing machines) (eight tonnes). There are an estimated 220 tonnes per capita of stock materials in buildings (compared to 2.4 tonnes per capita in the Bashkurit Valley) and about 1.5 tonnes per capita of vehicles.
5.2. Metabolic Flows of a Rural Village in an Industrial Society
An analysis of the material flows shows that 12 tonnes of biomass per person (Table 4) are extracted from the local environment (the comparative figure for the Bashkurit Valley is 3.2 tonnes/capita), although only 12 of the 63 inhabitants are wholly or partly engaged in agriculture. The main harvest from agricultural land and forest is apples and pears (44%), maize (23%), grapes (13%) and fire wood (13%). Barley, wheat, sunflower, apricot, hay and straw account for less than two percent of the harvest.
Imports account for approximately 3.4 tonnes per person: 1.4 tonnes of biomass (food for the inhabitants’ own consumption, seeds and piglets), 1.4 tonnes per person of fossil fuels for the operation of the vehicles and to a lesser extent for heaters, and 600 kg per hectare for agricultural inputs such as fertilizers or agents for weed and pest control (in Bashkurit 35 kg per hectare). Due to accounting conventions, electricity is not considered in the material flows, but it constitutes a significant part of the energy balance (ten per cent of energy consumption).
Of the locally extracted twelve tonnes of material per person, more than eight tonnes are exported. The farms are not geared to self-sufficiency, but to the supply of the nearby urban centres. Many inns and large customers are supplied with pure high quality fruit juice from these farms. Corn is sold primarily through the close by cooperative warehouse, and the wine obtained from the grapes is marketed directly or to large customers via the farmers’ own sales channels. The four tonnes per person difference between extraction and export are partly residues from pressing fruit (mash) and partly self-supply. However, self-supply does not come from agriculture but in the form of fruits and vegetables from house gardens or extensive orchards behind the farm buildings, and as firewood from own forests, which is partly fired in modern heating systems.
5.3. Primary Energy, Societal Useful Energy and Human Labour
A high amount of human labour is performed in Theyern, but with 2.5 h per person and day this is by far not as much as in the Bashkurit Valley. In terms of time use, it is striking that different households in Theyern are characterized by very different rhythms. For example, there is a peasant couple with an agriculture-dominated and tightly organized daily routine, a family of seven with various professions, or a household with a relatively young pensioner. In addition, the high mobility is noticeable. In Theyern, around 9000 km per year are covered per person. This is roughly 10 times that of the kilometres per capita travelled in the Bashkurit valley. In view of the different travel speeds of walking (five kilometres per hour) and driving (50 km per hour), the average time required per person is about the same in Theyern and the Bashkurit valley (30 min per day and person).
In Theyern, an average of almost 2.5 h per day is spent on wage labour (in the Bashkurit Valley 5). This low number of labour hours per capita is above all since young and old people do work very little. The interviews in Theyern show that young people provide a very small labour time input to farming or other economic activities. The same applies to older persons who play workwise a minor role in agriculture but are important in the household chores. This can also be explained by the fact that in the years before the survey, many of the farms were converted from so-called mixed farms (coined by cattle, fields and extensive orchards) to specialized farms (fruit orchards) and therefore the experience of older farmers was not appropriate any longer. For example, an older farmer expressed in an interview the common norm in previous times that the good apples were selected for eating, the bad ones were sorted out to make juice. Today, however, the good apples are selected for juice making. He concluded that he does not want to join in in such practices which run counter to his inner understanding how things should be done well. Considering this withdrawal of older farmers from agricultural activities, the average 2.5 h per day can be regarded as a realistic estimate.
7 to 8% of the total primary energy is provided in the form of food (Table 5). In relation to the primary energy spent, the useful energy of human labour is negligible (due to the low numbers of hours worked and the assumption that the physical work delivered per hour is in accordance to [20] due to the used machinery much lower in industrial than in agrarian societies). The following energy flow calculations are done per inhabitant since (a) the purpose of a social system’s functioning ultimately is to reproduce a human population within a territory [26], and (b) it is necessary for a meaningful comparison of different social systems with different population sizes.
Thus, per inhabitant, the few farm animals consume a slightly larger portion of biomass than humans. Farm animals do almost no work but are mostly used to produce food, which is only to a small extent consumed locally. Most the animal products are marketed and bring income. The work of the animals is only due to the horses, which a family keeps for riding in their free time. The useful energy is here the drive force provided during the rides. Primary energy consumption for the sum of privately and agriculturally used fleet of vehicles is the largest amount of Theyern’s total primary energy consumption. Due to the low conversion efficiency, however, this contributes only about 12% to the total useful energy consumed in Theyern. The room heat is next largest area of primary energy consumption. This is a result of the considerable amount of building stock which the residents in Theyern inhabit. Compared to Bashkurit, of course, the different climatic conditions are decisive (annual average temperature of Theyern about ten degrees Celsius, Bashkurit valley about 20 degrees Celsius), but also the different comfort requirements play a role as well as the limited capacity of households to acquire more fuels (local fuel is scarce and there are no heaters at all for burning fossil fuels).
In total, about 40% of the primary energy used is from renewable energy sources (biomass and hydroelectric power) and 60% from fossil energy. While in the Bashkurit Valley, 30% of the total useful energy was still provided by humans, the share in Theyern is diminishingly small (about 0.1%). The consumption of useful energy in agriculture is much higher compared to the Bashkurit valley. Farmers can dispose of approximately 5300 Megajoule of work per inhabitant of Theyern (including persons not working in agriculture). If we divide this useful energy only amongst persons involved in agriculture, this is 20,000 Megajoule per person. In the Bashkurit Valley, this is 420 Megajoule per person including all and 530 Megajoule per person engaged in agriculture.
Conversion efficiencies are very low for human labour and even lower for animal labour. This is not surprising since humans are well nourished but in this energy regime there is little need for their physical work capacity. The same applies for farm animals, which are kept for milk, eggs and meat and therefore do not provide useful energy. Technology using biomass, hydropower and fossil fuels has far higher conversion efficiencies. Amongst them drive force has the lowest due to low efficiencies of the combustion engines and losses during the supply chain. In the case of space heating, due to reasons based in the second law of thermodynamics, all forms of energy like mechanical, electrical or chemical can be completely converted into heat. This contrasts with other energy conversions and enables the highest efficiency in practice.
The conversion efficiency for lighting benefits from the fact that it is partly based on hydropower, which has lower losses during conversion and thermal power plants which partly make use of the heat for district heating. Altogether, the total conversion efficiency in Theyern is by a factor 10 higher than in the Bashkurit valley, due to both the higher share of fossil fuels in the energy mix and modern conversion technologies.
6. Changes in the Societal Metabolism-Labour Nexus across Energy Regimes
Based on the two case studies, we have portrayed the societal metabolism-labour nexus for an agrarian and an industrial rural community. Despite the cultural differences, both cases can be regarded as illustrative for the respective energy regime.
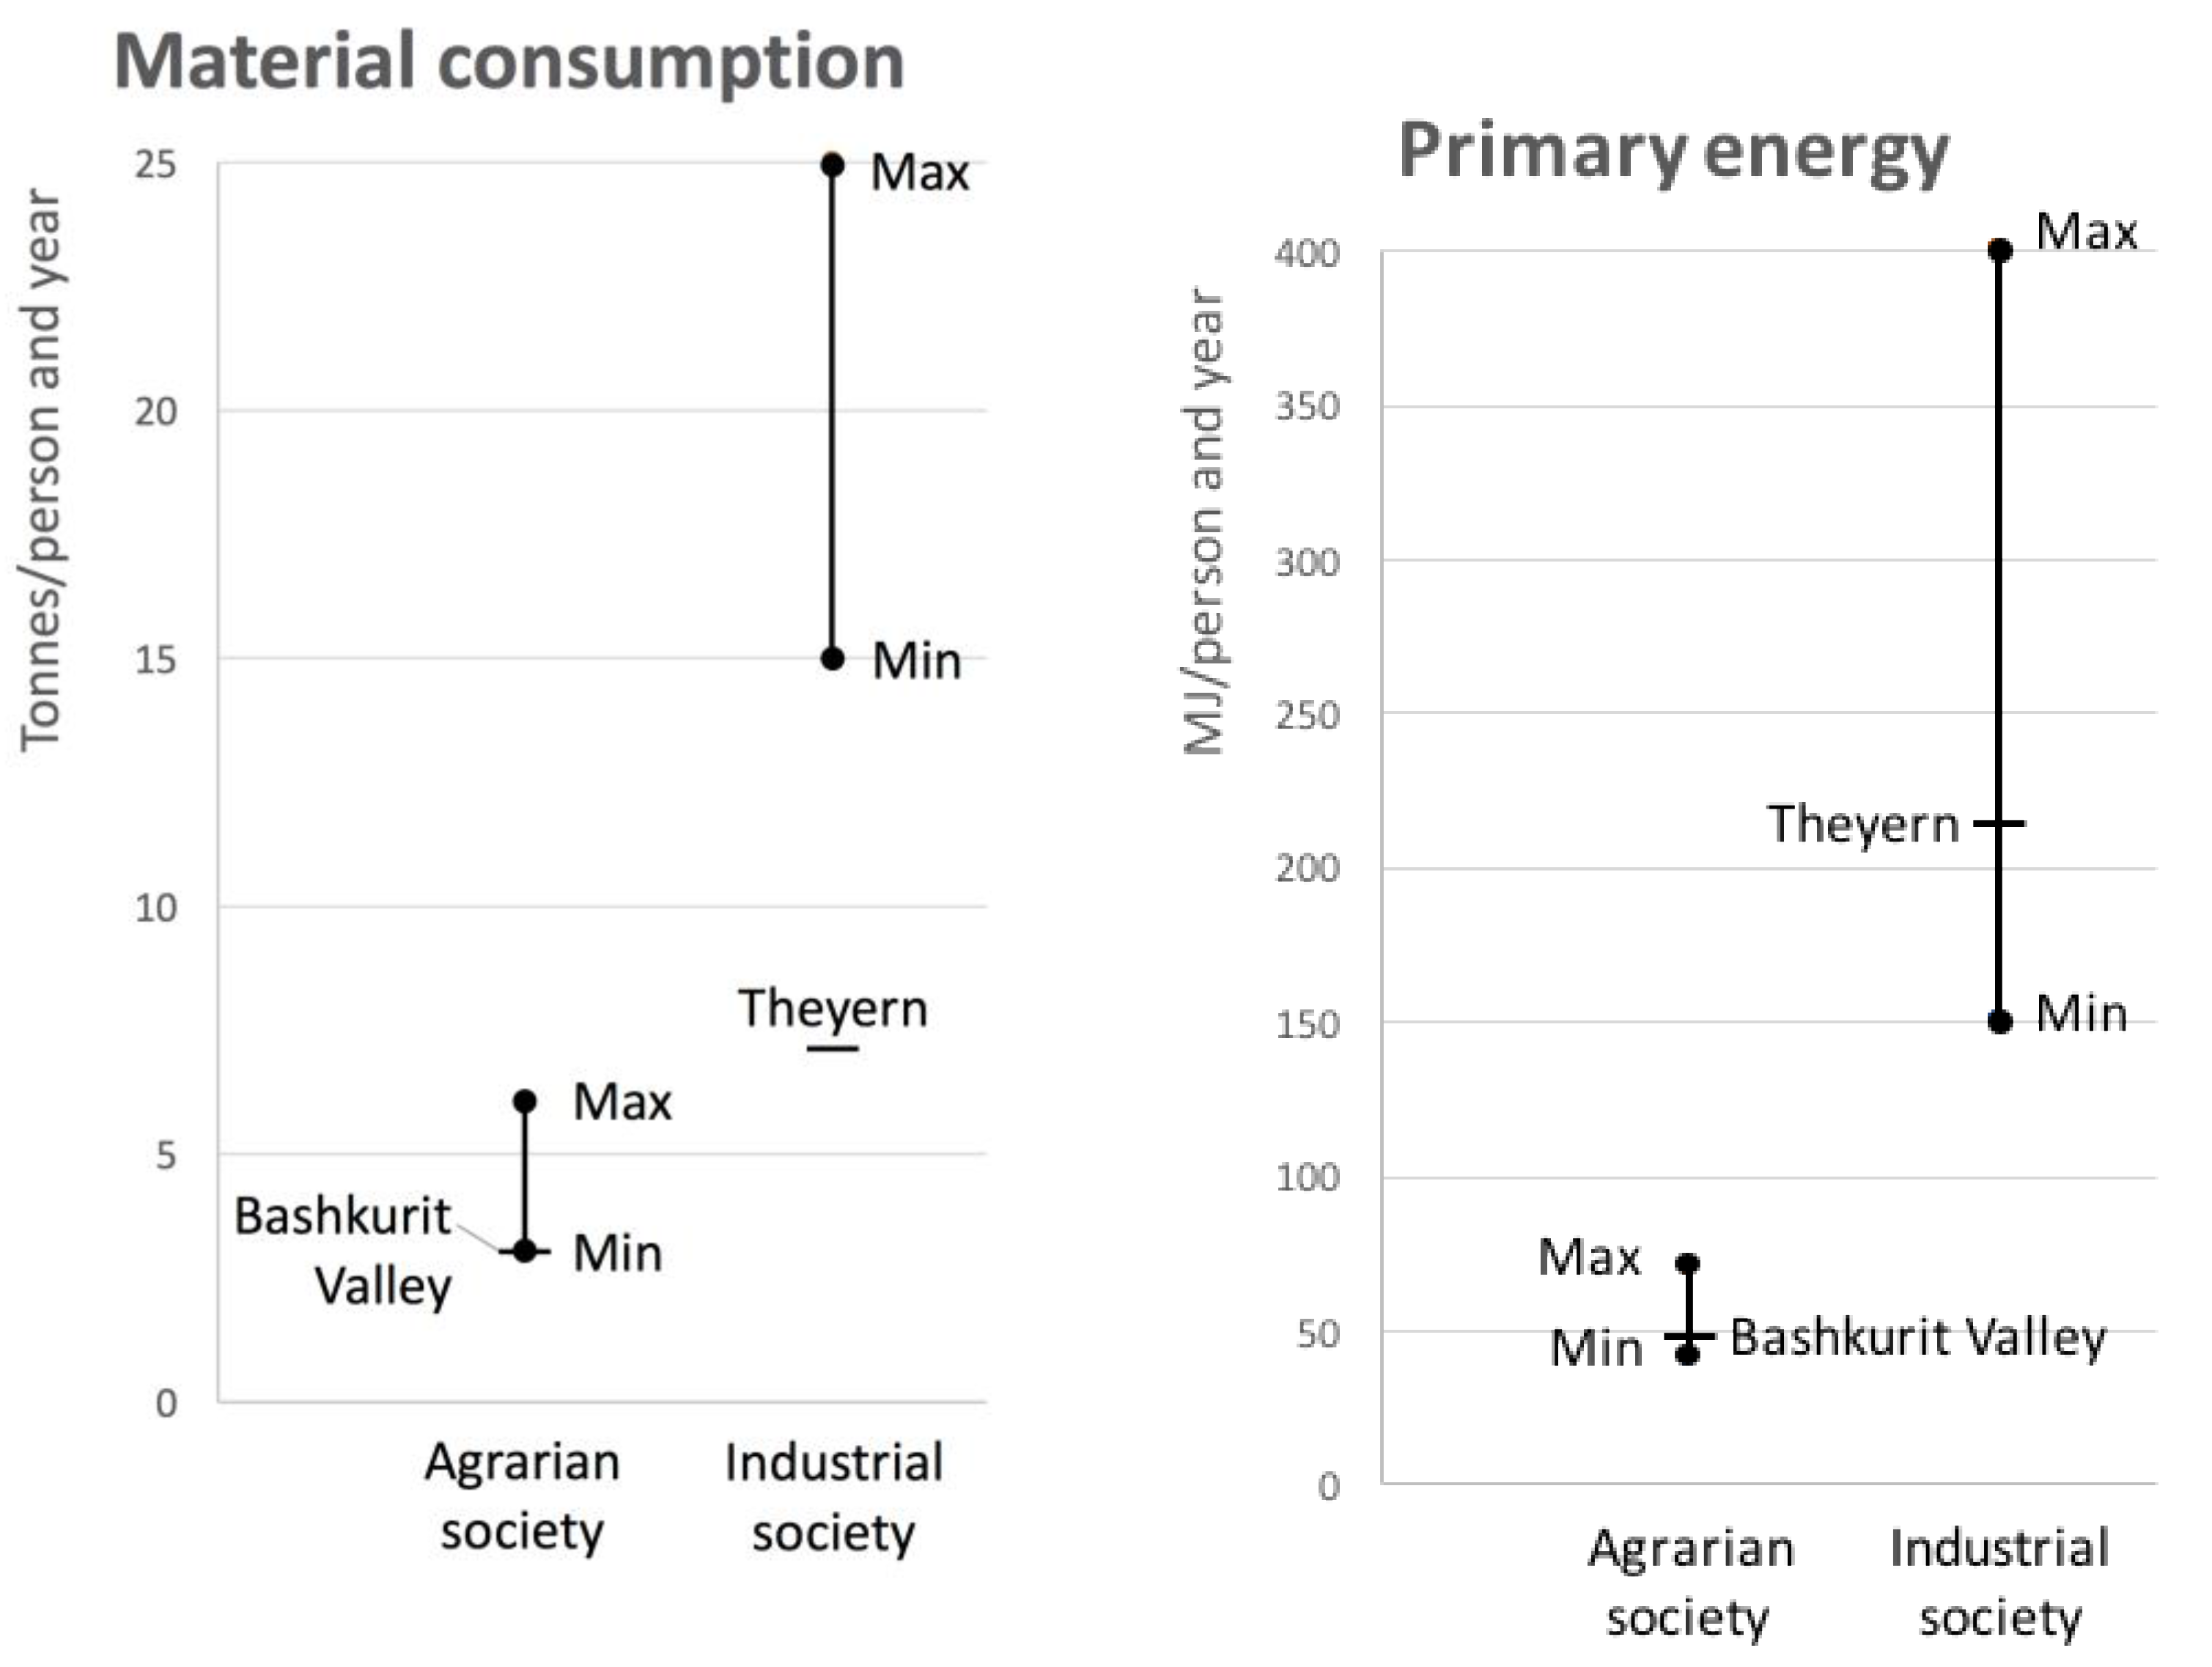
Figure 5 compares the two cases with the bandwidth of indicators for agrarian and industrial societies as presented in Haberl et al. [5]. The Bashkurit Valley is in terms of material consumption at the lower end of agrarian societies. Theyern is outside the bandwidth. For this there is a simple explanation. Material flows at the country level include flows for building and maintaining large infrastructures like dams, highways and power plants, which can’t be found in local rural cases like Theyern. So, while the domestic material consumption of mineral materials (metals and non-metallic minerals) in Theyern was 0.6 tonnes per capita and year (see Figure 6), the material consumption of mineral materials was about 15 tonnes per capita and year in Austria in 2001. About 80% of these materials is used for construction activities [52]. This difference between local rural cases and the country level is in agrarian societies less pronounced than in industrial societies due to the lower level of urbanisation [21]. In terms of primary energy both cases are within the bandwidth, albeit in the lower range of it out of the same reasons as for material consumption. Moreover, in spite of great cultural differences, the biophysical basic characteristics of the Ethiopian case also correspond to those of a historical reconstruction of the material and energy flows of the village of Theyern in Austria around 1830, i.e., at a time when Theyern can still be described as an agrarian society [28]. Thus, basic indicators like material consumption and primary energy display significant differences between the two cases in line with the differences at country level. Altogether, these comparisons show that each case can be regarded as illustrative for the energy regime it belongs to. This allows to further interpret differences regarding more detailed material and energy indicators as well as labour time as differences of the energy regime.
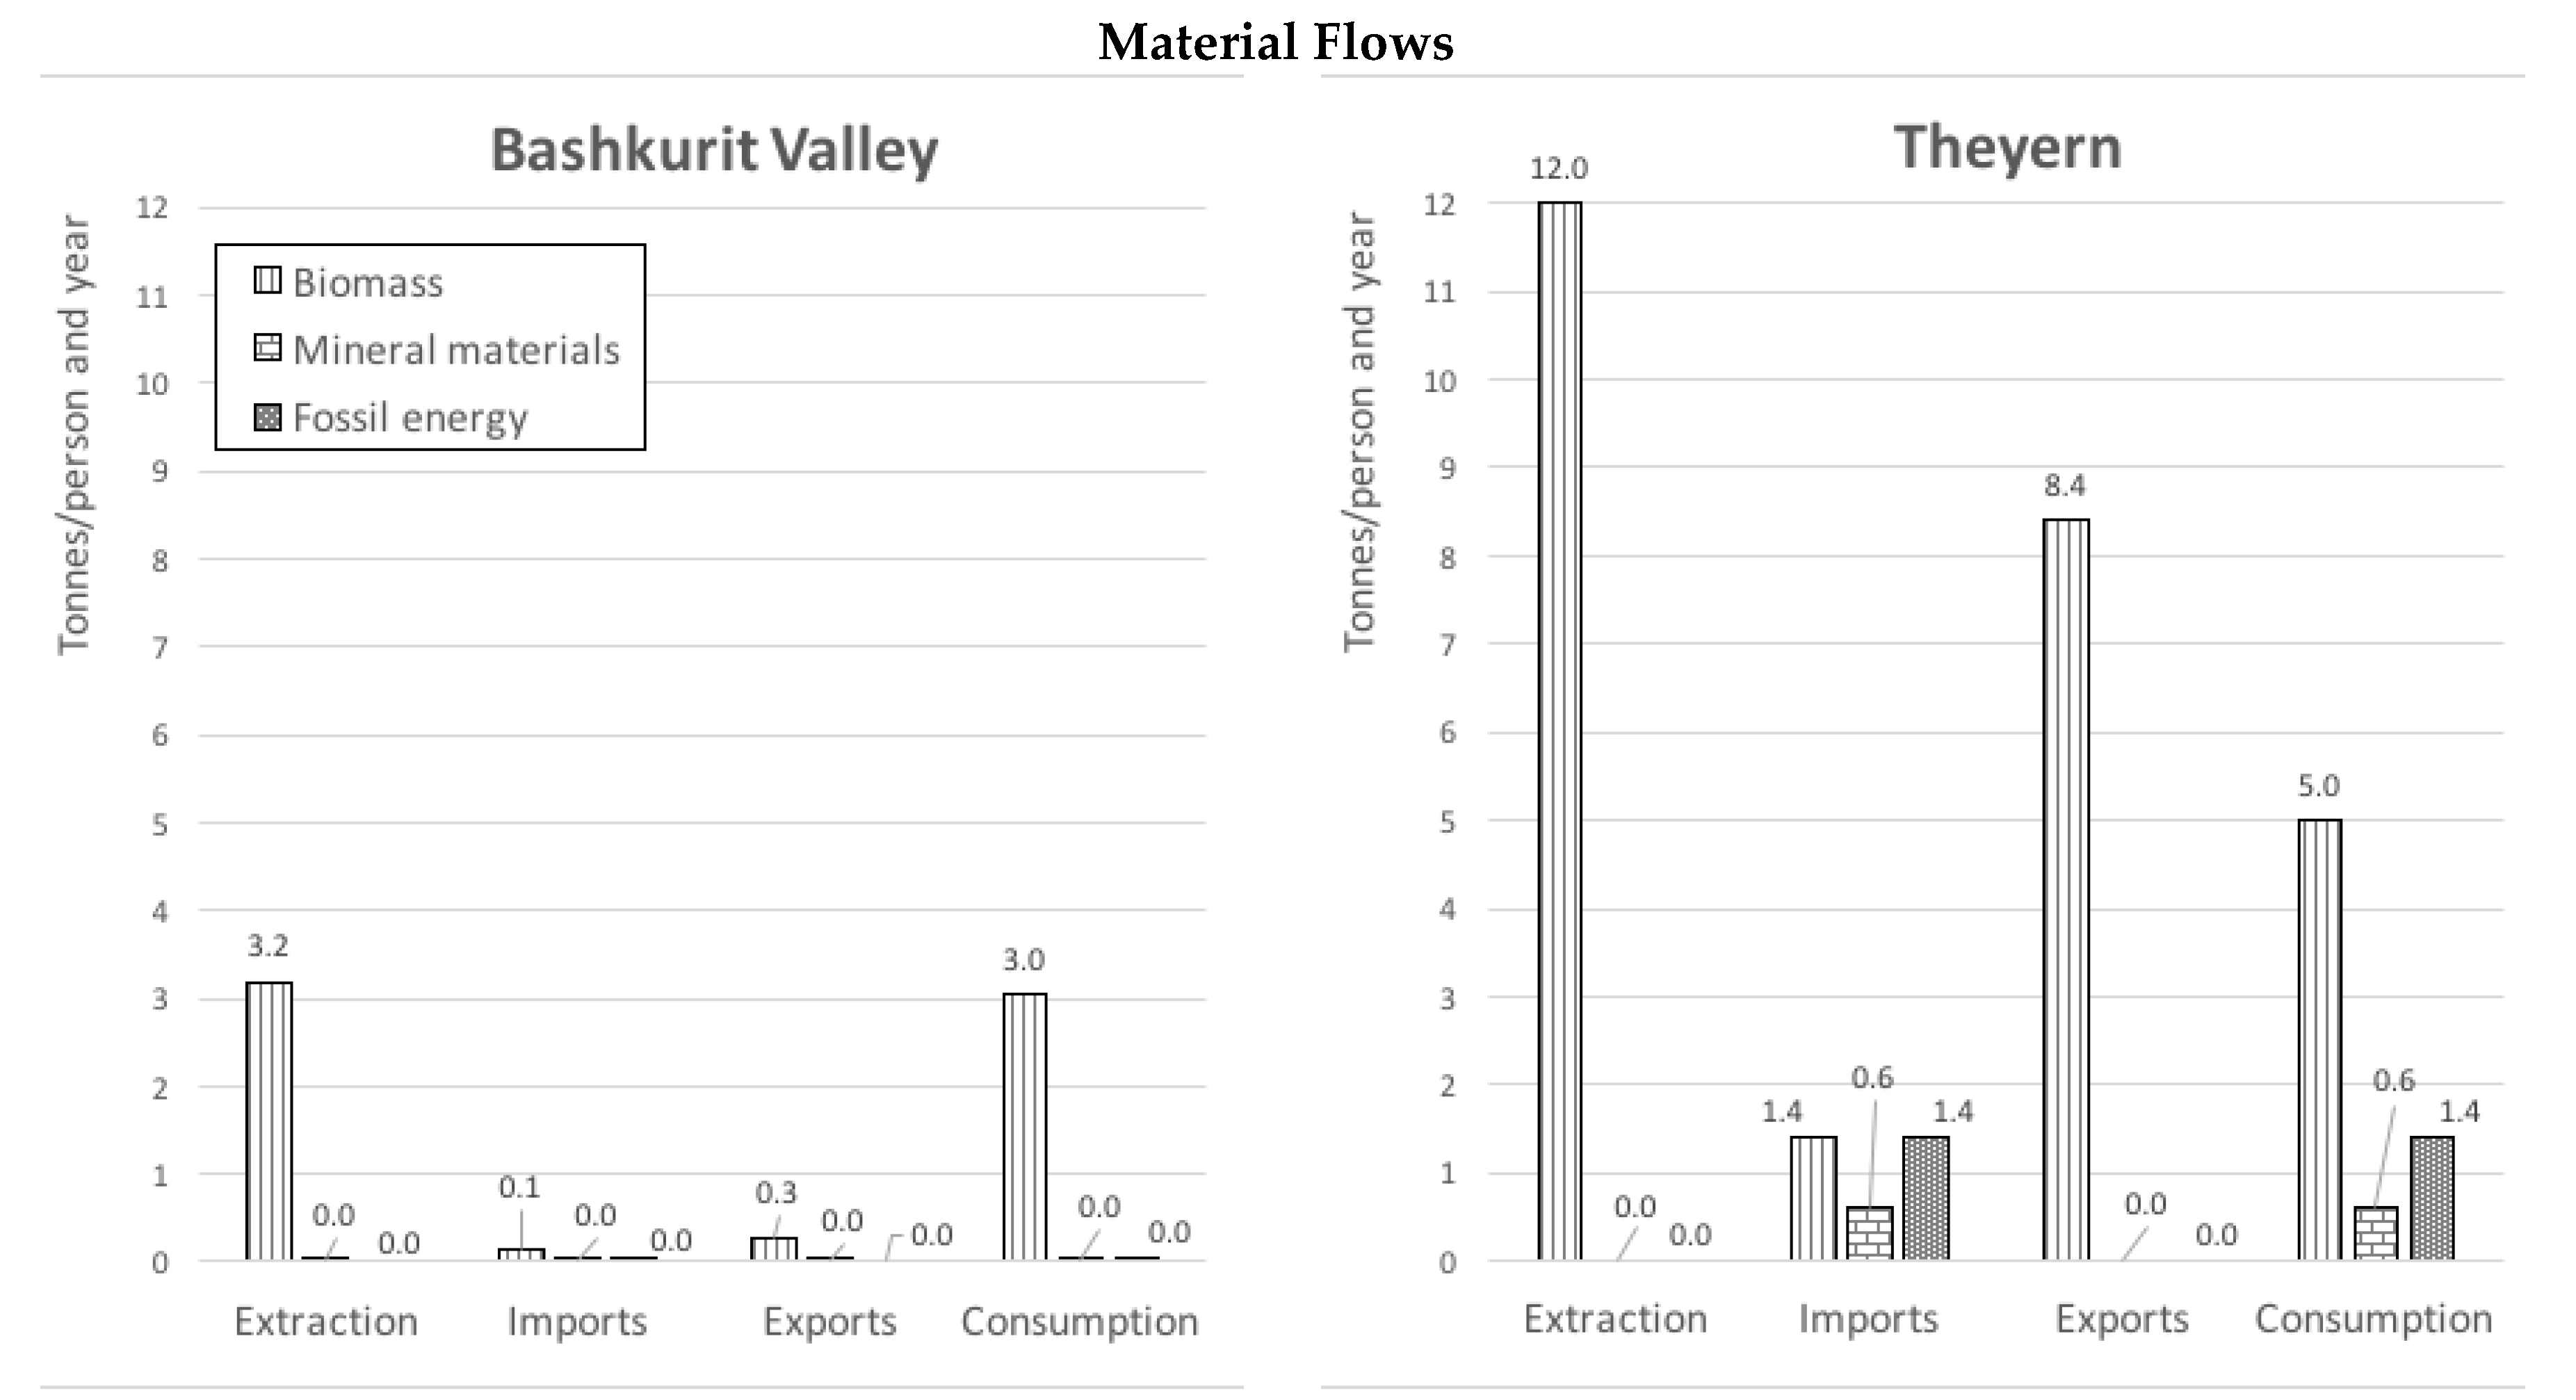
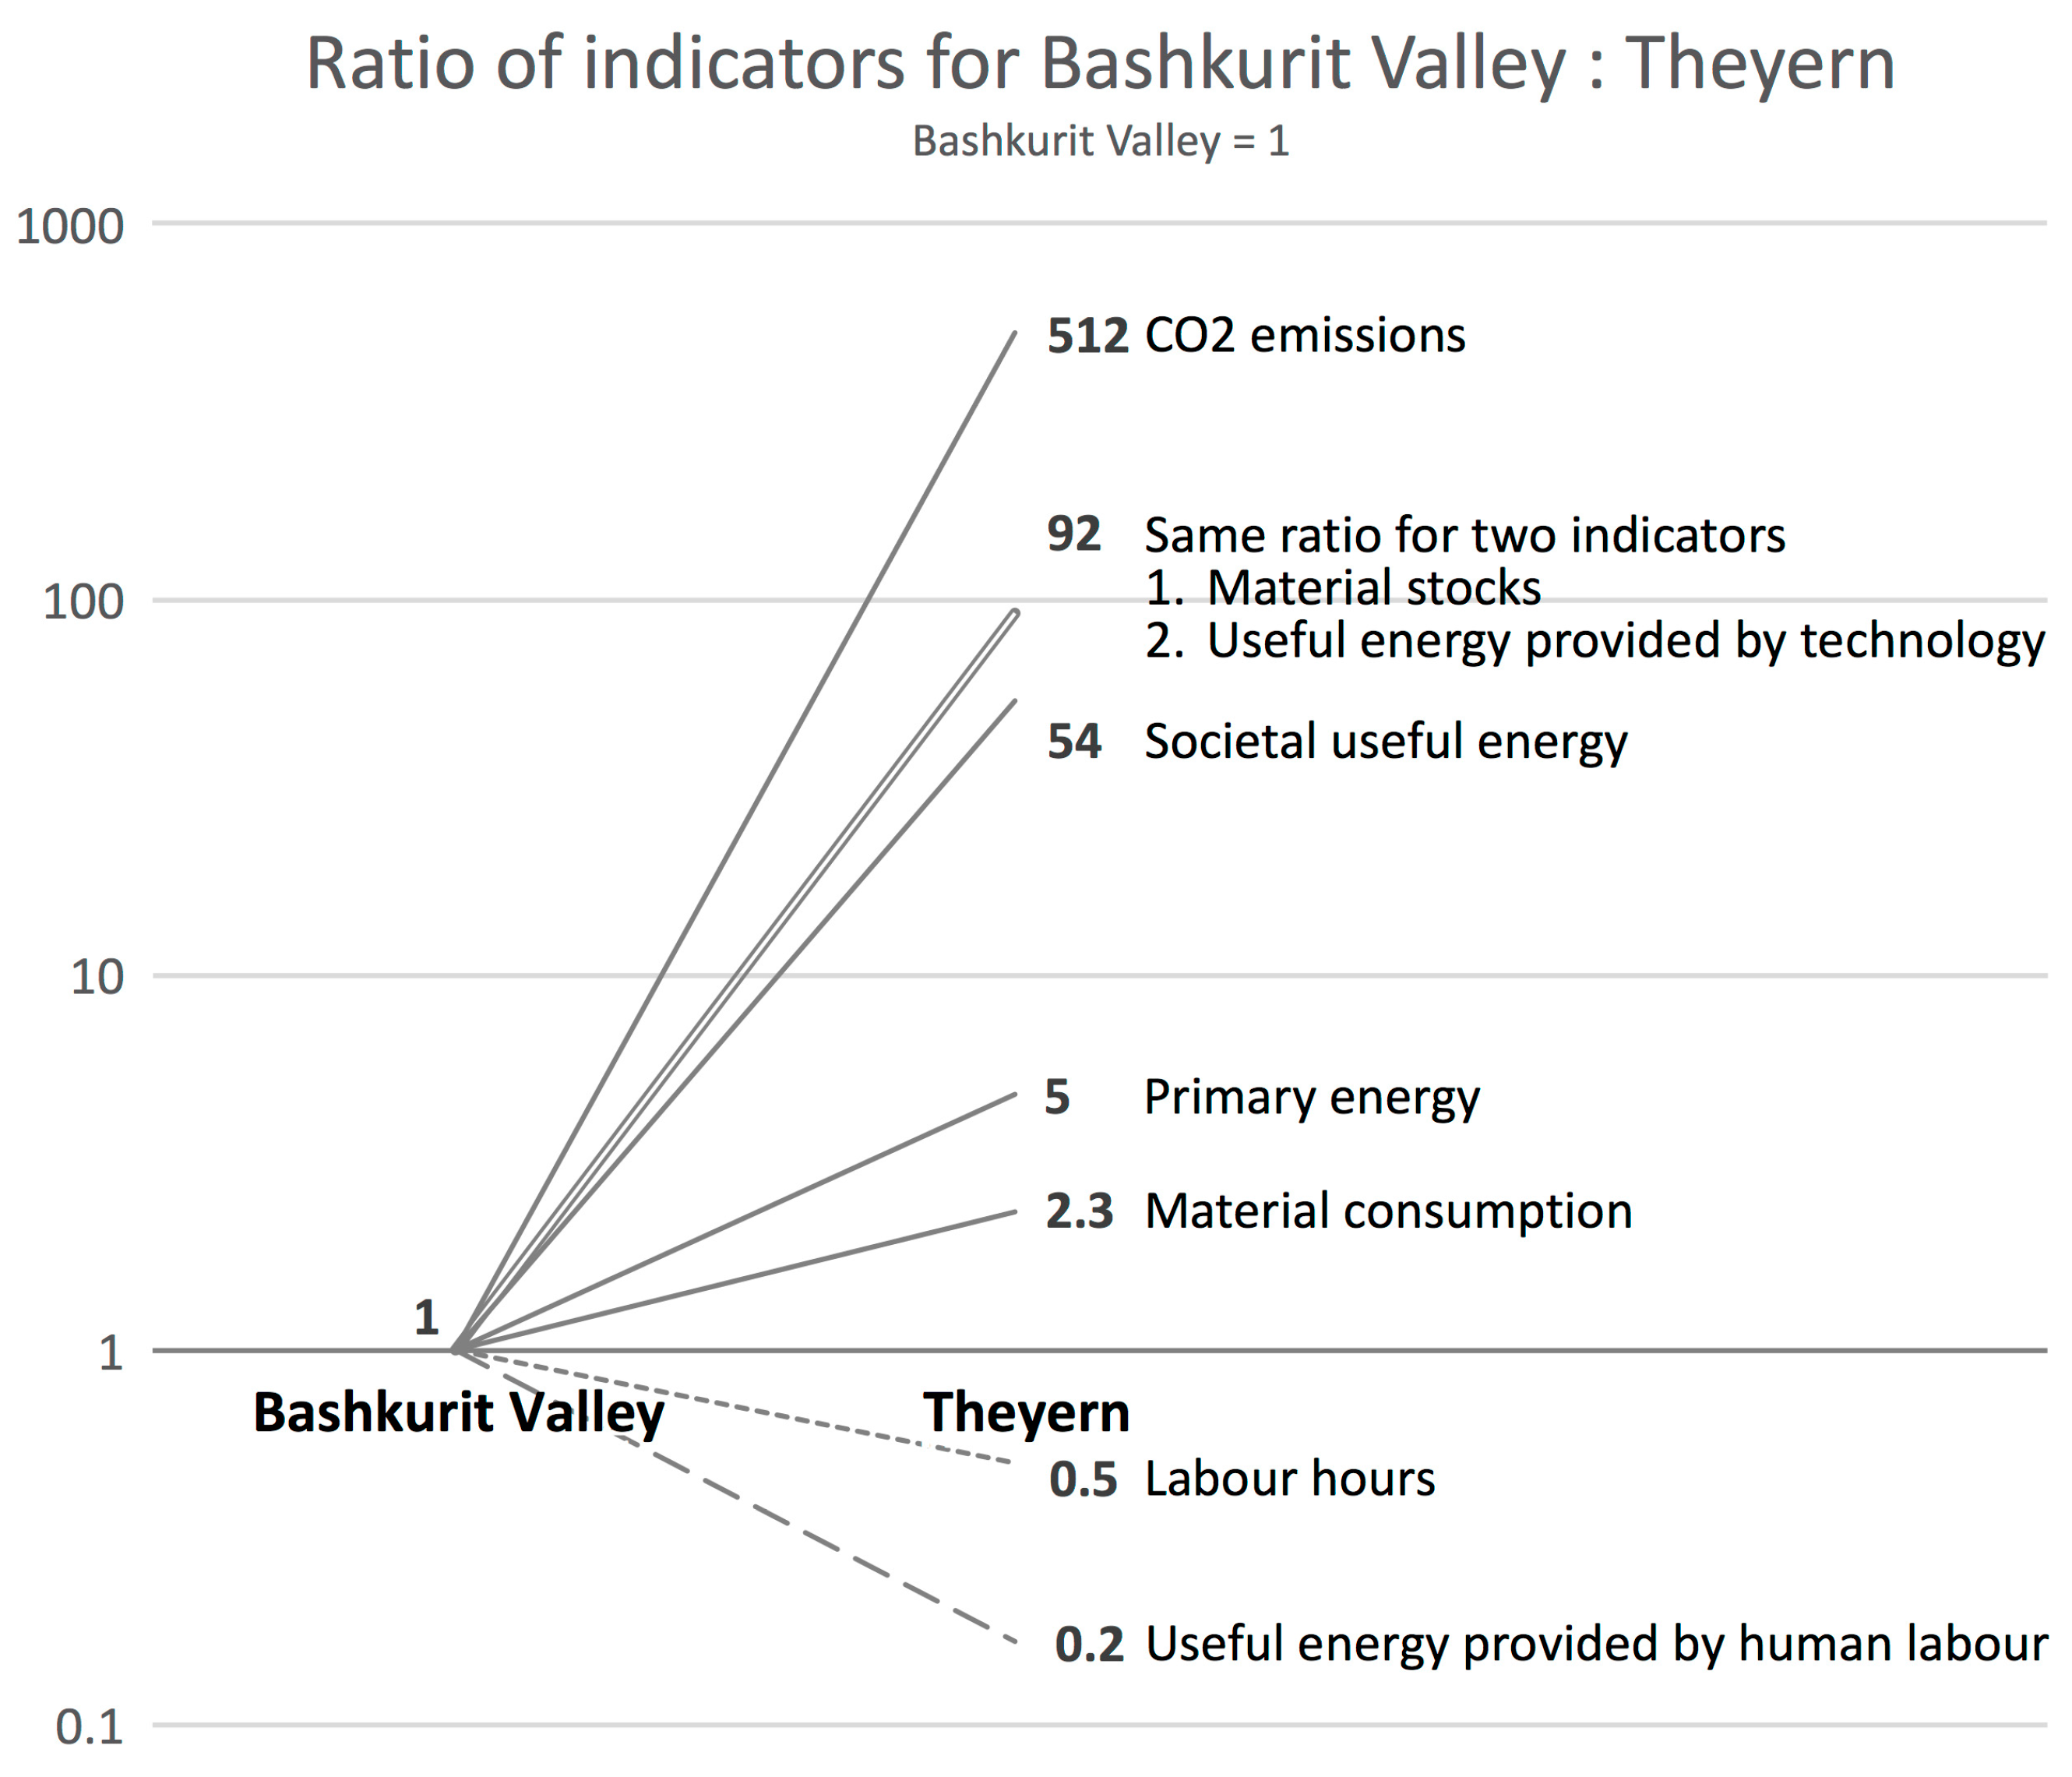
Material flows in both cases are dominated by biomass (see Figure 6). Domestic material consumption of biomass differs almost by a factor two, which is because people in Theyern are better nourished (three times higher calories per capita) and dispose partly over fuel-wood based space heating, which is missing in the Bashkurit Valley. However, other material flow indicators display even bigger differences. Biomass extraction is in Theyern four times higher than in the Bashkurit Valley. While in Bashkurit trade flows are very moderate, with exports of 0.3 tonnes of biomass per capita and year, Theyern can export 8.4 tonnes of biomass, which is the same level as the overall material consumption in Theyern. This low surplus in Bashkurit Valley shows the limited capacity of rural villages in agrarian societies to support an urban population, while Theyern’s high surplus as net exporter of biomass can contribute to sustain high population numbers not involved in agriculture (this is 94% in Austria) [48]. This is made possible by the availability of fossil fuel carriers. In tonnes, they are not so significant (1.4 tonnes per capita and year), albeit together with technologies they entail far reaching consequences for labour. This becomes visible in the energy flows of Figure 6. The primary energy is in Theyern five times higher than in the Bashkurit Valley. While the primary energy for humans and animals together is the same amount in both cases, primary energy for technology is in Theyern almost 20 times higher than in the Ethiopian case. The estimate for labour in terms of societal useful energy reveals the drastic differences of the two local systems, with Theyern disposing over 54 times more useful energy than the Bashkurit Valley. The increase in disparities from primary to useful energy between the two cases is due to the higher conversion efficiencies of fossil fuel-based technologies, which are dominant in Theyern but at low levels in Bashkurit Valley (only cooking stoves and petroleum lamps). Technologies provide in Theyern 92 times more useful energy than in the Bashkurit Valley, while useful energy provided by human labour is in Theyern a fifth (0.2) and labour hours are a half of the values in the Bashkurit Valley (see Figure 7). Thus, physical work of humans is both supported and substituted by using fossil energy powered machines in Theyern. Furthermore, since useful energy is not scarce anymore in Theyern, they could build up stocks like buildings, machinery and household artefacts 92 times heavier than in the Bashkurit Valley.
After discussing the sustainability problem of declining food returns for a growing population in the Bashkurit Valley, we want to highlight one of the critical sustainability problems related to Theyern. As part of an industrial society Theyern has increased its land use intensity by use of fertilizers and machinery powered by fossil fuels. Further, fossil fuels are used in the private consumption of households. This adds up to the consumption of 1400 kg of fossil energy carriers per person and year plus a consumption of 190,000 kWh of electricity partly generated by burning fossil fuels in caloric power plants. In the Bashkurit Valley 3 kg of petroleum was used and no electricity at all. In terms of CO2 this means 11 kg in Bashkurit Valley and 5600 kg per person and year in Theyern, which means about 500 times higher CO2 emissions in Theyern than in the Bashkurit Valley.
Summing up on the societal metabolism-labour nexus across energy regimes, in the industrial case people work less in terms of both useful energy they provide and labour hours they spend, are better nourished, dispose over far more useful energy mainly provided by fossil fuel-powered technology and can export far higher food supplies than it is possible in the agrarian case. Thus, industrial societies have a high share of the labour force freed from the need of food provisioning allowing for all different forms of labour as known today [6]. This can be assessed as massive change in the societal metabolism-labour nexus based on the abundant availability of energy as provided by fossil fuels. However, high carbon emissions of industrial societies as the ones in Theyern call for low carbon development strategies. The necessary abandoning of fossil energy carriers means withdrawing from the very same energy base that enabled todays multiplicity how human labour appears today. While the new energy transition will not mean a return to agrarian societies, it is very likely to entail drastic consequences for the societal metabolism-labour nexus and consequently for human labour. Changes promise to be as far-reaching for human labour as in past transitions from one energy regime to another. However, the topic how human labour might change during the next transition to a post fossil society is still an under-researched area with high relevance for all.
Acknowledgments
The case study on Theyern was part of the research project GEWIN that was funded within the Austrian landscape research program of the Austrian federal ministry of science and education. The case study of the Bashkurit valley was made possible by a doctoral scholarship for Hailemariam Birke Andarge (Appear grant of the Austrian Development Cooperation). The socioecological perspective on labour was developed by Marina Fischer-Kowalski together with Willi Haas during the FP7 EU project NEUJOBS. The authors thank an anonymous reviewer for valuable comments. No funds for covering the costs to publish in open access were received.
Author Contributions
Willi Haas has provided the overall framework of the article. The case study of Theyern was conducted by a research team led by him. Hailemariam Birke Andarge provided the Ethiopian case.
Conflicts of Interest
The authors declare no conflict of interest.
References
- Rockström, J.; Steffen, W.; Noone, K.; Persson, Å.; Chapin, F.S.; Lambin, E.F.; Lenton, T.M.; Scheffer, M.; Folke, C.; Schellnhuber, H.J.; et al. A safe operating space for humanity. Nature 2009, 461, 472–475. [Google Scholar] [CrossRef] [PubMed]
- Crutzen, P.J.; Stoermer, E.F. The “Anthropocene”. IGBP Newsl. 2000, 41, 17–18. [Google Scholar]
- Fischer-Kowalski, M.; Krausmann, F.; Pallua, I. A sociometabolic reading of the Anthropocene: Modes of subsistence, population size and human impact on Earth. Anthr. Rev. 2014, 1, 8–33. [Google Scholar] [CrossRef]
- Sieferle, R.P. The Subterranean Forest: Energy Systems and The Industrial Revolution; White Horse Press: Cambridge, UK, 2001. [Google Scholar]
- Haberl, H.; Fischer-Kowalski, M.; Krausmann, F.; Martinez-Alier, J.; Winiwarter, V. A socio-metabolic transition towards sustainability? Challenges for another Great Transformation. Sustain. Dev. 2011, 19, 1–14. [Google Scholar] [CrossRef]
- Fischer-Kowalski, M.; Haas, W. Exploring the transformation of human labour in relation to socio-ecological transitions. In Let’s Get to Work! The Future of Labour in Europe; Beblavy, M., Maselli, I., Veselková, M., Eds.; Centre for European Policy Studies (CEPS): Brussels, Belgium, 2014; Volume 1, p. 250. [Google Scholar]
- Fischer-Kowalski, M.; Weisz, H. The Archipelago of Social Ecology and the Island of the Vienna School. In Social Ecology: Society-Nature Relations across Time and Space; Springer: Cham, Switzerland, 2016; pp. 3–28. [Google Scholar]
- Fischer-Kowalski, M.; Weisz, H. Society as hybrid between material and symbolic realms. Adv. Hum. Ecol. 1999, 8, 215–251. [Google Scholar]
- De Molina Navarro, M.G.; Toledo, V.M. The Social Metabolism: A Socio-Ecological Theory of Historical Change; Springer: Cham, Switzerland, 2014. [Google Scholar]
- Fischer-Kowalski, M.; Haberl, H. Tons, joules, and money: Modes of production and their sustainability problems. Soc. Nat. Resour. 1997, 10, 61–85. [Google Scholar] [CrossRef]
- Matthews, E.; Amann, C.; Bringezu, S.; Hüttler, W.; Ottke, C.; Rodenburg, E.; Rogich, D.; Schandl, H.; Van, E.; Voet, D.; et al. The Weight of Nations-Material Outflows from Industrial Economies; World Resources Institute: Washington, DC, USA, 2000. [Google Scholar]
- Marx, K. Die Produktion des absoluten Mehrwerts. 5. Kap. Arbeitsprozess und Verwertungsprozess. K Marx F Engels Werke 1968, 23, 192–213. [Google Scholar]
- Haberl, H.; Zangerl-Weisz, H. Kolonisierende Eingriffe: Systematik und Wirkweise. In Gesellschaftlicher Stoffwechsel und Kolonisierung von Natur: Ein Versuch in Sozialer Ökologie; Fischer-Kowalski, M., Fischer Kowalski, M., Eds.; Overseas Publ. Association (OPA): Amsterdam, The Netherlands, 1997. [Google Scholar]
- Pimentel, D.; Acquay, H.; Biltonen, M.; Rice, P.; Silva, M.; Nelson, J.; Lipner, V.; Giordano, S.; Horowitz, A.; D’Amore, M. Environmental and Economic Costs of Pesticide Use. BioScience 1992, 42, 750–760. [Google Scholar] [CrossRef]
- Tilman, D.; Cassman, K.G.; Matson, P.A.; Naylor, R.; Polasky, S. Agricultural sustainability and intensive production practices. Nature 2002, 418, 671–677. [Google Scholar] [CrossRef] [PubMed]
- Markussen, M.; Østergård, H. Energy Analysis of the Danish Food Production System: Food-EROI and Fossil Fuel Dependency. Energies 2013, 6, 4170–4186. [Google Scholar] [CrossRef]
- Pimentel, D.; Hurd, L.E.; Bellotti, A.C.; Forster, M.J.; Oka, I.N.; Sholes, O.D.; Whitman, R.J. Food Production and the Energy Crisis. Science 1973, 182, 443–449. [Google Scholar] [CrossRef] [PubMed]
- Sieferle, R.P. Rückblick auf Die Natur: Eine Geschichte des Menschen und Seiner Umwelt; Luchterhand: München, Germany, 1997. [Google Scholar]
- Fischer-Kowalski, M.; Haberl, H. Socioecological Transitions and Global Change: Trajectories of Social Metabolism and Land Use; Edward Elgar Publishing: Cheltenham, UK, 2007. [Google Scholar]
- Haberl, H. The Energetic Metabolism of Societies: Part II: Empirical Examples. J. Ind. Ecol. 2001, 5, 71–88. [Google Scholar] [CrossRef]
- Fields, G. Urbanization and the transition from agrarian to industrial society. Berkeley Plan. J. 1999, 13, 102–128. [Google Scholar]
- Fischer-Kowalski, M.; Haas, W. Toward a Socioecological Concept of Human Labor. In Social Ecology: Society-Nature Relations across Time and Space; Haberl, H., Fischer-Kowalski, M., Krausmann, F., Winiwarter, V., Eds.; Springer: Cham, Switzerland, 2016; pp. 259–276. [Google Scholar]
- Eurostat. Economy-Wide Material Flow Accounts (EW-MFA)—Compilation Guide 2013; Eurostat: Luxembourg, 2013; p. 87. [Google Scholar]
- Krausmann, F.; Weisz, H.; Eisenmenger, N.; Schütz, H.; Haas, W.; Schaffartzik, A. Economy-Wide Material Flow Accounting Introduction and Guide; Institute of Social Ecology: Vienna, Austria, 2015. [Google Scholar]
- Fischer-Kowalski, M.; Krausmann, F.; Giljum, S.; Lutter, S.; Mayer, A.; Bringezu, S.; Moriguchi, Y.; Schütz, H.; Schandl, H.; Weisz, H. Methodology and indicators of economy-wide material flow accounting. J. Ind. Ecol. 2011, 15, 855–876. [Google Scholar] [CrossRef]
- Singh, S.J.; Ringhofer, L.; Haas, W.; Krausmann, F.; Lauk, C.; Fischer-Kowalski, M. Local Studies Manual: A Researcher’s Guide for Investigating the Social Metabolism of Rural Systems; Social Ecology Working Paper; Institute of Social Ecology: Vienna, Austria, 2010. [Google Scholar]
- Andarge, H.B. People, Energy, and Environment—A Socio-Ecological Analysis in Bashkurit Watershed, Ethiopia. Ph.D. Dissertation, Alpen Adria Universitaet, Klagenfurt, Austria, 2014. [Google Scholar]
- Haas, W.; Krausmann, F. Transition-related changes in the metabolic profile of an Austrian rural village. Work. Soc. Ecol. 2015, 153, 42. [Google Scholar]
- Zabalza Bribián, I.; Valero Capilla, A.; Aranda Usón, A. Life cycle assessment of building materials: Comparative analysis of energy and environmental impacts and evaluation of the eco-efficiency improvement potential. Build. Environ. 2011, 46, 1133–1140. [Google Scholar] [CrossRef]
- Haberl, H. The energetic metabolism of societies: Part I: Accounting concepts. J. Ind. Ecol. 2001, 5, 11–33. [Google Scholar] [CrossRef]
- Brockway, P.E.; Barrett, J.R.; Foxon, T.J.; Steinberger, J.K. Divergence of Trends in US and UK Aggregate Exergy Efficiencies 1960–2010. Environ. Sci. Technol. 2014, 48, 9874–9881. [Google Scholar] [CrossRef] [PubMed]
- Rant, Z. Exergie, ein neues Wort fur “Technische Arbeitsfaehigkeit”(Exergy, a new word for technical availability). Forsch. Auf Dem Geb. Ingenieurwesens A 1956, 22, 36–37. [Google Scholar]
- Smil, V. Agricultural energy costs: National analyses. In Energy Farm Production; Fluck, R.C., Ed.; Elsevier: Amsterdam, The Netherlands, 1992; pp. 85–100. [Google Scholar]
- Smil, V. Energy Transitions: History, Requirements, Prospects; ABC-CLIO: Santa Barbara, CA, USA, 2010. [Google Scholar]
- Hammond, G.; Stapleton, A. Exergy analysis of the United Kingdom energy system. Proc. Inst. Mech. Eng. Part J. Power Energy 2001, 215, 141–162. [Google Scholar] [CrossRef]
- Geller, H.S. Cooking in the ungra area: Fuel efficiency, energy losses, and opportunities for reducing firewood consumption. Biomass 1982, 2, 83–101. [Google Scholar] [CrossRef]
- CO2-Calculator. Available online: http://www.energyglobe.com/de_at/haus-wohnung/energiesparen-im-haushalt/online-checks-zum-thema/co2-rechner/ (accessed on 1 May 2017).
- FAOSTAT Macro Indicators. Available online: http://www.fao.org/faostat/en/#data/MK (accessed on 21 April 2017).
- Asrat, F. Ethiopia Country Report for the 2014 Ministerial Conference on Youth Employment; Federal TVET Agency, Ministry of Education: Addis Ababa, Ethiopia, 2014. [Google Scholar]
- Mayer, A.; Schaffartzik, A.; Haas, W.; Rojas-Sepulveda, A.; World Rainforest Movement; GRAIN; Brad, A.; Pichler, M.; Plank, C.; Andarge, H.B. Patterns of Global Biomass Trade—Implications for Food Sovereignty and Socio-Environmental Conflicts; EJOLT Report No. 20; ICTA, Universitat Autonoma de Barcelona: Barcelona, Spain, 2014. [Google Scholar]
- Salomon, J.A.; Wang, H.; Freeman, M.K.; Vos, T.; Flaxman, A.D.; Lopez, A.D.; Murray, C.J. Healthy life expectancy for 187 countries, 1990–2010: A systematic analysis for the Global Burden Disease Study 2010. Lancet 2013, 380, 2144–2162. [Google Scholar] [CrossRef]
- Wiedenhofer, D.; Steinberger, J.K.; Eisenmenger, N.; Haas, W. Maintenance and Expansion: Modeling Material Stocks and Flows for Residential Buildings and Transportation Networks in the EU25: Stocks and Flows in the EU25. J. Ind. Ecol. 2015, 19, 538–551. [Google Scholar] [CrossRef] [PubMed]
- FAO/WHO/UNU. Expert Consultation Human Energy Requirements 2001; Food and Agriculture Organization of the United Nations: Rome, Italy, 2011. [Google Scholar]
- Ringhofer, L.; Fischer-Kowalski, M. Method Box: Functional Time Use Analysis. In Social Ecology: Society-Nature Relations across Time and Space; Haberl, H., Fischer-Kowalski, M., Krausmann, F., Winiwarter, V., Eds.; Springer: Cham, Switzerland, 2016; pp. 519–522. [Google Scholar]
- Fischer-Kowalski, M.; Singh, S.J.; Lauk, C.; Remesch, A.; Ringhofer, L.; Grünbühel, C.M. Sociometabolic transitions in subsistence communities: Boserup revisited in four comparative case studies. Hum. Ecol. Rev. 2011, 18, 147–158. [Google Scholar]
- Utlu, Z.; Hepbasli, A. Estimating the energy and exergy utilization efficiencies for the residential–commercial sector: An application. Energy Policy 2006, 34, 1097–1105. [Google Scholar] [CrossRef]
- Boserup, E. The Conditions of Agricultural Growth. The Economics of Agrarian Change under Population Pressure; Aldine/Earthscan: Chicago, IL, USA, 1965. [Google Scholar]
- Statistik Austria Erwerbsstatistik Nach Wirtschaftssektoren. Available online: http://www.statistik.at/web_de/services/statcube/index.html (accessed on 21 April 2017).
- Statistik Austria Bevölkerung nach Lebensunterhalt und Geschlecht seit 1994. Available online: http://www.statistik.at/web_de/statistiken/menschen_und_gesellschaft/arbeitsmarkt/erwerbsstatus/index.html (accessed on 9 January 2017).
- Statistik Austria Bevölkerung am 1.1.2016 nach Ortschaften. Available online: http://www.statistik.at/wcm/idc/idcplg?IdcService=GET_PDF_FILE&RevisionSelectionMethod=LatestReleased&dDocName=103419 (accessed on 13 January 2017).
- Statistik Austria Ortsverzeichnis Niederösterreich. 2005. Available online: https://www.statistik.at/wcm/idc/idcplg?IdcService=GET_PDF_FILE&RevisionSelectionMethod=LatestReleased&dDocName=007110 (accessed on 13 January 2017).
- Eisenmenger, N.; Fridolin, K.; Milota, E.; Schaffartzik, A. Ressourcennutzung in Österreich–Bericht 2011; Bundesminist. Für Land- Forstwirtsch. Umw. Wasserwirtsch. Bundesminist. Für Wirtsch. Fam. Jugend Wien: Wien, Austria, 2011. [Google Scholar]
Figure 1.
(a) Conversion from primary energy as extracted from nature to societal useful energy at point of societal use by type of useful energy delivered and conversion efficiency as output to input ratio [20,30]; (b) Alternative view of societal useful energy by the three converters humans, animals and technology to deliver useful energy and indication of human labour as sub-category of societal useful energy (schematic sketch presents conceptual relations but no real flow proportions).

Figure 2.
The Bashkurit Valley in summer (Photo: Hailemariam B. Andarge).

Figure 3.
Ploughing as a combination of human and animal work (Photo: Hailemariam B. Andarge).

Figure 4.
Aerial photograph of Theyern (Source: Google Earth).
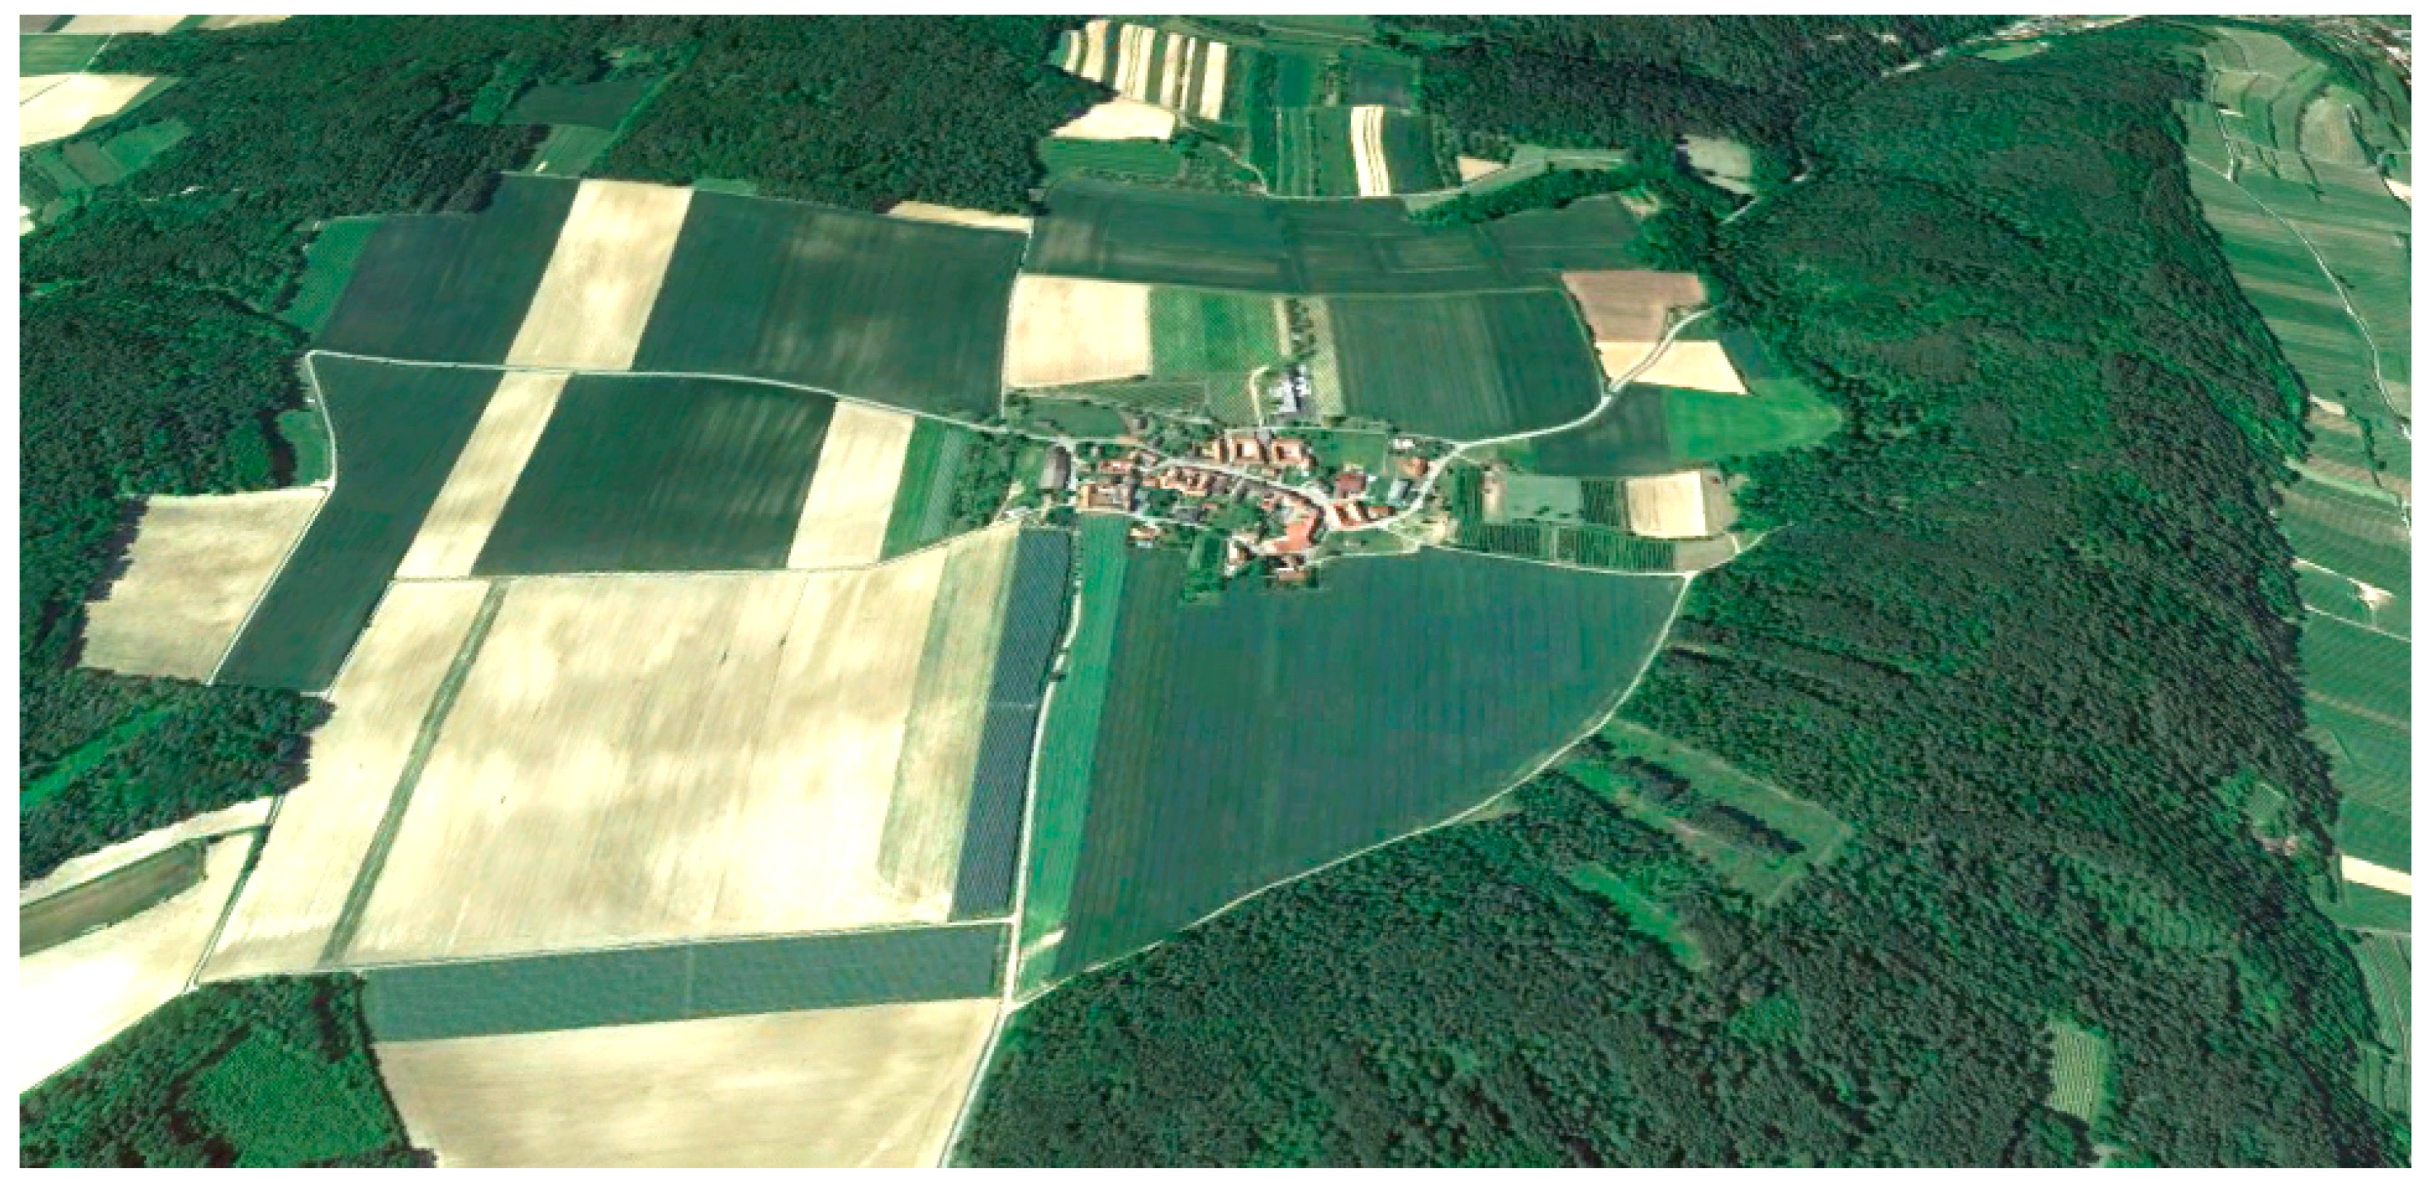
Figure 5.
Bandwidth (Min-Max) of domestic material consumption and primary energy per capita and year for agrarian and industrial societies according to literature [5] in comparison to the local rural cases Bashkurit Valley, Ethiopia and Theyern, Austria.
Figure 5.
Bandwidth (Min-Max) of domestic material consumption and primary energy per capita and year for agrarian and industrial societies according to literature [5] in comparison to the local rural cases Bashkurit Valley, Ethiopia and Theyern, Austria.

Figure 6.
Material and energy flows displayed for both cases. On top the material flows extraction, imports, exports and consumption is shown for biomass, mineral materials and fossil energy in tonnes per capita and year for the Bashkurit Valley (left) and for Theyern (right). Mineral materials include metals here as well. The two lower graphs show primary and useful energy as delivered by humans, animals and technology in MJ per capita and year for the Bashkurit Valley (left) and for Theyern (right).


Figure 7.
Ratio of indicators: Bashkurit Valley is indexed with 1 and Theyern is by a factor of x bigger or smaller. Thus, CO2 emissions are 512 times higher in Theyern than in the Bashkurit Valley.
Figure 7.
Ratio of indicators: Bashkurit Valley is indexed with 1 and Theyern is by a factor of x bigger or smaller. Thus, CO2 emissions are 512 times higher in Theyern than in the Bashkurit Valley.


Table 1.
Per capita material flows and consumption (extraction plus imports minus exports) for the Bashkurit valley in kg fresh weight in 2012 [27].
Table 1.
Per capita material flows and consumption (extraction plus imports minus exports) for the Bashkurit valley in kg fresh weight in 2012 [27].
| Category (kg per Person and Year) | Extraction | Imports | Exports | Consumption |
|---|---|---|---|---|
| Biomass | 3190 | 135 | 280 | 3045 |
| Mineral materials | 2 | 15 | 4 | 13 |
| Fossil energy carriers | 0 | 3 | 0 | 3 |
| Artefacts | 0 | 12 | 0 | 12 |
| Total | 3192 | 165 | 284 | 3073 |
Table 2.
Daily routines in a chronological order from getting up to going to bed—Due to the low level of activity of the elderly they are not considered in this qualitative description (nevertheless their time use is included in the overall time use analysis).
Table 2.
Daily routines in a chronological order from getting up to going to bed—Due to the low level of activity of the elderly they are not considered in this qualitative description (nevertheless their time use is included in the overall time use analysis).
| Hour | Daily Activity |
|---|---|
| 5:30 | Most people get up around 5:30 a.m. Women often rise earlier than men. After completing their personal hygiene (PS), women walk to fetch water (HS), visit the nearby church to pray (CS), prepare breakfast, take care of children, grind grains using stones, and do other domestic chores (HS). Girls help the women (HS), visit a nearby church to say their prayers (CS), clean the cattle pen, prepare dung cake, scare away wild animals from fields or travel to the market to sell firewood and dung cake (ES). Men feed cattle, maintain farm tools (ES), or look after children (HS). The boys fetch water, mind the younger children (HS), protect crops from wild animals, travel to the market and feed the cattle at home (ES). These activities usually extend to breakfast time. |
| 7:30 | Except on fasting days, breakfast is taken from 7:30 to 8.00 a.m. After breakfast, women milk cows, clean cattle pen, prepare dung cakes, herd the cattle, walk to the market, work in farm fields, perform wage work or handcraft (ES), participate in public meetings, engage in communal works (CS), and prepare lunch (HS). Men work in the fields, herd cattle, undertake wage work or handcrafting, go to the market (ES), and participate in public meetings and communal works (CS). School is open in two shifts, one in the morning and the other in the afternoon. Some children attend school after breakfast (PS), while others work with parents (ES). |
| 12:30 | Lunch is usually taken from 12:30 to 1:30 p.m. |
| 1:30 | After lunch, the women engage in herding, work in the fields, milk cows, perform handicraft (ES), collect firewood, fetch water, go to grinding mills, care for children, prepare dinner, and other domestic chores (HS), visit relatives and attend festivals (CS). Men work in the fields, go to the market, herd, undertake maintenance work, perform wage work (ES), do communal work, attend public meetings, visit relatives, attend festivals (CS) and have an infrequent leisure hour (PS). The time after lunch is school time (PS) for some children, while others mind the younger children, go to a grinding mill, collect firewood, perform domestic chores (HS), work in the fields, herd cattle, go to the market (ES), and perform communal work, visit relatives, play games, and sometimes attend festivities (CS). |
| 6:00 | Most people return from outdoor work around 6:00 p.m. Darkness sets in, lamps are lit. Women prepare dinner, milk cows, and breastfeed children (HS), while the girls study (PS) and some of them help their mothers (HS). Men carry out maintenance work (ES), while boys study (PS) and feed cattle in the compound (ES). |
| 8:00 | Dinner time is usually from 8:00 to 9:00 p.m. (earlier for younger children). After that, married couples may take a rest and discuss the day (PS) and prepare for the next day (HS, ES). Women grind grains using stone grinds, care for children (HS) and make baskets (ES). Some children study, while others take a rest and have a conversation (PS). With these activities, people usually conclude their day. |
| 10:00 | People go to sleep between 10:00 and 11:30 p.m. |
Table 3.
Per capita primary energy (including imports and exclusive exports) and useful energy for the Bashkurit Valley in kg fresh weight in 2012 [27].
Table 3.
Per capita primary energy (including imports and exclusive exports) and useful energy for the Bashkurit Valley in kg fresh weight in 2012 [27].
| Primary Energy (MJ Per Person and Year) | Useful Energy (MJ Per Person and Year) | Conversion Efficiency | ||
|---|---|---|---|---|
| Food | 5000 | Human labour | 300 | 0.0600 |
| Fodder | 30,000 | Animal labour | 120 | 0.0040 |
| Fire wood and cow dung | 9000 | Heat for cooking 1 | 550 | 0.0610 |
| Petroleum | 200 | Lighting | 30 | 0.1500 |
| Total | 44,200 | 1000 | 0.0220 |
1 In contrast to the numbers shown in the source, a change was made here. Instead of using 25% of the primary energy contained in the firewood as useful energy for cooking, 6% were assumed based on [36].
Table 4.
Per capita material flows and consumption (import plus imports minus exports) in 2001 [28].
Table 4.
Per capita material flows and consumption (import plus imports minus exports) in 2001 [28].
| Category (kg Per Person and Year) | Extraction | Imports | Exports | Consumption |
|---|---|---|---|---|
| Biomass | 12,000 | 1400 | 8400 | 5000 |
| Mineral materials | 0 | 600 | 0 | 600 |
| Fossil energy carriers | 0 | 1400 | 0 | 1400 |
| Total | 12,000 | 3400 | 8400 | 7000 |
Table 5.
Per capita primary energy (including imports and exclusive exports) and useful energy for Theyern in MJ per person and year in 2001 (Source: [28,30], own assumptions).
| Primary Energy (MJ Per Person and Year) | Useful Energy (MJ Per Person and Year) | Conversion Efficiency | ||
|---|---|---|---|---|
| Food | 15,000 | Human labour | 50 | 0.0030 |
| Fodder | 20,000 | Animal labour | 5 | 0.0003 |
| Fuel for tractors and trucks | 55,000 | Driving power agriculture | 5300 | 0.0960 |
| Fuel for cars and motor bikes | 30,000 | Driving power private use | 2800 | 0.0930 |
| Energy for cooking | 8000 | Heat for cooking | 2400 | 0.3000 |
| Oil (30%) + Biomass (70%) for space heating | 64,000 | Space heating | 37,000 | 0.5780 |
| Hydro power & Fossil energy carriers (Austrian mix) | 20,000 | Lighting, appliances, electronic devices | 6000 | 0.3000 |
| Total | 212,000 | 53,555 | 0.2520 |
© 2017 by the authors. Licensee MDPI, Basel, Switzerland. This article is an open access article distributed under the terms and conditions of the Creative Commons Attribution (CC BY) license (http://creativecommons.org/licenses/by/4.0/).
Share and Cite
MDPI and ACS Style
Haas, W.; Andarge, H.B. More Energy and Less Work, but New Crises: How the Societal Metabolism-Labour Nexus Changes from Agrarian to Industrial Societies. Sustainability 2017, 9, 1041. https://doi.org/10.3390/su9071041
AMA Style
Haas W, Andarge HB. More Energy and Less Work, but New Crises: How the Societal Metabolism-Labour Nexus Changes from Agrarian to Industrial Societies. Sustainability. 2017; 9(7):1041. https://doi.org/10.3390/su9071041
Chicago/Turabian StyleHaas, Willi, and Hailemariam Birke Andarge. 2017. "More Energy and Less Work, but New Crises: How the Societal Metabolism-Labour Nexus Changes from Agrarian to Industrial Societies" Sustainability 9, no. 7: 1041. https://doi.org/10.3390/su9071041
Note that from the first issue of 2016, this journal uses article numbers instead of page numbers. See further details here.