Article

Study of Urban Energy Performance Assessment and Its Influencing Factors Based on Improved Stochastic Frontier Analysis: A Case Study of Provincial Capitals in China

School of Management, China University of Mining and Technology, Da Xue Road 1, Xuzhou 221116, China
*
Authors to whom correspondence should be addressed.
Sustainability 2017, 9(7), 1110; https://doi.org/10.3390/su9071110
Submission received: 23 May 2017 / Revised: 18 June 2017 / Accepted: 21 June 2017 / Published: 26 June 2017

Abstract

:
To improve energy-use sustainability in cities, we proposed a set of urban energy performance assessment indicators and influencing factors based on existing theory and literature. An urban energy performance assessment and influencing factor model was also constructed by the improved stochastic frontier analysis method, and panel data from provincial capitals in China from 2004 to 2013 were considered as an example to carry out an empirical study. Chosen from both endogenous and exogenous perspectives, the urban energy performance assessment indicators and influencing factors take into consideration the capital, labor, energy, urban economic output, urbanization level, population, area, urban climate, and travel selection. Because it considers both random errors and the inefficiency levels of urban productions, the urban energy performance assessment and influencing factor model could reduce the errors caused by two-stage performance assessment and factor analysis, quantify the effects of assessment indicators and influencing factors on urban energy performance, and reflect the actual performance of different cities. Empirical results show that the urban energy performance of provincial capitals in China has been increasing. Chinese provincial capitals also have great potential for energy saving. It was necessary to include energy input as an assessment indicator when evaluating urban energy performance. Population density and urban energy performance showed a negative correlation, but the urbanization rate, temperature index, and household car ownership were positively related to urban energy performance. The urban energy performance of Chinese provincial capitals gradually decreased from east to west. Based on these results, several policy suggestions on urban energy performance development are proposed.

1. Introduction

With rapid urbanization and socioeconomic development, urban energy consumption has come to account for 67% of global energy consumption [1]. As a form of investment, energy is significant for development and construction in cities. However, excessive energy consumption may lead to a series of problems such as environmental pollution, climate change [2], and energy supply security [3]. Moreover, production activities, residents’ living behaviors, socioeconomic levels, and development patterns of different cities directly affect urban energy performance. Therefore, it is necessary to assess urban energy performance and explain the reasons for performance differences, which have important practical significance for transitioning to a green city and reducing inefficient energy use [4,5].
Energy performance studies are the foundation of assessing urban energy performance, and various studies around the world have focused on energy performance, considering mainly its connotations, assessment indicators, influencing factors, and assessment methods. The basic connotation of energy performance includes two aspects: energy efficiency and energy productivity [6,7]. Productivity refers to the ratio between outputs and inputs in the process of production, whereas efficiency is the ratio between actual and optimal outputs [8,9]. An actual production process involves not only its energy input, but also other inputs and influencing factors, which should be comprehensively analyzed. For this purpose, total factor energy efficiency and total factor energy productivity are introduced. However, for specific evaluation objectives, the connotation of energy performance is different. Herrando et al. believed that energy performance was related to the gap between building energy demand and actual building energy consumption [10]. Tang et al. directly used energy intensity to represent building energy performance, where energy intensity is the ratio of the energy use to building area [11]. Johansson et al. described the roles of energy performance based on its concept and compared the energy performance of various energy-saving methods in different areas at different times by measuring energy consumption under the influence of various factors [12]. Hence, an energy performance measurement should construct a production frontier based on input-output relationships to reflect the two ratios: actual output to actual input, and actual output to optimal output. Additionally, energy performance measurement is affected by many factors. Urban energy performance can be regarded as the degree to convert inputs (including energy inputs) into optimal outputs under the influence of a variety of factors and a particular set of social regulations [13].
Energy has been conducive to the development of nations, industries, factories, and products, and therefore the content of energy performance assessment includes not only manufacturing, factory, industrial, and national energy performance [14,15], but also building energy performance [16,17] and lighting energy performance [18] at the micro level.
Energy performance assessment indicators and influencing factors vary according to the assessment objectives, but in general can be divided into three categories: input indicators, output indicators, and external influencing factors. The inputs refer to investments in the process of development and production, including asset investments, material investments, the product mix, labor inputs, energy inputs, and other investments [14,15,16,17,18]. Outputs are represented by economic outputs, including industrial outputs, industrial added values, regional outputs, and other outputs [14,15,16,17,18]. The external influencing factors contain many aspects such as region, climate, geographical location, and area [10,11,12,13,14,15,16,17,18].
The “Energy Star” program in the United States has used stochastic frontier analysis to measure the energy performance of industrial companies and reveal the energy performance gap between current enterprises and the best enterprise [13]. In addition, energy performance is reflected by the ratio of economic output to energy consumption, but must consider input indicators, output indicators, and various influencing factors in the measurement. As for micro-level assessment methods, they are determined according to the characteristics and requirements of the assessment objectives. For example, the energy performance of residential building walls should be assessed by combining thermal insulation performance, the sunlight absorption rate, and other factors that directly affect residential energy consumption [10].
Current studies of urban energy performance are mainly related to the assessment of urban energy efficiency and urban sustainable development. Li and Li [19] used data envelopment analysis to estimate the total factor energy efficiency and change trends for 210 prefecture-level cities in China from 1995 to 2006. They studied the relationships among average temperature, resource endowment, industrial structure, technological level, policy, and energy efficiency using the Tobit model, in which the effect of each factor on energy efficiency under different conditions was also varying. Caputo et al. [20] indicated that energy efficiency solutions were closely related to other sustainability solutions for air quality, local microclimate, the quality of the public realm, and others. Xie and Mo [21] found that the energy efficiency of Chinese prefecture-level cities was invariant with scale and investigated the effects of spatial correlation on area distribution of urban energy efficiency. Li et al. [22] identified an urban energy efficiency hierarchy and analyzed its level transitions using a multi-level frontier DEA technique and considering data for 49 environmentally protected cities in China as an example. They also constructed a set of four ordered probit models and indicated that a number of factors such as energy technology, energy integration, environmental elements, water resources, and population could affect this hierarchy. Kilkis [23] used the SDEWES system to evaluate sustainable development using thirty-five indicators in seven aspects from a more comprehensive perspective. Yang et al. [24] proposed a linear dimensionless coordinate system to evaluate the urban sustainable development levels of 287 cities in the eastern, central, and western parts of China; the level of sustainable development in eastern cities was higher than that of central and western cities. Ding et al. [25] used the TOPSIS-Entropy method to perform a quantitative assessment of the sustainable development of Chinese cities at the prefecture level and analyzed their spatial distribution based on an index system incorporating social, economic, and environmental factors. Liang et al. [26] used principal components analysis to extract the main influencing components of sustainable urban development and proposed a method to evaluate it based on the Grey TOPSIS methodology. It is clear that the evaluation of urban sustainable development is a comprehensive evaluation of the economic, social, environmental, cultural, and other aspects of cities.
The general situation and differences of urban energy performance in Chinese provincial capitals should be determined because Chinese provincial capitals are typical representatives of Chinese cities. At present, these studies related to energy performance in Chinese provincial capitals mainly reflect the aspects described below. Chen and Xu [27] studied relationships between air pollution and economic growth in Chinese provincial capitals and divided these relationships into six main types. Based on the hypothesis of an environmental Kuznets curve, they concluded that the relations between the three main kinds of pollutants in cities and urban economic growth were relatively weak. The relationships between the three main kinds of pollutants and industry showed an inverted U shape, whereas the relationships between the three main kinds of pollutants and tertiary industry showed a U shape. In addition, some researchers had analyzed the annual and daily variation of gases and particulate pollutants [28,29]. Fang et al. [30] pointed out that carbon dioxide emission levels were positively correlated with urban regional growth and that carbon dioxide emission levels were also associated with urban continuity and urban shape. Combining with the major function zoning strategy of cities, Du et al. [31] studied the competitiveness of Chinese provincial capitals from the four aspects of economics, social culture, environment, and geography. Fan and Qi [32] combined economic, environmental, and social equity indices to measure sustainable development in major cities in China. This study emphasized the sustainable development tendencies of Chinese cities and their driving factors.
From the analyses just described, the following conclusions can be drawn. First, energy performance assessment has been widely implemented in countries, enterprises, products, buildings, and home appliances. However, studies of urban energy performance assessment are relatively few. Second, the energy performance assessment indicators and influencing factors used varied with different assessment objectives. Therefore, the selection of urban energy performance assessment indicators and influencing factors should be based on urban characteristics and assessment requirements. Third, assessment and factor analysis of urban energy efficiency are typically carried out by different methods separately, which increases calculation errors and ignores the impacts of random factors. Urban sustainable development assessment focuses on multiple aspects of cities. Because energy is an important input and a basic part of urban sustainable development, exploring its performance is essential to analyzing urban sustainable development. Fourth, Chinese provincial capitals can reflect the energy performance of Chinese cities at all levels, but few studies exist on energy performance assessment of provincial capitals. Studies related to Chinese provincial capitals often focus on urban air pollution, urban climate change, and urban sustainable development.
Therefore, the innovations of this research are the following: first, the research field of energy performance has been extended to cities. Urban energy performance assessment not only considers urban energy efficiency, but also takes into account urban energy productivity, providing references for urban sustainable development assessment. Second, urban energy performance assessment indicators and influencing factors, once selected based on theory and literature analysis, could be used to construct a performance assessment system and to analyze the effects of various factors on energy performance. Chosen from an endogenous perspective, assessment indicators were used to measure urban energy performance. Concluded from an exogenous perspective, influencing factors were used to explain the reasons for performance differences. Third, an urban energy performance assessment and influencing factor model was constructed by the improved stochastic frontier analysis method. This model quantified the relations between actual outputs and inputs as well as between actual and optimal outputs with the help of a production frontier, comprehensively considered the impacts of random errors and the inefficiency levels of urban productions on energy performance, and incorporated performance assessment and factor analysis into a system that could effectively reflect the energy performance levels of cities, make assessment results more accurate and objective, and reduce the errors caused by two-stage study. Fourth, based on panel data for Chinese provincial capitals from 2004 to 2013, empirical research could periodically update the various levels of urban energy performance and help to propose corresponding policy recommendations to improve urban energy performance.

2. Methods and Data

2.1. System of Urban Energy Performance Assessment Indicators and Influencing Factors

Production function was used to investigate the relationship between inputs and outputs. Because it introduces various elements and extends the evaluation scope from enterprises and departments to countries and regions, production function has become an important economic model for studying development and production. Hence, production function was used in this study to examine the relationship between each city’s inputs and outputs. With economic and social development, material investments are becoming more and more abundant, and therefore the classic production function should be combined with energy inputs.
IPAT (impact, population, affluence, and technology) [33] theory is an environmental impact factor theory proposed by Ehrlich and Commoner in the 1970s based on classical Malthusian theory. The environment is closely related to energy use, and therefore the theory also provides a reference for studying urban energy performance influencing factors, but the factors influencing urban energy performance are not limited to the elements in this theory. The production function and IPAT theory provide a substantial theoretical basis for selecting urban energy assessment indicators and influencing factors.
Cities, countries, and industries belong to the macro level, and therefore the selection of urban energy performance assessment indicators and influencing factors must also address the energy performance assessment indicators and influencing factors of countries and industries. Moreover, urban energy efficiency assessment indicators and influencing factors, as well as urban sustainable development assessment indicators, help to build a system of indicators and influencing factors for urban energy performance assessment. The results of a literature analysis addressing these assessment indicators and influencing factors are given in Table 1.
From the analysis in Table 1, it is clear that the energy performance assessment indicators of countries and industries focus mainly on four aspects (capital, labor, energy consumption, and economic output) and that their influencing factors include production capacity, region, climate, cooling and heating demand, and the production environment. Through comprehensive analysis of urban energy efficiency assessment indicators and influencing factors, it can be concluded that these indicators and factors are mainly related to area, population, temperature, heating demand, employment, household travel selection, urbanization, fiscal expenditure, and technology development. In addition, urban sustainable development assessment indicators have been extended to include resource utilization, climate change, environmental quality, and industrial and social development.
Based on the connotation of urban energy performance and the theoretical and literature analysis summarized above, urban energy performance assessment indicators should be used to analyze the relations between inputs and outputs from the endogenous perspective, whereas the influencing factors should be determined from the exogenous perspective to explain performance differences. Therefore, this study has regarded cities as the main production objects, taken capital, labor, and energy as the input indicators after introducing energy input into the elements of the basic production function, considered urban economic output as the output indicator, and determined the influencing factors including urbanization level, population, area, urban climate, and travel selection. In Figure 1, the peripheral annular region represents the exogenous variables of urban energy performance, which are the influencing factors; the internal circular region represents the endogenous variables of urban energy performance, which are the assessment indicators.
On this basis, considering the characteristics and availability of urban statistical data, total fixed asset investment, the number of urban employees, and urban energy consumption were chosen as input indicators, and gross regional product was chosen as the output indicator. In addition, urbanization rate, population density, temperature index (the temperature index is calculated by using cooling degree days in American energy performance indicators), and household car ownership per one hundred urban resident households were selected as the influencing factors. The specific contents of the model are shown in Table 2.

2.2. Urban Energy Performance Assessment and Influencing Factor Model Based on Stochastic Frontier Analysis

Stochastic frontier analysis reflects performance levels by the gap between actual production and the production frontier. An optimal production frontier could provide a standard to compare urban energy performance [36]. Neoclassical production theory is the foundation of explaining the stochastic frontier analysis model. In economics, the textbook definition of production function refers to the maximum output that can be obtained from the given input x. However, many assessment objects may not reach the production frontier of the maximum output in a realistic situation. Because stochastic shocks can also affect production function, the stochastic frontier analysis model can be set as Equation (1):
Y i = x i α + V i U i , i = 1 , 2 , N
where   Y i indicates the production of the i-th assessment object, x i represents the inputs of the i-th assessment object, α represents parameters to be estimated,   V i is a random error variable caused by measurements and various uncontrollable random factors, U i is an non-negative random variable that is supposed to account for inefficiency, and   V i and U i are dependent on each other. This model was first proposed by Aigner, Lovell, and Schmidt (1977) [37].
This initial model framework was gradually applied to a large number of empirical studies. Moreover, it was optimized in various ways. These ways included not only the distributional estimation of inefficiency item, such as the truncated normal distributions or two-parameter gamma distributions, but also the consideration of time-varying efficiency and panel data. Battese and Coelli (1992) [38] proposed a time-varying stochastic frontier analysis model for panel data. Then, they also extended this model in 1995 [39]. The improved stochastic frontier analysis model could not only estimate the efficiency level for each assessment object, but also analyze the influences of factors on the efficiency level [37]. According to the connotations of urban energy performance, this paper used the improved stochastic frontier analysis method to build an urban energy performance assessment and influencing factor model [40,41].
The model can be described as follows:
y i t = f ( x i t , α ) exp ( v i t u i t )
where f ( x i t , α ) indicates the production frontier, y indicates the output, x indicates the inputs, α represents the parameters to be estimated, i and t represent city and time, respectively, i = 1, 2, …, N, and t = 1, 2, ···, T. v i t and u i t are independent of each other.   v i t is a random error variable caused by measurements and various uncontrollable random factors and obeys v i t ~ N ( 0 , σ v 2 ) , a normal distribution. u i t is a non-negative variable, and represents the inefficiency of urban production.   u i t is obtained by truncation at zero of the N ( z b i t θ b , σ u 2 ) distribution. According to Equation (2), it can be concluded that: if the u of a city in a certain time equals 0, this city is in the production frontier. The energy performance of this city is set as P i t ^ . Thus, the calculation formula of urban energy performance is:
E P = P i t / P i t ^   = E [ f ( x i t , α )   e x p ( v i t u i t ) ] / ( E [ f ( x i t , α )   e x p ( v i t   ) u i t = 0 ] ) = e x p ( u i t )
where EP represents urban energy performance. In order to facilitate calculation, the logarithm of both sides in Equation (2) is available. Therefore, Equation (2) can be rewritten as Equation (4):
ln y i t = ln f ( x i t , α ) + v i t u i t
The inefficiency item, the u i t , is set as a function of various variables affecting urban energy performance. This function can be expressed as:
u i t = w i t + z b i t θ b
where zbit represents the values of each variable that affects the inefficiency degree of urban production, θ b is a coefficient vector, b represents the number of variables, and w i t   represents random errors and obeys w i t ~ N ( 0 , σ 2 ) , a truncated normal distribution. The point of truncation is ( z b i t θ b , σ u 2 ) . If a coefficient is positive, it shows that the influencing factor has a negative impact on urban energy performance; otherwise, the factor has a positive impact. The absolute values of the coefficients represent the degree of influence.
The above model is estimated by the method of maximum likelihood. The specific calculation process is presented in Battese and Coelli (1993) [39,42]. Because the error term of the stochastic frontier production function is different from the classical assumption of the least square method, σ v 2 and σ u 2 are be replaced by s2 and γ . Set up s 2 = σ v 2 + σ u 2 and γ = σ u 2 / s 2 . Thus, γ must lie between 0 and 1. It represents the proportion of inefficiency items in all random variables. The greater the γ , the greater the influence of u i t on the production.
In the stochastic frontier analysis model, the likelihood ratio test can be used to measure the rationality of the production function, the robustness of the distribution hypotheses for random error item and inefficiency term, and the validity of exogenous influencing factors. The statistic obtained by the maximum likelihood ratio test can be expressed as:
L R = 2 { l n [ L ( H 0 ) / L ( H 1 ) ] } = 2 { l n [ L ( H 0 ) l n L ( H 1 ) ] }
where L ( H 0 ) and L ( H 1 ) represent the maximum likelihood function values of the original hypothesis ( H 0 ) and the alternative hypothesis ( H 1 ) respectively. If LR > χ 2 ( 2 α ) , H 0 would be accepted; otherwise, H 1 would be accepted.
The Cobb-Douglas production function and Translog production function are often used to construct the production function in the stochastic frontier analysis model [43,44]. Based on the above productions, we constructed the stochastic frontier analysis models and tested them. It was concluded that the Cobb-Douglas production function is more suitable for building the urban energy performance assessment and influencing factor model. Therefore, Equation (4) can be rewritten as:
ln y i t = α 0 + k = 1 K α k l n x k i t + v i t u i t , u i t > 0
where k represents the number of inputs. The above urban energy performance assessment indicators and influencing factors were respectively added to Equation (7) and Equation (5) for calculations. Hence, α1, α2, and α3 respectively represent the coefficients of elasticity of capital investment, labor input, and energy. θ1, θ2, θ3, and θ4 respectively represent the coefficients of the urbanization rate, population density, the temperature index, and household car ownership. To eliminate the influence of dimensionality and variance on the data, the values of urban energy performance influencing factors in Equation (5) were taken as logarithms, so that the meanings of the coefficients were changed accordingly.
Based on the above model, FRONTIER Version 4.1 is used to conduct these calculations [45,46]. The calculation process mainly includes three steps: firstly, the ordinary least square estimation of the production function are carried out. α1, α2, and α3 estimators would be unbiased. Secondly, α0 and s 2 are adjusted based on the corrected ordinary least squares method. According to the α parameters (excepting the intercept) set to the ordinary least squares values and the adjusted α0 and s 2 , γ is searched by a two-phase grid search method. γ lies between 0 and 1. The range can be searched to offer a good beginning value in the latter iterative process. Thirdly, the above selected value of γ could be used as the starting value for iterative calculation, and the maximum likelihood estimates are obtained. The results of urban energy performance assessment and parameter estimation could be obtained by the specific software.

2.3. Study Areas and Data Sources

According to the consistency and availability of sample data, this study selected panel data from 30 provincial capitals in China from 2004 to 2013. These cities included Beijing, Tianjin, Shijiazhuang, Taiyuan, Hohhot, Shenyang, Changchun, Harbin, Shanghai, Nanjing, Hangzhou, Hefei, Fuzhou, Nanchang, Jinan, Zhengzhou, Wuhan, Changsha, Guangzhou, Nanning, Haikou, Chongqing, Chengdu, Guiyang, Kunming, Xi’an, Lanzhou, Xining, Yinchuan, and Urumqi. On the one hand, these cities reflect different levels of energy performance in Chinese cities, so that differences in energy performance can be analyzed and compared and the urban energy development experience of advanced cities can be transferred to others. On the other hand, the urban energy performance assessment of Chinese provincial capitals can reflect the level of China’s urban energy performance and can provide a basis for international comparison [30]. The data were obtained from the statistical yearbook of each city, the Chinese urban statistical yearbook, and the economic and social development statistics database.

3. Results

3.1. Assessment Results

The urban energy performance of each city was calculated based on the urban energy performance assessment and influencing factor model. The calculation results are listed in Table 3. The average energy performance of Chinese provincial capitals was 0.498 between 2004 and 2013. The value of γ is 0.99, and it means that the deviation of cities in relation to the production frontier are mainly from the inefficiency item.

3.2. Descriptive Statistical Analysis

Table 4 shows the energy performance statistics of Chinese provincial capitals from 2004 to 2013.
The maximum, minimum, mean, and standard deviation of energy performance for each year are shown in Figure 2. Reflecting a rising curve, the maximum urban energy performance rose from 0.644 in 2004 to 0.968 in 2013, an increase of 0.324. As for the minimum, it did not change significantly after rising to 0.294 in 2005. From 2004 to 2013, the mean value and standard deviation of energy performance in Chinese provincial capitals gradually increased. The increase in the mean value was 0.1, and the increase in the standard deviation was 0.55.
Table 5 shows the energy performance statistics for the Chinese provincial capitals.
According to the maximum of each city, Guangzhou, Shanghai, Hohhot, and Nanning had higher maximum values (greater than 0.8), whereas the maximum values for Shijiazhuang, Harbin, Nanchang, Zhengzhou, Guiyang, and Xi’an were lower compared to other cities. As for the minimum, the gap between different cities was less than that for the maxima. The minimum values for Guangzhou, Jinan, Hangzhou, and Shanghai were higher, but those of Yinchuan, Guiyang, Chongqing, and Xi’an were lower. Overall, Guangzhou, Shanghai, Hohhot, and Hangzhou had higher levels of energy performance, but the average levels of Shijiazhuang, Xi’an, Guiyang, and Chongqing on energy performance were relatively low, as shown in Figure 3.

3.3. Analysis of Urban Energy Performance Assessment Indicators and Influencing Factors

The coefficient estimation results for the assessment indicators and influencing factors in the urban energy performance assessment and influencing factor model are listed in Table 6. The T values for every variable in Table 6 show that the input indicators and influencing factors have passed significance tests and prove that the evaluation and influencing factor model is reasonable and effective.
Analytical results for the input indicators show that the sum of the coefficients of elasticity for total fixed asset investment, the number of urban employees, and urban energy consumption was greater than one, which shows that the energy performance of Chinese provincial capitals was increasing. In addition, the three inputs had significant impacts on urban energy performance and were positively correlated with the output; in other words, the output will increase as these inputs increase. The coefficients of elasticity of total fixed assets investment, the number of urban employees, and urban energy consumption were 0.536, 0.412, and 0.092, which indicates that the effects of capital and labor input on the output were significantly higher than that of the energy input.
θ1, θ2, θ3, and θ4 respectively represent the influence of urbanization rate, population density, temperature index, and household car ownership on urban energy performance. If θb is positive, this means that this variable is negatively correlated with urban energy performance, whereas if θb is negative, this variable is positively related to urban energy performance. It is clear that population density had a negative impact on urban energy performance, but that urbanization rate, temperature index, and household car ownership had positive impacts on urban energy performance. In addition, it can also be seen from the absolute values of the variable coefficients that urbanization had the greatest impact on urban energy performance. The influences of population density, temperature index, and household car ownership on urban energy performance were relatively small.

3.4. Analysis of Urban Energy Performance Differences

To compare the differences among these thirty provincial capitals in China, the urban energy performance results were classified using SPSS software. The clustering method uses the Ward method to measure the similarity between classes with the aid of Euclidean distance. Think of each city as a class, and then reduce one class every time. For each reduction, the sum of squares of deviations would increase. Two classes that minimize the increase of the sum of squares of deviations are chosen to combine until all the cities fall into one class. According to the results, these thirty cities were divided into four clusters, as shown in Table 7.
Figure 4 depicts the energy performance changes of Chinese provincial capitals. Cities within each subfigure were obtained from Table 7. The characteristics of urban energy performance are different for each type. The first class of cities is characterized by high performance and high growth. The energy performances of these cities ranged from 0.45 to 0.97. Figure 4a shows that the urban energy performance of Guangzhou and Shanghai was about 0.6 in 2004 and about 0.9 in 2013, an increase of 50% compared with 2004. The energy performance of Hohhot generally increased in recent years and reached 0.8 in 2013. The second class had high energy performance, but showed a steady upward trend. The energy performance range of these cities was from 0.31 to 0.82. In 2004, the energy performance of these cities was concentrated between 0.31 and 0.63; although their performance increased to 0.48–0.7 in 2013, their growth was relatively small (Figure 4b). These cities are mostly in central and eastern China and have a high level of economic development. The urban energy performance of the third class was relatively low and showed a U-shaped change trend, as shown in Figure 4c. In other words, the urban energy performance of this class was higher in 2004–2006 and 2010–2013, but lower in 2006–2010. The energy performances of these cities was between 0.23 and 0.64. These cities are located in the central part of China. The cities in the fourth class had the lowest performance, and their volatility in different years was larger than other classes (Figure 4d). The maximum of the urban energy performances in this class was less than 0.52, and this value existed in only a few years. The minimum of urban energy performance in this class was 0.27. These cities are mainly distributed in northwestern and southwestern China.

4. Discussion

The urban energy performance assessment indicators and influencing factors selected in this paper have passed the coefficient test, which fully demonstrates the relations of each indicator and factor to urban energy performance. The assessment indicators and influencing factors incorporate climate change, economic growth, energy consumption, and other aspects that are also the focus of current research on Chinese provincial capitals and cover the main variables used by Chen and Xu [27], Fang et al. [30], Du et al. [31], and Fan and Qi [32]. Compared with other assessment methods, the urban energy performance assessment and factor analysis model constructed by the improved stochastic frontier analysis method can fully consider the energy performance differences of cities and random errors and fully reflect the dual roles of assessment indicators and influencing factors on urban energy performance, making the assessment results more objective and accurate.
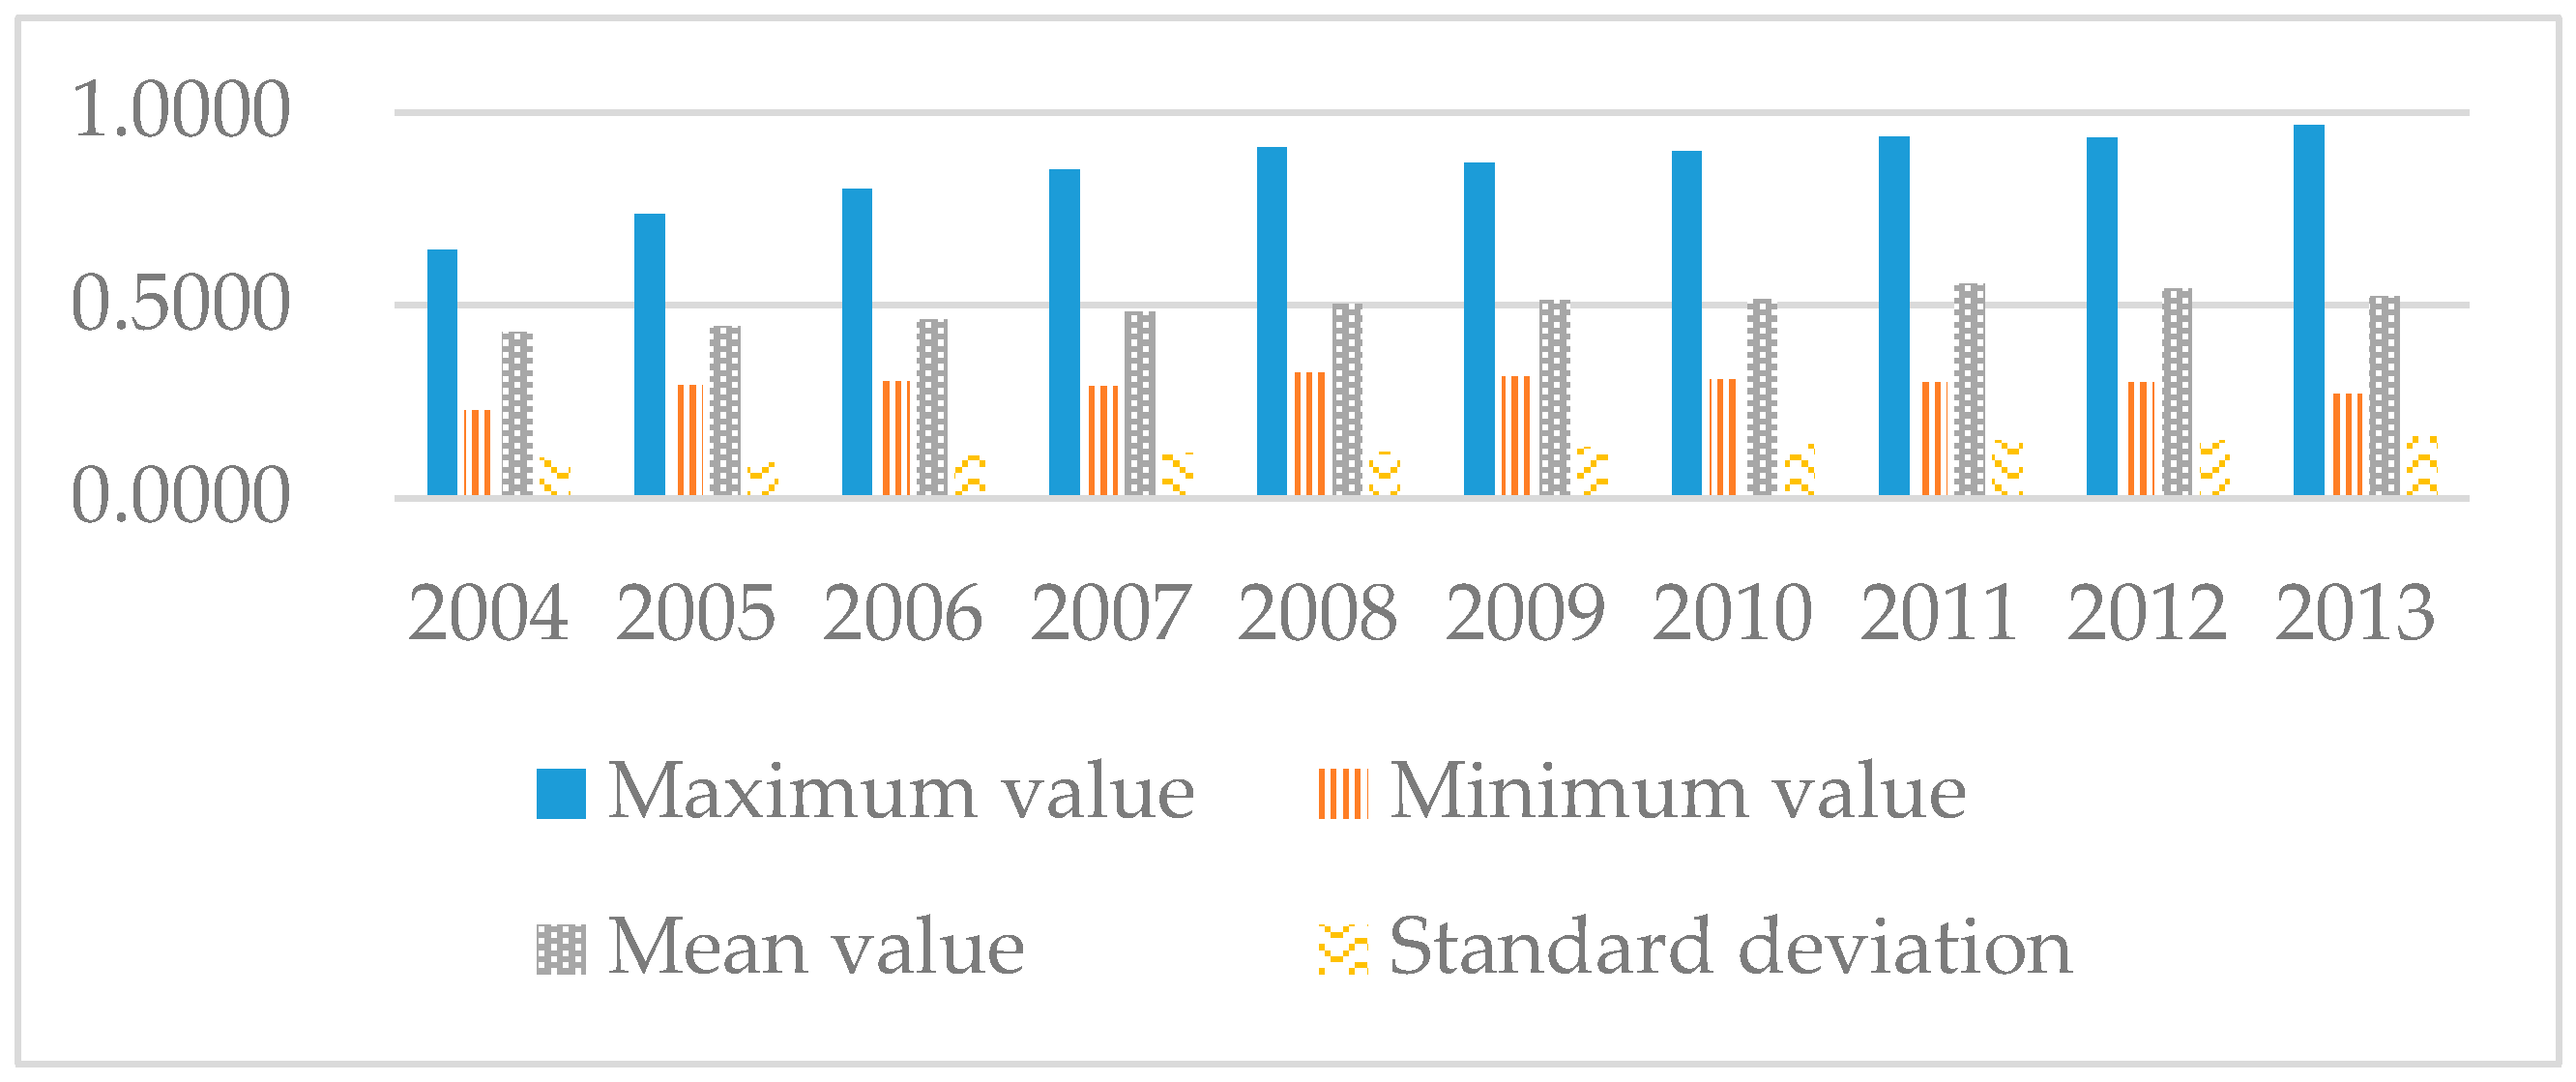
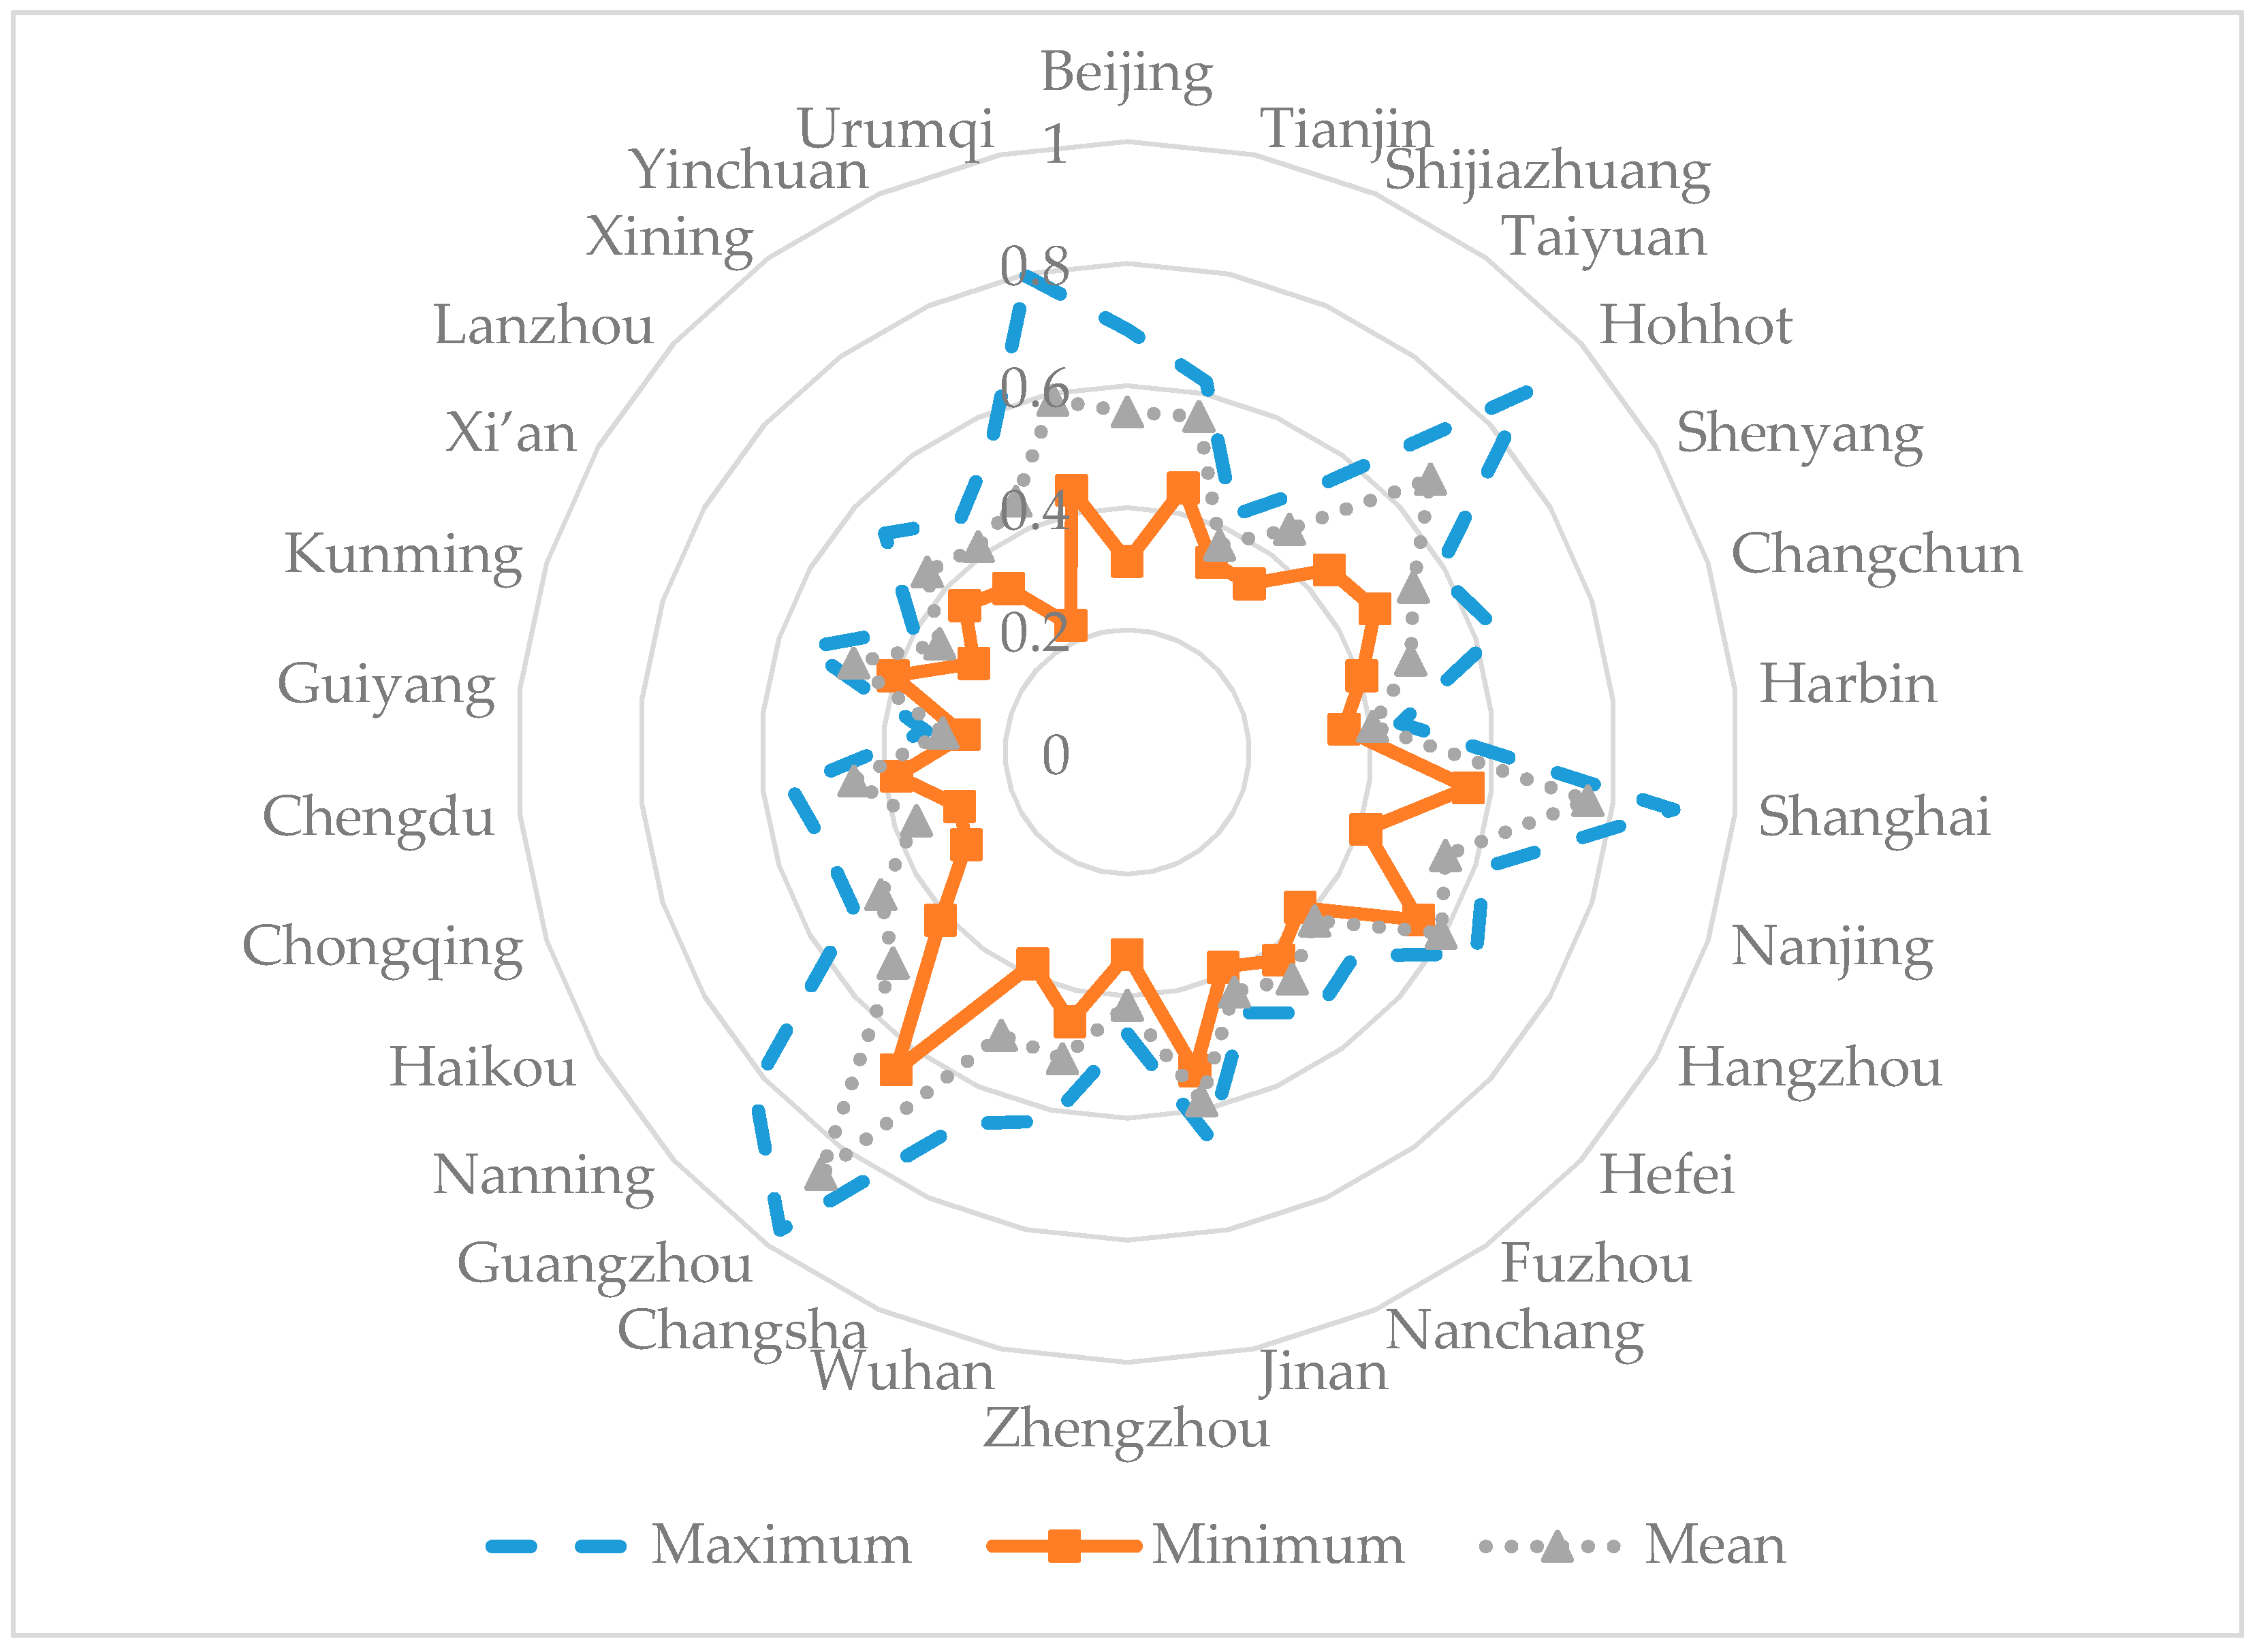
From 2004 to 2013, the average energy performance of Chinese provincial capitals was 0.498, which shows that Chinese provincial capitals had an energy-saving potential of 50% under constant outputs. In other words, the energy-saving potential of Chinese provincial capitals was great. The increases in the standard deviation indicated that the gap between the energy performances of different cities has increased in recent years. Between 2004 and 2013, the maxima of all provincial capitals showed a rising trend, which indicates that the cities with higher energy performance still had growth potential and attained large increases. The lack of significant changes in the minimum from year to year shows that the average values of energy performance in provincial capitals showed an increasing trend, but that the growth rate was less than the maximum. Therefore, the urban energy performance of Chinese provincial capitals was still improved by those cities with higher performance. In the long run, the gap in urban energy performance among provincial capitals will gradually increase. The maximum energy performance in each provincial capital reflects the highest performance level of each city in recent years and also provides a benchmark for future energy performance improvements.
At present, the energy performance of Chinese provincial capitals is increasing, but further efforts should be made to enhance it, further verifying the conclusions reached by Xie and Mo [21]. The coefficients of elasticity for urban energy performance assessment indicators indicates that energy input is also an important investment in promoting socioeconomic development. The marginal effect of population density on economic development has been gradually reduced, but increases in population density still resulted in more energy consumption. As a result, urban energy performance decreased in this case. A higher urbanization level is bound to enhance investments in science, technology, education, and infrastructure, leading to sustainable use of renewable energy and high quality of life for residents and strengthening the population agglomeration effect, which could help reduce urban energy consumption and further elevate urban energy performance. The temperature index was calculated using American cooling degree days. This factor comprehensively reflects urban temperature and urban heating requirements. If the temperature index increases, urban heating requirements and urban energy consumption will decrease, and therefore the urban energy performance will improve. Household car ownership in Chinese provincial capitals was still rising between 2004 and 2013 despite the introduction of vehicle driving restrictions and new energy-efficient vehicle promotion policies, indicating that the popularity of new energy-efficient vehicles gradually increased and that the increase in car ownership did not result in more energy consumption [47]. Therefore, household car ownership is negatively correlated with urban energy performance.
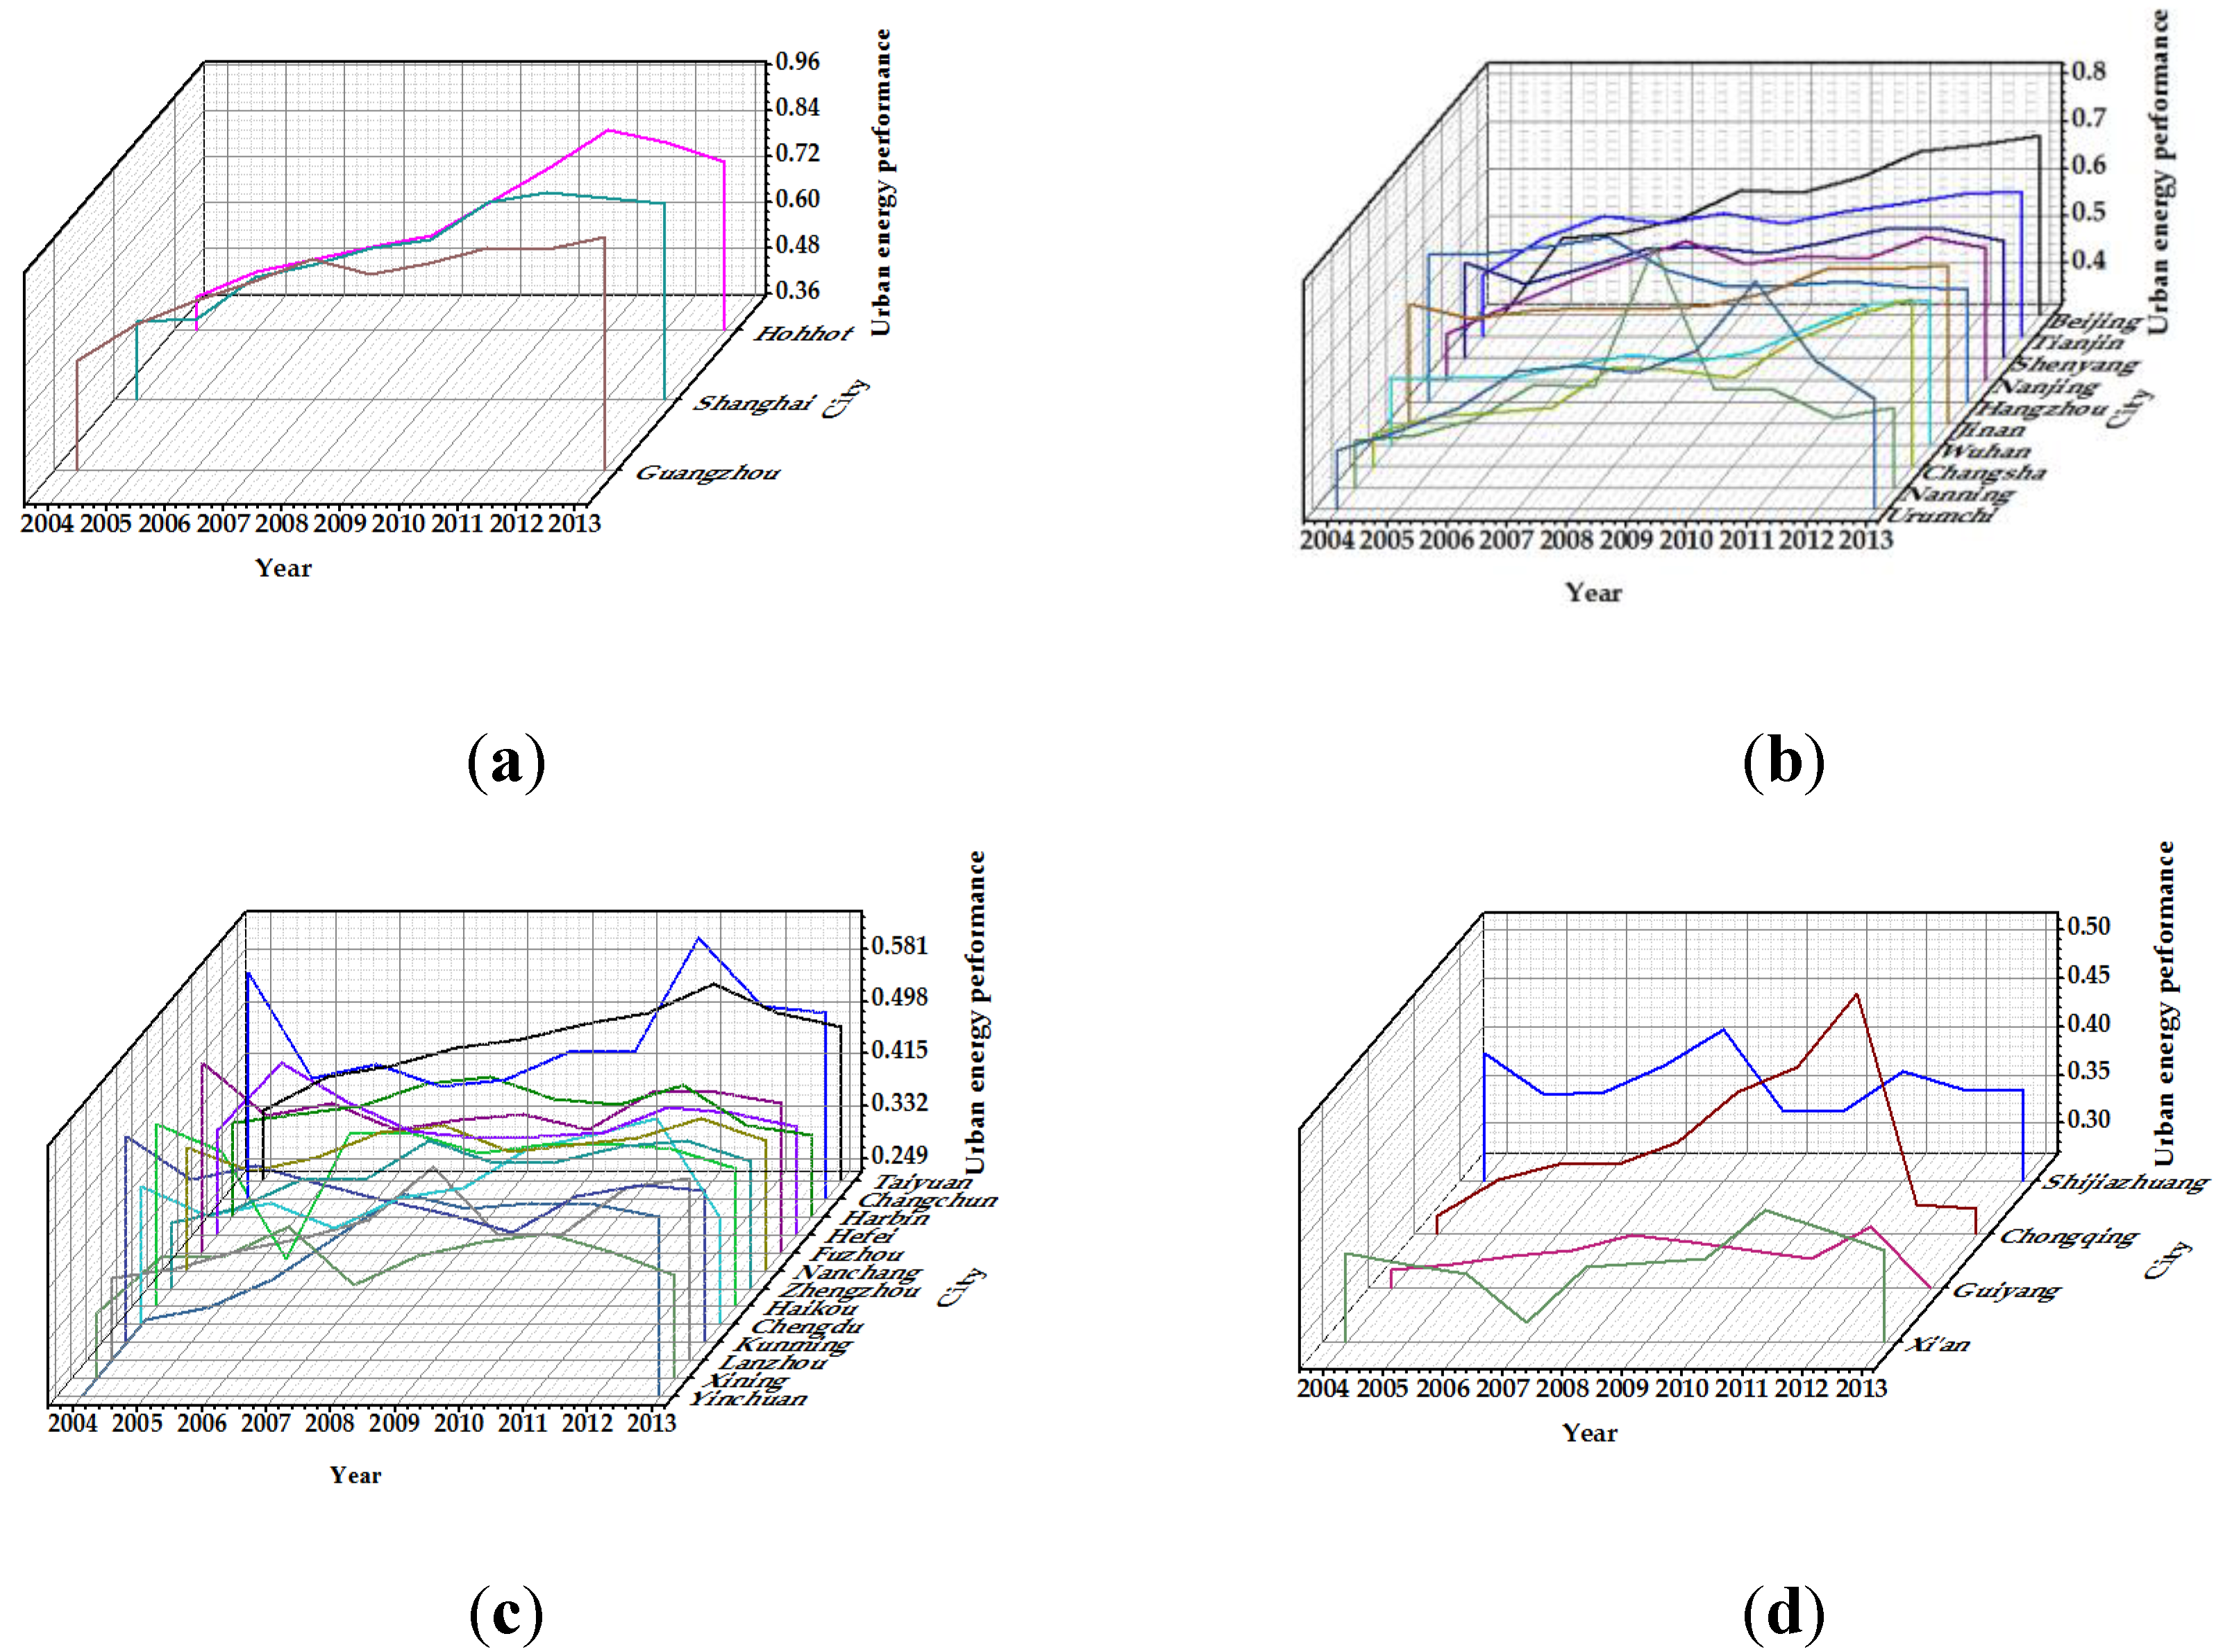
It is concluded that the energy performance of different provincial capitals in China varies widely from the urban energy performance assessment results, as shown in Table 3. According to the locations of cities within each class in Table 7, the cities with higher energy performance are mostly in eastern China, the cities with moderate energy performance are located in central part of China, and the cities with lower energy performance are mainly distributed in northwestern and southwestern China. Thus, the urban energy performance of Chinese provincial capitals decreases from east to west. In recent decades, China’s economy has continued to develop, and social living standards have been continuously improved [48,49]. Thanks to the excellent geographical location, environmental condition and policy support (such as coastal development strategy, market economic reform), the total economic output and per capita income of southeast coastal areas in China are significantly better than those of central and western regions. The gap between the eastern and western regions continues to expand [31,50]. The economic and social development in the southeast coastal areas has increased the concentration of labor and capital [51], so the level of urbanization and the population pressure has increased [52]. In addition, the innovation efficiency and technical level of these areas have also been developed [53]. Especially in the three major economic zones, the level of economy, social security, infrastructure construction, and technological innovation in these regions is better than that in other regions [25,53,54]. Through the above analysis, we can draw a conclusion that the socioeconomic development level of eastern coastal areas in China is better than that of the western areas, and uneven regional development has gradually become a major challenge for China’s development [55]. The regional characteristics of socioeconomic development in China are similar to the distribution characteristics of urban energy performance. Therefore, it is speculated that there is a correlation between socioeconomic development level and urban energy performance.

5. Conclusions and Policy Recommendations

Urban energy performance assessment indicators and influencing factors were selected based on literature analysis, the production function, and IPAT theory. Then the urban energy performance assessment and influencing factor model was constructed using the improved stochastic frontier method to carry out a case study with Chinese provincial capitals as examples. Conclusions can be drawn as follows:
  • The selection of urban energy performance assessment indicators and factors is of great significance in measuring urban energy performance. On the basis of input-output relationships, the performance measure could reasonably quantify the role of energy and highlight the importance of energy investment. The set of influencing factors covering urbanization level, population, area, urban climate, and travel selection represents the main factors related to urban energy performance.
  • As an assessment objective, urban energy performance could be scientifically calculated using the improved stochastic frontier analysis method. This method can effectively measure the influences of random errors and combine performance assessment and factor analysis into a system. Its statistical characteristics can be used to test the parameters and make the assessment results more objective and accurate.
  • The urban energy performance of Chinese provincial capitals experienced an overall upward trend from 2004 to 2013. However, there was an increase in the performance differences among the cities. Chinese provincial capitals are in the process of increasing their energy performance and have great energy-saving potential. The analytical results for the assessment indicators and influencing factors show that it is important to introduce energy input to evaluate urban energy performance. Population density and energy performance are negatively related, but urbanization rate, the temperature index, and household car ownership are positively related to energy performance. The effect of urbanization on urban energy performance is significantly higher than that of other factors. The urban energy performance values of Chinese provincial capitals are different from one another and gradually decline from east to west. Compared with developing cities, developed cities still have certain performance advantages.
Based on these conclusions and on current problems with global urban energy performance, this paper proposes the following policy recommendations:
  • Assessment of urban energy performance is of great significance for urban energy use. Therefore, it is necessary to build an urban energy performance assessment tool based on the assessment model proposed in this paper. With the aid of this urban energy performance assessment tool, urban resources can be reasonably allocated based on assessment results to improve infrastructure and technology development for cities with different performance levels.
  • Empirical results show that urbanization has a leading role in urban energy performance. Against the background of new urbanization, the urbanization contents have evolved to include production activities, transportation, infrastructure, residents’ quality of life, and other aspects. Therefore, from the perspective of production activities, the advantages of labor agglomeration must be emphasized, the urban economic structure should benefit from urban development, and clean energy should be reasonably explored and used. Regarding the transport and infrastructure level, it is important to advocate for green travel modes and improve the use of urban land resources. As for residents’ quality of life, healthy lifestyles should be promoted. Residents should change their living habits and try their best to save energy.
  • Chinese provincial capitals are in an increasing stage of urban energy performance and have great energy-saving potential. Therefore, the development concept of green cities should be established to strengthen the development of urban energy. In the development process, technological progress is an important condition, especially in urban traffic and urban climate. The development of new energy vehicles and the use of energy-saving appliances are easy ways to reduce the pressure on urban energy and decrease urban environmental problems, but their foundation lies in the use of new technologies and new energy. Therefore, no effort should be spared to develop new energy sources and energy-saving equipment.

Acknowledgments

This study was supported by the Fundamental Research Funds for the Central Universities (No. 2017XKZD12). The authors thank everyone who provided constructive advices that helped to improve this paper.

Author Contributions

Lei Wang, Ruyin Long, and Hong Chen conceived and designed this study; Lei Wang and Ruyin Long built the assessment and influencing factor model; Lei Wang carried out the data collection; Lei Wang and Ruyin Long conducted calculations and analyzed the results; Lei Wang, Ruyin Long, and Hong Chen contributed discussion and provided policy suggestions; Lei Wang wrote the paper.

Conflicts of Interest

The authors declare that they have no conflict of interest.

References

  1. Chen, S.; Chen, B. Urban energy consumption: Different insights from energy flow analysis, input–output analysis and ecological network analysis. Appl. Energy 2015, 138, 99–107. [Google Scholar] [CrossRef]
  2. Guo, J.; Zheng, X.; Wei, C. Disaggregating energy use cap among China’s provinces. J. Clean. Prod. 2016, 127, 374–386. [Google Scholar] [CrossRef]
  3. Ren, J.; Sovacool, B.K. Enhancing China’s energy security: Determining influential factors and effective strategic measures. Energy Convers. Manag. 2014, 88, 589–597. [Google Scholar] [CrossRef]
  4. Chen, S.; Chen, B.; Fath, B.D. Urban ecosystem modeling and global change: Potential for rational urban management and emissions mitigation. Environ. Pollut. 2014, 190, 139–149. [Google Scholar] [CrossRef] [PubMed]
  5. Filippini, M.; Zhang, L. Estimation of the energy efficiency in Chinese provinces. Energy Effic. 2016, 9, 1315–1328. [Google Scholar] [CrossRef]
  6. Li, L. Dynamic evolution, regional disparity and formation cause of energy performance in China: Based on a new index of total factor productivity change. Manag. World 2015, 11, 40–52. (In Chinese) [Google Scholar]
  7. Shui, H.; Jin, X.; Ni, J. Manufacturing productivity and energy efficiency: A stochastic efficiency frontier analysis. Int. J. Energy Res. 2015, 39, 1649–1663. [Google Scholar] [CrossRef]
  8. Patterson, M.G. What is energy efficiency? Concepts, indicators and methodological issues. Energy Policy 1996, 24, 377–390. [Google Scholar] [CrossRef]
  9. İskender, Ü.; Sözen, A. Total factor productivity change of Turkey’s energy intensity. Energy Sources Part B Econ. Plan. Policy 2016, 13, 165–175. [Google Scholar]
  10. Herrando, M.; Cambra, D.; Navarro, M.; Cruz, L.D.L.; Millán, G.; Zabalza, I. Energy performance certification of faculty buildings in Spain: The gap between estimated and real energy consumption. Energy Convers. Manag. 2016, 125, 141–153. [Google Scholar] [CrossRef]
  11. Tang, M.; Fu, X.; Cao, H.; Shen, Y.; Deng, H.; Wu, G. Energy performance of hotel buildings in Lijiang, China. Sustainability 2016, 8, 780. [Google Scholar] [CrossRef]
  12. Johansson, T.; Vesterlund, M.; Olofsson, T.; Dahl, J. Energy performance certificates and 3-dimensional city models as a means to reach national targets-a case study of the city of Kiruna. Energy Convers. Manag. 2016, 116, 42–57. [Google Scholar] [CrossRef]
  13. Boyd, G.; Dutrow, E.; Tunnessen, W. The evolution of the energy star energy performance indicator for benchmarking industrial plant manufacturing energy use. J. Clean. Prod. 2008, 16, 709–715. [Google Scholar] [CrossRef]
  14. Boyd, G.; Zhang, G. Measuring improvement in energy efficiency of the US cement industry with the energy star energy performance indicator. Energy Effic. 2013, 6, 105–116. [Google Scholar] [CrossRef]
  15. Chang, M.C.; Hu, J.L.; Jan, F.G. Performance estimation of energy consumption and carbon dioxide emissions for sustainable development in Baltic Sea countries. J. Clean. Prod. 2016, 139, 1370–1382. [Google Scholar] [CrossRef]
  16. Khayatian, F.; Sarto, L.; Dall’O’, G. Application of neural networks for evaluating energy performance certificates of residential buildings. Energy Build. 2016, 125, 45–54. [Google Scholar] [CrossRef]
  17. Bellamy, L. Towards the development of new energy performance indicators for the external walls of residential buildings. Energy Build. 2014, 68, 696–702. [Google Scholar] [CrossRef]
  18. Caicedo, D.; Pandharipande, A. Sensor data-driven lighting energy performance prediction. IEEE Sens. J. 2016, 16, 6397–6405. [Google Scholar] [CrossRef]
  19. Li, Z.; Li, G. A study on the regional difference of Chinese urban energy efficiency and its influential factors. Econ. Theory Bus. Manag. 2010, 7, 17–23. (In Chinese) [Google Scholar]
  20. Caputo, S.; Coles, R.; Caserio, M.; Gaterell, M.R.; Jankovic, L. Testing energy efficiency in urban regeneration. Eng. Sustain. 2012, 165, 69–80. [Google Scholar] [CrossRef]
  21. Xie, Z.; Mo, L. Analysis of the Factors Influencing the Area Distribution of Urban Energy Efficiency. In Proceedings of the Third International Conference on Intelligent System Design and Engineering Applications, Hong Kong, China, 16–18 January 2013; pp. 321–324. [Google Scholar]
  22. Li, J.; Gong, L.; Chen, Z.; Zeng, L.; Yang, G.; Zhang, J. The hierarchy and transition of China’s urban energy efficiency. Energy Proc. 2016, 104, 110–117. [Google Scholar] [CrossRef]
  23. Kilkis, S. Sustainable development of energy, water and environment systems index for southeast European cities. J. Clean. Prod. 2015, 130, 222–234. [Google Scholar] [CrossRef]
  24. Yang, B.; Xu, T.; Shi, L. Analysis on sustainable urban development levels and trends in China’s cities. J. Clean. Prod. 2016, 141, 868–880. [Google Scholar] [CrossRef]
  25. Ding, L.; Shao, Z.; Zhang, H.; Xu, C.; Wu, D. A comprehensive evaluation of urban sustainable development in china based on the TOPSIS-Entropy method. Sustainability 2016, 8, 746. [Google Scholar] [CrossRef]
  26. Liang, X.; Zhang, W.; Chen, L.; Deng, F. Sustainable urban development capacity measure—A case study in Jiangsu province, China. Sustainability 2016, 8, 270. [Google Scholar] [CrossRef]
  27. Chen, N.; Xu, L. Relationship between air quality and economic development in the provincial capital cities of China. Environ. Sci. Pollut. Res. 2017, 24, 2928–2935. [Google Scholar] [CrossRef] [PubMed]
  28. Zhao, S.; Yu, Y.; Yin, D.; He, J.; Liu, N.; Qu, J.; Xiao, J. Annual and diurnal variations of gaseous and particulate pollutants in 31 provincial capital cities based on in situ air quality monitoring data from China national environmental monitoring center. Environ. Int. 2016, 86, 92–106. [Google Scholar] [CrossRef] [PubMed]
  29. Wang, Y.; Ying, Q.; Hu, J.; Zhang, H. Spatial and temporal variations of six criteria air pollutants in 31 provincial capital cities in China during 2013–2014. Environ. Int. 2014, 73, 413–422. [Google Scholar] [CrossRef] [PubMed]
  30. Fang, C.; Wang, S.; Li, G. Changing urban forms and carbon dioxide emissions in China: A case study of 30 provincial capital cities. Appl. Energy 2015, 158, 519–531. [Google Scholar] [CrossRef]
  31. Du, Q.; Wang, Y.; Ren, F.; Zhao, Z.; Liu, H.; Wu, C.; Li, L.; Shen, Y. Measuring and analysis of urban competitiveness of Chinese provincial capitals in 2010 under the constraints of major function-oriented zoning utilizing spatial analysis. Sustainability 2014, 6, 3374–3399. [Google Scholar] [CrossRef]
  32. Fan, P.; Qi, J. Assessing the sustainability of major cities in China. Sustain. Sci. 2010, 5, 51–68. [Google Scholar] [CrossRef]
  33. Ma, M.; Yan, R.; Du, Y.; Ma, X.; Cai, W.; Xu, P. A methodology to assess China’s building energy savings at the national level: An IPAT–LMDI model approach. J. Clean. Prod. 2017, 143, 784–793. [Google Scholar] [CrossRef]
  34. Keirstead, J. Benchmarking urban energy efficiency in the UK. Energy Policy 2013, 63, 575–587. [Google Scholar] [CrossRef]
  35. Yin, K.; Wang, R.; An, Q.; Yao, L.; Liang, J. Using eco-efficiency as an indicator for sustainable urban development: A case study of Chinese provincial capital cities. Ecol. Indic. 2014, 36, 665–671. [Google Scholar] [CrossRef]
  36. Wang, Q.; Zhou, P.; Zhao, Z.; Shen, N. Energy efficiency and energy saving potential in China: A directional meta-frontier DEA approach. Sustainability 2014, 6, 5476–5492. [Google Scholar] [CrossRef]
  37. Parmeter, C.F.; Kumbhakar, S.C. Efficiency analysis: A primer on recent advances. Found. Trends Econ. 2014, 7, 191–385. [Google Scholar] [CrossRef]
  38. Battese, G.E.; Coelli, T.J. Frontier production functions, technical efficiency and panel data: With application to paddy farmers in India. J. Product. Anal. 1992, 3, 149–165. [Google Scholar] [CrossRef]
  39. Battese, G.E.; Coelli, T.J. A model for technical inefficiency effects in a stochastic frontier production function for panel data. Empir. Econ. 1995, 20, 325–332. [Google Scholar] [CrossRef]
  40. Kaka, Y.; Shamsudin, M.N.; Radam, A.; Latif, I.A. Profit efficiency among paddy farmers: A Cobb-Douglas stochastic frontier production function analysis. J. Asian Sci. Res. 2016, 6, 66–75. [Google Scholar] [CrossRef]
  41. See, K.F.; Coelli, T. Estimating and decomposing productivity growth of the electricity generation industry in Malaysia: A stochastic frontier analysis. Energy Policy 2013, 62, 207–214. [Google Scholar] [CrossRef]
  42. Battese, G.E.; Coelli, T.J. A Stochastic Frontier Production Function Incorporating a Model for Technical Inefficiency Effects; Working Papers in Econometrics and Applied Statistics No. 69; Department of Econometrics, University of New England: Armidale, Australia, 1993. [Google Scholar]
  43. Heidari, M.D.; Omid, M.; Akram, A. Energy efficiency and econometric analysis of broiler production farms. Energy 2011, 36, 6536–6541. [Google Scholar] [CrossRef]
  44. Carrer, M.J.; Filho, H.M.D.S.; Batalha, M.O.; Rossi, F.R. Farm management information systems (FMIS) and technical efficiency: An analysis of citrus farms in Brazil. Comput. Electron. Agric. 2015, 119, 105–111. [Google Scholar] [CrossRef]
  45. Coelli, T.J. A Guide to Frontier Version 4.1: A Computer Program for Stochastic Frontier Production and Cost Function Estimation; Working Paper 7/96; Centre for Efficiency and Productivity Analysis, Department of Econometrics, University of New England: Armidale, Australia, 1993. [Google Scholar]
  46. Buafua, P.M. Efficiency of urban water supply in sub-Saharan Africa: Do organization and regulation matter? Util. Policy 2015, 37, 13–22. [Google Scholar] [CrossRef]
  47. Wang, J.; He, D. Sustainable urban development in China: Challenges and achievements. Mitig. Adapt. Strateg. Glob. Chang. 2015, 20, 665–682. [Google Scholar] [CrossRef]
  48. Li, Y.; Oberheitmann, A. Challenges of rapid economic growth in China: Reconciling sustainable energy use, environmental stewardship and social development. Energy Policy 2009, 37, 1412–1422. [Google Scholar] [CrossRef]
  49. Bai, X.; Shi, P.; Liu, Y. Realizing China’s urban dream. Nature 2014, 509, 158–160. [Google Scholar] [CrossRef] [PubMed]
  50. Xu, Z.; Cheng, G.; Chen, D.; Templet, P. Economic diversity, development capacity and sustainable development of China. Ecol. Econ. 2002, 40, 369–378. [Google Scholar] [CrossRef]
  51. Chang, K.; Wen, M.; Wang, G. Social capital and work among rural-to-urban migrants in China. Asian Popul. Stud. 2011, 7, 275–292. [Google Scholar] [CrossRef]
  52. Li, H.; Wei, Y.; Ning, Y. Spatial and temporal evolution of urban systems in China during rapid urbanization. Sustainability 2016, 8, 651. [Google Scholar] [CrossRef]
  53. Fang, J.; Chiu, Y. Research on innovation efficiency and technology gap in China economic development. Asia-Pac. J. Oper. Res. 2017, 34, 1750005:1–1750005:22. [Google Scholar] [CrossRef]
  54. Byrne, J.; Lo, A.; Yang, J. Residents’ understanding of the role of green infrastructure for climate change adaptation in Hangzhou, China. Landsc. Urban Plan. 2015, 138, 132–143. [Google Scholar] [CrossRef]
  55. Sun, X.; Li, J.; Qiao, H.; Zhang, B. Energy implications of China’s regional development: New insights from multi-regional input-output analysis. Appl. Energy 2017, 196, 118–131. [Google Scholar] [CrossRef]
Figure 1. System of urban energy performance assessment indicators and influencing factors.
Sustainability 09 01110 g001
Figure 2. Statistical changes in energy performance from 2004 to 2013.
Sustainability 09 01110 g002
Figure 3. Energy performance statistics for all provincial capitals.
Sustainability 09 01110 g003
Figure 4. Energy performance changes of Chinese provincial capitals within different classes. (a) Energy performance changes of cities within the first class; (b) Energy performance changes of cities within the second class; (c) Energy performance changes of cities within the third class; (d) Energy performance changes of cities within the fourth class.
Sustainability 09 01110 g004
Table 1. Literature analysis of studies related to urban energy performance assessment indicators and influencing factors.
Field of StudyAuthorsAssessment Indicators and Influencing Factors
National energy performance and Industrial energy performanceChang et al. (2016) [15]Assessment indicators: capital investment, labor input, energy use, gross domestic product, carbon emissions
Li (2015) [6]Assessment indicators: capital investment, labor input, energy use, gross regional product, regional carbon dioxide emissions
Boyd et al. (2008) [13]Assessment indicators: product output, raw material cost, energy use
Influencing factors: production capacity, working hours, cooling and heating requirements, other external factors
Boyd and Zhang (2013) [14]Assessment indicators: labor input, economic output, energy consumption
Influencing factors: production capacity, productivity
Urban energy efficiencyKeirstead (2013) [34]Assessment indicators: annual household income, annual carbon dioxide emissions, household electricity consumption
Influencing factors: area, population, heating days, cooling days, the number of households with two cars, the number of family members
Xie and Mo (2013) [21]Assessment indicators: urban capital investment, the number of urban employees, energy consumption
Influencing factors: natural endowments, average temperature, industrial structure, government, energy price, level of technology advancement
Li and Li (2010) [19]Assessment indicators: capital investment, labor input, energy consumption, gross regional product
Influencing factors: urban mining workers as a proportion of all employees, average temperature, proportion of industrial output value in the gross regional product, proportion of foreign direct investment in all foreign investment, energy price, fiscal expenditure proportions, the number of friendly cities around a city, the number of secondary administrative regions in a city, regional preferential policies
Li et al. (2016) [22]Assessment indicators: Input elements (including capital, area, and labor), resource consumption (including electricity and water), desirable outputs, undesirable outputs
Influencing factors: Population, science, technology, and education expenditures, foreign capital, power consumption
Urban sustainable developmentYin et al. (2014) [35]Assessment indicators: water consumption, energy consumption, built-up land area, the number of employees, pollution emissions (including waste water, CDD, CO2, SO2, soot, industrial dust, and solid waste), gross domestic production
Yang et al. (2017) [24]Assessment indicators: land for urban construction, urban green space, fossil energy use, water consumption per capita, absolute emissions per capita, sewage emissions, life expectancy, financial inputs to education, gross domestic product per capita, Engel’s coefficient
Kilkis (2015) [23]Assessment indicators: energy consumption and climate, popularity of energy saving and emission reduction measures, utilization potential of renewable energy, water and environmental quality, carbon dioxide emissions and the industrial situation, urban planning and social welfare, research, innovation and sustainable development policy
Ding et al. (2016) [25]Assessment indicators: water coverage, education quality, the number of health-care workers and beds per capita, total retail sales of consumer goods per capita, industrial wastewater emissions
Liang et al. (2016) [26]Assessment indicators: environmental capacity, government supports, culture and entertainment, social security, economic development
Table 2. Representation forms of urban energy performance assessment indicators and influencing factors.
System ElementRepresentation Form
Assessment indicatorsInput indicatorsCapitalTotal fixed asset investment
LaborThe number of urban employees
EnergyAnnual energy consumption
Output indicatorEconomic outputGross regional product
Influencing factorsUrbanization levelUrbanization rate
PopulationPopulation density
Area
Urban climateTemperature index
Travel selectionHousehold car ownership per one hundred urban resident households
Table 3. Urban energy performance assessment results for provincial capitals in China.
City/Year2004200520062007200820092010201120122013
Beijing0.3120.4740.4870.5160.5780.5710.6060.6580.6750.692
Tianjin0.4420.5210.5700.5510.5760.5530.5780.5950.6130.620
Shijiazhuang0.4000.3570.3600.3870.4240.3400.3400.3820.3630.362
Taiyuan0.3400.3930.4100.4390.4530.4770.4930.5410.4940.472
Hohhot0.4460.5100.5410.5760.6030.6940.7850.8810.8480.798
Shenyang0.5140.4690.5030.5450.5500.5350.5580.5870.5870.560
Changchun0.5850.4190.4410.4040.4160.4600.4600.6400.5340.522
Harbin0.3760.3890.4020.4390.4490.4130.4040.4370.3720.357
Shanghai0.5620.5690.6780.7110.7550.7780.8750.9000.8860.870
Nanjing0.4110.4670.5190.5640.6080.5600.5740.5680.6140.592
Hangzhou0.6250.6280.6410.6600.5890.5560.5600.5680.5560.551
Hefei0.3940.4990.4390.3930.3810.3840.3910.4290.4210.399
Fuzhou0.5280.4440.4650.4230.4380.4460.4220.4820.4830.464
Nanchang0.4230.3860.4060.4460.4580.4150.4270.4390.4680.434
Jinan0.5660.5340.5500.5570.5530.5610.5910.6410.6400.647
Zhengzhou0.3320.3540.4000.4010.4620.4270.4300.4530.4610.430
Wuhan0.4520.4550.4540.4800.5040.4890.5080.5630.6100.618
Changsha0.3800.4190.4260.4380.5220.5170.5010.5760.6300.667
Guangzhou0.6440.7360.8010.8520.9090.8700.8990.9360.9350.968
Nanning0.4120.4230.4590.5310.5270.8230.5250.5220.4610.484
Haikou0.5170.4730.3040.5020.5020.4720.4850.4860.4770.446
Chongqing0.2890.3260.3410.3420.3650.4160.4420.5180.3000.296
Chengdu0.4460.4000.4210.3800.4300.4450.5060.5290.5540.397
Guiyang0.2880.2940.3020.3080.3240.3160.3090.3000.3320.269
Kunming0.5530.4860.5090.4800.4520.4320.4030.4600.4780.468
Xi’an0.3610.3490.3390.2900.3470.3510.3560.4050.3860.365
Lanzhou0.3580.3740.4030.4230.4500.5350.4290.4270.5020.516
Xining0.3310.4190.4220.4680.3760.4230.4450.4570.4280.390
Yinchuan0.2270.3490.3680.4140.4830.5500.5260.5340.5320.512
Urumqi0.4380.4780.5270.6070.6180.6040.6500.7970.6290.546
Table 4. Energy performance statistics for Chinese provincial capitals from 2004 to 2013.
Year2004200520062007200820092010201120122013
Maximum0.6440.7360.8010.8520.9090.8700.8990.9360.9350.968
Minimum0.2270.2940.3020.2900.3240.3160.3090.3000.3000.269
Mean0.4320.4460.4630.4840.5030.5140.5160.5570.5420.524
Standard deviation0.1040.0910.1090.1180.1200.1320.1390.1500.1500.159
Table 5. Energy performance statistics for the provincial capitals.
CityMaximumMinimumMean
Beijing0.6920.3120.5569
Tianjin0.620.4420.5619
Shijiazhuang0.4240.3400.3715
Taiyuan0.5410.3400.4512
Hohhot0.8810.4460.6682
Shenyang0.5870.4690.5408
Changchun0.6400.4040.4881
Harbin0.4490.3570.4038
Shanghai0.9000.5620.7584
Nanjing0.6140.4110.5477
Hangzhou0.6600.5510.5934
Hefei0.4990.3810.413
Fuzhou0.5280.4220.4595
Nanchang0.4680.3860.4302
Jinan0.6470.5340.584
Zhengzhou0.4620.3320.415
Wuhan0.6180.4520.5133
Changsha0.6670.3800.5076
Guangzhou0.9680.6440.855
Nanning0.8230.4120.5167
Haikou0.5170.3040.4664
Chongqing0.5180.2890.3635
Chengdu0.5540.3800.4508
Guiyang0.3320.2690.3042
Kunming0.5530.4030.4721
Xi’an0.4050.2900.3549
Lanzhou0.5350.3580.4417
Xining0.4680.3310.4159
Yinchuan0.5500.2270.4495
Urumqi0.7970.4380.5894
Table 6. Coefficients of elasticity of the input indicators and influencing factors.
VariableCoefficientStandard DeviationT Value
α1Total fixed asset investment0.5360.02719.628
α2The number of urban employees0.4120.03312.642
α3Annual energy consumption0.0920.0243.908
θ1Urbanization rate−0.3620.063−5.747
θ2Population density0.0360.0201.848
θ3Temperature index−0.0240.009−2.650
θ4Household car ownership per one hundred urban resident households−0.0630.016−3.923
Table 7. Classification results for Chinese provincial capitals based on urban energy performance using the Ward clustering method.
ClassificationCities
1Guangzhou, Shanghai, Hohhot
2Beijing, Tianjin, Shenyang, Nanjing, Hangzhou, Jinan, Wuhan, Changsha, Nanning, Urumqi
3Taiyuan, Changchun, Harbin, Hefei, Fuzhou, Nanchang, Zhengzhou, Haikou, Chengdu, Kunming, Lanzhou, Xining, Yinchuan
4Shijiazhuang, Chongqing, Guiyang, Xi’an

