The Impact of Vegetative Slope on Water Flow and Pollutant Transport through Embankments

1
Key Laboratory of Efficient Irrigation-Drainage and Agricultural Soil-Water Environment in Southern China of Ministry of Education, Hohai University, Nanjing 210098, China
2
College of Water Conservancy and Hydropower Engineering, Hohai University, Nanjing 210098, China
3
Jiangxi Province Research Institute of Soil and Water Conservation, Nanchang 330029, China
*
Author to whom correspondence should be addressed.
Sustainability 2017, 9(7), 1128; https://doi.org/10.3390/su9071128
Submission received: 22 May 2017
/
Revised: 25 June 2017
/
Accepted: 26 June 2017
/
Published: 27 June 2017
(This article belongs to the Collection Eutrophication and Sustainable Management of Water)
Abstract
:Embankments are common structures along rivers or lakes in riparian zones in plain areas. They should have natural slopes instead of slopes covered by concrete or other hard materials, in order to rebuild sustainable ecosystems for riparian zones. This study was conducted to evaluate the effects of vegetative slopes on water flow and pollutant transport through the embankments. Three embankments with different slope treatments (a bare slope, a slope covered in centipede grass, a slope covered in tall fescue) were examined, and three inflow applications of pollute water with different concentration of total nitrogen (TN) and total phosphorus (TP) used to simulate different agricultural non-point pollution levels. The results showed that the water flux rates of the three embankments were relatively stable under all inflow events, and almost all values were higher than 80%. The embankments with vegetative slopes had better nitrogen removal than the bare slope under all events, and the one with tall fescue slope was best, but the benefits of vegetative slopes decreased with increasing inflow concentration. Moreover, there were no significant differences between the embankments on phosphorus removal, for which the reductions were all high (above 90%) with most loads remaining in the front third of embankment bodies. Overall, the embankments with vegetative slopes had positive effects on water exchange and reducing non-point pollutant into lake or river water, which provides a quantitative scientific basis for the actual layout of lakeshores.
1. Introduction
Agricultural non-point source pollution is one of the important reasons for water eutrophication because of the excessive use of fertilizers, which results in large residual nitrogen and phosphorus transportation into water bodies [1,2]. Riparian zones are often considered effective at retarding pollutants from surrounding agricultural areas before they enter lake water [3,4]. In the plain areas in China, embankments are common structures distributed widely in riparian zones along the rivers and lakes. However, most embankments are covered by hard materials for the economic benefits of flood control and navigation, such as concrete, mortar masonry, sack, rock, etc. [5]. These embankments have greatly reduced the connectivity of the river and groundwater, and have caused the riparian zones to have almost lost the function of trapping and purifying pollutants, which not only affects the living environment of the organisms in riparian zones but also affects the overall ecological functions of a river [6,7]. Some researchers have suggested that the concrete slopes should be restored to more natural slopes (vegetation protected and biotechnical slopes) in order to rebuild the connection between the river and surrounding lands [8]. Many researchers have given attention to new covered materials and methods of balancing the stabilization and ecological effects of embankments [9,10,11,12]. Current ecological revetment methods can be divided into three categories: (1) simple vegetation revetment, using vegetation roots to protect slopes; (2) vegetation revetment combined with engineering measures such as geonets, ecological concrete grids, planting grooves, prefabricated pieces, filled geotextile or fiber bags, etc., to enhance the anti-erosion abilities of vegetative slopes; (3) ecological material revetment such as cylinder molds, stone cages, ecological concrete, ecological grids, etc.
In the actual project construction, most focus has been given to the stabilization of embankments, while the integrated ecological quality has always been assessed after these projects have been completed. For example, Ostendorp (2004) established a new scheme for the ecological quality assessment of lakeshores, including aspects of nature conservancy, landscape protection, and regional planning and development, which exceeded previous requirements [13]. Xia et al. (2014) designed a GIS-based decision support system to assess the health of river systems and diagnose external factors, and then to make decisions for the maintenance or improvement of river systems in Zhejiang Province, China [14]. A few studies have also given quantitative analysis, through experiments, of the ecological benefits of embankments with natural slopes and their influence factors. For example, Cai et al. (2008) studied the effects of three ecological embankment slopes on surface runoff pollution control, and the results indicated that the ecological slopes performed better than the control bare slope at surface runoff detention, the interception of suspended solids and nutrients and other aspects, and that the benefits were influenced by vegetation coverage, soil moisture content and soil shear strength [15]. Wu et al. (2011) evaluated nitrogen removal from stream water in a special riverine system combining cellular concrete slopes, microorganisms, and green plants. The ecosystem strengthened the removal of nitrogen pollutants in rivers; and the 7 d removal rate reached 90% in the vegetative season but was reduced to 36.4% in winter, when aquatic plant zones were the main functional areas of nitrogen removal [16]. However, it is not well understood how such vegetative slopes alter hydrological processes and pollutant transport in groundwater when surrounding water pass through embankments to enter rivers or lakes.
The purpose of this study was to investigate water flow and pollutant transport of embankments with different vegetative slopes by conducting laboratory simulated experiments. Three inflow events with different pollutant concentrations were conducted for each simulated embankment, to simulate different conditions surrounding rivers. Three more specific objectives were: (1) to analyze water flux from the leachate to assess water exchange ability; (2) to compare the pollutant loads in leachate with the inflow loads in order to analyze the pollutant removal of embankments with vegetative slopes; (3) to identify which type of vegetative cover has the greatest influence on pollutant removal.
2. Material and Methods
2.1. Experimental Design and Materials
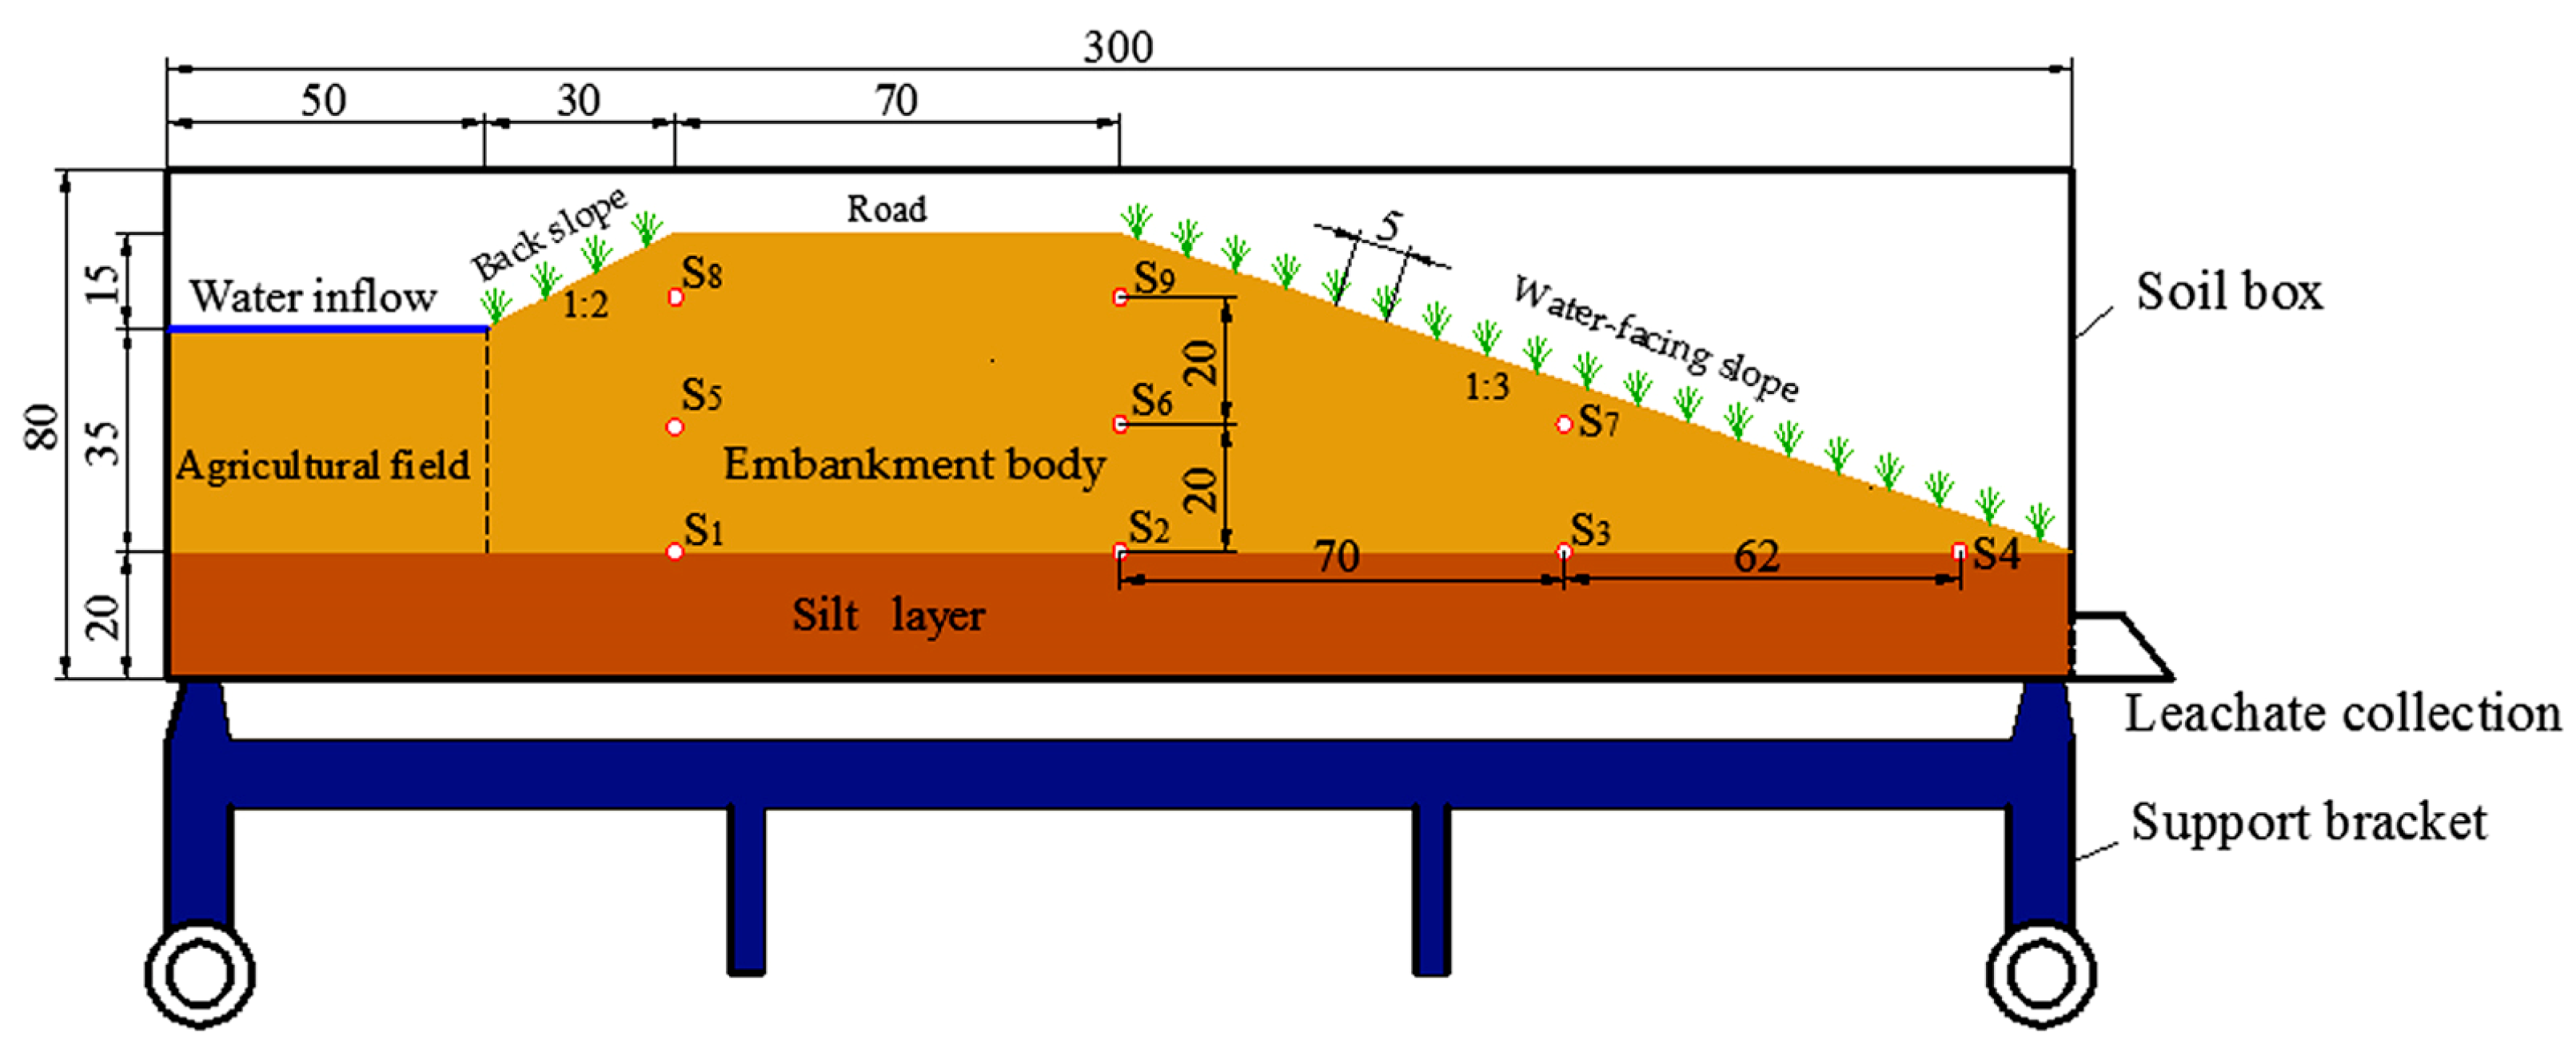
Three large soil boxes, each 300 × 80 × 80 cm, were used to simulate water flow and pollutant transport through embankments in a laboratory environment (Figure 1 shows the longitudinal section diagram of one of them). The front area, 50 cm long, was used for water inflow, which was simulated a paddy field, ditch, or pond near embankments. The remaining trapezoidal area acted as the bank body with a 1:2 back slope and a 1:3 water-facing slope and a 70 cm wide cement road at the top.
The boxes were filled with red soil, which is the typical soil type in our study area in south China. Soil was sieved through a 10 mm sieve to remove crop residue, larger soil clods, stone chips, and other foreign materials, then mixed several times and finally packed, to keep the water content constant. The pretreated soil was filled in layers, and each layer was evenly compacted to achieve the designated bulk density. Each box had two areas of bulk density: 1.40 g·cm−3 for the silt layers and 1.30 g·cm−3 for the upper layers. Ten soil samples were randomly taken from the soil bags and analyzed for their physical and chemical properties. The results are listed in Table 1.
The experiment comprised three simulated embankments of different slope types (Table 2): treatment 1 (T1) remained a bare slope as a control; treatment 2 (T2) was covered with centipede grass; and treatment 3 (T3) was covered with tall fescue. Centipede grass, a warm seasonal perennial turf grass of the Eremochloa genus, is light green-tinged and low in height, with thin stolon and abundant roots and leaves distributed on the nodes of the stolon. It relies on stolon and leaf to spread. Centipede grass is native to the central and south of China, but now has been widely used for lawns, slope protection, and filter strips around the world [17,18]. Tall fescue, native to Europe, is a cool-season perennial turf grass, with erect leaves of 90–120 cm tall, a thin stem of 2–2.5 mm diameters, and a prosperous root system, which is especially suitable to growth in subtropical transition climate zones and is widely distributed in humid areas of China [19]. A good lawn grass, tall fescue has some ability to absorb pollutants and heavy metals in the soil [20]. Both grasses were planted in rows 5 cm apart and nurtured for two months. During this period, the same amount of irrigation was applied to all slopes, including the bare slope, to ensure similar soil moisture.
2.2. Simulating the Inflow Process
Three simulated inflow events were carried out one week apart. Solutes were mixed with tap water to produce different concentrations of total nitrogen (TN) and total phosphorus (TP) for the inflow water (Table 2): Event 1 (E1) contained 2.0 mg·L−1 TN and 0.4 mg·L−1 TP; event 2 (E2), 10.0 mg·L−1 TN and 2.0 mg·L−1 TP, and event 3 (E3), 20.0 mg·L−1 TN and 4.0 mg·L−1 TP. The three concentrations of TN and TP were based on concentrations found in field studies by Zhang et al. (2013 and 2016) [21,22], which were one, five, and ten times, greater than the fifth level standard value set by the Surface Water Quality Standards (GB 3838-2002).
Before the pollute water inflow events, tap water was used to generate leachate and then rested for a week, to provide consistent soil moisture conditions between the first event and others. Both tap water and pollute water were applied with a 500 L water yield for about 12 h at an application rate of 0.70 L·min−1, and saturated non-woven fabrics were put in the water inflow area in each box in order to ensure uniform flow infiltration of inflow water.
2.3. Samples and Analysis
For each inflow event and each treatment, leachate samples were collected in 50 mL bottles every two hours after the initiation of leachating. Meanwhile, the total leachates were collected and their volumes measured at the end. Nine hours after the beginning of inflow, soil solutions were collected using porous ceramic suction cups at the locations labelled S1–S9 in Figure 1. Both leachate and soil solution samples were analyzed for TN and TP using an automatic multi-parameter water quality analyzer (Smartchem200, Alliance Instructions, France).
The project involved studying and comparing water flow and pollution transport and removal by the embankments for three treatments: T1, the control bare slope; T2, the centipede grass slope; and T3, the tall fescue slope. For each, the water flow was quantified by the water flux ratio of leachate volume to inflow water volume, and the removal of each pollutant was quantified by the reductions of concentration and mass, as follows:
where is the water flux ratio (%), is the inflow water yield with a fixed value of 500 (L) and is the total leachate volume of Ti ( = 1, 2, 3) under Ej ( = 1, 2, 3) (L).
where is the concentration reduction (%), is the mass reduction (%), is the inflow water concentration of TN or TP under Ej (mg·L−1), and is the mean leachate concentration of TN or TP of Ti under Ej (mg·L−1).
To analyze the differences between the three treatments or the three events on pollutant transport, single-factor ANOVA was performed using IBM® SPSS Statistics® 20.0 [23]. The least significant difference (LSD) method was used for all pairwise comparisons, with the results reported at the 95% confidence level (p < 0.05).
3. Results
3.1. Water Flux
The total leachate volumes and water flux ratios for each treatment and inflow event are shown in Table 3. Generally, the water flux rates were high during the three inflow events for each treatment. The ranges of leachate volume for T1, T2, and T3 were 390–425 L, 412–457 L, and 405–416 L, respectively, and the variation coefficients for T1, T2, and T3 were 3.4%, 5.6%, and 1.5%, respectively, indicating weak variations in water flux.
There were some differences between the three treatments. The mean leachate volumes for T1, T2, and T3 were 406 L, 440 L, and 412 L, respectively, while the water flux ratios were 81.2%, 88.8%, and 82.4%, respectively. Multiple comparisons showed that T2 (the centipede grass slope) and T3 (the tall fescue slope) were 8.2% and 2.5% higher, respectively, than T1 (the bare slope), which indicates that water flux ratios rose when the slope protection treatment was changed from bare to vegetative protection.
3.2. Pollutant Reduction
3.2.1. Pollutant Concentration of Leachate from the Embankments
Total nitrogen concentrations of sampled leachate for each treatment, at seven observation times (every two hours) for each of the three inflow events, are displayed in Table 4. Overall, TN concentration tendencies for the three treatments (T1, T2, and T3) were similar for all inflow events. TN concentrations in the initial leachate samples were slightly higher, declining to stable with increased time. For any inflow event, the TN concentration in T1 was always the highest, followed by T2 and T3. The differential analysis shows that the differences between T1 and T2 or T3 under E1 and E2 were significant, while the differences wore off under E3. For a given treatment, significant differences existed between different inflow events. Moreover, TN concentrations increased with the increasing concentrations of inflow water: the mean leachate concentrations for T1, T2, and T3 changed respectively, from 2.18 mg·L−1 to 11.0 mg·L−1; 1.69 mg·L−1 to 11.15 mg·L−1; and 1.84 mg·L−1 to 10.96 mg·L−1, as the inflow water concentration changed from 2.0 mg·L−1 to 20.0 mg·L−1.
Total phosphorus concentrations of the leachate samples for each treatment and event are shown in Table 5. The leachate TP concentrations of T1, T2, and T3 were relatively stable under all inflow events, and all values were less than 0.1 mg·L−1, indicating that the leachate waters all reached the second level standard for surface water quality. In addition, differential analysis showed that there were no significant differences between the three simulated embankments or between the three inflow events with different inflow concentrations.
3.2.2. Pollutant Removal through the Embankments
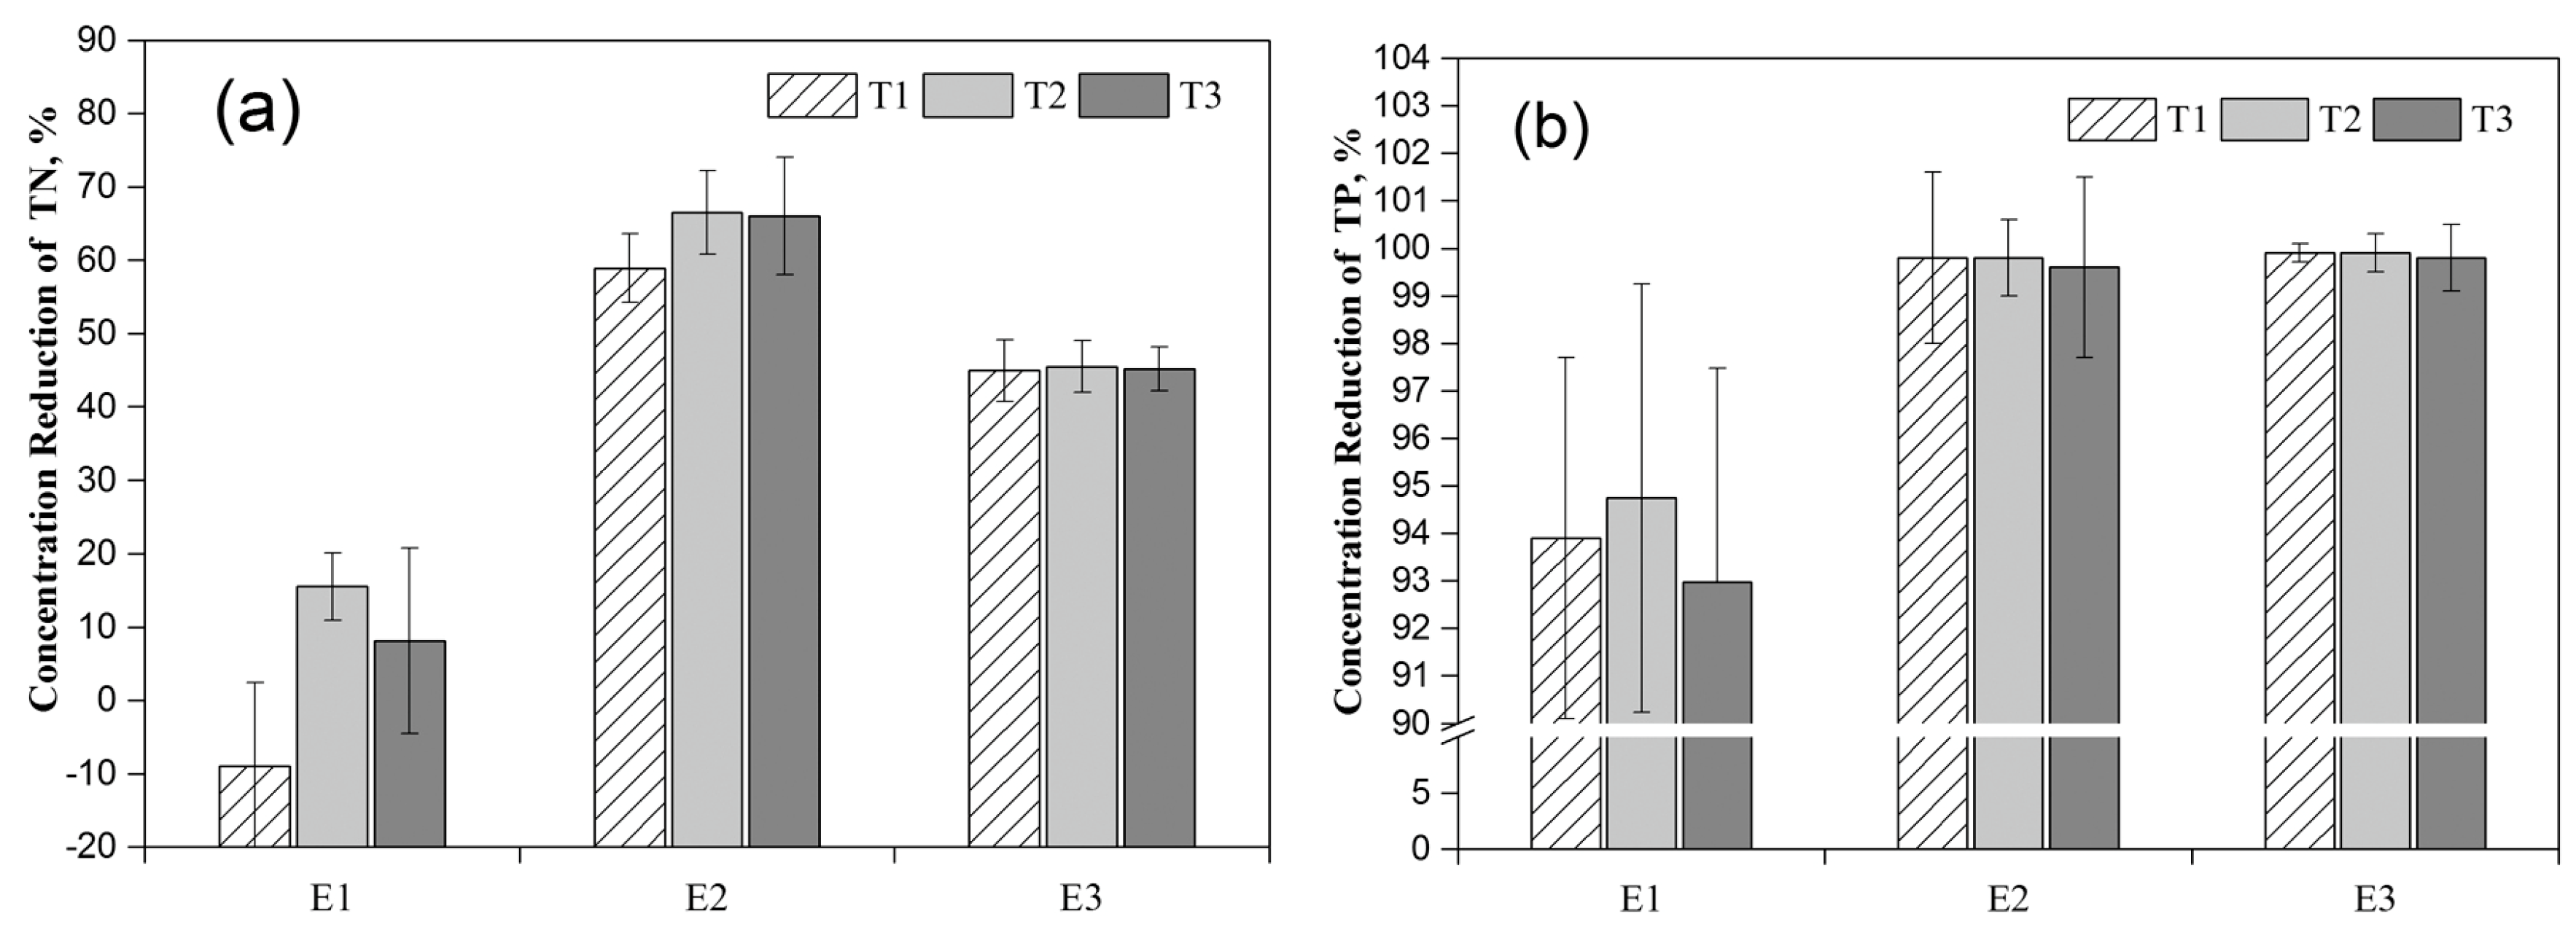
Pollutant removal is an important ecological function of lakeshore zones. The concentration reductions of TN and TP during inflow events in this simulation experiment are showed in Figure 2a,b. As Figure 2a shows, the lowest and highest mean concentration reductions of TN for the three treatments occurred under the same event. The lowest concentration reductions for T1, T2, and T3 were −9.0%, 15.6%, and 8.1% under E1, respectively. The highest concentration reductions for T1, T2, and T3 were 58.9%, 66.5%, and 66.0% under E2, respectively. Moreover, the TN concentration reductions for T2 were always the highest under all inflow events, followed by T3 and T1, but the differences between them shrank with increasing concentration of the inflow water, from E1 to E3. Concentration reductions of TP were always higher than for TN, with all TP values being above 90% (in Figure 2b). Unlike TN reduction, the benefits to TP reduction of T2 and T3 compared with T1 were not obvious: the lowest reduction of TP was 93.0% in T3 under E1 while the highest was 99.6% in T2 under E3.
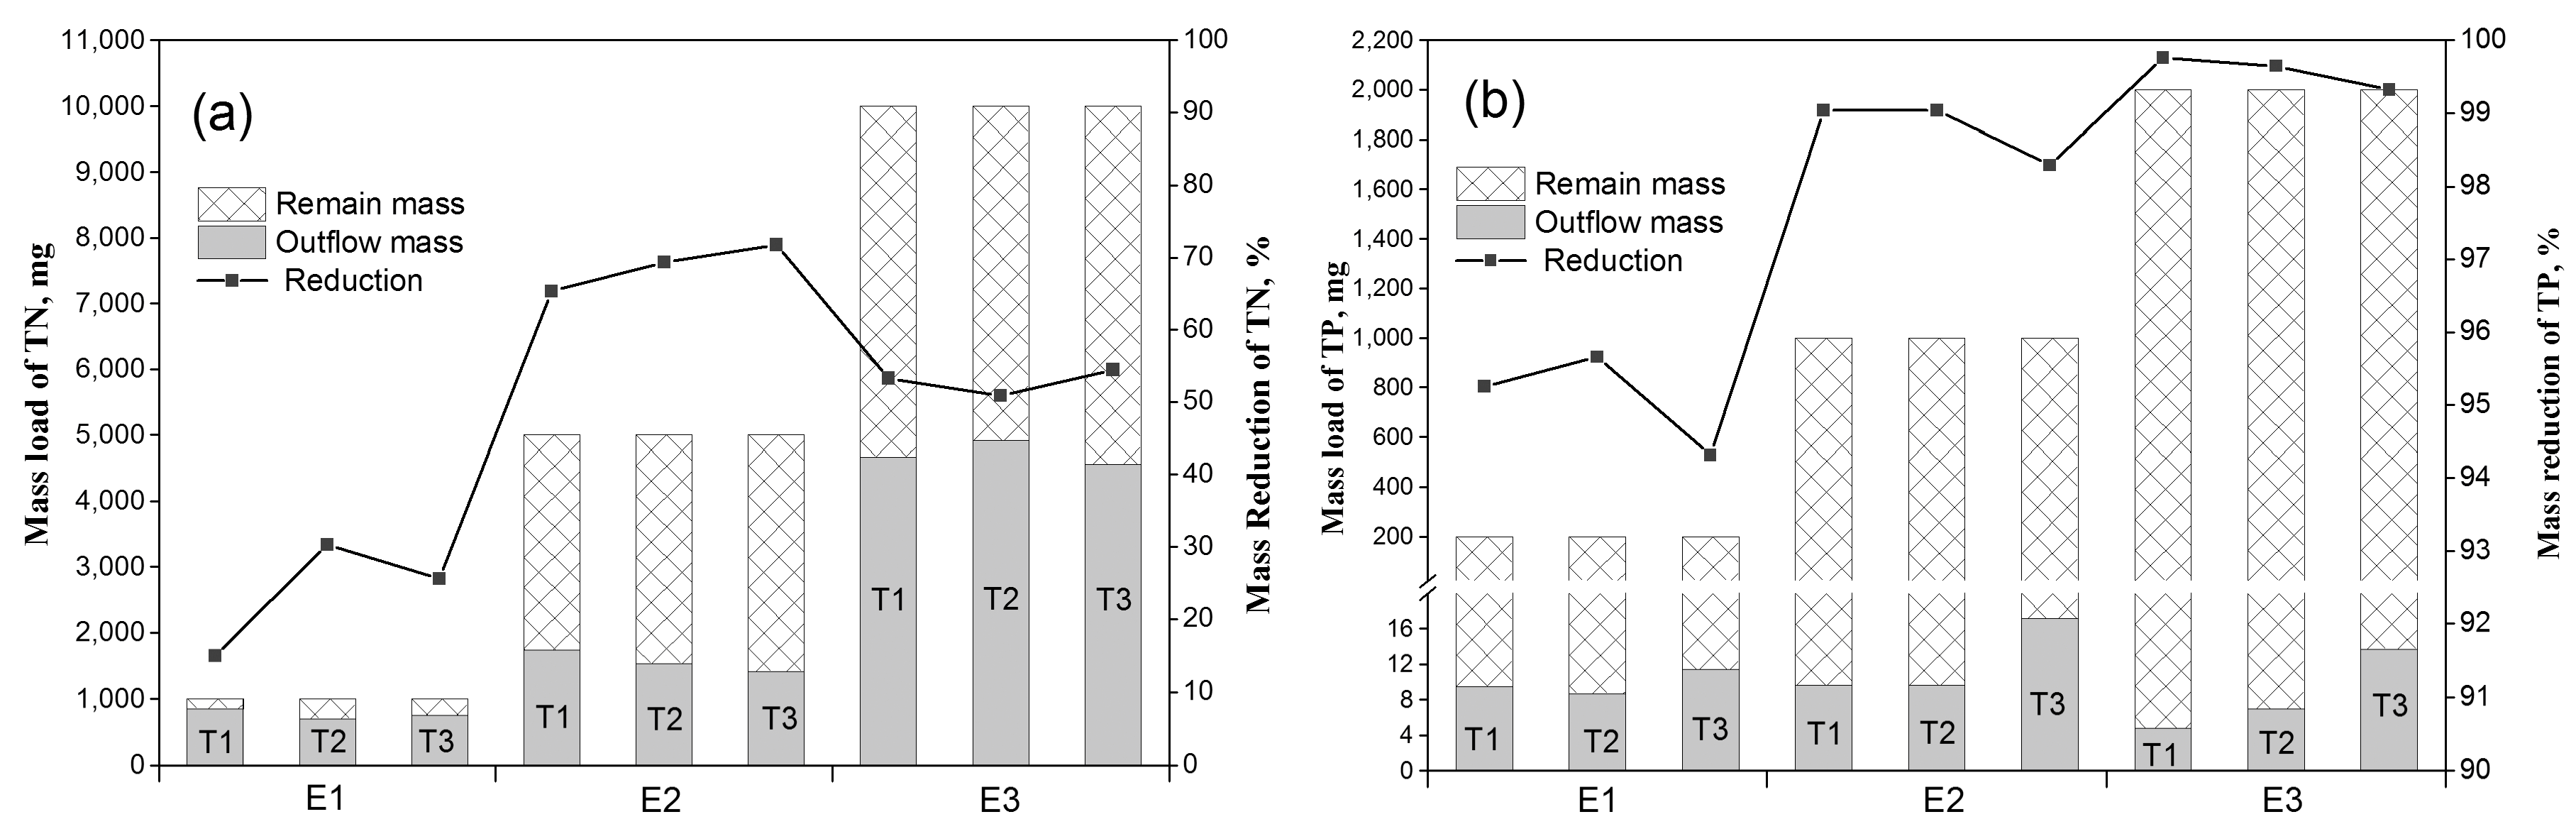
Figure 3a,b shows total pollutant outflow loads from the embankments, remaining loads in the embankments, and mass reduction of inflow water for each treatment and inflow event. The outflow loads were calculated by multiplying mean concentration of leachate by leachate volume. The sum of the outflow and the remaining loads determines total inflow pollutant loads under one event for each treatment, so that the total heights of the columns under the same event are same.
As Figure 3a shows, total outflow loads of TN for T1, T2, and T3 under E1 were 850 mg, 697 mg, and 744 mg, respectively. Under E2, total outflow loads were 1734 mg, 1533 mg, and 1413 mg, respectively, and under E3 they were 4672 mg, 4914 mg, and 4557 mg, respectively. The outflow load for any one treatment increased with the increase of inflow loads, and the outflow loads for T1 were higher than for T2 and T3 except under E3. TN mass reductions for T1, T2, and T3 under E1 were 15.0%, 30.4% and 25.6%, respectively; reductions under E2 were 65.3%, 69.34% and 71.75%, respectively; and reductions under E3 were 53.3%, 50.9% and 54.4%, respectively-all higher than the concentration reductions. Moreover, the TN mass reductions for T2 and T3, like concentration reductions, were higher than for T1, reflecting the benefits of vegetation slopes. In Figure 3b, it can be seen that the total outflow loads of TP were relatively stable compared to the inflow loads, although the outflow loads for T3 were higher than other slopes under all events. The outflow loads for T1, T2, and T3 were 9.5 mg, 8.7 mg, and 11.4 mg under E1, respectively; 9.6 mg, 9.6 mg, and 17.15 mg under E2, respectively; and 4.8 mg, 7.0 mg, and 13.7 mg under E3, respectively. The low outflow of TP was caused by the high remaining TP in the riparian banks and led to high mass reductions for every event and treatment.
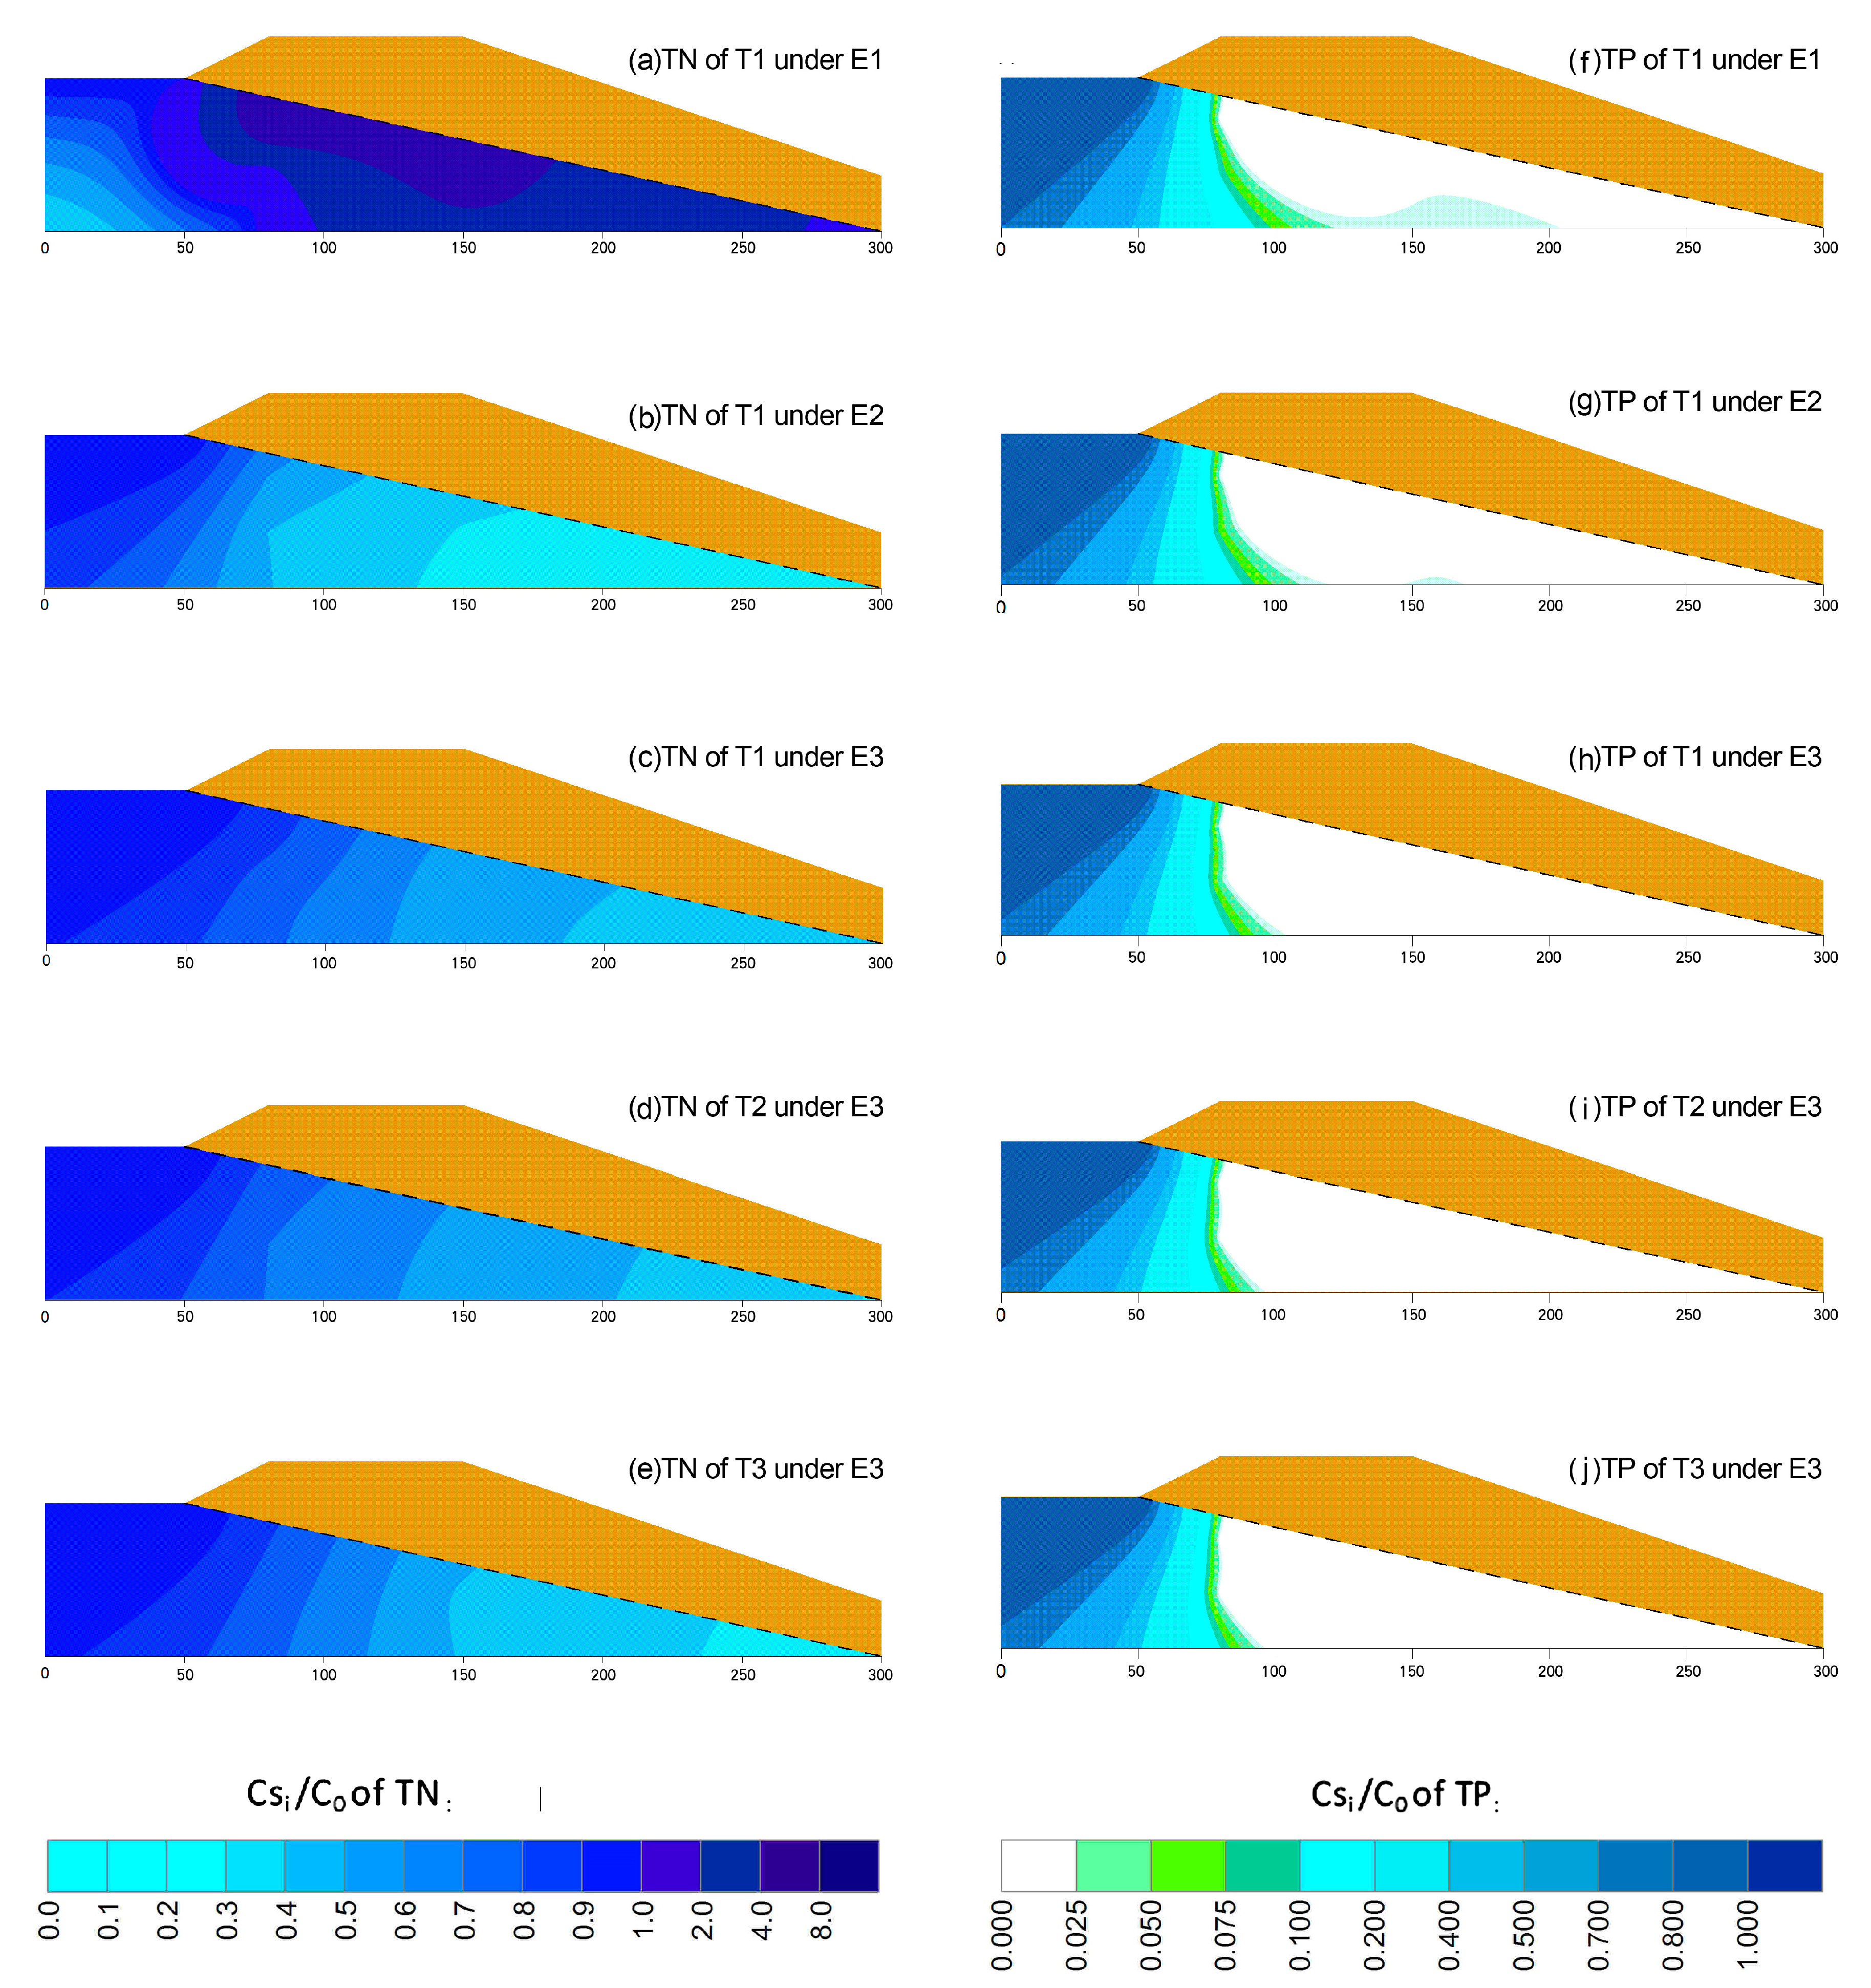
3.3. Pollutant Transport Distribution in the Embankment
Pollutant transport distribution in the groundwater through the embankments is shown by the contour maps of the ratios of soil solution concertation (Csi) to inflow concentration (C0) (Figure 4a–j), in which pollutant distribution in soil water is not shown with the original soil parts being represented by orange color. These contour maps used the measured values at the S1–S6 solute concentration observation points (Figure 1) at 9 h after initial inflow and were drawn by Kriging method. The figures for T1 under different events were used to analyze the influence of inflow concentrations, such as Figure 4a–c, while the figures for different treatments under E3 were used to analyze the influence of the vegetative slopes, such as Figure 4c–e.
As Figure 4a–e show, TN ratios in T1 under E1 increased vertically with the approach to the groundwater table, while the ratios under E2 and E3 generally decreased both horizontally and vertically. The decrease gradient under E2 was bigger than under E3. Comparing TN distributions of the different treatments under E3, the decreased gradient became greater when the treatment changed from T1 to T3. Meanwhile, as Figure 4f–j show, TP ratios decreased in the horizontal direction in each treatment under every event. The values at 100 cm of the bank bottom were in the range of 0–0.075 and decreased not only from E1 to E3 but also from T1 to T3, indicating that the front third of the embankment played a major role in the reduction of TP in inflow water.
4. Discussions
4.1. Impact of Vegetative Slope on Water Flux
Water flow through riparian zones is an important connection between river or lake and surrounding environment. The hydraulic conductivity of water-facing slopes has been reported as a main factor in altering the water flow process of embankments [24,25], which explains why there was no significant difference (p > 0.1) in water flux between the three treatments because the hydraulic conductivities of the three slopes were similarly high.
Nonetheless, though the water flux ratios of the three treatments under each event differed little, the value for T2 was the highest, followed by T3 and T1. The difference in performance is probably because the evapotranspiration (ET) under different slope treatments was inconsistent, resulting in different soil moistures for each treatment at the beginning of inflow events. The mean summer ET rates in water-saturated soil are 3.8 mm·d−1 for centipede grass and 2.7 mm·d−1 for tall fescue, as reported in the review of turf grass evapotranspiration rates by Zhao et al. (2003) [26], while the mean ET rate of 14 days in summer is 4.5 mm·d−1 for bare land, as reported by Zhao et al. (2016) [27]. Similar performance was reported by Yang et al. (2012) [28], who found that the soil moisture content of grass covered is greater than that of clear tillage for most soil depths in their study on the hydro-ecological effects of vegetation measures of soil and water conservation.
4.2. Impact of Vegetation Slope on Pollutant Transport
The mechanisms of pollutant removal through soil include soil adsorption, microbial fixation, and vegetation uptake. These mechanisms are influenced by soil properties, pH environment, vegetation types, topographic factors, and other factors [29,30]. However, different pollutants have different removal processes in soil, as do differences in embankments.
Our experiment showed that TN reductions in the embankments with the centipede grass and tall fescue slopes were better than for in the bare slope when polluted water flowed through the banks (Table 4, Figure 2a and Figure 3a). Combing the results of the study by Yong et al. (2015) [31], which analyzed nitrogen transport in lakeshores covered by three different slope revetment materials (bare, lime and concrete) under 10 mg·L−1 inflow concentration, we can see that the nitrogen removal ability of lakeshore banks was increased by vegetative slopes but decreased by slopes covered by revetment material when compared to that under bare slopes. Moreover, the mass reductions in this experiment—T2 and T3 compared with T1 increased 14.2% and 24.9% under E1, 7.6% and 20.8% under E2, and 2.1% and 4.2% under E3, respectively—show that the advantages of vegetation slopes on nitrogen removal decreased with increased inflow concentration. The tall fescue slope performed better than the centipede grass slope under all events. Tang et al. (2009) also found that different vegetation types have different effects on the nitrogen removal and the tall fescue could be seen as one priority grass type for riparian zones during runoff when simulating agriculture non-point pollutions and rainfall characteristics in Shanghai [32]. This tells us that slope vegetation has positive effects on nitrogen removal, but the choice and allocation of vegetation remains important.
On the other hand, whether for reduction or for the transport distribution of TP, there were no significant differences between the three banks according to our analysis, which is probably a function of the short experimental period. Similar performances were observed by Zaimes et al. (2008), which found few significant soil TP differences among regional riparian land-uses during a 3–5 year observation period [33]. Additionally, the reductions of TP in this experiment were high (all above 90%) and most removal happened in the front third of banks (Figure 2b, Figure 3b and Figure 4f–j). However, it cannot simply be assumed that high phosphorus reduction will persist indefinitely, because the existence of the equilibrium P concentration (EPC0) will result in the riparian zone becoming a P sink for a certain period and becoming a source of phosphorus over time once the soil phosphorus content reaches EPC0. Furthermore, unlike nitrogen, there are no biogeochemical transformations for P and the most important reduction method is plant absorption, which takes a long time [34]. Fortunately, Schroeder et al. (2008) found EPC0 could be increased by vegetation strips, but it is also important to test the P-sorption properties when assessing zone effectiveness for P retention [35]. Therefore, we should continue to observe the effectiveness of vegetative slopes on phosphorus removal.
5. Conclusions
Embankments are important exchange zones connecting lake or river water with surrounding groundwater. The understanding of water and pollutant transport through this is of great significance to protect the environment of these areas. In this study, simulated experiments in large soil boxes were used to evaluate water flux ratios and pollutant reductions through embankments and the effects of slope treatments for different banks. The results show that banks with partial natural slopes are not only effective zones for the exchange between surrounding water and lake water but also perform well in retarding pollutants discharge into lake water. The water flux ratios of the three treatments were relatively stable under total inflow events and were all higher than 80%, except for T3 under E3 (78%). On the removal of nitrogen in the inflow water, the vegetative slopes were better than the bare slope under all events, and T3 (the tall fescue slope) had the best performance. The benefits of vegetation slopes decreased with increasing inflow concentration. Therefore, vegetation slope cannot serve as the only way to protect lake water from pollutants in the face of more serious non-point pollution. For phosphorus removal, there were no significant differences between the three treatments; the reductions were all high (above 90%), with most loads remaining in the front third of the banks. However, more long-term observation is needed to see whether the high removal of phosphorus can continue. The results of this laboratory simulation experiment provide a quantitative scientific basis for the actual layout of improving embankment ecological functions.
Acknowledgments
This study was funded by the National Nature Science Foundation of China (NSFC) (No. 51579069, No. 41471069), the 111 Project (No. B12032), and the Water Resource Science Project of Jiangxi Province (No. KT201507). Special thanks to the Jiangxi Eco-Science Park of Soil and Water Conservation for the use of their laboratory facilities.
Author Contributions
Zhanyu Zhang, Liting Sheng, Jihong Xia and Jie Yang conceived and designed the experiments; Liting Sheng, Dan Tang and Xiao-an Chen performed the experiments; Liting Sheng analyzed the data and wrote the paper. Zhanyu Zhang and Jihong Xia reviewed this paper.
Conflicts of Interest
The authors declare no conflict of interest.
References
- Duchemin, M.; Hogue, R. Reduction in agricultural non-point source pollution in the first year following establishment of an integrated grass/tree filter strip system in southern quebec(canada). Agric. Ecosyst. Environ. 2009, 131, 85–97. [Google Scholar] [CrossRef]
- Kong, L.; Zhang, Z.; Zhu, L. Review of the trends in the study of non-point source nitrogen in hydrological processes on farmland over irrigation district. Adv. Water Sci. 2010, 21, 853–860. [Google Scholar]
- Maruani, T.; Amit-Cohen, I. The effectiveness of the protection of riparian landscapes in israel. Land Use Policy 2009, 26, 911–918. [Google Scholar] [CrossRef]
- Howarth, R.; Chan, F.; Conley, D.J.; Garnier, J.; Doney, S.C.; Marino, R.; Billen, G. Coupled biogeochemical cycles: Eutrophication and hypoxia in temperate estuaries and coastal marine ecosystems. Front. Ecol. Environ. 2011, 9, 18–26. [Google Scholar] [CrossRef]
- Xia, J.; Yan, Z. Advances in research of ecological riparian zones and its trend of development. J. Hohai Univ. Nat. Sci. 2004, 32, 252–255. [Google Scholar]
- Lee, K.H.; Isenhart, T.M.; Schultz, R.C. Sediment and nutrient removal in an established multi-species riparian buffer. J. Soil Water Conserv. 2003, 58, 1–8. [Google Scholar]
- Schneider, R.L.; Negley, T.L.; Wafer, C. Factors influencing groundwater seepage in a large, mesotrophic lake in new york. J. Hydrol. 2005, 310, 1–16. [Google Scholar] [CrossRef]
- Shaw, B.R.; Radler, B.T.; Haack, J. Exploring the utility of the stages of change model to promote natural shorelines. Lake Reserv. Manag. 2011, 27, 310–320. [Google Scholar] [CrossRef]
- Li, M.H.; Eddleman, K.E. Biotechnical engineering as an alternative to traditional engineering methods—A biotechnical streambank stabilization design approach. Landsc. Urban Plan. 2002, 60, 225–242. [Google Scholar] [CrossRef]
- Li, X.P.; Zhang, L.Q.; Zhang, Z. Soil bioengineering and the ecological restoration of riverbanks at the airport town, Shanghai, China. Ecol. Eng. 2006, 26, 304–314. [Google Scholar] [CrossRef]
- Xinjun, W.; Jirun, L.U.O. A preliminary study of ecological embankment construction for urban river restoration. J. Fudan Univ. Nat. Sci. 2006, 45, 120–126. [Google Scholar]
- Fernandes, J.P.; Guiomar, N. Simulating the stabilization effect of soil bioengineering interventions in mediterranean environments using limit equilibrium stability models and combinations of plant species. Ecol. Eng. 2016, 88, 122–142. [Google Scholar] [CrossRef]
- Ostendorp, W. New approaches to integrated quality assessment of lakeshores. Limnologica 2004, 34, 160–166. [Google Scholar] [CrossRef]
- Xia, J.; Lin, L.; Lin, J.; Nehal, L. Development of a gis-based decision support system for diagnosis of river system health and restoration. Water 2014, 6, 3136–3151. [Google Scholar] [CrossRef]
- Jing, C.A.I.; Xiaoping, L.I.; Xiaohua, C. The effects of ecological riverbank slopes on surface runoff pollution control. Acta Sci. Circumst. 2008, 28, 1326–1334. [Google Scholar]
- Wu, Y.; Lu, X.; Zhong, Z.; Shi, J.; Xu, W. Influencing factors of nitrogen removal from stream water using special riverine ecosystem. J. Cent. South Univ. Sci. Technol. 2011, 42, 539–545. [Google Scholar]
- Gou, W.; Bai, S.; Zhang, X.; Gan, Y. Progress of centipedegrass on genetic diversity and application. Grassl. China 2002, 24, 48–53. [Google Scholar]
- Shiono, T.; Haraguchi, N.; Miyamoto, K.; Shinogi, Y.; Miyamoto, T.; Kameyama, K. Evaluation of strips of centipede grass for sediment load reduction. Water Sci. Technol. 2008, 58, 2347–2352. [Google Scholar] [CrossRef] [PubMed]
- Xu, S.; Li, J.; Zhao, D. Research advances in physiological ecological and biochemical characteristics of festuca arundinacea. Acta Prataculturae Sin. 2004, 13, 58–64. [Google Scholar]
- Li, G.; Liu, X.; Han, M.; Hou, L.; Sang, N. Selecting tolerant grass seedlings and analyzing the possibility for using aged refuse as sward soil. Ecotoxicol. Environ. Saf. 2010, 73, 620–625. [Google Scholar] [CrossRef] [PubMed]
- Zhang, Z.-Y.; Kong, L.-L.; Zhu, L.; Mwiya, R.M. Effect of drainage ditch layout on nitrogen loss by runoff from an agricultural watershed. Pedosphere 2013, 23, 256–264. [Google Scholar] [CrossRef]
- Zhang, Z.; Feng, G.; Kong, L.; Bakhtawar, W. Effect of irrigation methods on nitrogen and phosphorus loss by runoff in paddy field through ephemeral storm process. Fresenius Environ. Bull. 2016, 25, 3484–3492. [Google Scholar]
- Teng, C.; Wang, T.Q. SPSS Statistical Analysis, 8th ed.; Wuhan University Press: Wuhan, China, 2014; pp. 182–183. [Google Scholar]
- Lee, T.M. Effects of nearshore recharge on groundwater interactions with a lake in mantled karst terrain. Water Resour. Res. 2000, 36, 2167–2182. [Google Scholar] [CrossRef]
- Genereux, D.; Bandopadhyay, I. Numerical investigation of lake bed seepage patterns: Effects of porous medium and lake properties. J. Hydrol. 2001, 241, 286–303. [Google Scholar] [CrossRef]
- Zhao, B.; Chen, Z.; Hu, L.; Zhang, F. Turfgrass evapotranspiration: A review. Acta Ecol. Sin. 2003, 23, 148–157. [Google Scholar]
- Zhao, W.; Ma, H.; Yu, W.; Dou, P. Effect of different mulching modes on soil moisture evaporation. J. Drain. Irrig. Mach. Eng. 2016, 34, 539–544. [Google Scholar]
- Yang, J.; Mo, M.; Song, Y.; Chen, X. Hydro-ecological effects of citrus land under vegetation measures of soil and water conservation in red-soil slope. Resour. Environ. Yangtze Basin 2012, 21, 994–999. [Google Scholar]
- Mayer, P.M.; Reynolds, S.K., Jr.; McCutchen, M.D.; Canfield, T.J. Meta-analysis of nitrogen removal in riparian buffers. J. Environ. Qual. 2007, 36, 1172–1180. [Google Scholar] [CrossRef] [PubMed]
- Morel, C.; Tunney, P.; Plenet, D.; Pellerin, S. Transfer of phosphate ions between soil and solution: Perspectives in soil testing. J. Environ. Qual. 2000, 29, 50–59. [Google Scholar] [CrossRef]
- Li, Y.; Simunek, J.; Zhang, Z.; Huang, M.; Ni, L.; Zhu, L.; Hua, J.; Chen, Y. Water flow and nitrate transport through a lakeshore with different revetment materials. J. Hydrol. 2015, 520, 123–133. [Google Scholar] [CrossRef]
- Tang, H.; Huang, S.F.; Wang, M.; Zhou, H.Y.; Chen, H.J. Removal of runoff pollution by different grass-buffers. Enuivon. Sci. Technol. 2009, 32, 109–112. [Google Scholar]
- Zaimes, G.N.; Schultz, R.C.; Isenhart, T.M. Total phosphorus concentrations and compaction in riparian areas under different riparian land-uses of iowa. Agric. Ecosyst. Environ. 2008, 127, 22–30. [Google Scholar] [CrossRef]
- Dorioz, J.M.; Wang, D.; Poulenard, J.; Trevisan, D. The effect of grass buffer strips on phosphorus dynamics—A critical review and synthesis as a basis for application in agricultural landscapes in france. Agric. Ecosyst. Environ. 2006, 117, 4–21. [Google Scholar] [CrossRef]
- Schroeder, P.D.; Kovar, J.L. Comparison of the phosphorus sorption characteristics of a conservation reserve buffer and an adjacent crop field. Commun. Soil Sci. Plant Anal. 2008, 39, 2961–2970. [Google Scholar] [CrossRef]
Figure 1.
Schematic of the experimental setup (S1–S9 for solute concentration observation points). All units are in cm.
Figure 1.
Schematic of the experimental setup (S1–S9 for solute concentration observation points). All units are in cm.

Figure 2.
Concentration reductions of (a) TN and (b) TP, for each treatment and event. The error bar represents the standard deviation of concentration reductions at different observation times.
Figure 2.
Concentration reductions of (a) TN and (b) TP, for each treatment and event. The error bar represents the standard deviation of concentration reductions at different observation times.

Figure 3.
Mass loads and reductions of (a) TN and (b) TP, during different treatments and events.

Figure 4.
Pollutant transport of (a–e) TN, and (f–j) TP, in the groundwater of embankments under different inflow events and treatments at 9 h after the initial inflow. The dashed line indicates the groundwater table. The unit for the axis is in cm.
Figure 4.
Pollutant transport of (a–e) TN, and (f–j) TP, in the groundwater of embankments under different inflow events and treatments at 9 h after the initial inflow. The dashed line indicates the groundwater table. The unit for the axis is in cm.

Table 1.
Physical and chemical properties of soil.
| Characteristics | Mean | SD |
|---|---|---|
| Soil particle size distribution (%) | ||
| Sand (0.05–2 mm) | 14.8 | 0.2 |
| Silt (0.002–0.05 mm) | 59.0 | 2.8 |
| Clay (0–0.002 mm) | 26.2 | 1.8 |
| Initial content of (mg·kg−1) | ||
| Total phosphorus | 148.6 | 33.1 |
| Total nitrogen | 334.6 | 74.5 |
| Saturated hydraulic conductivity (cm·min−1) | ||
| Subject layer of 1.30 g·cm−3 | 0.208 | 0.068 |
| Silt layer of 1.40 g·cm−3 | 0.061 | 0.002 |
Table 2.
Description of the variables in the experiment.
| Code | Description |
|---|---|
| T1 | simulated riparian bank with bare slope |
| T2 | simulated riparian bank with slope covered by centipede grass, about 95% coverage finally |
| T3 | simulated riparian bank with slope covered by tall fescue grass, about 70% coverage finally |
| E1 | inflow event 1 with pollute water of 2.0 mg·L−1 TN and 0.4 mg·L−1 TP |
| E2 | inflow event 2 with pollute water of 10.0 mg·L−1 TN and 2.0 mg·L−1 TP |
| E3 | inflow event 3 with pollute water of 20.0 mg·L−1 TN and 4.0 mg·L−1 TP |
Table 3.
Leachate volumes and water flux rates of the embankments under the three inflow events.
| Event | T1 | T2 | T3 | |||
|---|---|---|---|---|---|---|
| LV 1 (L) | (%) | LV (L) | (%) | LV (L) | (%) | |
| E1 | 390 | 78.0 | 412 | 82.4 | 405 | 81.0 |
| E2 | 412 | 84.4 | 457 | 95.2 | 415 | 83.0 |
| E3 | 415 | 85.0 | 451 | 93.8 | 416 | 83.2 |
| Mean | 406 | 81.2 | 440 | 88.0 | 412 | 82.4 |
| CV 2 (%) | 3.4 | -- | 5.6 | -- | 1.5 | -- |
Notes: 1 LV: the total leachate volume; 2 CV: the variation coefficients of leachate volume of the three events.
Table 4.
Inflow and leachate TN concentrations at different sampling times under the three events.
| Event | Treatment | Inflow (mg·L−1) | TN Concentration (mg·L−1) | |||||||
|---|---|---|---|---|---|---|---|---|---|---|
| Time (h) | ||||||||||
| 0 | 2 | 4 | 6 | 8 | 10 | 12 | Mean | |||
| E1 | T1 | 2.0 | 2.43 | 2.16 | 2.07 | 2.07 | 2.29 | 2.44 | 1.80 | 2.18A 1 a 2 |
| T2 | 1.78 | 1.78 | 1.79 | 1.62 | 1.67 | 1.61 | 1.58 | 1.69Ba | ||
| T3 | 2.22 | 1.97 | 186 | 1.97 | 1.78 | 1.58 | 1.48 | 1.84Ba | ||
| E2 | T1 | 10.0 | 5.15 | 4.07 | 3.97 | 3.99 | 3.85 | 3.82 | 3.89 | 4.11Ab |
| T2 | 4.45 | 3.60 | 3.54 | 3.20 | 2.91 | 2.80 | 2.98 | 3.36Bb | ||
| T3 | 4.77 | 4.21 | 3.42 | 3.11 | 2.89 | 2.75 | 2.68 | 3.40Ab | ||
| E3 | T1 | 20.0 | 12.34 | 11.93 | 10.91 | 10.72 | 10.17 | 10.37 | 10.46 | 11.00Ac |
| T2 | 11.71 | 11.67 | 11.35 | 11.53 | 11.25 | 10.71 | 10.80 | 11.15Ac | ||
| T3 | 11.54 | 11.44 | 11.49 | 11.21 | 10.71 | 10.79 | 10.76 | 10.96Ac | ||
Notes: 1 Different capital letters (such as A and B or B and C) indicate that the difference is significant at or above 95% level for pairwise comparisons of three treatments under a particular event; 2 Different lowercase letters (such as a and b or b and c) indicate that the difference is significant at or above 95% level for pairwise comparisons of three events for a particular treatment.
Table 5.
Inflow and leachate TP concentrations at different sampling times under the three events.
| Event | Treatment | Inflow (mg·L−1) | TP Concentration (mg·L−1) | |||||||
|---|---|---|---|---|---|---|---|---|---|---|
| Time (h) | ||||||||||
| 0 | 2 | 4 | 6 | 8 | 10 | 12 | Mean | |||
| E1 | T1 | 0.4 | 0.009 | 0.005 | 0.027 | 0.009 | 0.071 | 0.037 | 0.015 | 0.024A 1 a 2 |
| T2 | 0.007 | 0.053 | 0.033 | 0.007 | 0.045 | 0.003 | 0.001 | 0.021Ab | ||
| T3 | 0.057 | 0.005 | 0.027 | 0.017 | 0.047 | 0.017 | 0.029 | 0.028Ac | ||
| E2 | T1 | 2.0 | 0.004 | 0.001 | 0.004 | 0.002 | 0.001 | 0.057 | 0.090 | 0.023Ba |
| T2 | 0.013 | 0.001 | 0.009 | 0.040 | 0.044 | 0.024 | 0.015 | 0.021Bb | ||
| T3 | 0.062 | 0.001 | 0.010 | 0.003 | 0.036 | 0.085 | 0.092 | 0.041Bc | ||
| E3 | T1 | 4.0 | 0.012 | 0.003 | 0.002 | 0.011 | 0.013 | 0.026 | 0.011 | 0.011Ca |
| T2 | 0.015 | 0.025 | 0.001 | 0.005 | 0.002 | 0.048 | 0.012 | 0.015Cb | ||
| T3 | 0.026 | 0.054 | 0.085 | 0.012 | 0.001 | 0.014 | 0.039 | 0.033Cc | ||
Notes: 1 Different capital letters (such as A and B or B and C) indicate that the difference is significant at or above 95% level for pairwise comparisons of three treatments under a particular event; 2 Different lowercase letters (such as a and b or b and c) indicate that the difference is significant at or above 95% level for pairwise comparisons of three events for a particular treatment.
© 2017 by the authors. Licensee MDPI, Basel, Switzerland. This article is an open access article distributed under the terms and conditions of the Creative Commons Attribution (CC BY) license (http://creativecommons.org/licenses/by/4.0/).
Share and Cite
MDPI and ACS Style
Sheng, L.; Zhang, Z.; Xia, J.; Yang, J.; Tang, D.; Chen, X.-a. The Impact of Vegetative Slope on Water Flow and Pollutant Transport through Embankments. Sustainability 2017, 9, 1128. https://doi.org/10.3390/su9071128
AMA Style
Sheng L, Zhang Z, Xia J, Yang J, Tang D, Chen X-a. The Impact of Vegetative Slope on Water Flow and Pollutant Transport through Embankments. Sustainability. 2017; 9(7):1128. https://doi.org/10.3390/su9071128
Chicago/Turabian StyleSheng, Liting, Zhanyu Zhang, Jihong Xia, Jie Yang, Dan Tang, and Xiao-an Chen. 2017. "The Impact of Vegetative Slope on Water Flow and Pollutant Transport through Embankments" Sustainability 9, no. 7: 1128. https://doi.org/10.3390/su9071128
Note that from the first issue of 2016, this journal uses article numbers instead of page numbers. See further details here.