Article

A Hybrid Estimation of Distribution Algorithm for Multi-Objective Multi-Sourcing Intermodal Transportation Network Design Problem Considering Carbon Emissions

School of Business Administration, Northeastern University, Shenyang 110167, China
*
Author to whom correspondence should be addressed.
Sustainability 2017, 9(7), 1133; https://doi.org/10.3390/su9071133
Submission received: 18 April 2017 / Revised: 23 June 2017 / Accepted: 26 June 2017 / Published: 30 June 2017
(This article belongs to the Section Economic and Business Aspects of Sustainability)

Abstract

:
The increasing concern on global warming is prompting transportation sector to take into account more sustainable operation strategies. Among them, intermodal transportation (IT) has already been regarded as one of the most effective measures on carbon reductions. This paper focuses on the model and algorithm for a certain kind of IT, namely multi-objective multi-sourcing intermodal transportation network design problem (MO_MITNDP), in which carbon emission factors are specially considered. The MO_MITNDP is concerned with determining optimal transportation routes and modes for a series of freight provided by multiple sourcing places to find good balance between the total costs and time efficiencies. First, we establish a multi-objective integer programming model to formulate the MO_MITNDP with total cost (TTC) and maximum flow time (MFT) criteria. Specifically, carbon emission costs distinguished by the different transportation mode and route are included in the cost function. Second, to solve the MO_MITNDP, a hybrid estimation of distribution algorithm (HEDA) combined with a heterogeneous marginal distribution and a multi-objective local search is proposed, in which the from the Pareto dominance scenario. Finally, based on randomly generated data and a real-life case study of Jilin Petrochemical Company (JPC), China, simulation experiments and comparisons are carried out to demonstrate the effectiveness and application value of the proposed HEDA.

1. Introduction

As one of the most important logistics activities, freight transportation which happens throughout the whole production circulation process from material purchase to finished product sale is crucial to the economic growth and market trade. With the rapid growth of global purchasing, transportation has played an increasingly important role in world resource integrations. On the other hand, due to the downsides such as energy consuming and air pollution, transportation is always located at the crossroads of economic and environmental concerns. For example, as pointed by Environmental Protection Agency (USA), transportation is the second largest contributor of carbon emission, causing about 28% of the total emissions in US in the past years [1]. Accumulation of greenhouse gas in the atmosphere, especially CO2, has been a main source of global warming and attracts increasing concerns by different sectors [2]. For example, the European Commission announced that the major objective corresponds to transportation sector is to reduce the carbon emissions at least 60% of 1990 levels by 2050 [3]. In the past years, carbon emissions from other transportation modes have experienced a relatively slight decreasing while the road transportation is keeping a rapid growth. Road transportation is still the dominant mode in inland freight transportation system, and meanwhile it is also a carbon intensive mode which contributes two-thirds of total carbon emissions in transportation sector [4]. With the growth of transportation volume and economic, Zheng and Wang 2010 has forecasted that carbon emissions from the road freight transportation will keep a continual increase by 2020 globally [5]. In China, the current energy structure is dominated by coal (about 64%) and oil (about 18%) [2], which also has been seen as the hardest obstacle to the low-carbon transportation. In view of these, different measures and regulations have been established, such as developing new energy technologies, prompting green transportation equipment, issuing relevant laws, etc. According to Benjaafar et al., 2013 [6], mode selection and route design are of great importance for low-carbon transportation systems, which might be more significant than policies, regulations, laws established by national governments at different levels or international organizations. In this regard, intermodal transportation (IT) has been put on the agenda by many countries and regions, as well as been promoted as a highly desirable measure with respect to improving the resource, environment and ecology sustainability.
Unlike other conventional transportation patterns, in which the transportation modes are independently operated without any coordination, IT aims at integrating more than one mode together such that it can provide more flexible “door to door” service according to the personalized requirements of customers [7]. The optimization of IT is essentially to provide a satisfied solution for the intermodal transportation company with reducing transportation cost, transportation time and carbon emissions simultaneously. For carbon emissions reduction, it might be explained that the heavier emission modes are replaced by the lighter ones [8,9]. In general, there are three kinds of modes in IT, i.e., waterway, railway and road, and the former two usually contribute less carbon emissions than the latter. However, intermodal transportation systems have an intractable drawback that it is more likely to result in a larger transportation distance than under a single transportation mode [10]. Since the costs and carbon emissions are mainly from the transportation process, the increased transportation distance (under intermodal transportation situation) may not actually benefit the optimization of the whole transportation systems. Moreover, with the development of the diversified market, the transportation companies are faced with new challenges to meet different preferences as some customers expect a lower cost while some others focus on a fast delivery. In view of the aforementioned observations, the operating decision of IT is in fact a very complex issue. The complex transportation system and resource of freight, the preference of the customers and environmental sustainability (low carbon emissions) ought to be considered to some extent.
This paper focuses on the multi-objective multi-sourcing intermodal transportation network design problem (MO_MITNDP) with the aim to find a good trade-off between the transportation cost (TC), maximum flow time (MFT), and carbon emissions (CE). Among them, TC, MFT and CE are associated with economic, efficiency, and societal factors respectively. Furthermore, we have taken in account two kinds of technique constraints, i.e., constraints of transportation modes and constraints of each node’s capacity which are realistic existing to make our model closer to the real-life intermodal transportation situations. Besides, the constraint for each node’s capacity is also a strategy to balance the transportation pressure among the stations, leading to a better sustainability of the transportation system.
To formulate the MO_MITNDP, several sourcing places and a single destination are considered. Indeed, this framework is inspired by the well-known complexity of supply chains in the increasing global purchasing and manufacturing environments [11], which has been widely used in many practical transportation systems, such as petrochemical, steel, pharmaceutical industries, etc. The freight transportation company has acted as a freight integrator to transport freights from the sourcing places to the purchasing destination. On the whole, the overall intermodal transportation network is divided into several stages that consist of stations, ports or logistic centers, which are particularly grounded on the geographical characteristics and real intermodal infrastructure construction, such as business types and service radiant scopes. Meanwhile, it is assumed that the freights are irreversibly transported from the current stage to the following one without dismounting, which is also a typical assumption in the intermodal transportation problem (Steadieseifi et al., 2014) [12]. The crossing logistics are considered as the business handling capacity constraints for each node of a certain stage when different freights from the corresponding sourcing places are assembled in the same node in a period of time. These constraints are quite close to the real-life situations and significant for balancing the logistics pressures among the stations, as well as reducing the idle transportation resources. In other words, such constraints can disperse the transportation pressure in the station of high-density traffic to the others belong to the same stage, which will further alleviate the city’s traffic congestion and air pollution. The aim of this paper is to determine both the route and mode selection for freight derived from different sourcing places. The main contributions of this paper are listed as follows.
Firstly, the MO_MSITNDP is formulated as a multi-objective integer programming model. As for the network structure, the entire intermodal transportation network is divided into several stages according to the geography and social factors. Meanwhile, the capacity constrain of each intermediate node is considered to make the solution reliable in practice and balance the logistics pressure.
Secondly, a modified estimation of distribution algorithm (EDA), namely hybrid EDA (HEDA) is proposed to address the mathematical model, which is the first time to apply EDA-based meta-heuristic for MO_MITNDP. Based on the features of MO_MITNDP, we specially design the improvement strategies to enhance the effectiveness and robustness of the proposed method in multi-objective handling capacity.
Thirdly, we perform a series of numerous experiments and comparisons based on randomly generated instances to evaluate the effectiveness of HEDA. To further demonstrate the potential application value of HEDA, a case study of Jilin Petrochemical Company (JPC), China, is carried out such that we can obtain the related management insights from the real-world perspectives.
The remainder of the paper is organized as follows. Section 2 reviews the relevant literature. In Section 3, the mathematical model of MO_MITNDP is described in detail. Following a detailed description of the proposed HEDA in Section 4, we conduct numerous experiments and comparisons with other algorithms in Section 5, and a case study analysis is performed as well. Finally, conclusions together with future works are presented in Section 6.

2. Literature Review

Over the past decades, the IT has attracted many attentions as a cost-effectiveness and environment sustainability alternatives. The existing works can be classified as strategy planning level (Meng and Wang, 2011 [13]; Limbourg and Jourquin, 2009 [14]), tactical planning level (Lam and Gu, 2016 [7]; Verma et al., 2012 [15]), and operational planning level (Francesco et al., 2013 [16]; Bandeira et al., 2009 [17]) according to the decision horizon of the planning problems, and more works can refers to SteadieSeifi et al., 2014 [12]. A majority of the works on ITs consider the cost or time as the single objective and discuss cost-saving or time-efficiency ability compared to the unimodal freight transportation (Bouchery and Fransoo, 2014 [3]). However, the published works regarding cost and time as the bi-objective optimization problem or multiple objectives are limited. Yang et al., 2011 [18] presented a multi-objective optimization model considering the total cost, transportation time and time variability to elevate the competitiveness of 36 candidate routes from China to Indian Ocean. Resat and Turkay, 2015 [19] established a bi-objective mixed-integer programming model with minimizing the total cost and time to determine the transportation modes in the designed intermodal network. Domuta et al., 2012 [20] proposed a modified bi-objective Martines’ Algorithm to find the optimal route in the intermodal transportation network with the time window and the objective is to minimize the travel time and cost. Lam and Gu, 2016 [7] formulated the port hinterland intermodal transportation network design as a bi-objective optimization problem with minimizing the transit cost and time.
In view of the green logistics, carbon emissions have been an increasing concern in the transportation sector [7]. Nevertheless, few current studies consider carbon emissions in the field of intermodal transportation network. In order to estimate the trade-offs between the transportation cost and carbon emission in the intermodal network and show the modification of the mode and route choice with the changing of the trade-offs, Namseok et al., 2009 [21] developed a decision-support method using the multi-objective optimization. Rudi et al., 2016 [22] established a multi-commodity intermodal network flow model considering the in-transit inventory to make route choices. The carbon emission factor is considered in the objective function which is to minimize the total truckload with the transportation cost, time and carbon emission criteria. Demir et al., 2015 [23] used the sample average approximation method to solve the stochastic intermodal network design problem. The method is applied to provide solutions with the different combination of weights corresponding to the direct transportation, carbon emission-related and time-related cost in the objective function. Considering the cost and carbon emission optimization situations, Bouchery and Fransoo, 2014 [3] presented an intermodal network optimization model to provide decisions for both the terminal location and allocation while Lam and Gu, 2016 [7] studied the carbon emissions in the green intermodal network as a constraint with variable levels.
In fact, comparing with single objective, multi-objective optimization can made trade-offs for conflict sub-objectives to satisfy practical fields, which has received wider applications in decision making (Zheng et al., 2015) [2]. In addition, the increasing concerns on the environmental sustainability have promoted it a hotspot to reduce the carbon emission in transportation sector (Lee et al., 2017) [24]. In that regard, The MO_MITNDP considers the cost and time as the objectives, which could help to provide flexible solutions for the decision makers to satisfy the diversified market.
The generation of optimal routes is a crucial part of the intermodal transportation network and efficient routes can achieve great resources saving and improve the service quality (Kılıç and Gök, 2014) [25]. According to Verma and Verter, 2010 [26], the main contribution of rail-truck intermodal transportation is the reliability embodied in on-time delivery. The authors make the first attempt to develop a framework of rail-truck intermodal transportation for hazardous goods, in which the route selection is driven by the lead time from diversified customers. Considering the cooperation of inland terminals simulated by a discrete event model, An et al., 2010 [27] designed a service network for the intermodal barge transportation to select the best route with the goal to saving cost. Similarly, Braekers et al., 2013 [28] presented a decision support model for intermodal barge transportation network which involves a major seaport and several hinterland ports to determine the optimal shipping routes aiming to improving the overall profits. Ishfaq and Sox, 2012 [29] integrated an operation model and a location-allocation model for intermodal hub. In their designed hub logistics network, arcs that represent different transportation modes are alternative to increase cost benefits. In this paper, the intermediate nodes in the network are the first time to be divided into several stages grounded on the geographical characteristic and real intermodal infrastructure construction.
The ITs faced by the freight integrator is generally a NP-hard problem in which the routes selection, modes combination, terminal location or container scheduling are involved (Li et al., 2015) [30] and huge computational efforts are needed. The meta-heuristic algorithms have an outstanding performance in the combinatorial optimization and have been successfully used in the intermodal freight transportation optimization. Kılıç and Gök, 2014 [25] formulated the problem as an initial route programming for urban transportation network, and a route generation algorithm is designed to find solutions with objectives reflecting the interests of stakeholders. To handle the inland container transportation problem considering hard time constraints, Sterzik and Kopfer, 2013 [31] established a comprehensive model which contains vehicle routing and empty repositioning and a Tabu Search heuristic is used to minimizing the total operation time. Nossack and Pesch, 2013 [32] addressed a truck scheduling problem with time window in intermodal container transportation by a two-stage heuristic. The first stage is route construction heuristic which determines a feasible initial solution for the problem; the second stage is route improvement heuristic which improves solution quality by a neighborhood operator. Genetic algorithm is used in Zhang et al., 2015 [33] to effectively save time and cost.
As a novel swarm intelligence algorithm based on probability model, EDA has been a research hotspot in the area of intelligent computing (Wang et al., 2012 [34]; Wang et al., 2016 [35]). Contrast with genetic algorithm, there is no mutation and crossover operators for EDA, whereas a competitive mechanism is adopted in EDA to estimate the probability model according to excellent individuals found in the search process. Thereafter, the new population can be generated through sampling the estimated probability model. Although EDA has been successfully used in various combinatorial optimization problems, there is no research works on EDA for ITs. Essentially, using EDA-based methods to solve MO_MSITNDP is equivalent to confirming the matching probability of the transportation modes and intermediate nodes associated with given freight. Finally, the optimal or approximate optimal relationship will be found. In this regard, this paper engages in raising the EDA-based solution method for dealing with MO_MSITNDP.

3. Problem Description and Model Formulation

3.1. Formulation of Proposed Mathematical Model

MO_MSITNDP considers multiple sourcing places and a single purchasing destination. Denote N the total number of sourcing places and M the total number of stages, then the scale of MO_MSITNDP can be defined as N × M . As shown in Figure 1, there are totally M + 1 predefined transportation stages (i.e., stage   0 ,   stage   1 , ,   stage   M ) in the network, where stage   0 is a virtual point without intermediate nodes. The transport request A 1 , , A N deriving from the corresponding sourcing places 1 , , N will be responded by transporting the freights from segment 1 to M (i.e., destination B). During the transportation process, the transport requests A i   ( i = 1 , N ) are processed independently without dismounting or consolidation. In this case, there exist crossing logistics in the intermediate nodes owing to the share of intermodal terminal, and the capacity constraint of each node must be considered. All the freights must be irreversibly transported from the stage 1 to M in sequence. The changes of transportation modes only occur on the stages rather than transportation process. Next, we will propose the multi-objective integer programming model of MO_MSITNDP.
In our model, the objective functions to be minimized consist of the total cost (TTC) and maximum flow time (MFT). Furthermore, the TTC includes three parts, i.e., transportation cost, transfer cost of transportation mode and carbon emissions cost, thus our solutions can reflect the economic benefit, time efficiency and environmental sustainability (society) criteria. The MFT is the maximum completion time of all freights, so a lower MFT indicates a higher efficiency of the whole systems. Accordingly, our ultimate objective is to find a good trade-off among the economy, efficient and sustainability sub-objectives, and these three criteria are usually in conflict with each other. The optimization of IT is essentially to provide a satisfied solution for the intermodal transportation company with reducing the transportation cost, transportation time and carbon emissions simultaneously.
Parameters:
: An infinite number;
Q i : Amount of freight from sourcing place i, i { 1 , , N } ;
R j : Set of available nodes of stage j, j { 1 , , M 1 } ;
R 0 : Available nodes of stage 0 and | R 0 | =N;
R M : Available node of stage M and | R M | =1;
S j : Set of available transportation modes of stage j, j { 1 , , M } ;
W k j : The handling capacity for the kth node of stage j, j { 1 , , M - 1 } , k { 1 , , | R j | } , W 10 , W 20 , , W N 0 , and   W 1 M = ;
e i w ( j 1 , j , l , h ) : Carbon emission cost of freight i from the lth node in stage j 1 to the hth node in stage j under the transportation mode w, i { 1 , , N } , w S j , l R j 1 , h R j ;
C i w ( j 1 , j , l , h ) : Transportation cost of freight i from the lth node in stage j 1 to the hth node in stage j under the transportation mode w, i { 1 , , N } , w S j , l R j 1 , h R j ;
T i w ( j 1 , j , l , h ) : Transportation time of freight i from the lth node in stage   j 1 to the hth node in stage j under the transportation mode w, i { 1 , , N } , j { 1 , , M } , w S j , l R j 1 , h R j ;
ξ i w , v ( j , k ) : Switch cost of freight i from transportation mode w to v for the kth node of stage j, i { 1 , , N } , j { 1 , , M 1 } , w S j , v S j + 1 , k = 1 , , | R j | ;
τ i w , v ( j , k ) : Switch time of freight i from transportation mode w to v for the kth node of stage j, i { 1 , , N } , j { 1 , , M 1 } , w S j , v S j + 1 , k = 1 , , | R j | ; and
U w ( j 1 , j ) = { 1 if   transportation   mode   w   exists   between   stage   j 1   and   stage   j 0 otherwise .
Decision variables:
x i w ( j 1 , j , l , h ) = { 1 if   transportation   mode   w   is   selected   for   freight   i from   the   l th   tnode   in   stage   j - 1   to   the   h th   node   in   stage   j 0 otherwise ;
y i w , v ( j , k ) = { 1 if   transportation   mode   is   transfered   from   w   to   v for   freight   i   in   the   k th   node   of   stage   j 0 otherwise ;
s t i j the start time at the stage j for freight i; and
c t i j the leave time at the stage j for freight i.
Based on the aforementioned definitions, we detail the mathematical model of MO_MSITNDP as follows.
min f 1 = i { 1 , , N } { j { 1 , , M } ( w S j l R j 1 h R j ( C i w ( j 1 , j , l , h ) x i w ( j 1 , j , l , h ) + e i w ( j 1 , j , l , h ) x i w ( j 1 , j , l , h ) ) ) + j { 1 , , M 1 } k R j w S j v S j + 1 ξ i w , v ( j , k ) y i w , v ( j , k ) } ;
min f 2 = max i N { j { 1 , , M } w S j l R j 1 h R j T i w ( j 1 , j , l , h ) x i w ( j 1 , j , l , h ) + j { 1 , , M 1 } k R j w S j v S j + 1 τ i w , v ( j , k ) y i w , v ( j , k ) } ;
s. t.
j { 1 , , M } w S j l R j 1 h R j x i w ( j 1 , j , l , h ) = 1 ;   i { 1 , , N } ;
k R j w S j v S j + 1 y i w , v ( j , k ) = 1 ;     i { 1 , , N } , j { 1 , , M 1 } ;
i { 1 , , N } w S j l R j 1 x i w ( j 1 , j , l , h ) Q i W h j ;   j { 1 , , M 1 } , h R j ;
x i w ( j , j + 1 , g , l ) + x i v ( j + 1 , j + 2 , l , h ) 2 y i w , v ( j + 1 , k ) ; i { 1 , , N } , j { 0 , , M 2 } , k R j + 1 , w S j + 1 , v S j + 2 ;
x i w ( j , j + 1 , l , h ) U w ( j , j + 1 ) ;   i { 1 , , N } ; j { 0 , , M 1 }   ,   w S j + 1 ;
s t i j = c t i , j 1 + w S j l R j 1 h R j T k w ( j 1 , j , l , h ) x i w ( j 1 , j , l , h ) ; i { 1 , , N } , j { 1 , , M } , k R j ;
c t i j = s t i j + k R j w S j v S j + 1 τ i w , v ( j , l ) y i w , v ( j , k ) ;   i { 1 , , N } , j { 1 , , M 1 } ;
s t i j c t i , j 1 ;   i { 1 , , N } , j { 1 , , M } ;
x i w ( j 1 , j , l , h ) { 0 , 1 } ;   i { 1 , , N } , j { 1 , , M } , l R j 1 , h R j , w S j ;
y i w , v ( j , k ) { 0 , 1 } ; i { 1 , , N } , j { 1 , , M 1 } , k R j , w S j , v S j + 1 ;
z i j k { 0 , 1 } ; i { 1 , , N } , j { 0 , , M 1 } , k R j ;
s t i j 0 ; i { 1 , , N } , j { 1 , , M } ;
c t i j 0 ; i { 1 , , N } , j { 0 , , M 1 } .
Equations (1) and (2) are the objective functions. Equation (1) is to minimize the TTC which includes transportation cost, transfer cost of transportation mode, and carbon emission cost, whereas Equation (2) minimizes the MFT. Constraint (3) ensures that only one transportation mode can be chosen for two adjacent stages. Constraint (4) ensures the mode transferring only can be executed at the intermodal terminal. Constraint (5) represents the capacity restrictions for each node with respect to given stage. Constraint (6) is the transportation continuity constraints for all routes. Constraint (7) is the transportation mode constraints between two adjacent stages associated with given freight and nodes. Equations (8) and (9) are the definitions of arriving times and departing times with regard to given freight, stages, and selected nodes. Constraint (10) implies that the overall structure of MO_MSITNDP is a directed acyclic graph from the time perspective. Constraints (11)–(15) are the ranges of values for variables.

3.2. Modification of Established Model

In view of the aforementioned model, the MO_MSITNDP is essentially a bi-objective optimization problem with capacity constraints, i.e., Constraint (5). Thus, we should introduce relevant constraints handling techniques into HEDA to realize its global search. Unlike single objective optimization problem, the traditional penalty function method may be unusable for multi-objective optimization scenario. In addition, since the solution representation of MO_MSITNDP is a matrix which combines transportation modes with intermediate nodes together, the repair-based constraints handling techniques are more likely to result in a lower efficiency of computation, especially for large scale or strong constraints conditions. Owing to such intractability, we apply the multi-objective-based constraints handling approach [36,37], in which the degree of constraint violation is regarded as an additional objective function. In this regard, the Constraints (5) can be transformed to the third objective function, which denotes the total degree of constraint violation with regard to all intermediate nodes as shown by Equation (16):
min f 3 = j { 1 , , M 1 } { max h R j { i { 1 , , N } w S j l R j 1 x i w ( j 1 , j , l , h ) Q i W h j , 0 } } ;
Afterwards, the modification of the established model can be given as follows:
min { f 1 , f 2 , f 3 } .
where the first objective functions f 1 and f 2 are the same as Equations (1) and (2). Except for removing Constraint (5), other constraints of this modified version keep unchanged as the previous model.
In this work, HEDA deals with the modified version model in scene of the Pareto dominance. The criteria f 1 and f 2 are the ultimate optimization objective associated with the MO_MSITNDP, whereas the additionally introduced objective function f 3 is utilized to guide the search direction from the feasibility perspectives.

4. HEDA for MO_MSITNDP

4.1. Solution Representation

Since the intermediate nodes and transportation modes need to be determined simultaneously, we specially design a matrix π = [ π i j ]   ( i = 1 , , N ; j = 1 , , 2 M 1 ) to represent MO_MSITNDP with the scale N × M , in which the element π i j denotes the index of selected node (if j mod 2 = 0 ) or transportation mode (if j mod 2 0 ) of the i th sourcing place. In addition, since freight i ( i = 1 , , N ) need to undergo M nodes and M segments in turns after departing from its sourcing places, the sourcing places (i.e., stage 0) and the common destination (i.e., stage M) are not necessary to be considered. Obviously, if j mod 2 = 0 π i j | R j / 2 | , then π i j denotes the selected intermediate node of freight i in stage j / 2 , for i = 1 , , N ; j = 1 , , 2 M 1 . Similarly, π i j denotes the selected transportation mode of freight i in segment ( j + 1 ) / 2 , if j mod 2 0 π i j | S ( j + 1 ) / 2 | , for i = 1 , , N ; j = 1 , , 2 M 1 . Here, we take a simple example with the size N × M = 4 × 5 to illustrate this solution representation approach. Considering the matrix
π i j = [ 3 4 3 1 2 4 1 4 2 4 2 2 1 1 2 2 2 2 2 2 4 1 2 3 1 3 1 3 2 3 2 ] N × ( 2 M 1 ) = 4 × 9
which indicates that freight 1 selects the transportation mode 1, 2, 1, 1 and 2 from segment 1 to 5 (marked by circles) and selects the intermediate node 3, 4, 3 and 1 in terms of stage 1 to 4, and so on.

4.2. Multi-Objective Handling Method

To store the non-dominated solutions (i.e., approximate Pareto set), a Pareto archive ( PA ) is introduced. For a multi-objective optimization problem with K criteria, if we say that π 1   dominates π 2 (i.e., π 1 π 2 ) then both of the following conditions should be satisfied simultaneously: [38] (1) f k ( π 1 ) f k ( π 2 ) , for k = 1 , , K , and (2) it has at least one l { 1 , , K } that f l ( π 1 ) < f l ( π 2 ) . Let P S denote the population size of HEDA, N π i ( g e n ) ( i = 1 , 2 , , P S ) the i th individual in current population at generation gen, A C ( g e n ) the length of PA at generation gen, P π i ( g e n ) ( i = 1 , , A C ( g e n ) ) the i th non-dominated solution of PA at generation gen. The newly generated individual N π i ( g e n ) ( i = 1 , 2 , , P S ) will be added to PA if and only if it can dominate at least one solution in current PA , and, meanwhile, the solution that is dominated by newly generated individual will be removed from PA . Here, we propose the update procedure of PA as shown in Figure 2.

4.3. The Proposed Heterogeneous Probability Model and Update Mechanism

When using EDA to solve the discrete combinatorial optimization problems, the probability model is generally described as joint probability distribution function with independent random variables. Considering the inherent features of MO_MSITNDP, a heterogeneous marginal distribution law (HMDL) is put forward for serving as HEDA’s probability model, which is utilized to represent the distribution of promising solution regions. The probability model p r ( g e n ) can be formulated as follows:
Sustainability 09 01133 i001
where m a x S = max j { 1 , , M } { | S j | } is the maximum value of transportation modes, p s j i ( g e n ) is the probability of transportation mode s to be selected in the j th segment for the i th freight at generation gen, and r r j i ( g e n ) is the probability of selecting the r th node in stage j for the i th freight at generation gen.
Since there exists transportation mode constraint between stage j 1 and j (for j = 1 , , M ), the relate probability should be set to 0 if u w ( j 1 , j ) =0 (for j = 1 , , M , w = 1 , , m a x S ). Therefore, the probability model can be initialized as follows:
P i ( 0 ) = [ u 1 ( 0 , 1 ) u 1 ( 1 , 2 )   ⋮ u 1 ( M 1 , M ) u m a x S ( 0 , 1 ) u m a x S ( 1 , 2 )   ⋮ u m a x S ( M 1 , M ) ] [ 1 / | S 1 | 1 / | S 1 |   ⋮ 1 / | S 1 | 1 / | S 2 | 1 / | S 2 |   ⋮ 1 / | S 2 | 1 / | S M | 1 / | S M |  ⋮ 1 / | S M | ] m a x S × M , R i ( 0 ) = [ 1 / | R 1 | 1 / | R 1 | 1 / | R 1 | 1 / | R 2 | 1 / | R 2 | 1 / | R 2 | 1 / | R M | 1 / | R M | 1 / | R M | ] .
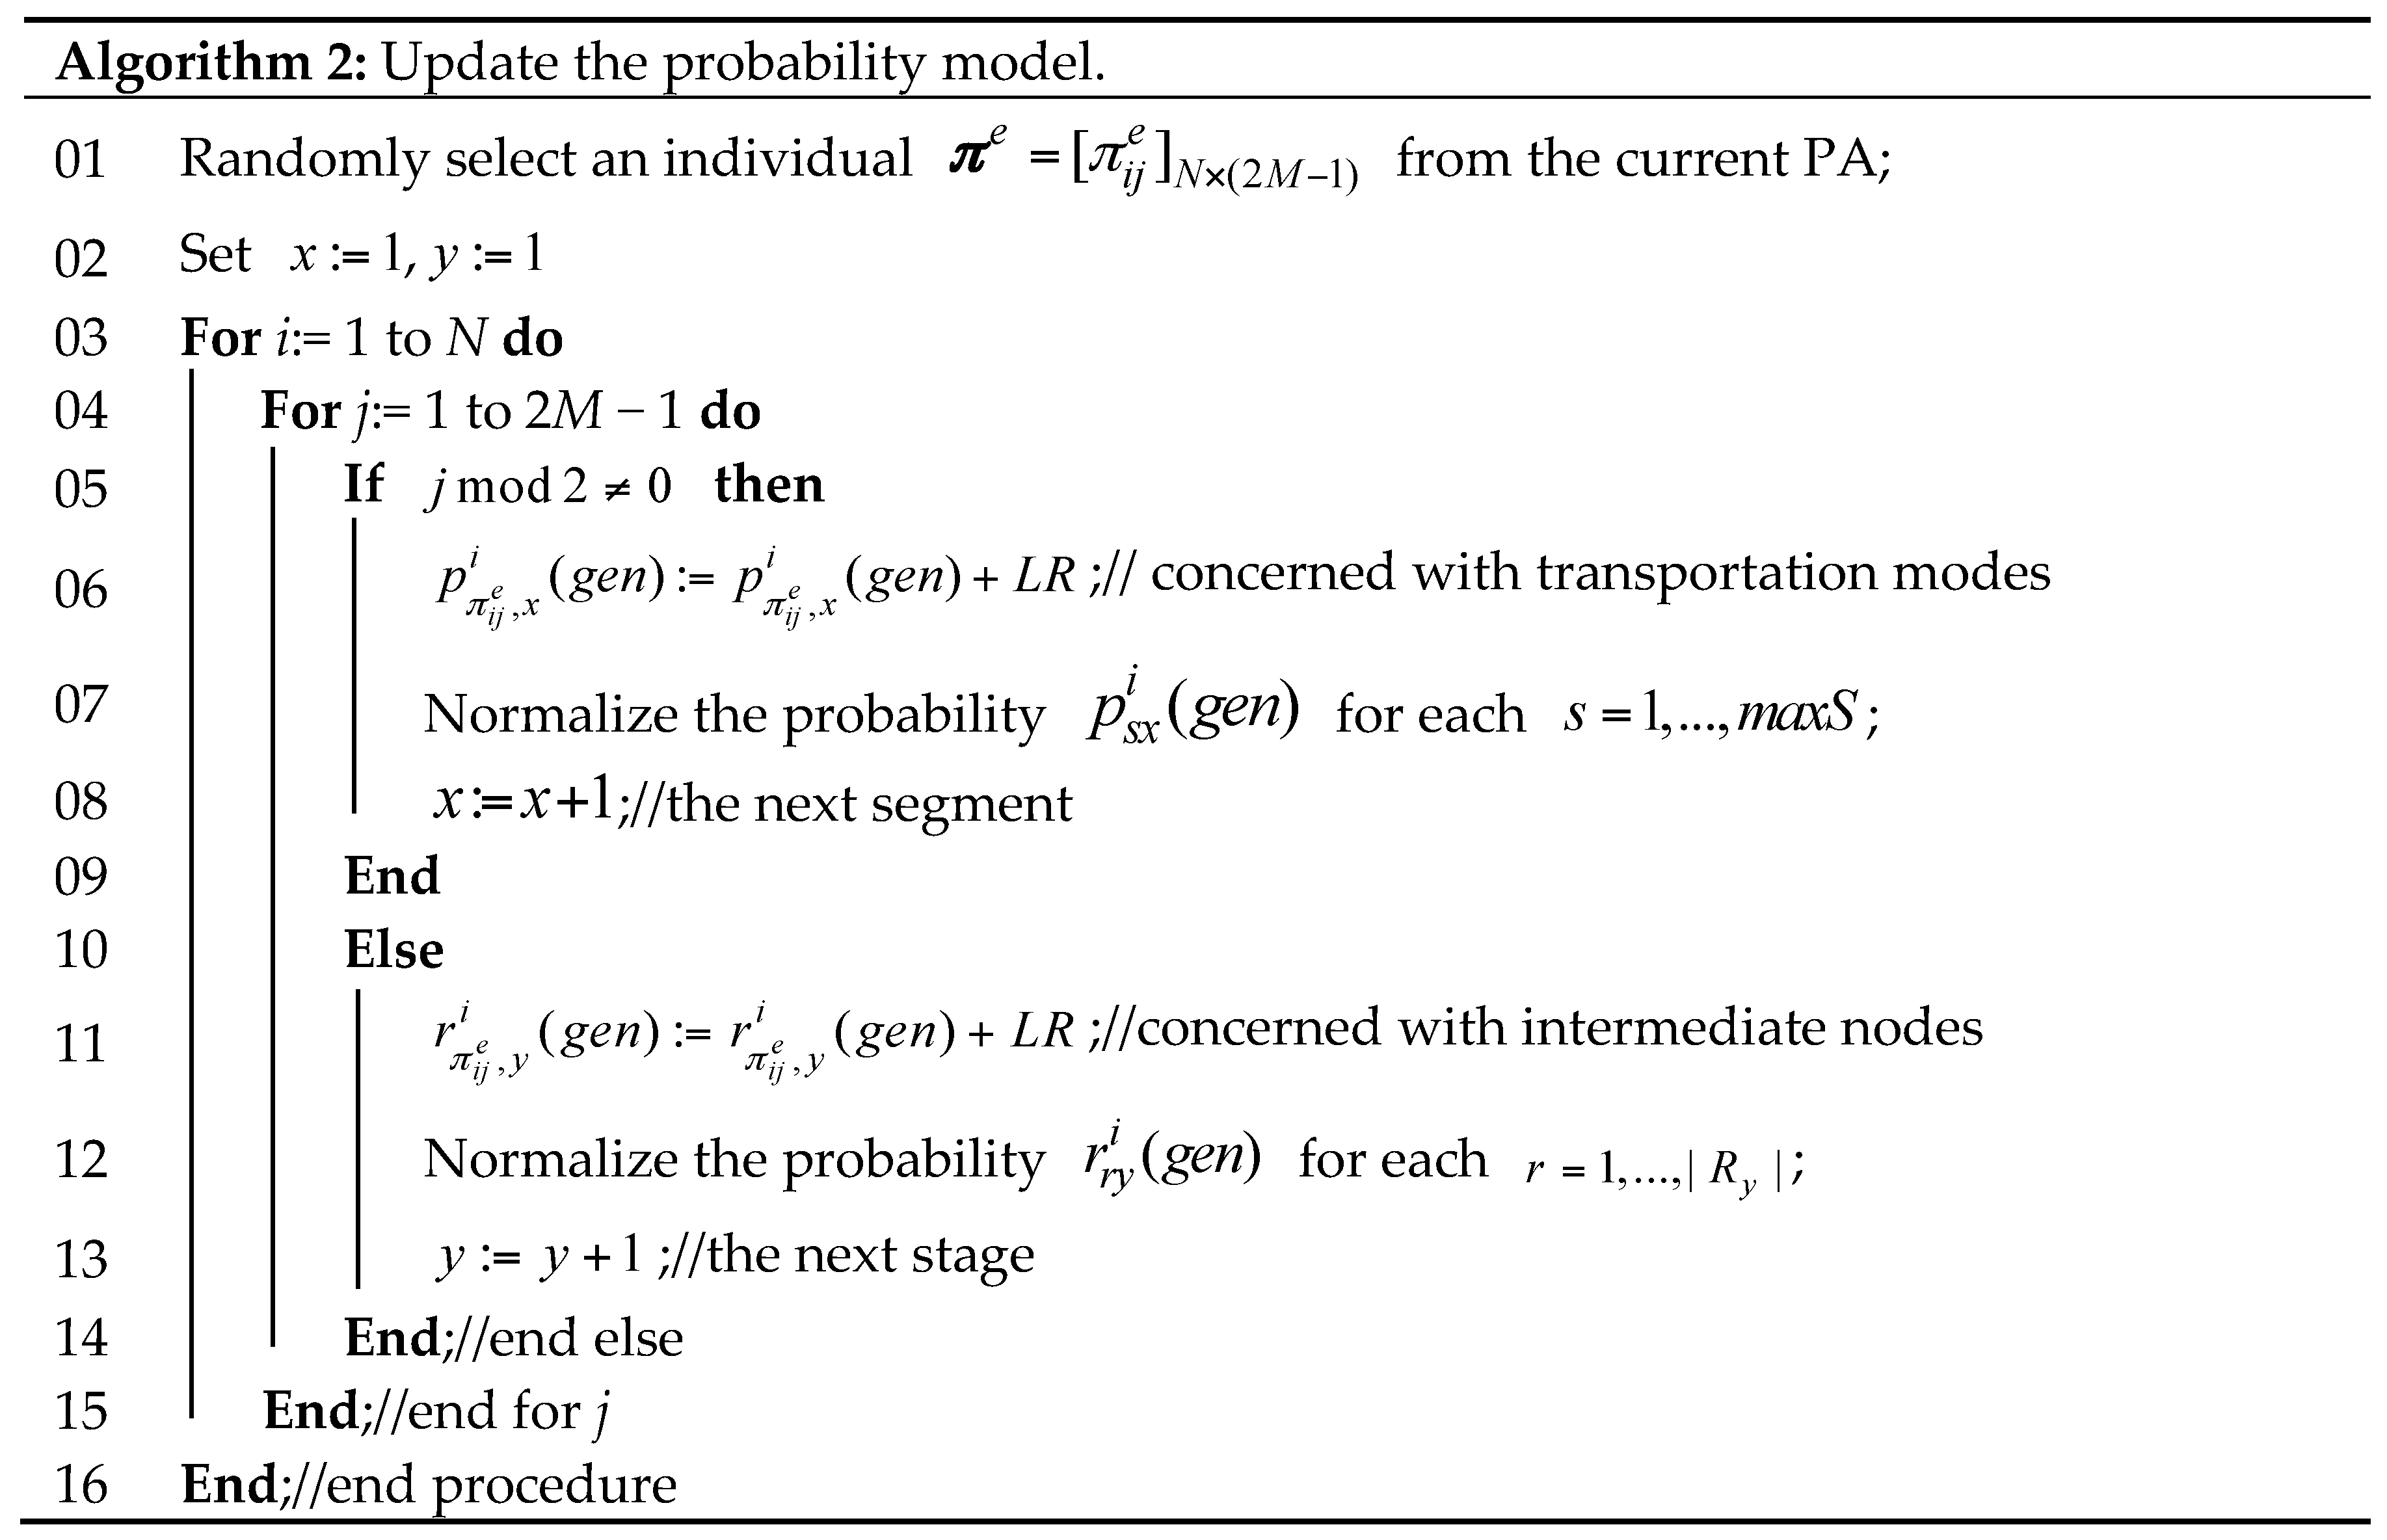
Probability model update is one of the crucial operators for EDA [32], which is used to accumulate the historical information of excellent individuals found during the search process. Thereafter, the new populations are generated by sampling the updated probability model. As mentioned above, PA is dynamically updated by new generated individuals according to the dominance rule (see algorithm in Figure 1), so that PA can be seen as a set of excellent individuals. In view of this, we apply the non-dominated solutions that located in PA to update the probability model. Denote LR the learning rate of HEDA and x , y the temporary variables, then the probability model update method is given in Figure 3.

4.4. New Population Generation Method

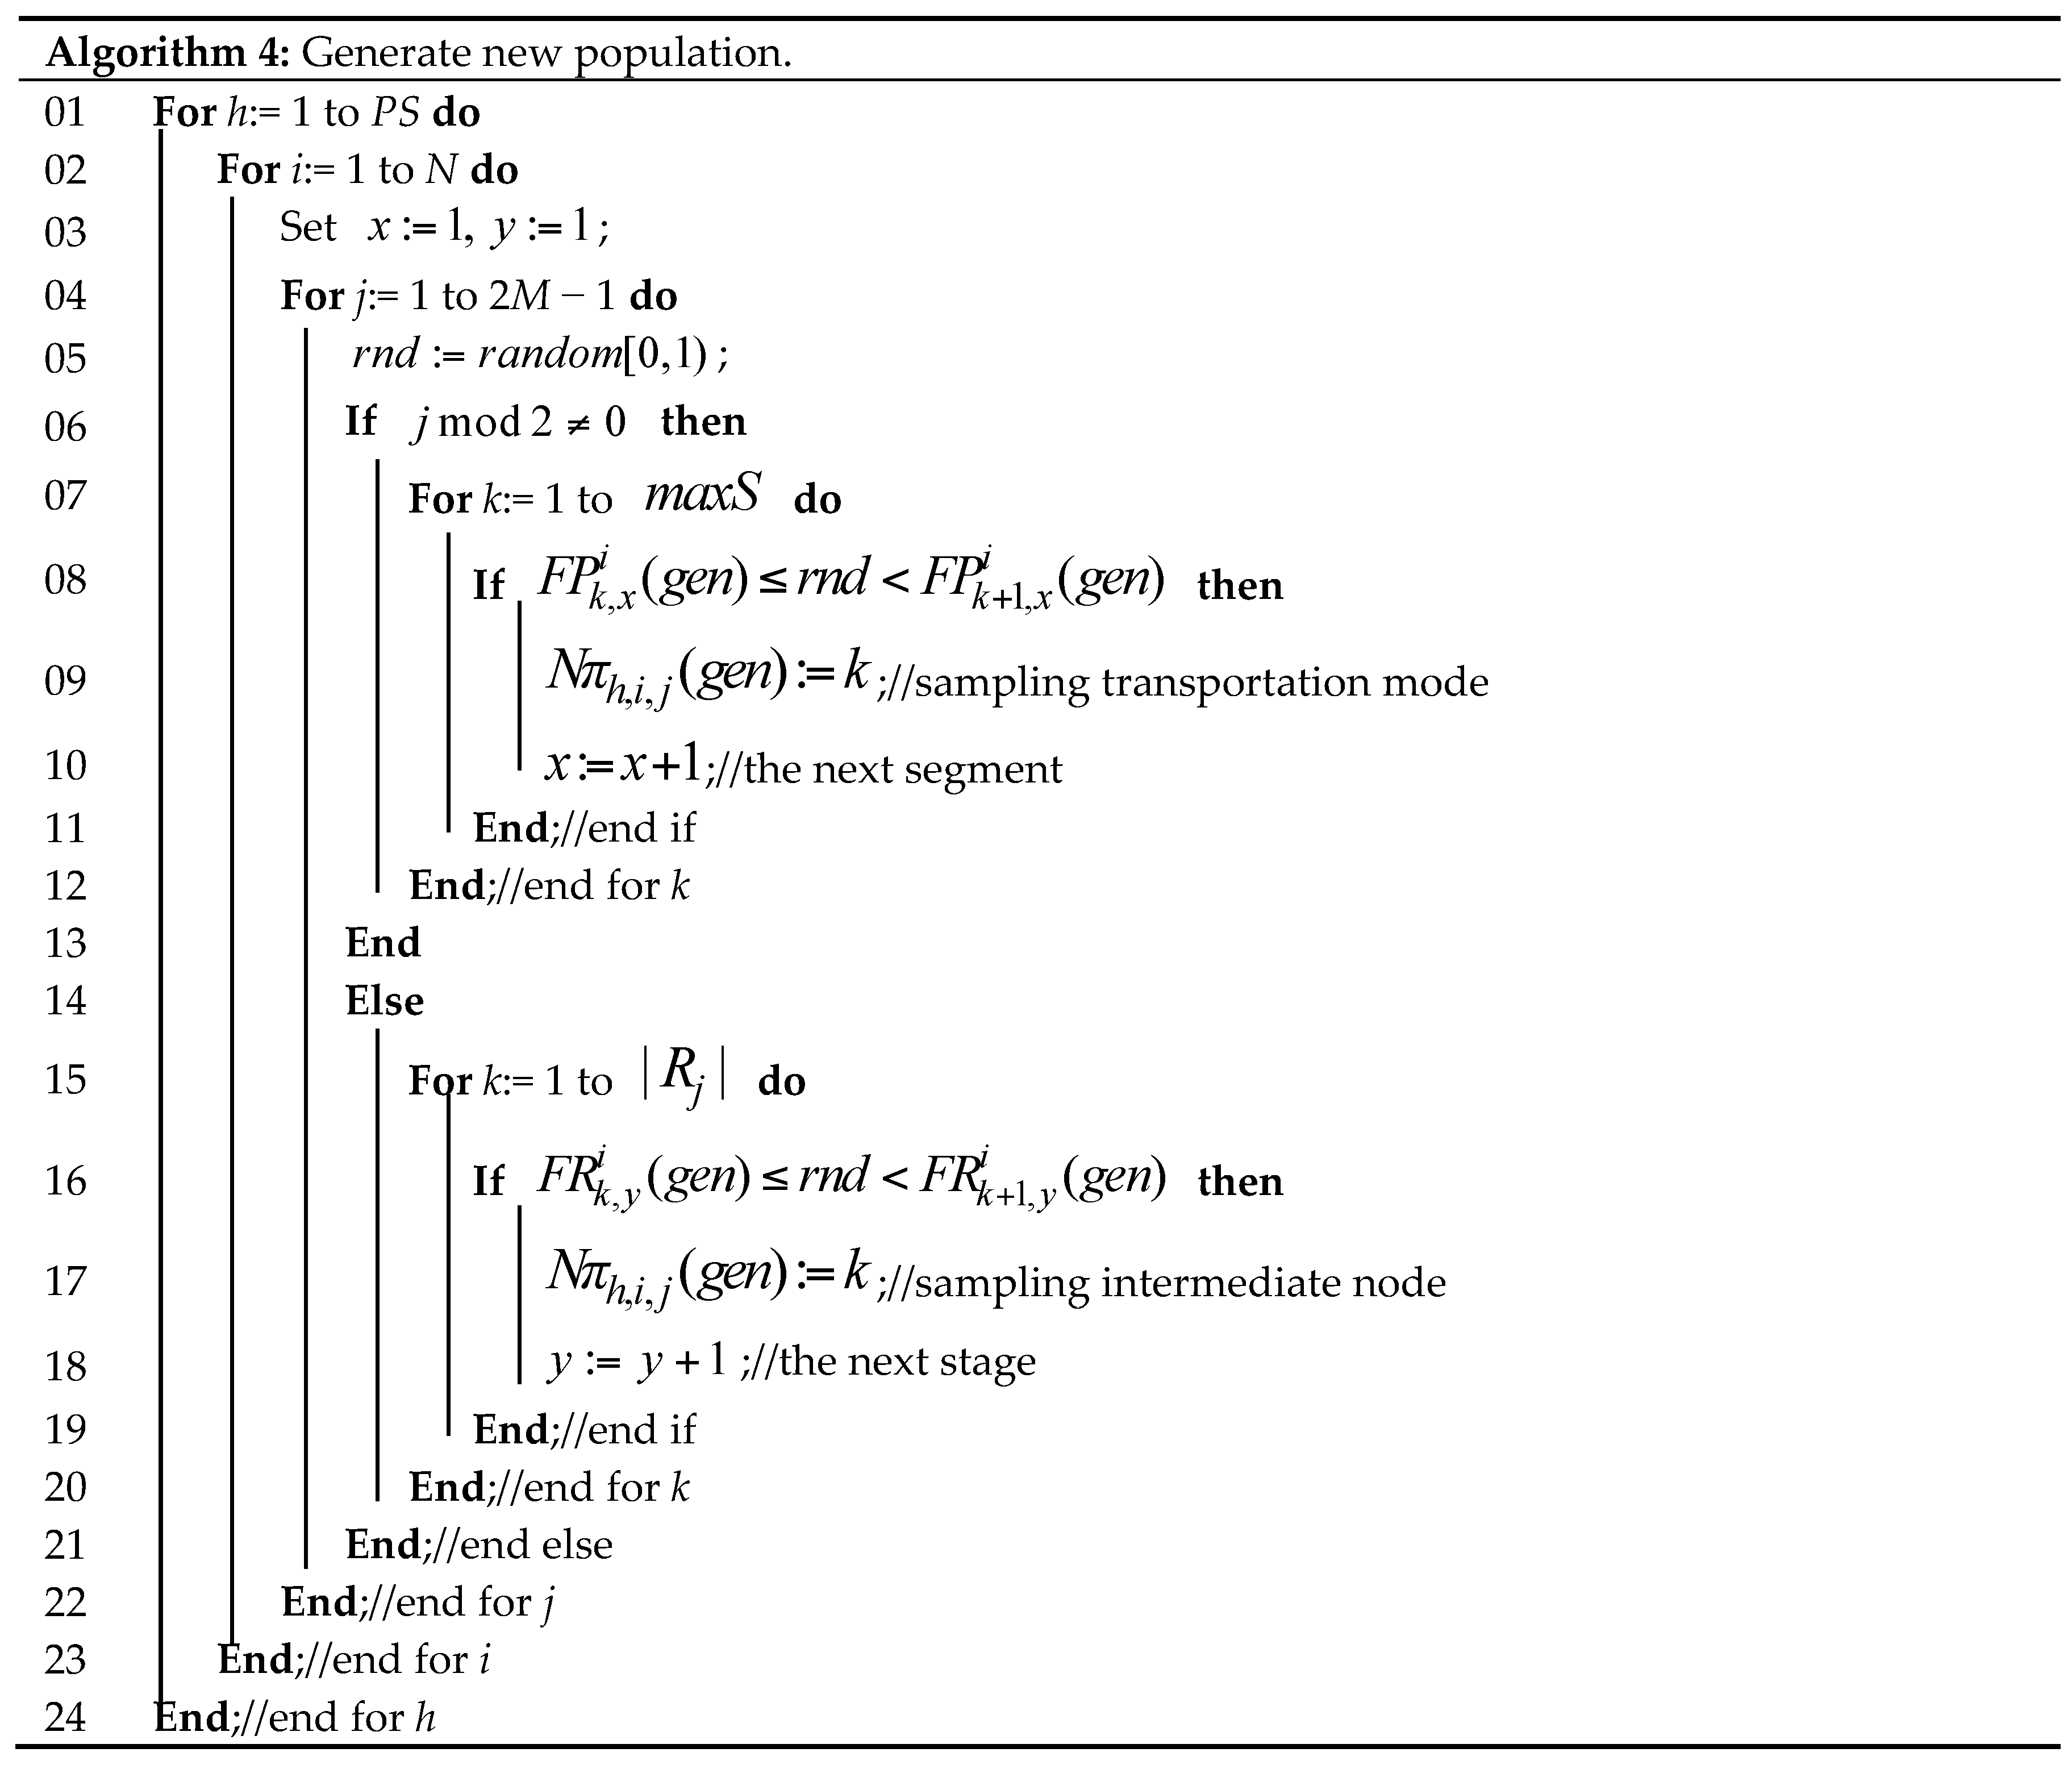
HEDA generates new population by sampling the updated probability model (i.e., HMDL). In the sampling procedure, the new generated individuals should be consistent with the HMDL to guide HEDA’s global search direction, and, meanwhile, to keep the population diversity, relevant random factors may need to be considered. That is, we tend to select a random variable in HMDL with larger probability for producing new individuals, whereas ones corresponding to relative smaller probability also have a chance to be selected. In this regard, we propose a sampling approach based on roulette wheel selection, for which the selection probability of a random variable is proportional to its probability in HMDL. Denote F P j i ( g e n ) = [ F P 1 , j i ( g e n ) , , F P m a x S , j i ( g e n ) , F P m a x S + 1 , j i ( g e n ) ] T ( j = 1 , , M ) the j th marginal distribution function (MDF) of probability matrix P i at generation gen, F R j i ( g e n ) = [ F R 1 , j i ( g e n ) , , F R | R j | , j i ( g e n ) , F R | R j | + 1 , j | i ( g e n ) ] T ( j = 1 , , M 1 ) the j th MDF of probability matrix R i at generation gen, and x , y , r n d the temporary variables. Then, the procedure of calculating MDF and generating new population are shown in Figure 4 and Figure 5.

4.5. Problem-Dependent Local Search

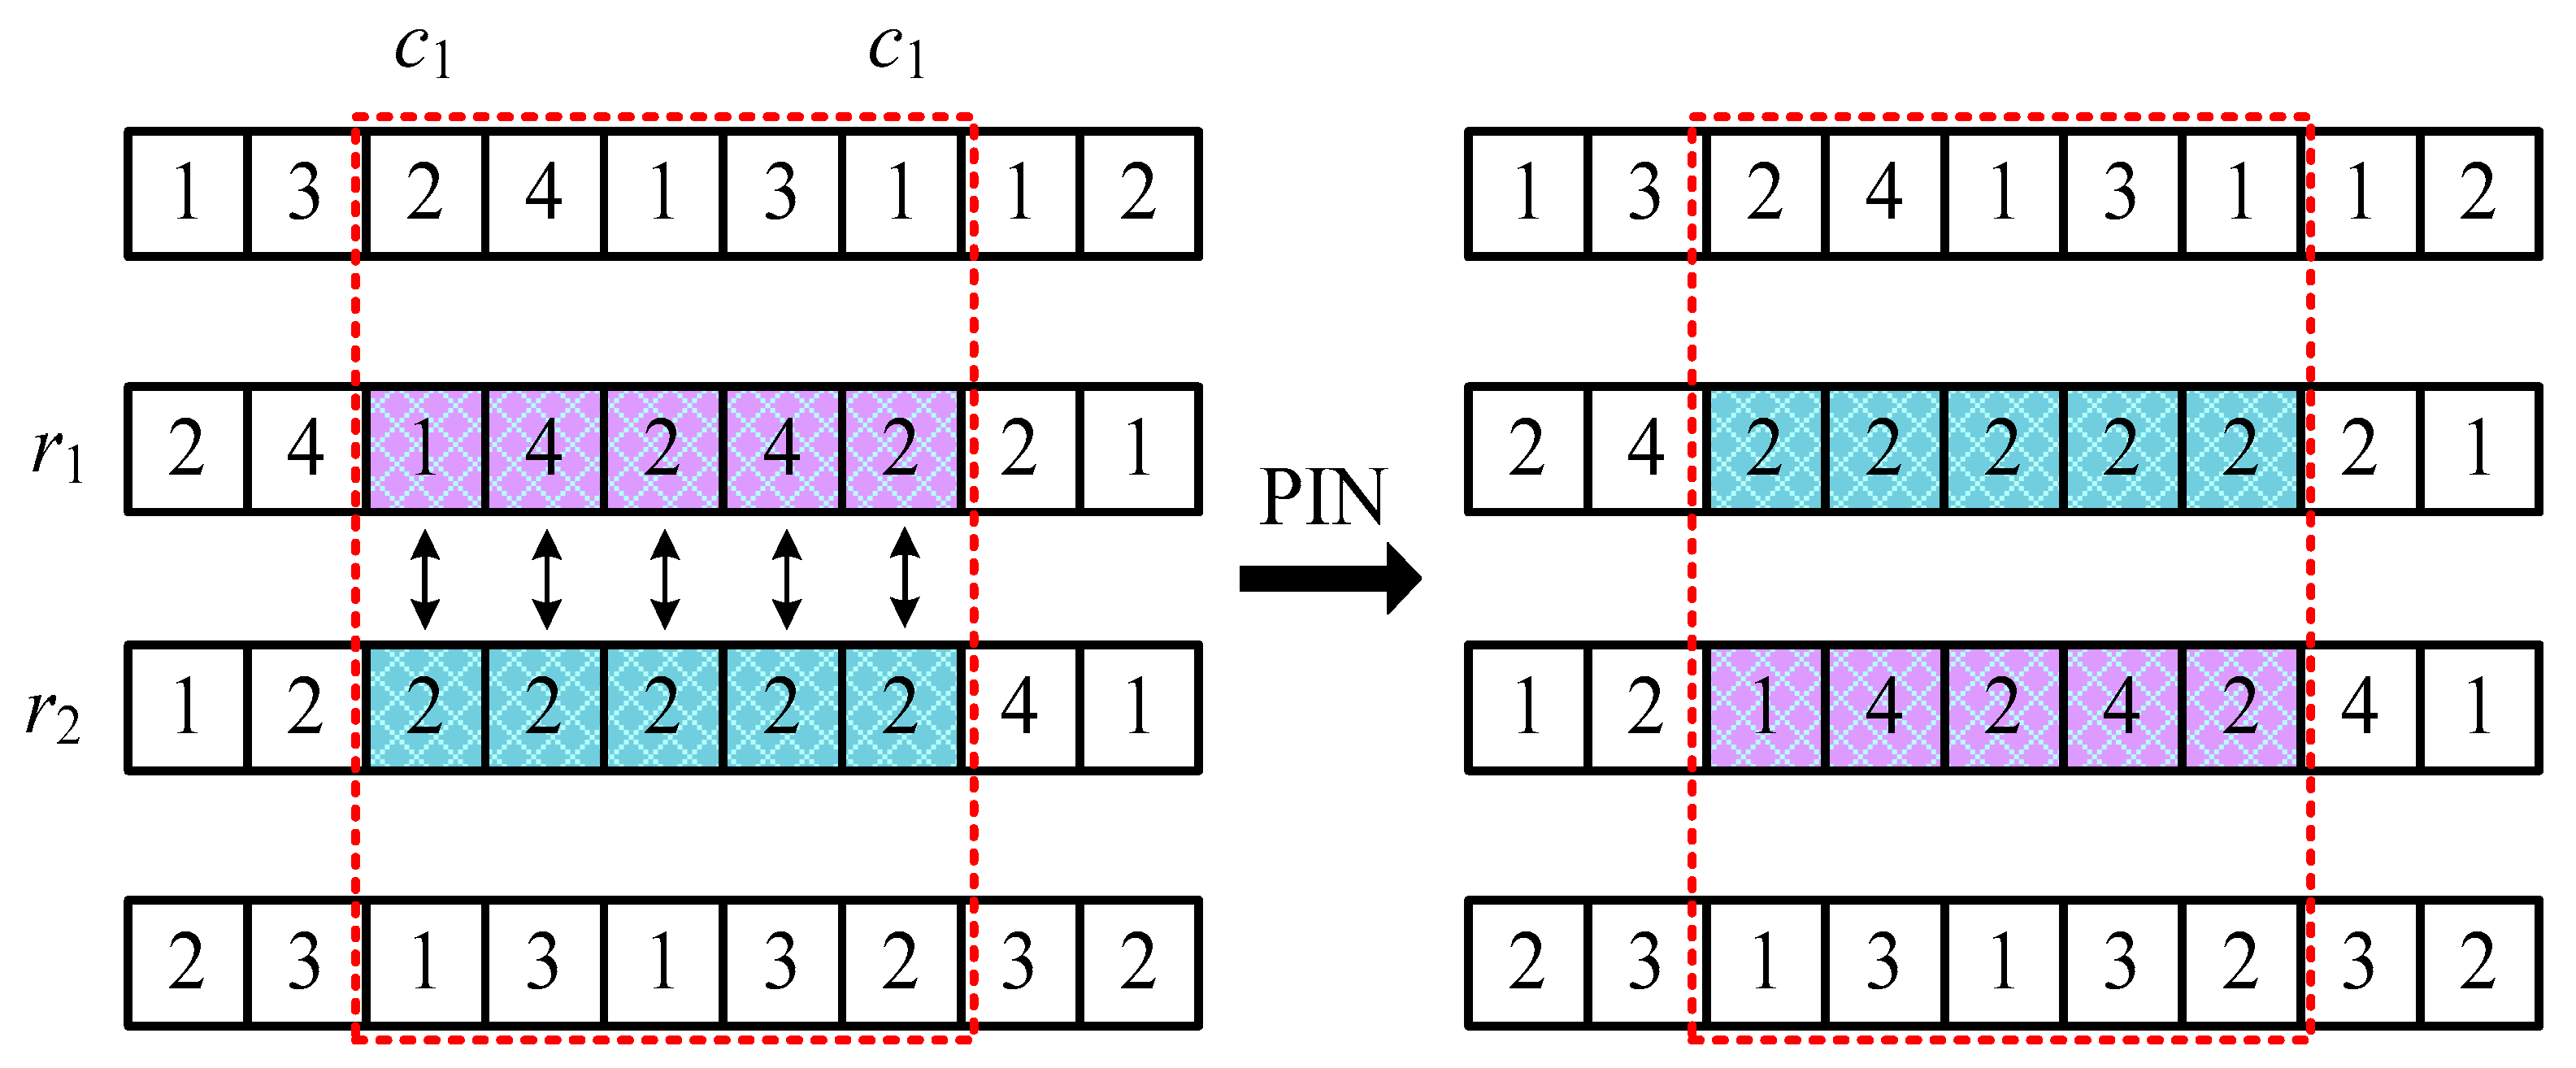
As mentioned above, HEDA may pay little attention to the local search during its iterative process. Hence, it would be highly advisable to embed problem-dependent local search into HEDA to exploit more promising solutions in relatively narrow regions of solution space. Since the solution representation of MO_MSITNDP is a N × M matrix, traditional neighborhood structures, such as Insert, Swap, Inverse, etc. [39], may be unsuitable. In this work, we propose a new neighborhood structure named partially interchanged neighborhood (PIN), in which two random positions c 1 , c 2 { 1 , , 2 M 1 } , c 1 < c 2 are selected first and then we interchange the partial elements between c 1 and c 2 associated with two randomly selected r 1 and r 2 , r 1 , r 2 { 1 , , N } , r 1 r 2 . The mechanism of PIN can be illustrated by a simple example, as shown in Figure 6.
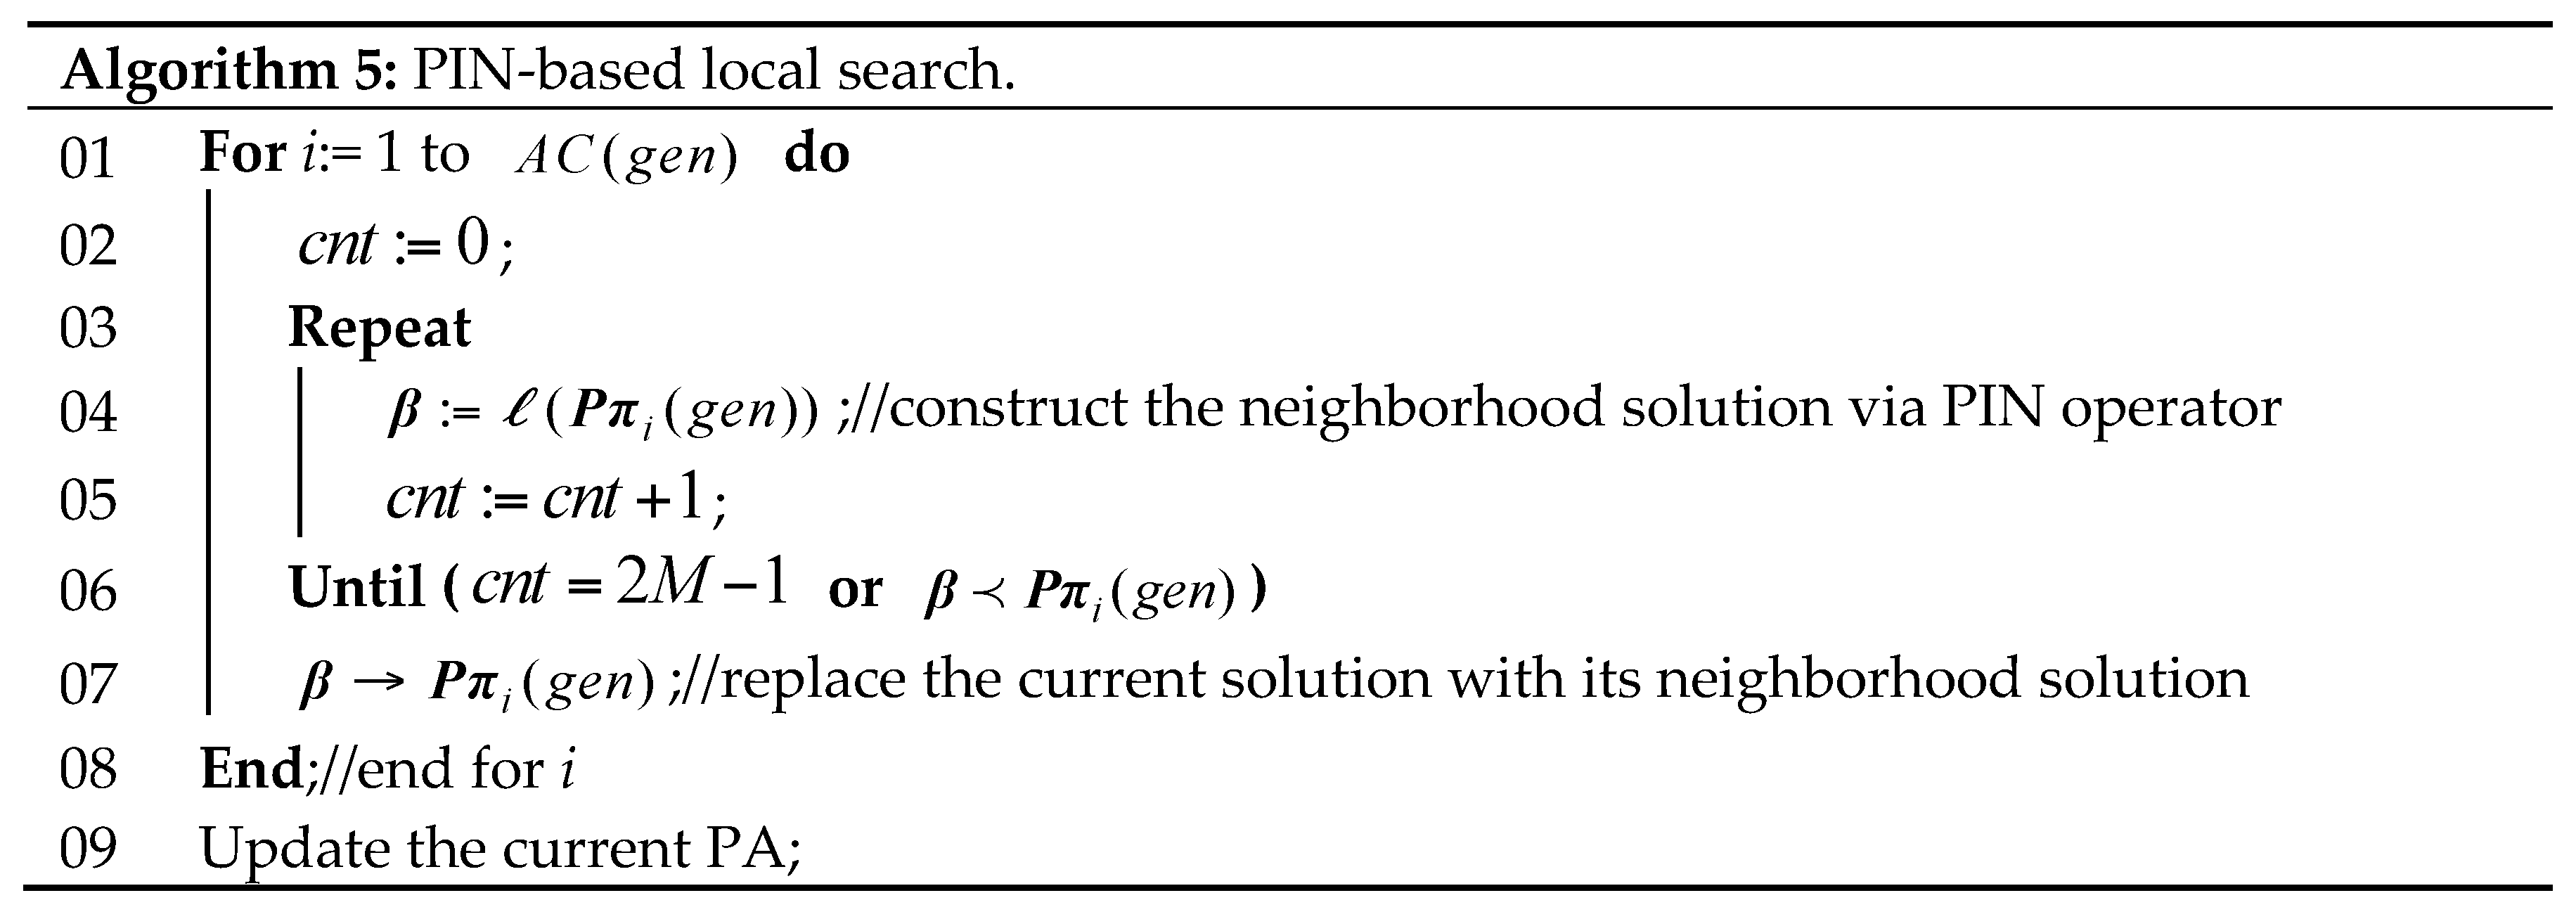
Thereafter, we perform the PIN-based local search for all non-dominated solutions in PA, and meanwhile the first-move rule is adopted in order to avoid excessive exploitation. That is, once a relatively better solution is found from the neighborhood of current solution, the local search will be terminated. Let β = ( π ) denote a neighborhood solution associated with performing PIN operator one time on π , c n t the temporary variables. Then, the proposed local search operator is given in Figure 7.

4.6. Procedure of HEDA

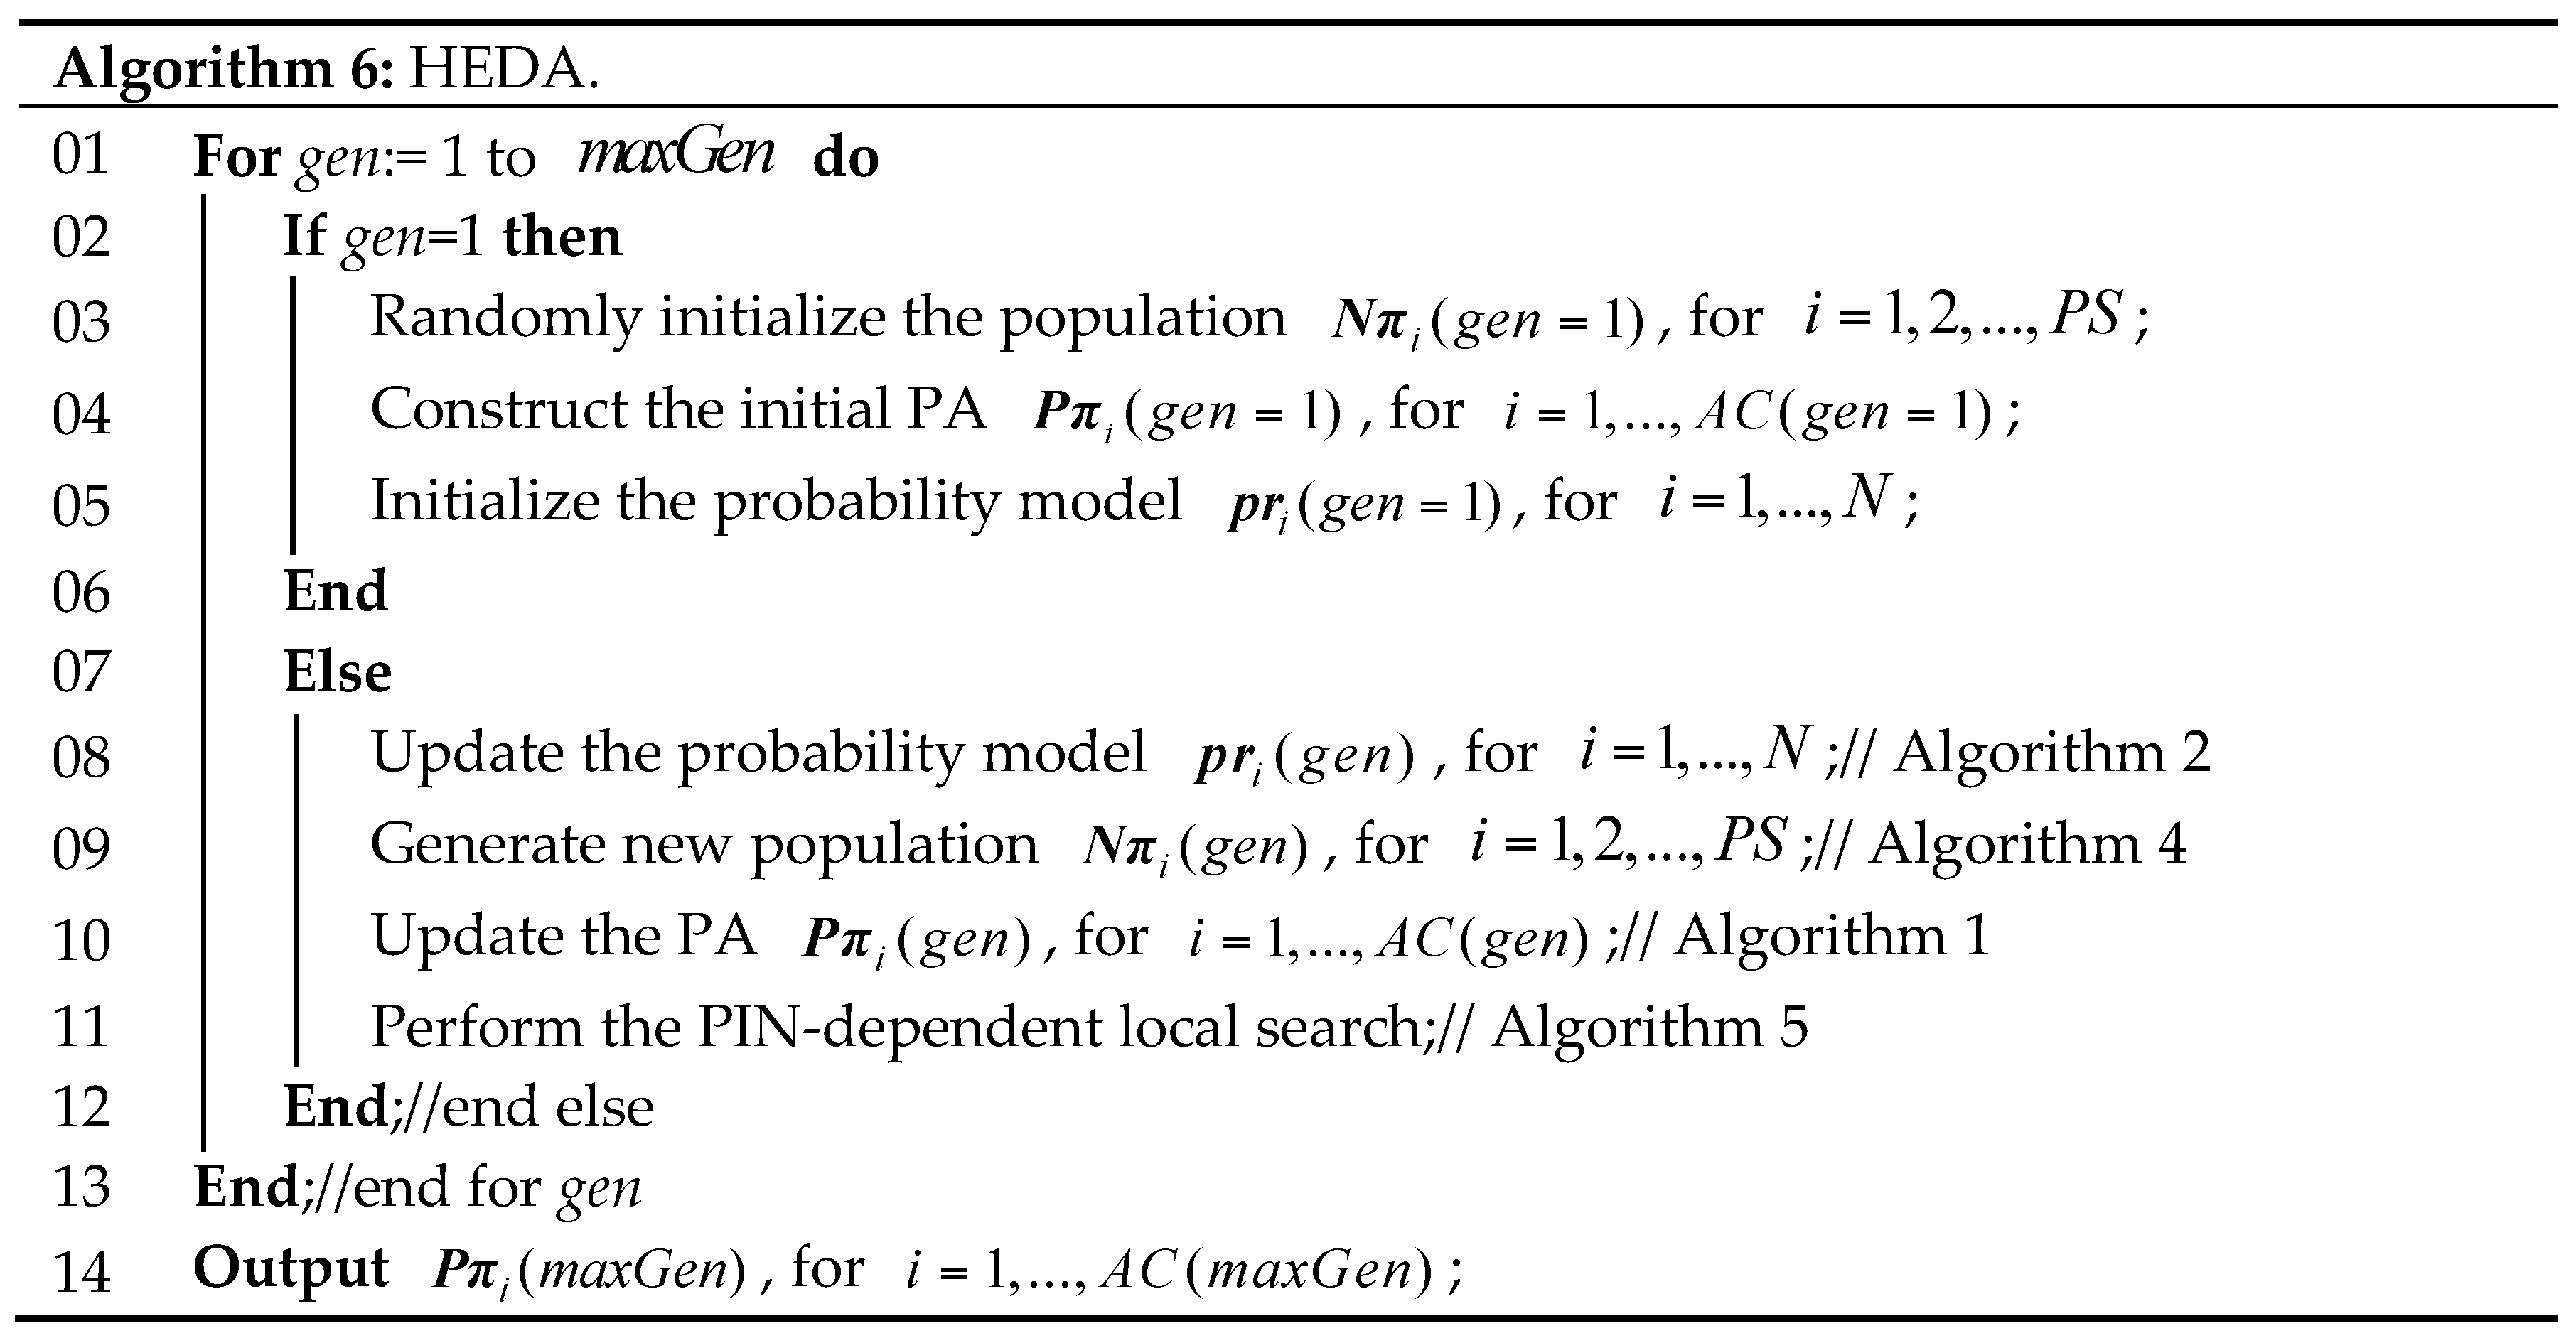
Let m a x G e n denote the maximum number of iteration for HEDA. Based on aforementioned subsections, the procedure of HEDA is shown in Figure 8.

5. Computational Results and Comparisons

To evaluate the performance of HEDA, we first perform computational experiments and comparisons based on randomly generated instances. Then, a real-life case study of Jilin Petrochemical Company (JPC), China, is carried out to demonstrate the application value of the proposed HEDA.

5.1. Experimental Setup

Since there is no benchmark data for MO_MSITNDP, we consider fifteen different combinations of N × M that include 5 × 3 , 10 × { 3 , 4 , 5 } , 20 × { 4 , 5 , 6 , 7 } , 30 × { 6 , 7 , 8 , 9 } , 40 × { 9 , 11 } and 50 × 13 for generating test instances. For each combination, we randomly generate 10 instances such that there is a total of 150 instances. The generation rules of these instances are listed as follows: (1) the amount of the ith freight Q i [ 100 , 500 ] , for i = 1 , , N ; (2) the number of available nodes in the jth stage | R j | [ 1 , 6 ] , for j = 2 , , M 1 , obviously | R 0 | = N   and   | R M | = 1 ; (3) the transportation mode constraint u w ( j 1 , j ) , for   j = 1 , , M , is randomly established by assigning waterway, railway and road in each segment with 0 or 1; (4) the carbon emission cost e i w ( j 1 , j , l , h ) [ 1 , 100 ] , transportation cost C i w ( j 1 , j , l , h ) [ 1 , 100 ] , transportation time T i w ( j 1 , j , l , h ) [ 1 , 10 ] , for i = 1 , , N , j = 1 , , M , w = S j , l R j 1 ; (5) the switch cost ξ i w , v ( j , k ) [ 1 , 10 ] , switch time τ i w , v ( j , k ) [ 1 , 3 ] , for i = 1 , , N , j = 1 , , M 1 , w S j , v S j + 1 , ]; and (6) the handling capacity is calculated as W k j = i = 1 N Q i / r | R j | ,   r [ 0.1 , 0.5 ] , for j = 1 , , M 1 , k = 1 , , | R j | , W 10 ,   W 20 , , W N 0 and W 1 M are set to be infinite values.
We independently run all algorithms 20 times, and the results are all based on the average level of 10 instances with respect to the related N × M combinations. In the results, MIN, MAX, AVG and SD represent the minimum, maximum, average and standard deviation, respectively, corresponding to the related performance metrics. The unique terminated condition for all algorithms is the maximal evaluation times of objective functions, which is set to 1000 × N × M . All algorithms are coded in C++ in Microsoft Visual Studio 2008 environment, and all the simulations are conducted on a PC with Intel Core-i5 3.30 GHz processor with 4 GB memory.

5.2. Performance Metrics

To systematically verify the performance of HEDA, three performance metrics [40] are adopted as follows:
(1) Overall non-dominated solutions number (ONSN)
Denote Sustainability 09 01133 i002 is the union of non-dominated solutions with regard to A l g o r i t h m 1 , , l , , L , and then Sustainability 09 01133 i003 is the number of non-dominated solutions in Sustainability 09 01133 i004 which are not dominated by solutions in Sustainability 09 01133 i005 as shown in Equation (20). The larger the value of Sustainability 09 01133 i003 is, the better performance of Algorithm l.
Sustainability 09 01133 i006
(2) Ratio of non-dominated solutions (RNDS)
Denote the ratio of solutions which are not dominated by solutions in Sustainability 09 01133 i005, shown as following Equation (21). The higher the value of Sustainability 09 01133 i007 is, the better performance of Algorithm l.
Sustainability 09 01133 i008
(3) Average distance (DIR)
Denote d y x ( π i ) is the shortest normalized distance from solution y in Sustainability 09 01133 i005 to Sustainability 09 01133 i004 [40], then DIR can be defined in Equation (22). Obviously, a smaller Sustainability 09 01133 i009 means a better convergence performance to Sustainability 09 01133 i005, as well as a better distribution of Sustainability 09 01133 i004.
Sustainability 09 01133 i010

5.3. Comparisons Results

5.3.1. Comparison with Existing Algorithms

In this subsection, we compare HEDA with three algorithms: (1) HEDA_noLS, a variant of HEDA in which the PIN-based local search operator is removed, and the parameter setting is the same as HEDA; (2) NSGAII [41], a well-known non-dominated sorting multi-objective genetic algorithm, which has been widely used for various multi-objective optimization problems; and (3) PGA [31], a relatively new reported genetic algorithm for a special kind of intermodal transportation problem which is quite similar to MO_MSITNDP. It should be mentioned that all the algorithms are executed based on the modified model in Section 3.2.
For the parameters setting, we set the population size P S = 50 for all algorithms, and, meanwhile, HEDA’s learning rate L R = 0.06 , the crossover and mutation probability of NSGAII and PGA are set to 0.8 and 0.2, respectively. It should be noted that we have embedded the PIN-based local search operator in to the NSGAII and PGA to ensure the fairness of comparisons.
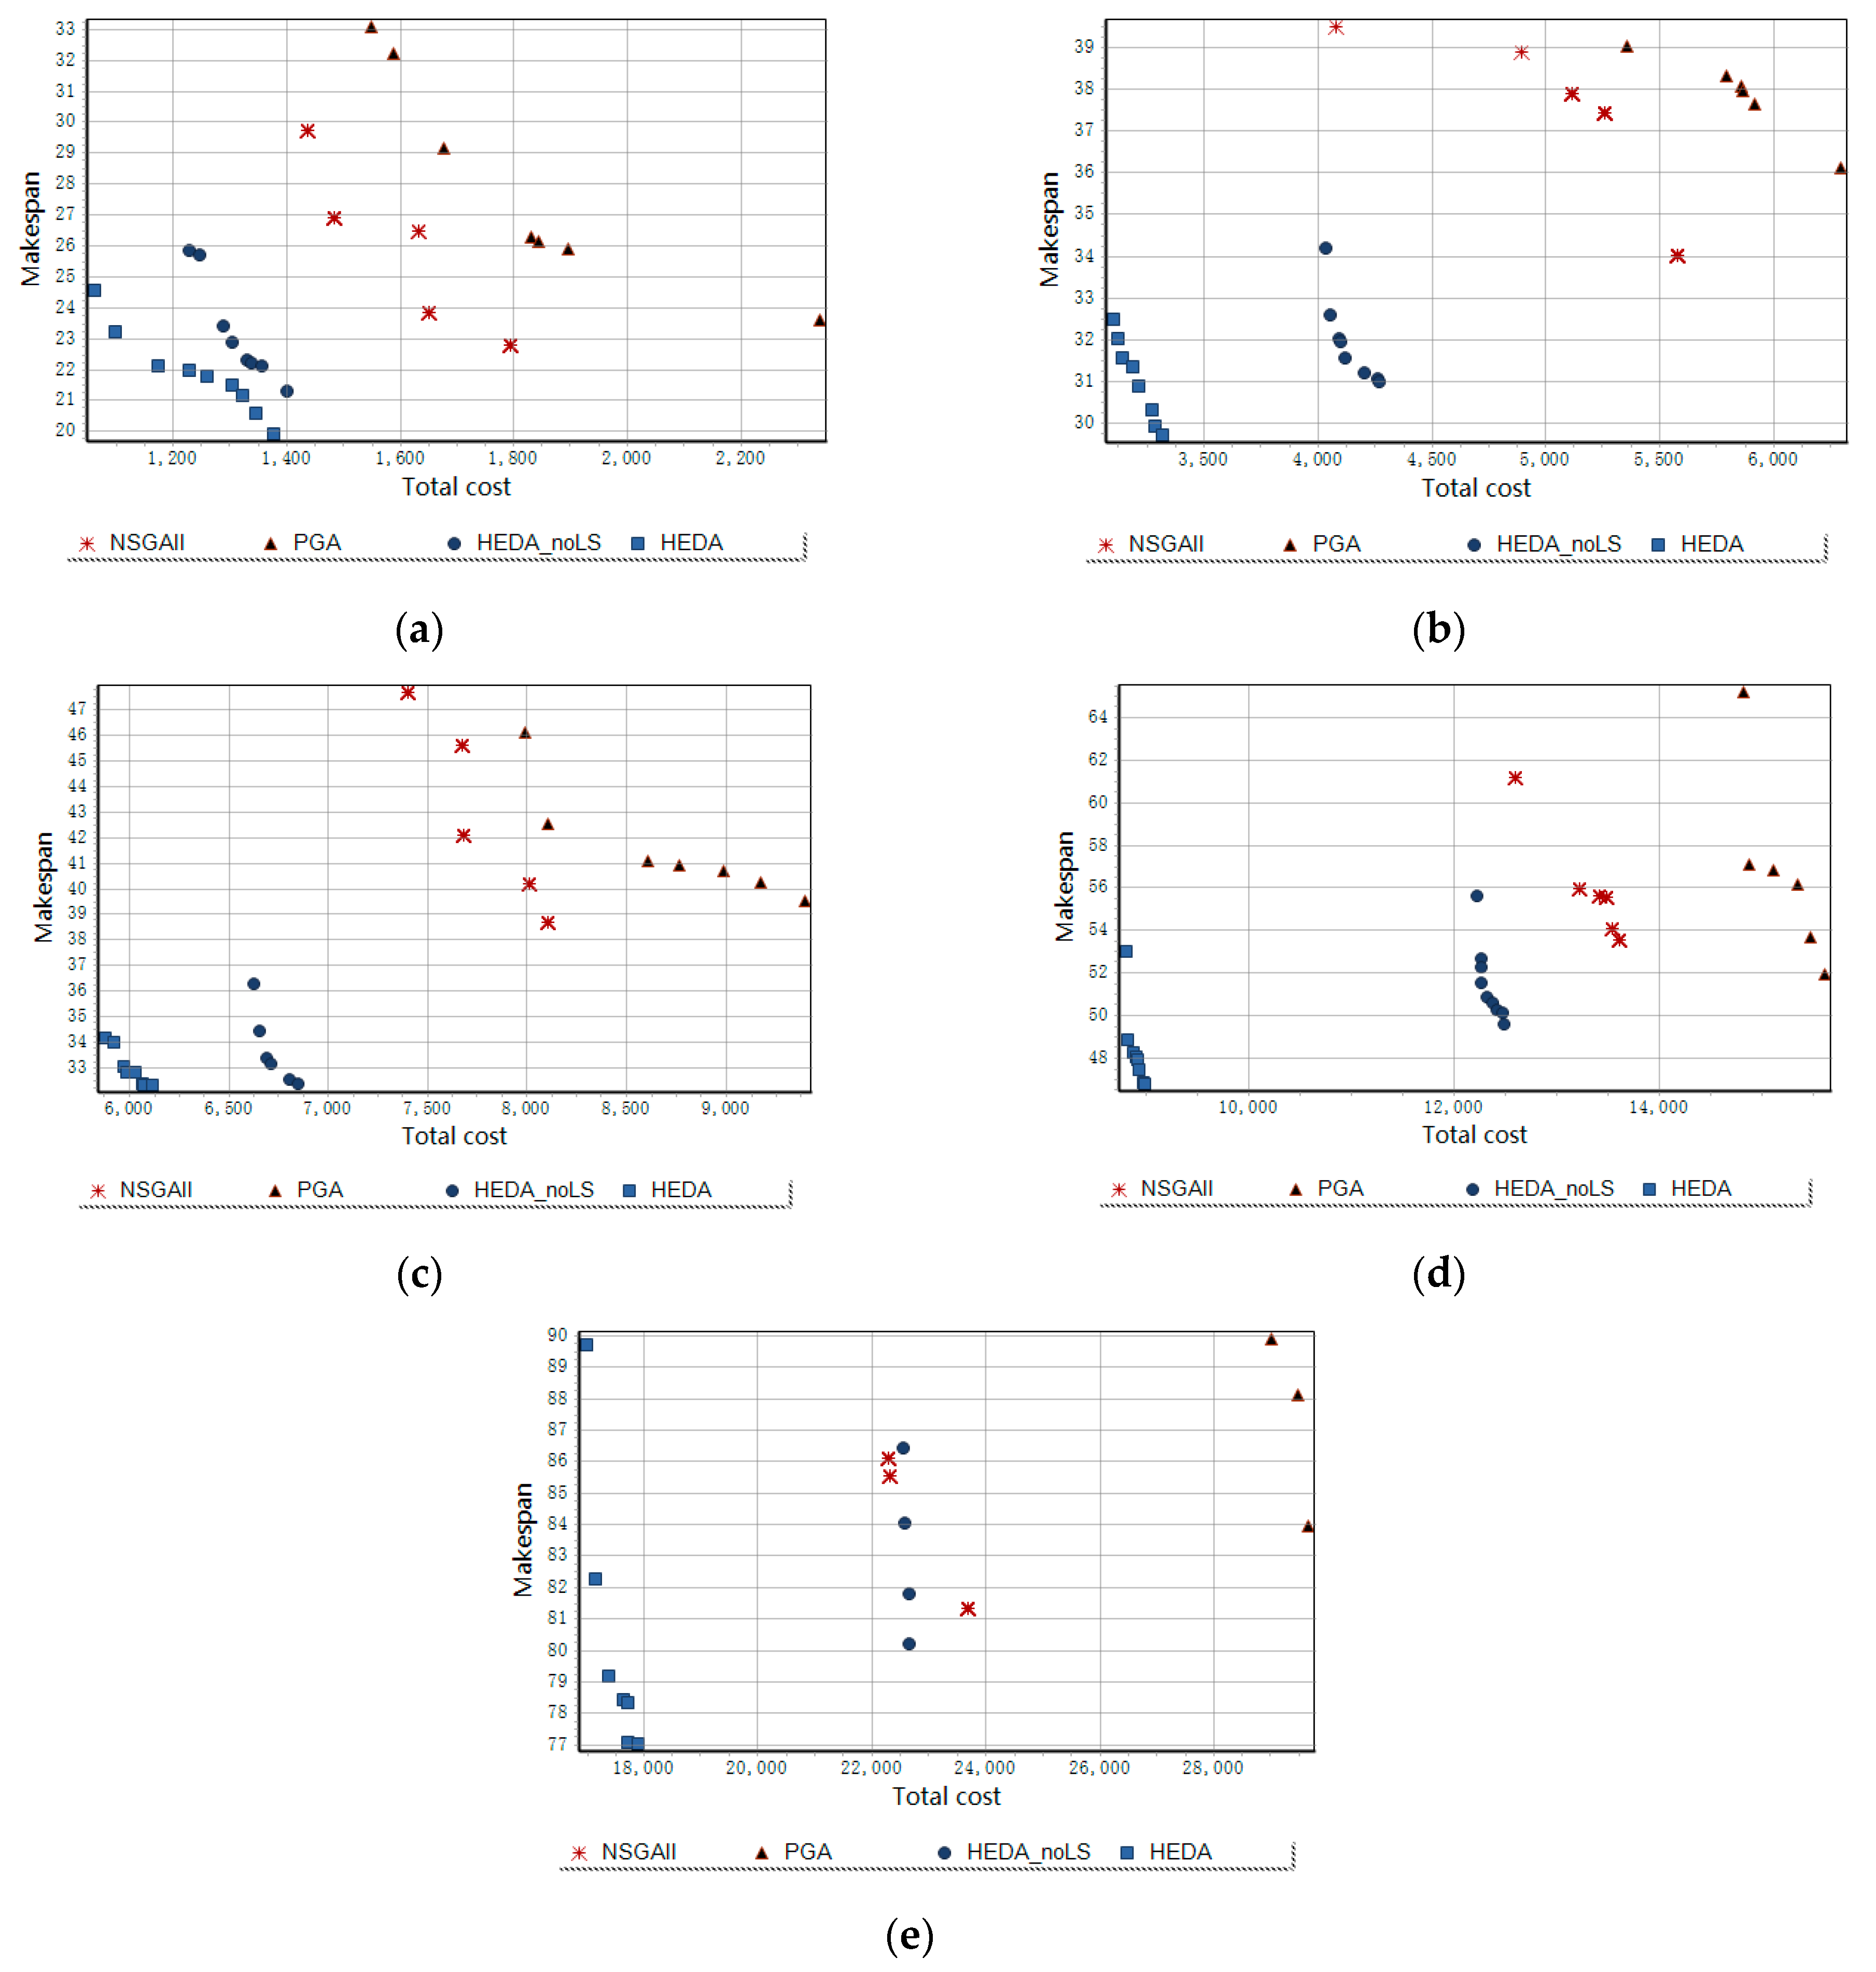
We first make an observation on the approximate Pareto fronts with regard to the first instance of 10 × 5 , 20 × 5 , 30 × 7 , 40 × 9 and 50 × 13 , espectively. Furthermore, the obtained results of HEDA, HEDA_noLS, NSGAII and PGA can be seen in Figure 9.
It is can be obviously seen in Figure 9 that the solutions in Pareto set obtained by HEDA are better (both in terms of the quality and quantity of solutions) than the ones from the three other algorithms in all cases of variable problem sizes, which implies HEDA share a high superiority in solving MO_MSITNDP. Furthermore, the statistic results of these four algorithms are listed in Table 1, Table 2, Table 3 and Table 4.
We can see in Table 1, Table 2 and Table 3 that the performance of HEDA is obviously better than other three compared algorithm associated with ONSN, RNDS and DIR metrics. It is clear that HEDA’s performance is more superior than its variant HEDA_noLS, which demonstrate effectiveness of our proposed PIN-based local search. For most instances, HEDA can find more non-dominated solutions than the other algorithms, and its solutions possess a shorter distance to the union of non-dominated solutions. Thus, not only does HEDA ensure an outstanding convergence to the optimal Pareto font, but it also keeps a reasonable distribution and diversity on its approximated Pareto font. The feasible ratio of HEDA reaches to 100%, as well as other algorithms, which demonstrated the reliability of our proposed HEDA. Accordingly, the proposed HEDA can be seen as an effective solution for addressing MO_MSITNDP.
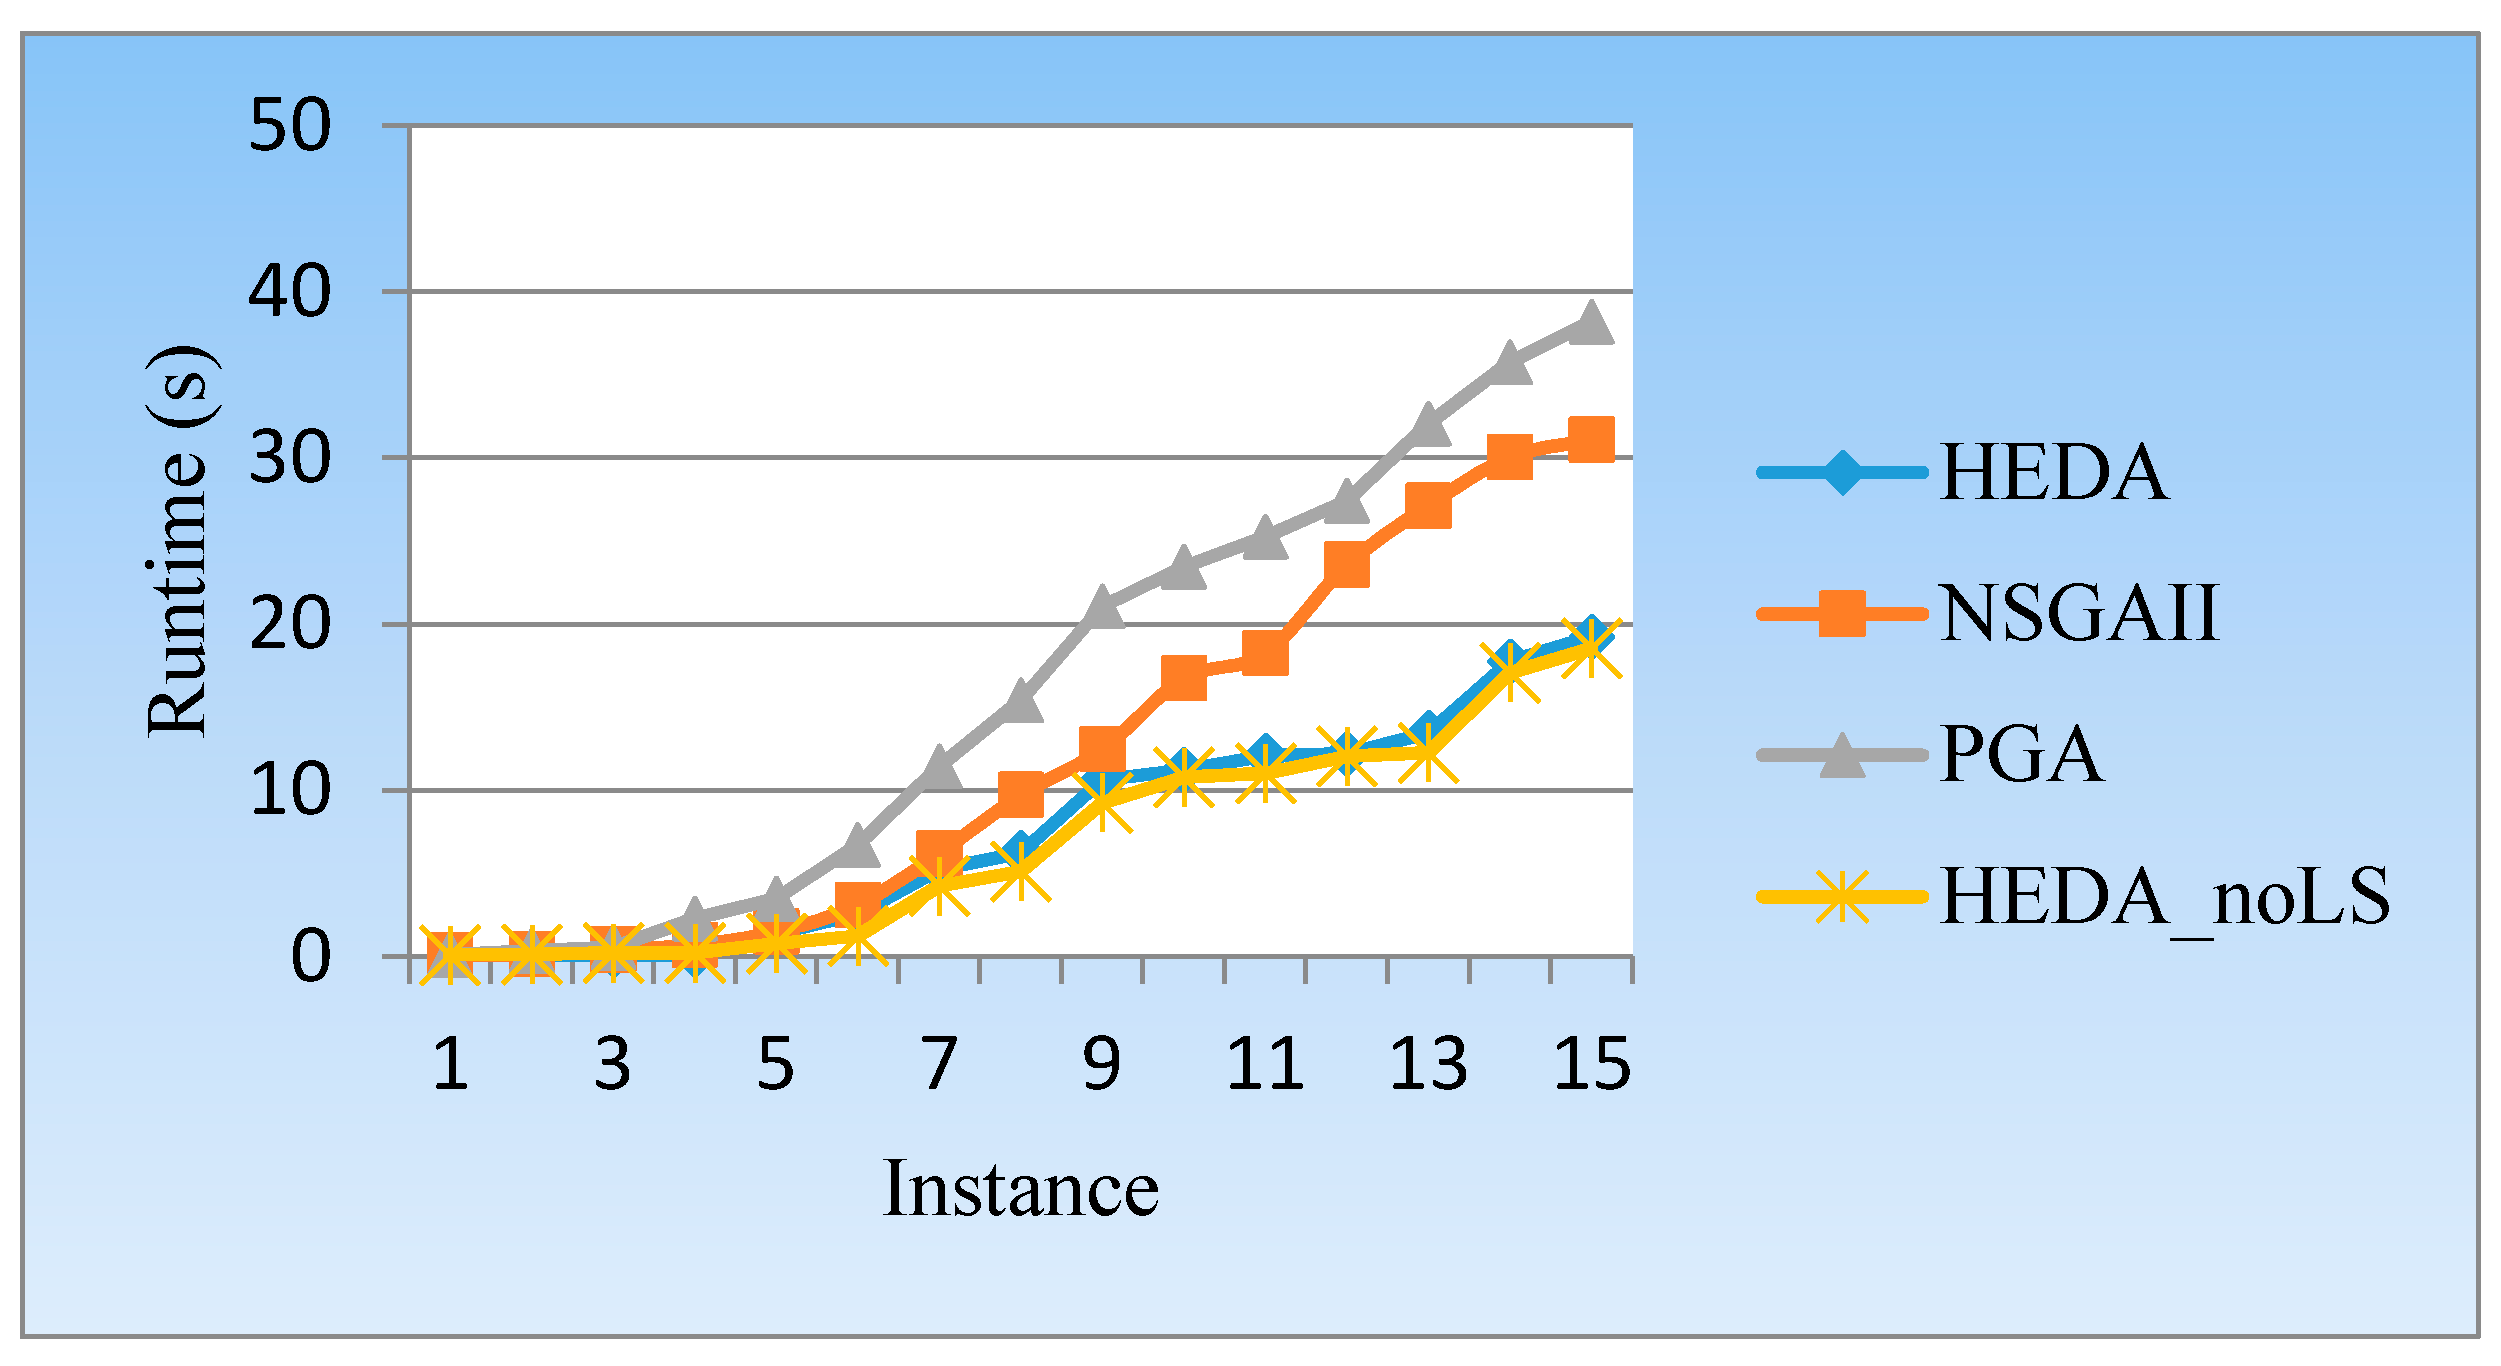
In terms of the runtime, Figure 10 shows that HEDA has lower runtimes than NSGAII and PGA, which indicates that the running speed of HEDA is faster than NSGAII and PGA. The runtimes of HEDA are a little bit higher than HEDA_noLS, implying that the PIN-based local search of HEDA causes relative lower time consumption. In addition, the feasibility rates for all algorithms are 100%.

5.3.2. Comparison with Optimization Solver

In this subsection, the developed HEDA is compared with optimization solver. Owing to the linear characteristic of the mathematical model, we choose CPLEX 12.5, which is a popular solver used in optimization area. The multiple objectives are transformed into a single objective problem by using the epsilon constraint method [42] to satisfy the solving conditions of CPLEX. It should be noted that we do not purse the optimal solutions regarding the branch-and-cut phase addressed by CPLEX to obtain more feasible solutions to construct the approximate Pareto font. That is, once the feasible solution is found, CPLEX will stop and turn to solve the next problem in terms of another upper bound. Upper limit of time for CPLEX is 600 s. The results of ONSN, RNDS, DIR and Time are shown in Table 4.
In Table 4, we can find that, for the small scale instances, HEDA has lower runtimes and the quality of the solutions is also at an acceptable level. For the middle problem size, HEDA has advantages in runtimes and can provide better solutions than CPLEX. Furthermore, CPLEX is unable to solve the large scale instances, such as instance 40 × 11 and 50 × 13 , whereas HEDA can obtain solutions easily, which indicates HEDA is more capable with respect to all instances.

5.4. Case Study

In this section, we conduct a case study based on the ethylene propylene rubber production from Jilin Petrochemical Company (JPC), China. JPC is the only enterprise that has the production equipment of ethylene propylene rubber in China. The major raw materials for the ethylene propylene rubber are ethylene, propylene and third monomer. The ethylene needed is mainly self-produced, while the other materials rely on outsourcing and importing. In the JPC’s sourcing plan, propylene will be purchased from Australia, while B fork borneol third monomer, double loop pentadiene third monomer and B diene third monomer are purchased from Japan, Philippines and America, respectively. In this background, an intermodal transportation company is hired by JPC to transport these freights from the sourcing places. Considering the geographical and economic distribution, 10 cities are chosen as intermediate nodes in the intermodal network (see Figure 11). The intermodal transportation network is divided into six stages and the nodes in each stage are shown in Table 5. The quantity of freights from each sourcing places are in Table 6. The relevant data about the variable transportation cost, carbon emission cost and average time for each transportation mode are in Table 7, in which the distances between the nodes by the three modes are collected from http://www.jctrans.com, www.12306.cn, and www.jdcsww.com in terms of the waterway, railway and road. Furthermore, the carbon emission relevant calculations for the three transportation modes are according to Duan and Heragu (2015) [1].
According to the data above, we use HEDA to solve this case study and the non-dominated solutions are shown in Table 8 and Figure 12. Especially, to analyze the carbon emissions in our designed intermodal network, the carbon emission cost (CEC) is given.
In Table 8, there are five non-dominated solutions provided by the HEDA for the intermodal transportation company to make transportation decision. By careful analysis, it can be found that the solutions have a good trade-off among cost, time and carbon emissions. For example, total cost and carbon emission cost of Solution 4 is 92,141 and 1850, respectively, which are a little higher than Solution 3 (92,188 and 617). However, the transportation time of Solution 3 is much less than Solution 4. It illustrates that time and carbon emissions can be greatly reduced without large sacrifice of cost.
Obviously, we can find that Solution 1 has a shortest maximum flow time of 601 while Solution 4 can provide a lowest total transportation cost with 92,141. Therefore, Solution 1 is proper if a fast delivery is needed, whereas Solution 4 should be adopted with respect to total cost focus. In addition, the rate of road use is very low; it has been replaced by waterway and railway, which have lighter carbon emission, implying that the carbon emission could be reduced in this network. Moreover, the stage division for an intermodal network that is mainly based on the physical characteristics of the available transportation infrastructures is a key preparation for the model construction. Through the gained solutions, it is obvious that some nodes are at a low frequency to be selected while some ones are invariably being passed. For example, the second node and third node are never selected in stage 1 for all solutions, which implies that we can consider removing the two nodes in stage division to decrease the computing complexity.

5.5. Management Insights

The approach and findings of this study will provide some practical insights for the logistics industry to make a tactical decision. An increasing number of transportation companies operate as freight integrators to provide one-stop service for customers. To enhance the competitiveness, they are supposed to optimize the transportation planning within the existing infrastructure and the expectations of customers. In this paper, the intermodal company can optimize the total cost and maximum flow time to satisfy diversified markets. In addition, carbon emissions are considered to achieve the environment sustainability and response to low-carbon policy and regulation. The model and proposed algorithm will enable the freight integrator to make a trade-off among the total cost, time and carbon emissions while providing highly complicated solutions to improve the competitiveness.
Furthermore, the crossing logistics is involved in the model as the handling capacity in each node. Such constraints can make our model close to reality and ensure the feasibility of solutions. Besides, it can balance the transportation flow among the nodes, which is beneficial to mitigate the traffic congestion and air pollution in busy node and reduce the idle resource in other nodes when the total cost or time change less.
As mentioned above, a main objective of intermodal transportation is to reduce the road transportation rate. In general, unless the fastest delivery is preferred, waterway and railway will cover the entire long-distance transportation and reduce the rate in the last-mile trucking transportation in intermodal transportation network. Therefore, intermodal transportation would be further advocated if the hard carbon emission regulations are set and government should focus on improving intermodal infrastructure construction, especially the port construction where waterway is available and high speed railway construction when waterways do not exist.

6. Conclusions

In this paper, the intermodal transportation problem was modeled as a MO_MITNDP problem concerning both the total cost and the time criteria. What mostly distinguished our model is the stage dividing according to the real intermodal infrastructure construction such as business type, geography characteristic and service radiant scope. We stand on the freight integrator’s perspective to enhance the competitiveness and honor loyal customers by offering complicated decisions according to the personalized requirements. Specifically, the handling capacity in each node is programmed as a constraint, which will disperse transportation pressure by reducing the probability of freight assembling. To solve this hard constraint, the multi-objective-based constraints handling approach is adopted. Then, a hybrid estimation of distribution algorithm was designed to solve the problem. Numerical comparison results showed the effectiveness and robustness of the proposed algorithm for MO_MITNDP. Meanwhile, the case study from the petrochemical industry helped the intermodal company provide a highly door-to-door service in the trade-off among transportation cost, emission cost and the maximum flow time. The simulation results confirmed that we can save time and carbon emission without much sacrifice of transportation cost by the optimization of intermodal transportation network. Furthermore, this work is the first to consider the estimation of distribution algorithm when solving an intermodal transportation problem. In future work, it is interesting to propose other evolutionary algorithms to solve such problems and research on the low-carbon transportation network design to achieve the economic effectiveness and the environmental effectiveness.

Acknowledgments

This research was partially supported by National Science Foundation of China (No. 571572031), and Philosophy and Social Science Fund, Liaoning, China (L16AZY032).

Author Contributions

Both authors contribute equally to this work. R.L. wrote the initial manuscript draft; and S.J. performed several significant revisions on it.

Conflicts of Interest

The authors declare no conflict of interest.

References

  1. Duan, X.; Heragu, S. Carbon Emission Tax Policy in an Intermodal Transportation Network. In Proceedings of the IIE Annual Conference, Nashville, TN, USA, 30 May–2 June 2015. [Google Scholar]
  2. Zheng, H.Y.; Wang, L. Reduction of carbon emissions and project makespan by a Pareto-based estimation of distribution algorithm. Int. J. Prod. Econ. 2015, 164, 421–432. [Google Scholar] [CrossRef]
  3. Bouchery, Y.; Fransoo, J. Cost, carbon emissions and modal shift in intermodal network design decisions. Int. J. Prod. Econ. 2014, 164, 388–399. [Google Scholar] [CrossRef]
  4. Li, Y.; Bao, L.; Li, W.; Deng, H. Inventory and Policy Reduction Potential of Greenhouse Gas and Pollutant Emissions of Road Transportation Industry in China. Sustainability 2016, 8, 1218. [Google Scholar] [CrossRef]
  5. Piecyk, M.I.; Mckinnon, A.C. Forecasting the carbon footprint of road freight transport in 2020. Int. J. Prod. Econ. 2010, 128, 31–42. [Google Scholar] [CrossRef]
  6. Benjaafar, S.; Li, Y.; Daskin, M. Carbon footprint and the management of supply chains: Insights from simple models. IEEE Trans. Autom. Sci. Eng. 2013, 10, 99–116. [Google Scholar] [CrossRef]
  7. Lam, S.L.; Gu, Y. A market-oriented approach for intermodal network optimisation meeting cost, time and environmental requirements. Int. J. Prod. Econ. 2016, 171, 266–274. [Google Scholar] [CrossRef]
  8. Kim, N.S.; Wee, V.B. Toward a better methodology for assessing CO2 emissions for intermodal and truck-only freight systems: A European case study. Int. J. Sustain. Transp. 2014, 8, 177–201. [Google Scholar] [CrossRef]
  9. Zheng, Y.; Liao, H.; Yang, X. Stochastic Pricing and Order Model with Transportation Mode Selection for Low-Carbon Retailers. Sustainability 2016, 8, 48. [Google Scholar] [CrossRef]
  10. Craig, A.J.; Blanco, E.E.; Sheffi, Y. Estimating the CO2 intensity of intermodal freight transportation. Transp. Res. D Transp. Environ. 2013, 22, 49–53. [Google Scholar] [CrossRef]
  11. Kaur, H.; Singh, S.P. Flexible dynamic sustainable procurement model. Ann. Oper. Res. 2017. [Google Scholar] [CrossRef]
  12. Steadieseifi, M.; Dellaert, N.P.; Nuijten, W.; Woensel, T.V.; Raoufi, R. Multimodal freight transportation planning: A literature review. Eur. J. Oper. Res. 2014, 233, 1–15. [Google Scholar] [CrossRef]
  13. Meng, Q.; Wang, X. Intermodal hub-and-spoke network design: Incorporating multiple stakeholders and multi-type containers. Transp. Res. B Meth. 2011, 45, 724–742. [Google Scholar] [CrossRef]
  14. Limbourg, S.; Jourquin, B. Optimal rail-road container terminal locations on the European network. Transp. Res. E Log. 2009, 45, 551–563. [Google Scholar] [CrossRef]
  15. Vermam, M.; Verter, V.; Zufferey, N. A bi-objective model for planning and managing rail-truck intermodal transportation of hazardous materials. Transp. Res. E Log. 2012, 48, 132–149. [Google Scholar] [CrossRef]
  16. Francesco, M.D.; Lai, M.; Zuddas, P. Maritime repositioning of empty containers under uncertain port disruptions. Comput. Ind. Eng. 2013, 64, 827–837. [Google Scholar] [CrossRef]
  17. Bandeira, D.L.; Becker, J.L.; Borenstein, D.A. DSS for integrated distribution of empty and full containers. Decis. Support Syst. 2009, 47, 383–397. [Google Scholar] [CrossRef]
  18. Yang, X.; Low, J.M.W.; Tang, L.C. Analysis of intermodal freight from China to Indian Ocean: A goal programming approach. J. Transp. Geogr. 2011, 19, 515–527. [Google Scholar] [CrossRef]
  19. Resat, H.G.; Turkay, M. Design and operation of intermodal transportation network in the Marmara region of Turkey. Transp. Res. E Log. 2015, 83, 16–33. [Google Scholar] [CrossRef]
  20. Domuţa, C.; Radu, D.; Enache, M.; Aştilean, A. Application for Intermodal Transportation Routing using Bi-objective Time-dependent Modified Algorithm. Acta Electroteh. 2012, 53, 154–159. [Google Scholar]
  21. Namseok, K.; Janic, M.; Wee, B.V. Trade-off between carbon dioxide emissions and logistics costs based on multi-objective optimization. Transp. Res. Rec. J. Transp. Res. Board 2009, 2139, 107–116. [Google Scholar]
  22. Rudi, A.; Fröhling, M.; Zimmer, K.; Schultman, F. Freight transportation planning considering carbon emissions and in-transit holding costs: A capacitated multi-commodity network flow model. Eur. J. Transp. Log. 2016, 5, 123–160. [Google Scholar] [CrossRef]
  23. Demir, E.; Burgholzer, W.; Hrušovský, M.; Arıkan, E.; Jammernegg, W.; Woensel, T.V. A green intermodal service network design problem with travel time uncertainty. Transp. Res. B Meth. 2015, 42, 1439–1443. [Google Scholar] [CrossRef]
  24. Lee, C.T.; Hashim, H.; Ho, C.S.; Fan, Y.V.; Klemeš, J.J. Sustaining the low-carbon emission development in Asia and beyond: Sustainable energy, water, transportation and low-carbon emission technology. J. Clean. Prod. 2017, 146, 1–13. [Google Scholar] [CrossRef]
  25. KılıÇ, F.; Gök, M. A demand based route generation algorithm for public transit network design. Comput. Oper. Res. 2014, 51, 21–29. [Google Scholar] [CrossRef]
  26. Vermam, M.; Verter, V. A lead-time based approach for planning rail–truck intermodal transportation of dangerous goods. Eur. J. Oper. Res. 2010, 202, 696–706. [Google Scholar] [CrossRef]
  27. An, C.; Macharis, C.; Janssens, G.K. Corridor network design in hinterland transportation systems. Flex. Serv. Manuf. J. 2012, 2, 294–319. [Google Scholar]
  28. Braekers, K.; An, C.; Janssens, G.K. Optimal shipping routes and vessel size for intermodal barge transport with empty container repositioning. Comput. Ind. 2013, 64, 155–164. [Google Scholar] [CrossRef]
  29. Ishfaq, R.; Sox, C.R. Design of intermodal logistics networks with hub delays. Eur. J. Oper. Res. 2012, 220, 629–641. [Google Scholar] [CrossRef]
  30. Li, L.; Negenborn, R.R.; Schutter, B.D. Intermodal freight transport planning—A receding horizon control approach. Transp. Res. C Emerg. 2015, 60, 77–95. [Google Scholar] [CrossRef]
  31. Sterzik, S.; Kopfer, H.A. Tabu Search Heuristic for the Inland Container Transportation Problem. Comput. Oper. Res. 2013, 40, 953–962. [Google Scholar] [CrossRef]
  32. Nossack, J.; Pesch, E. A truck scheduling problem arising in intermodal container transportation. Eur. J. Oper. Res. 2013, 230, 666–680. [Google Scholar] [CrossRef]
  33. Zhang, J.; Zhang, Q.; Zhang, L. A Study on the Paths Choice of Intermodal Transport Based on Reliability, 2014; Springer: Berlin, Germany, 2015; pp. 305–315. [Google Scholar]
  34. Wang, S.; Wang, L.; Xu, Y.; Liu, M. An effective estimation of distribution algorithm for the flexible job-shop scheduling problem with fuzzy processing time. Int. J. Prod. Res. 2013, 51, 3778–3793. [Google Scholar] [CrossRef]
  35. Wang, L.; Wang, S.; Zheng, X. A hybrid estimation of distribution algorithm for unrelated parallel machine scheduling with sequence-dependent setup times. IEEE. J. Autom. Sin. 2016, 3, 235–246. [Google Scholar]
  36. Salcedo-Sanz, S. A survey of repair methods used as constraint handling techniques in evolutionary algorithms. Comput. Sci. Rev. 2009, 3, 175–192. [Google Scholar] [CrossRef]
  37. Wang, Y.; Cai, Z.; Guo, G.; Zhou, Y.Q. Multiobjective optimization and hybrid evolutionary algorithm to solve constrained optimization problems. IEEE Trans. Syst. Man Cybern. B 2007, 37, 560–575. [Google Scholar] [CrossRef]
  38. Li, H.; Zhang, Q. Multiobjective optimization problems with complicated Pareto sets, MOEA/D and NSGA-II. IEEE Trans. Evolut. Comput. 2009, 13, 284–302. [Google Scholar] [CrossRef]
  39. Nowicki, E.; Smutnicki, C. A fast tabu search algorithm for the permutation flow-shop problem. Eur. J. Oper. Res. 1996, 91, 160–175. [Google Scholar] [CrossRef]
  40. Qian, B.; Wang, L.; Huang, D.X.; Wang, X. Multi-objective no-wait flow-shop scheduling with a memetic algorithm based on differential evolution. Soft Comput. 2009, 13, 847–869. [Google Scholar] [CrossRef]
  41. Deb, K.; Pratap, A.; Agarwal, S.; Meyarivan, T. A fast and elitist multiobjective genetic algorithm: NSGA-II. IEEE Trans. Evolut. Comput. 2002, 6, 182–197. [Google Scholar] [CrossRef]
  42. Bérubé, J.F.; Gendreau, M.; Potvin, J.Y. An exact-constraint method for bi-objective combinatorial optimization problems: Application to the traveling salesman problem with profits. Eur. J. Oper. Res. 2009, 194, 39–50. [Google Scholar] [CrossRef]
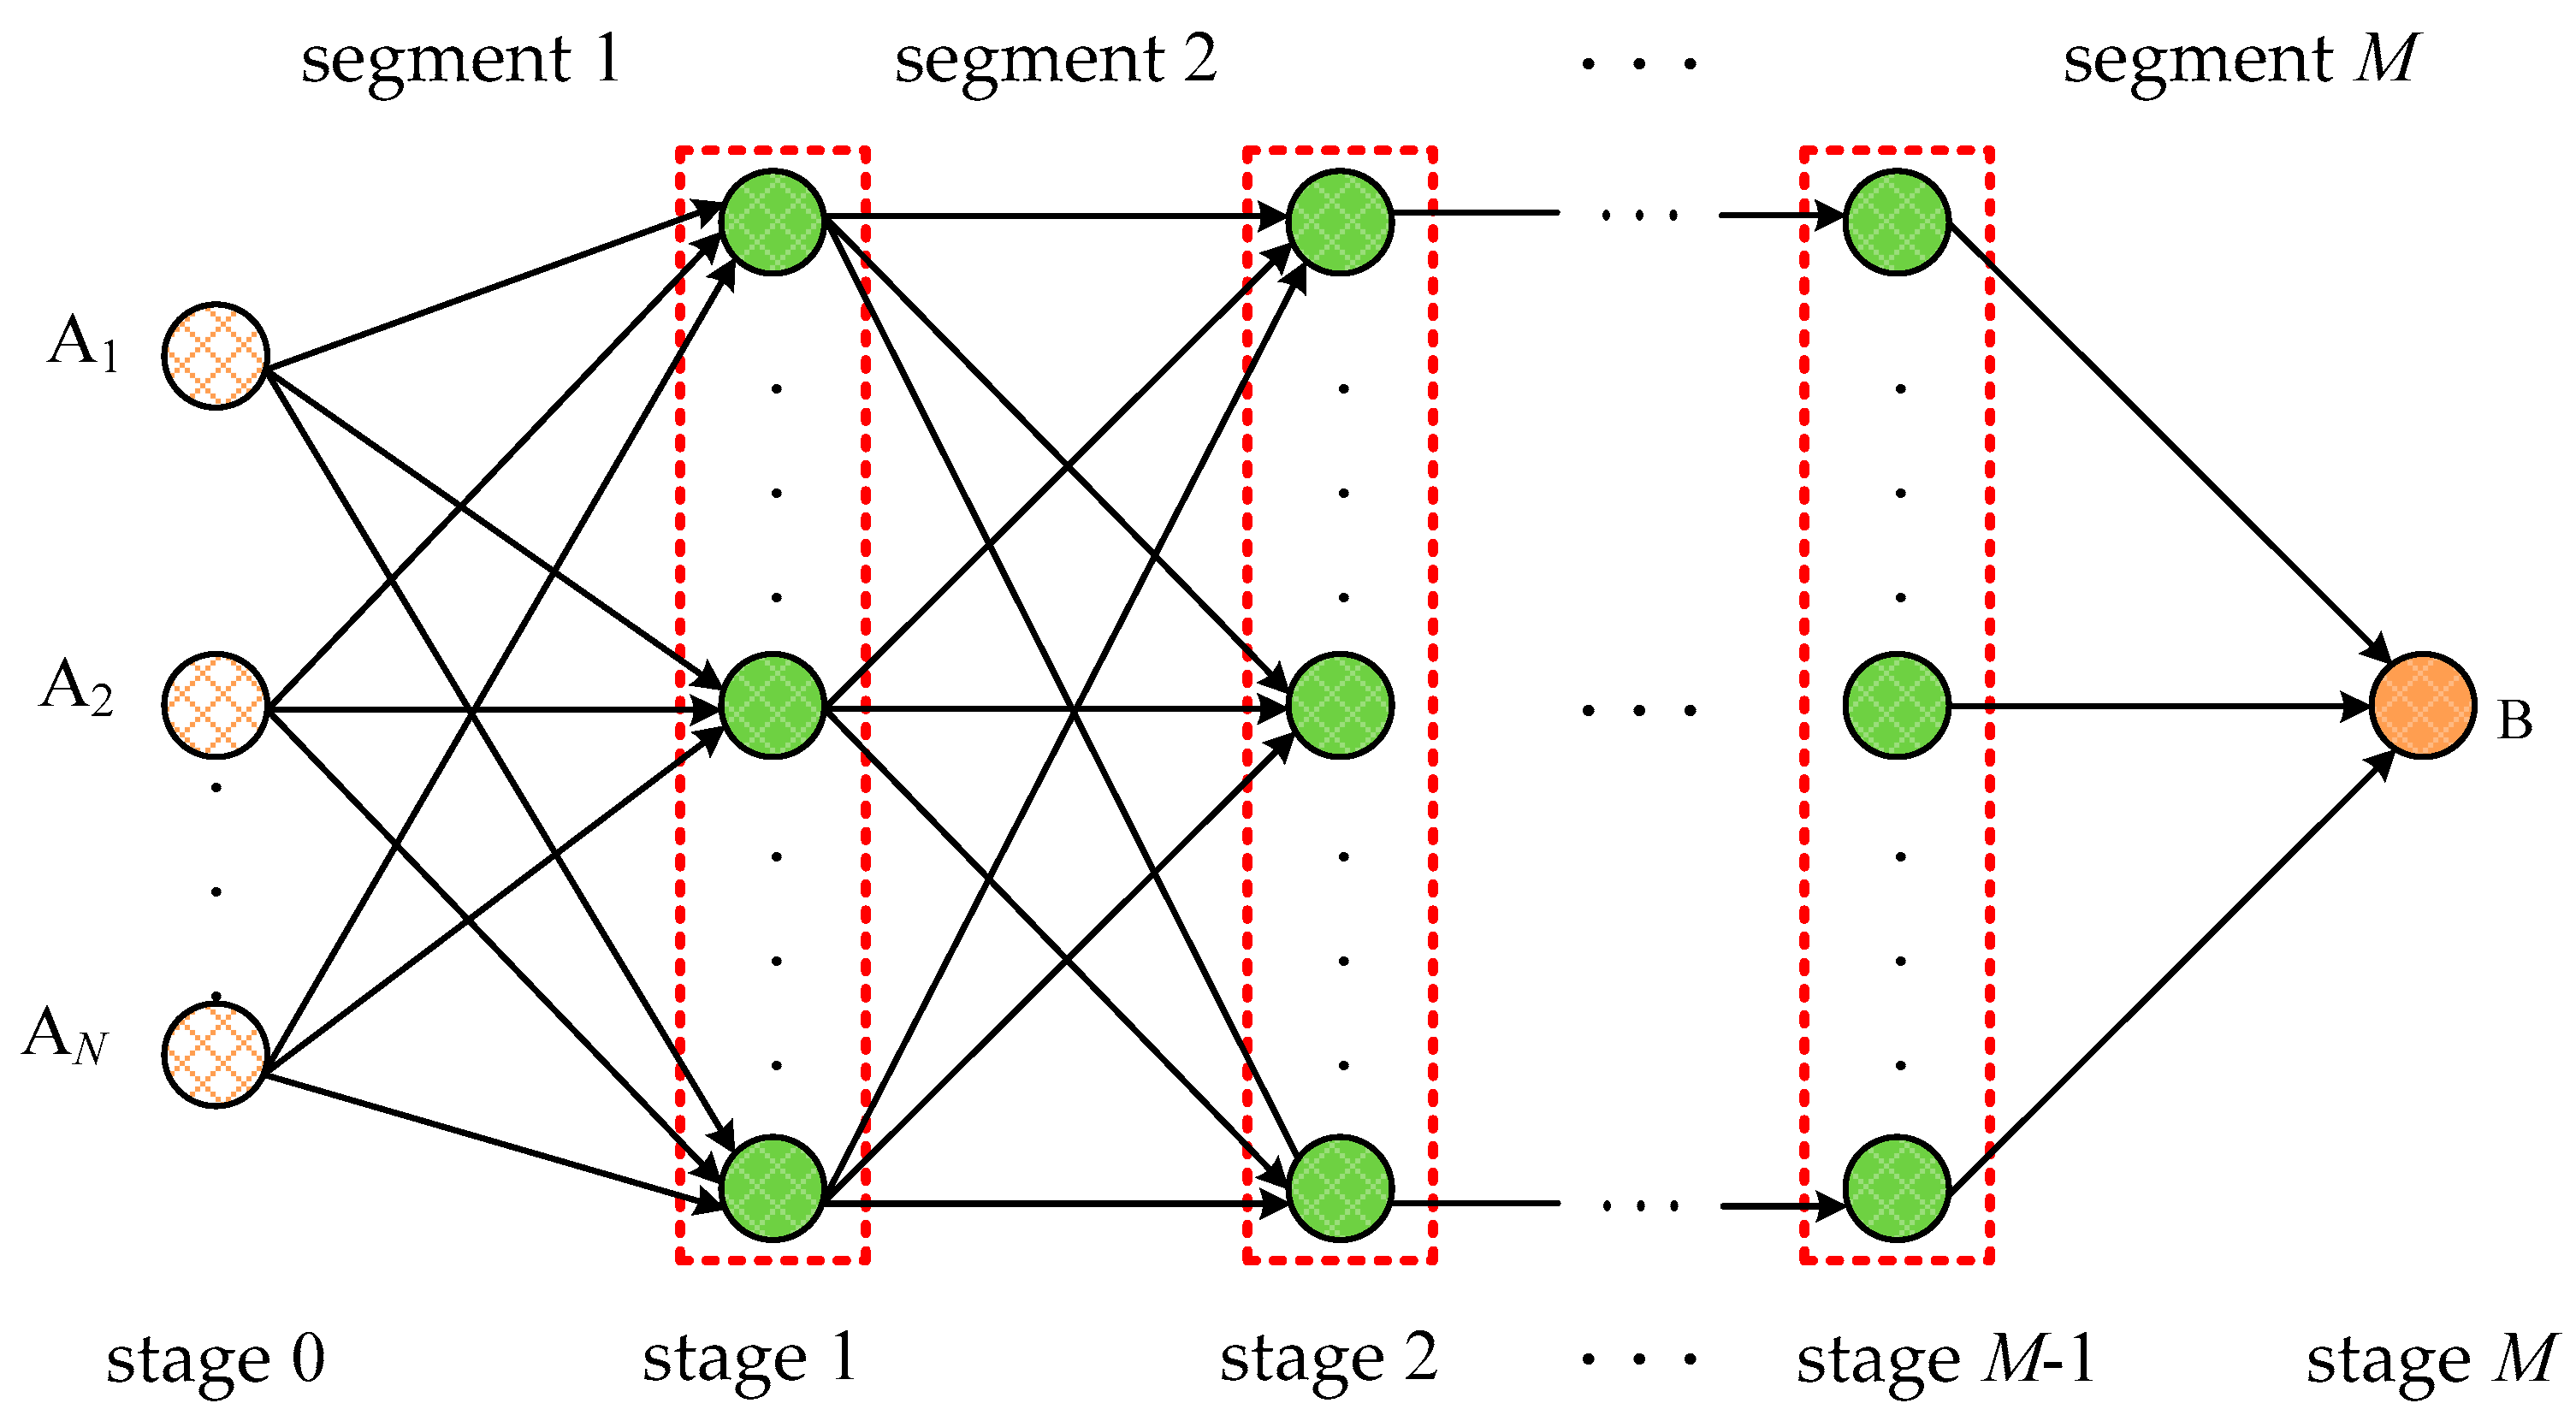
Figure 1. Structure of multi-sourcing intermodal transportation network.
Sustainability 09 01133 g001
Figure 2. The procedure of updating the Pareto archive.
Sustainability 09 01133 g002
Figure 3. The procedure of updating the probability model.
Sustainability 09 01133 g003
Figure 4. The procedure of calculating MDF.
Sustainability 09 01133 g004
Figure 5. The procedure of generating new population.
Sustainability 09 01133 g005
Figure 6. The schematic diagram of partially interchanged neighborhood (PIN).
Sustainability 09 01133 g006
Figure 7. The procedure of PIN-based local search.
Sustainability 09 01133 g007
Figure 8. The procedure of HEDA.
Sustainability 09 01133 g008
Figure 9. The Obtained approximate Pareto fonts of all algorithm. (a) 10 × 5 ; (b) 20 × 5 ; (c) 30 × 7 ; (d) 40 × 9 ; (e) 50 × 13 .
Sustainability 09 01133 g009
Figure 10. The trends of run time for the algorithms. * The feasibility rates of these four algorithms are 100%.
Sustainability 09 01133 g010
Figure 11. Intermodal transportation network for JPC.
Sustainability 09 01133 g011
Figure 12. Transportation routes obtained via HEDA.
Sustainability 09 01133 g012
Table 1. Comparisons of HEDA, NSGAII, PGA and HEDA-noLS (ONSN).
InstanceHEDA vs. NSGAIIHEDA vs. PGAHEDA vs. HEDA_noLS
NSGAIIHEDAPGAHEDAHEDA_noLSHEDA
MAXAVGSDMAXAVGSDMAXAVGSDMAXAVGSDMAXAVGSDMAXAVGSD
5 × 3 4420.2414.4553.710.6331.570.7953.810.5942.521.2642.810.96
10 × 3 536.2913.9985.481.6520.100.4364.571.2282.762.0483.812.38
10 × 4 523.7612.22105.811.8700.000.00126.522.3492.432.5795.672.40
10 × 5 366.8112.5594.862.0510.140.3594.622.0862.001.9063.431.47
20 × 4 00.000.0093.811.9400.000.0094.241.8240.711.1674.001.57
20 × 5 00.000.0083.671.9800.000.0093.861.6120.520.7373.951.43
20 × 6 00.000.0084.381.7600.000.0083.761.6961.191.8283.711.91
20 × 7 00.000.00104.481.9900.000.0083.481.9430.290.7073.761.74
30 × 6 00.000.0052.521.1800.000.0072.481.4060.861.8372.481.65
30 × 7 00.000.0072.381.4000.000.0052.481.3330.670.9942.001.07
30 × 8 00.000.0041.951.0900.000.0052.331.2830.290.7682.291.69
30 × 9 00.000.0042.001.0700.000.0062.101.3830.290.7631.670.64
40 × 9 00.000.00125.333.4800.000.00114.002.9820.100.43103.523.19
40 × 11 00.000.0062.331.3200.000.0063.141.3910.100.2951.861.04
50 × 13 00.000.0092.001.6900.000.0062.051.1300.000.00102.482.15
Average12.332.473.557.603.651.670.400.120.107.473.561.654.000.981.156.873.161.69
Table 2. Comparisons of HEDA, NSGAII, PGA and HEDA-noLS (RNDS).
InstanceHEDA vs. NSGAIIHEDA vs. PGAHEDA vs. HEDA_noLS
NSGAIIHEDAPGAHEDAHEDA_noLSHEDA
MAXAVGSDMAXAVGSDMAXAVGSDMAXAVGSDMAXAVGSDMAXAVGSD
5 × 3 0.440.210.151.001.000.000.670.330.181.001.000.001.000.680.351.000.780.24
10 × 3 0.530.070.141.001.000.000.250.010.051.001.000.001.000.550.381.000.690.34
10 × 4 0.540.040.131.000.990.020.000.000.001.001.000.001.000.370.331.000.850.30
10 × 5 0.360.070.131.001.000.000.250.040.091.001.000.001.000.430.381.000.990.05
20 × 4 0.000.000.001.001.000.000.000.000.001.001.000.000.750.170.261.001.000.00
20 × 5 0.000.000.001.001.000.000.000.000.001.001.000.000.500.130.191.000.990.03
20 × 6 0.000.000.001.001.000.000.000.000.001.001.000.001.000.200.301.001.000.00
20 × 7 0.000.000.001.001.000.000.000.000.001.001.000.000.500.060.131.001.000.00
30 × 6 0.000.000.001.001.000.000.000.000.001.001.000.000.860.130.271.001.000.00
30 × 7 0.000.000.001.001.000.000.000.000.001.001.000.001.000.170.261.001.000.00
30 × 8 0.000.000.001.001.000.000.000.000.001.001.000.000.750.070.191.001.000.00
30 × 9 0.000.000.001.001.000.000.000.000.001.001.000.001.000.120.301.001.000.00
40 × 9 0.000.000.001.001.000.000.000.000.001.001.000.001.000.050.211.001.000.00
40 × 11 0.000.000.001.001.000.000.000.000.001.001.000.001.000.070.231.001.000.00
50 × 13 0.000.000.001.001.000.000.000.000.001.001.000.000.000.000.001.001.000.00
Average0.120.030.041.001.000.000.080.030.021.001.000.000.820.210.251.000.950.06
Table 3. Table 3. Comparisons of HEDA, NSGAII, PGA and HEDA-noLS (DIR).
InstanceHEDA vs. NSGAII HEDA vs. PGA HEDA vs. HEDA_noLS
NSGAIIHEDA PGAHEDA HEDA_noLSHEDA
MINAVGSDMINAVGSD MINAVGSDMINAVGSD MINAVGSDMINAVGSD
5 × 3 36.64123.3667.770.001107.721012.93 61.66116.4874.670.0060.7351.70 0.0015.6619.030.0025.8753.26
10 × 3 181.89544.88265.340.002286.865945.60 158.87793.87400.310.0055.16246.67 0.00183.72191.640.00128.18163.28
10 × 4 269.571225.25758.570.001550.086811.30 647.411960.32800.040.000.000.00 0.00390.81331.600.0093.72138.05
10 × 5 1598.903824.401870.460.009359.4617,387.86 2038.444826.592376.990.00203.33504.80 32.09829.86593.750.00652.71968.25
20 × 4 1054.052843.731558.430.000.000.00 1954.424134.301889.590.000.000.00 157.671649.531260.860.00233.46401.39
20 × 5 1216.204652.323060.080.000.000.00 2946.406184.592407.240.000.000.00 1096.542973.231518.300.00404.02581.21
20 × 6 1650.115755.402848.660.000.000.00 1967.327092.643234.820.000.000.00 217.862257.731475.940.00691.681160.49
20 × 7 1343.278610.603947.620.000.000.00 2449.4210,036.656093.770.000.000.00 833.734881.322931.440.00371.87954.23
30 × 6 2254.086060.903079.910.000.000.00 2639.698937.825210.970.000.000.00 1347.684364.832613.230.001512.263231.31
30 × 7 1785.606760.444068.560.000.000.00 4635.6011,795.786546.490.000.000.00 1730.084839.593264.240.001572.352319.77
30 × 8 3116.288257.924925.340.000.000.00 5636.0815,186.478625.250.000.000.00 2451.588163.426419.590.001162.143194.25
30 × 9 3917.919219.885022.420.000.000.00 6149.9515,340.4510,717.450.000.000.00 2664.785933.612339.850.001003.982603.61
40 × 9 5795.4019,982.4510,818.120.000.000.00 9074.1334,600.9921,887.460.000.000.00 4809.1215,213.6710,688.430.00525.182348.70
40 × 11 2128.727800.284562.720.000.000.00 6379.8020,857.989415.570.000.000.00 3564.777778.405030.000.00439.481358.51
50 × 13 4697.5310,692.396753.190.000.000.00 10,426.9722,517.9512,695.500.000.000.00 5898.1916,269.5311,700.770.000.000.00
Average2069.746423.613573.810.00953.612077.18 3811.0810,958.866158.410.0021.2853.54 1653.615049.663358.580.00587.791298.42
Table 4. Comparisons of HEDA and CPLEX under a single run.
InstanceCPLEXHEDA
ONSNRNDSDIRTimeONSNRNDSDIRTime
5 × 3 47 *1.000.00<0.170.47107.47<0.1
10 × 3 55 *1.000.001.23100.58645.23<0.1
10 × 4 61 *1.000.002.37130.89961.30<0.1
10 × 5 38 *1.000.005.2480.91809.26<0.1
20 × 4 80.88879.018.78100.982.541.38
20 × 5 110.87669.2525.33111.000.002.56
20 × 6 90.74420.2138.36101.000.005.25
20 × 7 70.89321.521 h limit91.000.006.24
30 × 6 40.77264.672 h limit71.000.0010.62
30 × 7 70.7474.452 h limit61.000.0011.23
30 × 8 30.52254.912 h limit51.000.0012.08
30 × 9 40.69141.122 h limit61.000.0012.21
50 × 13 50.56957.764 h limit111.000.0013.45
40 × 11 ----71.000.0017.77
50 × 13 ----101.000.0019.25
* Optimal solutions.
Table 5. Nodes in each stage.
StageStage 1Stage 2Stage 3Stage 4Stage 5
NodesHong Kong (1)
Fuzhou (2)
Wenzhou (3)
Shanghai (4)
Wuhan (1)
Nanjing (2)
Zhengzhou (1)
Jinan (2)
Beijing (1)
Tianjin (2)
Jilin (1)
Table 6. Quantity of freight from each sourcing place.
Sourcing PlaceTokyoAmericaAustraliaManila
Supply/TEU805050120
Table 7. Parameters of transportation cost and speed for each mode.
ModeWaterwayRailwayRoad
Transportation cost ($/TEU-km)0.2 (Ship)0.18 (Barge)0.52
Carbon emission cost ($/TEU-km)0.018 (Ship)0.015 (Barge)0.030.05
Average speed (km/h)40 (Ship)30 (Barge)7070
Table 8. The Pareto set obtained by HEDA.
SolutionTokyoAmericaAustraliaManilasTTC/$MFT/hCEC/$Feasibility (Yes/No)
11-4-2-1-1-1-2-2-21-1-3-2-1-1-1-1-31-1-2-2-1-2-3-2-21-1-2-2-1-2-2-1-2110,7996012330Yes
21-1-2-2-1-2-2-2-21-1-2-2-1-1-3-2-31-1-2-2-1-1-2-2-21-1-2-2-1-2-2-2-299,0976142041Yes
31-1-2-1-1-2-2-2-21-1-2-2-1-2-3-1-31-1-2-2-1-2-2-1-21-1-2-1-1-2-2-1-292,1886171854Yes
41-4-2-2-1-2-2-1-21-1-2-2-1-1-2-2-21-1-2-1-1-2-3-2-21-1-2-2-1-2-2-1-292,1416621850Yes
51-1-2-2-1-2-3-2-21-1-2-2-1-1-3-1-31-1-2-1-1-2-2-1-21-1-2-2-1-2-2-1-2103,6616102106Yes