Bioclimatic Classification of Northeast Asia Reflecting Social Factors: Development and Characterization


1
Department of Environmental Science and Ecological Engineering, Korea University, Seoul 02841, Korea
2
Environmental GIS/RS Center, Korea University, Seoul 02841, Korea
*
Author to whom correspondence should be addressed.
Sustainability 2017, 9(7), 1137; https://doi.org/10.3390/su9071137
Submission received: 30 April 2017
/
Revised: 13 June 2017
/
Accepted: 21 June 2017
/
Published: 28 June 2017
(This article belongs to the Special Issue Regional Sustainability Research Network: Selected Papers from the Expert Group Meeting on Achieving the Sustainable Development Goals with Water–Food–Ecosystem Resilience in the Mid-Latitude Region)
Abstract
:Biodiversity is rapidly declining globally and efforts are needed to mitigate this continually increasing loss of species. Clustering of areas with similar habitats can be used to prioritize protected areas and distribute resources for the conservation of species, selection of representative sample areas for research, and evaluation of impacts due to environmental changes. In this study, Northeast Asia (NEA) was classified into 27 bioclimatic zones using statistical techniques, and it was re-clustered into 14 groups to identify the environmental characteristics of these zones. In particular, we added land cover variables into the clustering to reflect not only simple climate but also social factors influencing biological habitats. In total, 53 bioclimatic variables were constructed, and principal components were generated using correlation analysis and principal component analysis (PCA). The iterative self-organizing data analysis technique algorithm (ISODATA) was used to cluster the principal components and land cover variable. The constructed bioclimatic zones were assigned codes and descriptive names based on aridity, seasonality, and naturality, and their environmental characteristics were identified. This study is significant in that it improved the understanding of biological habitats of NEA and established a basis for monitoring the distribution of species and for efficient and systematic management of biodiversity.
1. Introduction
Biodiversity around the world is rapidly decreasing and will continue to deteriorate if no action is taken [1]. High biodiversity is the most important basis of ecosystem resilience and leads to stable water and food supplies for human society [2,3]. Moreover, there is a lot of evidence that biodiversity strongly influences ecosystem services that are essential benefits to humanity [4,5]. The major causes of biodiversity decline are habitat loss and degradation, pollution, climate changes, over-exploitation, and invasive species [4,6]. To cope with these issues, there is increasing effort worldwide to conserve biodiversity and manage natural resources efficiently [7,8].
For efficient and systematic management of biodiversity, it is necessary to understand the current environment of such. Identification of environmental characteristics provides useful information for conservation of species because similar environments are likely to have similar flora and fauna [9]. Therefore, identifying the areas with similar environmental characteristics based on accurate environmental information and spatially expressing them can provide a basis for biodiversity conservation and efficient management [10]. For example, it can be used to prioritize allocation of resources for biodiversity conservation, to set the spatial range of protected areas, and to set standards for selecting sample areas for research [11,12,13,14].
Many countries such as the UK, Australia, Canada, and some in Europe have been conducting classification research based on ecological characteristics and actively applying the classifications into natural conservation strategies and policies [15,16,17]. However, in most cases, only natural factors such as climate, topography, vegetation, etc. were taken into consideration; thus, social factors, which have significant impact on habitats, have not been included. Even though appropriate natural environmental conditions exist, there are areas where organisms cannot live because of anthropogenic factors, such as land use and population density. Several studies have suggested that the human transformation of land cover is a key driver in the loss of biodiversity and ecosystem services [18,19]. Therefore, it is necessary to reflect social factors in the classification process.
In addition, the problem of biodiversity loss should be addressed on regional, national, and international scales for effective implementation [20,21]. To do this, cooperation is underway to integrate diverse environmental data across these scales and to manage biodiversity efficiently worldwide, including in Europe and North America [16,17]. The mid-latitude region (MLR), which is facing drastic environmental change, needs to implement biodiversity management through such cooperation to ensure resilience of ecosystems. In particular, Northeast Asia (NEA) including North Korea, where rapid biodiversity reduction has been reported because of continuous deforestation and expansion of desertification by accelerating development, needs environmental cooperation between countries and active biodiversity management [22]. Therefore, developing bioclimatic classification in NEA can provide a framework for such environmental monitoring and management through international collaboration.
However, there are some limitations to acquiring various environmental data and to understanding local situations, particularly in the case of North Korea. For this reason, it is more appropriate to use data provided at the global level and quantitative analytical approaches, which are more objective and consistent [23]. Among the several quantitative analytical approaches, Global Environmental Stratification (GEnS) produced by Metzger et al. [24] was developed to support global biodiversity monitoring and ecosystem research based on statistical clustering. GEnS has classified the world’s land into 125 strata with 30arc-seconds resolution using current climate data, and the accuracy of this has been verified and used in various ways [25].
Based on this research methodology, the aims of this study were to establish bioclimatic zones in the NEA, reflecting not only climate but also anthropogenic factors, which are the main causes of habitat destruction. In addition, by identifying the environmental characteristics of each bioclimatic zone, we wanted to enhance understanding of the biological climate of NEA to provide a basis for monitoring and managing biodiversity and for MLR collaborative research.
2. Data and Method
2.1. Study Area (Northeast Asia)
In this study, we set up the boundary of NEA with the Korean Peninsula, which is located between the continents and the oceans, as the center. More specifically, the Korean Demilitarized Zone (DMZ), which was established at the end of the Korean War (1953) to control military hostilities between North Korea and South Korea [26] was used and the range of NEA was set to 10 degrees latitude and longitude from the DMZ. This includes the southern part of China, parts of Mongolia, North Korea, and the southern part of Japan. The study area is shown in Figure 1. The latitudes of the plot range from 28°58′57″ to 47°17′15″ and the longitudes of the plot range from 121°0′56″ to 137°17′12″.
The eastern part of China is mainly a plain area, and the northwest part contains the Gobi and Taklamakan deserts, which are influenced by the continental climate, which includes monsoons. In Korea and Japan, most of each country is mountainous, with the Chinese continent on the west and the Pacific Ocean on the east, which are affected by the temperate monsoon climate. Because of these climatic and geographical features, the study area includes a variety of land cover types, such as desert, grassland, farmland, and temperate forest [27].
2.2. Definition of Bioclimatic Classification
Previous studies have used mixed terminology to identify ecologically homogeneous regions in many countries. For example, in the UK, Hossell et al. [15] used the term “bioclimatic classification”, Metzger [16] used “climatic stratification” for Europe, “Interim Biogeographic Regionalization for Australia (IBRA)” was used by the Australian Ministry of Environment, and the US Environmental Protection Agency used “ecoregions”. Although several studies have used similar concepts under various terms, the terms and concepts were not clearly defined. Therefore, in this study, we define the term “bioclimatic zone” as the area where environmental factors affecting the habitat and species distribution, such as climate, geology, and land cover, are homogenous.
2.3. Bioclimatic Variables and Data
Species are affected by climatic factors, and bioclimatic variables capture various climatic factors that are likely to have relevance to ecological or physiological constraints that determine the distribution of species [28]. Bioclimatic variables, which are derived from monthly temperature and precipitation, have biological significance because they contain annual climate information (e.g., annual mean temperature and annual precipitation), seasonality (e.g., annual range in temperature and precipitation), and extreme environmental conditions (e.g., temperature of the coldest and warmest months and precipitation of the wet and dry quarters) [29]. The 19 bioclimatic variables provided by WorldClim (climate dataset) at the global scale and high resolution are often used in species distribution models.
Metzger et al. [24] identified relevant bioclimatic variables and provided 42 that can be calculated using the WorldClim global dataset [29] and CGIAR-CSI data [30]. In the current study, based on these 42 variables, an additional 11 bioclimatic variables that affect species distributions were constructed based on literature review using the same dataset (Table S1). These bioclimatic variables were established by using the WorldClim global data set v1.4 for 1960–1990 [29], CGIAR-CSI Global Aridity and PET database [30], and CGIAR-CSI SRTM Digital Elevation Model Database v. 4.1 [31]. All variables were constructed with the greatest spatial resolution of 30 arcsec (equivalent to 0.86 km2 at the equator) provided by WorldClim, using ArcGIS 10.2 (ESRI) and R version 3.3.1.
In addition, land cover data were obtained from the Global Land Cover Facility (GLCF) website, (http://www.glcf.umd.edu). This website provides AVHRR Global Land Cover Classification of 1 km resolution, and this land cover map was constructed using the NASA/NOAA Pathfinder Land (PAL) dataset of 14 years (1981–1994). This land cover map is composed of 14 classes, and in the current study, it was reclassified in various ways using ArcGIS and R. Roads and railroads data were taken from Digital Chart of the World (DCW) database and combined as one vector (line) data. The DCW is an Environmental Systems Research Institute, Inc. product originally developed for the US Defense Mapping Agency (DMA). The data contained in the DCW were used to generate a 1:1,000,000-scale vector database covering the entire surface of the earth [32]. Population density was obtained from the LandScan 2000 Global Population 30-arc-second Database (LandScan 2000) which was developed by Oak Ridge National Laboratory for the United States Department of Defense [33]. The population distribution provided by LandScan 2000 is determined by calculating a probability coefficient for each 30-arc-second cell and then applying the coefficient to the best available census counts for each country [34].
2.4. Construction Method for Bioclimatic Zones
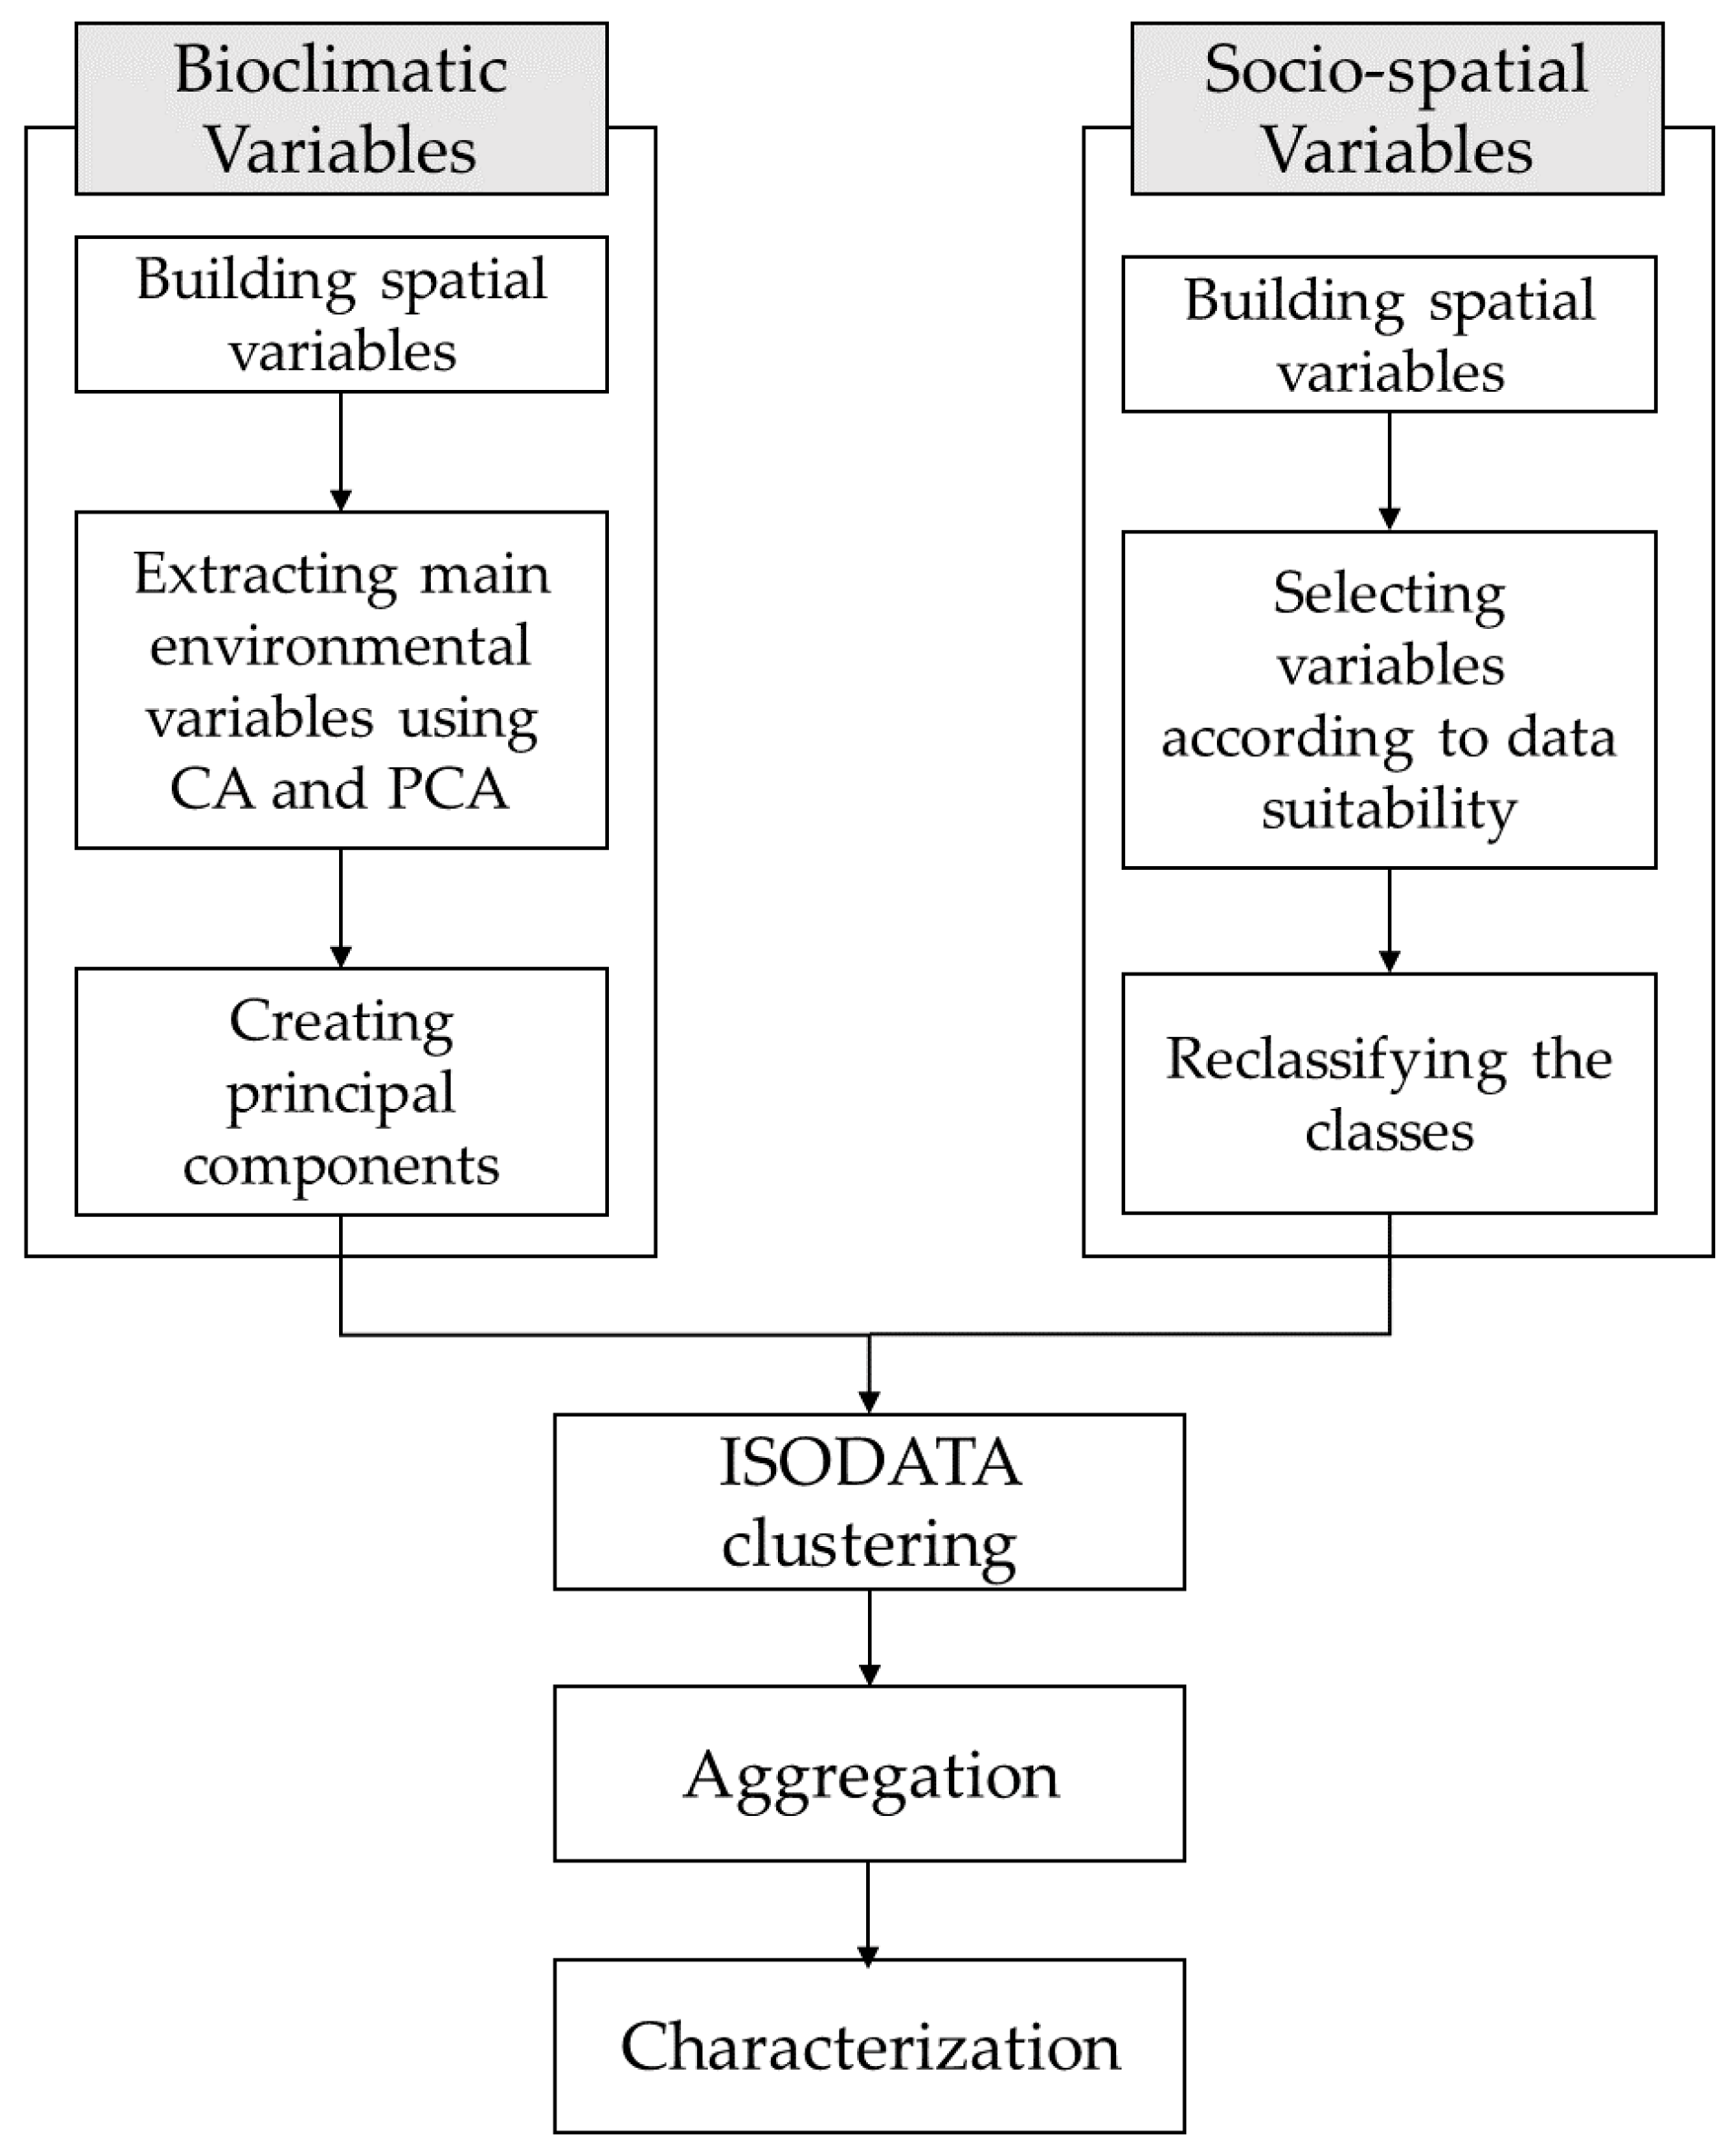
The classification of bioclimatic zones in NEA proceeded in three major stages (Figure 2). Firstly, principal components, which consisted of the best-suited bioclimatic variables for classification at the NEA level, were created. Secondly, social factors affecting the habitat of species were examined and applied into the bioclimatic classification. Finally, clustering was carried out using the extracted principal components and social factor (land cover) variables to establish the bioclimatic classification. To understand the environmental characteristics of each zone, several environmental data, such as temperature, precipitation, and land cover, were analyzed, and based on this analysis, codes and descriptive names of each zone were assigned. All calculations and analyses were performed using ArcGIS 10.2 (ESRI, Redlands, CA, USA) and R version 3.1.3 (R Foundation for Statistical Computing, Vienna, Austria).
2.4.1. Selecting Bioclimatic Variables
Correlation analysis (CA) and principal component analysis (PCA) were performed using the statistical program R version 3.1.3 to derive the main bioclimatic variables. Firstly, all variables were tested for multicollinearity by examining Pearson correlation coefficients. Only one variable from a set of highly correlated variables (r > 0.95) was included in the first PCA. PCA is the process of creating fewer variables that are not correlated as “principal components” with the aim of explaining the maximum variance using the smallest number of principal components [35]. In other words, it is used to reduce the number of variables and to avoid multicollinearity problems when correlations between independent variables occur.
The first PCA was performed on the remaining list to identify those variables that represented the trend of the data. As a result of the first PCA, only variables with eigenvector loadings >0.1 in the first three principal components were selected for the second PCA. The second PCA was performed for the creation of independent principal components through combination of key variables. The principal components were selected based on the cumulative contribution ratio of 80% and were retained for further analysis.
2.4.2. Selecting Socio-Spatial Variables
The social factors, i.e. anthropogenic factors affecting the biological habitat, were examined for inclusion in the bioclimatic classification. Specifically, variables were selected according to the availability of high-resolution spatial data for NEA, the availability in the statistical model, and whether the variable reflects its impact on the biological habitat. Based on these criteria, land cover data were considered suitable for use. Because land cover is nominal data, numerical values were given for each class to be used in the statistical methods. The distance between each class was regarded as equal and the same interval was applied. A method of introducing 14 classes of raw data as it is and a method of using fewer classes by reclassifying have been tried. The reclassification method was sought as a way to reflect the naturality of land cover that can function as organism habitat and adopted a clustering result with high feasibility and usability depending on the extent of fragmentation.
2.4.3. Clustering
Clustering analysis was performed with the principal components that resulted from the second PCA of bioclimatic variables and reclassified land cover. A key principle of clustering analysis is transforming the characteristics of the analysis target into similarity distances and ordering the clusters based on distance [36]. In this study, the iterative self-organizing data analysis technique algorithm (ISODATA) that Metzger et al. [16,24] used in making GEnS was used to cluster the principal components of the bioclimatic variables and land cover into bioclimatic zones.
Firstly, image fusion was carried out by arranging the first principal component into the Red band, the second principal component with cumulative contribution >80% into the Green Band, and reclassified land cover into the Blue Band. The fused images were clustered using the ISO Cluster tool of ArcMap 10.2.2. The number of zones was subjectively determined based on literature review and prior experience, so that they were appropriate for the objectives and application, i.e., monitoring and managing biodiversity.
2.4.4. Nomination and Characterization
To understand the characteristics of the classified zones, we calculated the annual mean temperature and precipitation and the altitude of each zone. The dendrogram tool in ArcGIS was used to calculate the Euclidean distance between the zones and then to aggregate zones into larger groups. This regrouping was conducted to efficiently describe and characterize each group. For each group, the environmental characteristics, such as aridity, water use efficiency, and land cover, were analyzed, and based on this analysis, codes and descriptive names were assigned. After that, the characteristics were briefly described for each group.
3. Results and Discussion
3.1. Selecting Variables of NEA
The results of the correlation coefficient analysis showed that 25 out of 53 variables had Pearson coefficients greater than 0.95 with at least one other variable (Figure S1). Among these 25 highly correlated variables, only eight were readily interpretable and thus included in the PCA. Because of the first PCA with 36 independent variables, the first three components explained all the variation. Moreover, these three principal components were almost determined by the precipitation effectiveness index (PEI), aridity index (AI), and potential evapotranspiration seasonality (PET seasonality).
To generate the principal components used for the cluster analysis, the second PCA was performed, normalizing these three main variables (Table 1). The first two principal components explaining 86% of the total variance were selected and retained for further analysis. Principal component 1 (PC1) was highly correlated with the AI, which shows moisture availability for potential growth of vegetation [34] and PET seasonality, which is a measure of seasonality of moisture available for vegetation [37], and principal component 2 (PC2) was almost determined by PEI, which is important for vegetation growth [38].
To reflect the social factors, we considered land cover, land use, population density, roads and railroads, and economic index as social variables. Among these variables, only land cover, population density, and roads and railroads data were available with high resolution at the NEA level. The clustering results using these three variables showed fragmentation of the population density and roads and railroads data instead of natural clustering (Figure 3b). If a zone is too fragmented, it is difficult to identify the characteristics of that zone and utilize it. For these reasons, land cover was selected as the most appropriate social variable.
When using the raw data classes as the land cover variables, the bioclimatic zones tended to be too subdivided. For example, in zones that contain different forest types, the difference between each forest type was recognized as the difference between urban and agricultural areas. Therefore, from the viewpoint of biological habitat, the land cover was reclassified into three categories. The reclassification criterion was the ecosystem function of each land cover to support biodiversity. Urbanization and agriculture are two of the major causes of ecosystem destruction, threatening biodiversity through direct habitat conversion [39,40,41] and indirect impacts such as pollutant emissions and disturbance of water and nutrient cycles [42,43]. In particular, because cropland and grassland are structurally simplified compared to forest, and susceptible to humans, there are fewer species that can inhabit than forest or water [44,45]. In addition, due to the climatic and environmental characteristics of NEA, most grassland is distributed near cropland, rather than the natural grassland. The Inner Mongolia grassland in the northwest of NEA is a natural area, but its biodiversity is not high due to its dry climate [46]. In this respect, forest and water are classified as natural area; cropland, grassland and bare land are classified as semi-natural area; and built-up area is classified as artificial area.
Cluster analysis was performed by fusion with PC1 and PC2, which were produced via bioclimatic variables, and the reclassified land cover (Figure 4).
3.2. Bioclimatic Classification of NEA
From the clustering, NEA could be divided into 27 bioclimatic zones, which were numbered in ascending order of the average values of the first principal component generated for clustering. As the numbers increased, the zone’s position tended to shift from southeast to northwest (Figure 5). It was considered that PC1, which is mainly composed of the AI and PET seasonality, reflects the characteristics of becoming dry and continental according to climate and geographical factors in NEA, which is located along the sea. In other words, it represents the transition from oceanic climate to continental climate.
Mean annual temperatures ranged from 15.8 °C for zone 1, located along the south coast at an average altitude of 44.6 m, to 0.83 °C for zone 14, which is at an average altitude of 860.5 m. The mean annual temperature decreased overall from south to north, but decreased as the altitude increased. Annual precipitation ranged from 401 mm to 2137 mm and decreased from the ocean to the inland side. Regarding altitude, the deviation between the mountainous areas and the flat areas was severe, but the overall trend was an increase from the ocean to inland areas.
Meanwhile, natural areas (i.e., forest and water) and artificial areas (i.e., cities) were distinguished by reflecting land cover. This is considered meaningful in terms of biological habitat, because the zones where the climate is similar, but land cover is different, were divided. In addition, the boundaries of the zones were distinguished along the river and mountain ranges. However, as the regions tend to be fragmented, additional corrections are needed.
Several regions were geographically dispersed, but assigned into one zone. For example, zone 12 includes the Kuma plateau in the northern part of the Korean Peninsula, the Sikhote-Alin Mountains in Russia, and the mountains of Hotakake and Ontake in Japan, as these areas are biologically similar. In this way, we could understand the distribution of regions with similar bioclimates in NEA.
Of the 27 areas, there were areas that occupied very small areas or severely fragmented areas. Because the fragmented and small-size zones are difficult to characterize and describe, the 27 zones were aggregated into 14 larger groups based on a dendrogram (Figure 6). The environmental characteristics of these 14 groups were identified and the descriptive names of the groups were assigned according to properties, and the naming criterion was applied to the relative standard in NEA through histogram distribution (Table 2).
Firstly, Natural (N) and Artificial (A) were classified based on the natural land cover ratio (>80%) in the zone. After that, zones were classified into semi-arid (a), dry (d), moist (m), and wet (w) based on the AI, which is the main determinant variable of the principal component. Finally, using PET seasonality, which assorted Oceanic, Semi-continental and Continental, and PEI, which divided into Low, Mid, and High precipitation efficiency, seven codes from A to G were assigned based on continental and oceanic climate and precipitation efficiencies (Table 3). Then, each of the divided zones was named according to the degree of aridity and land cover status, which occupies the largest portion for each zone (Table 4).
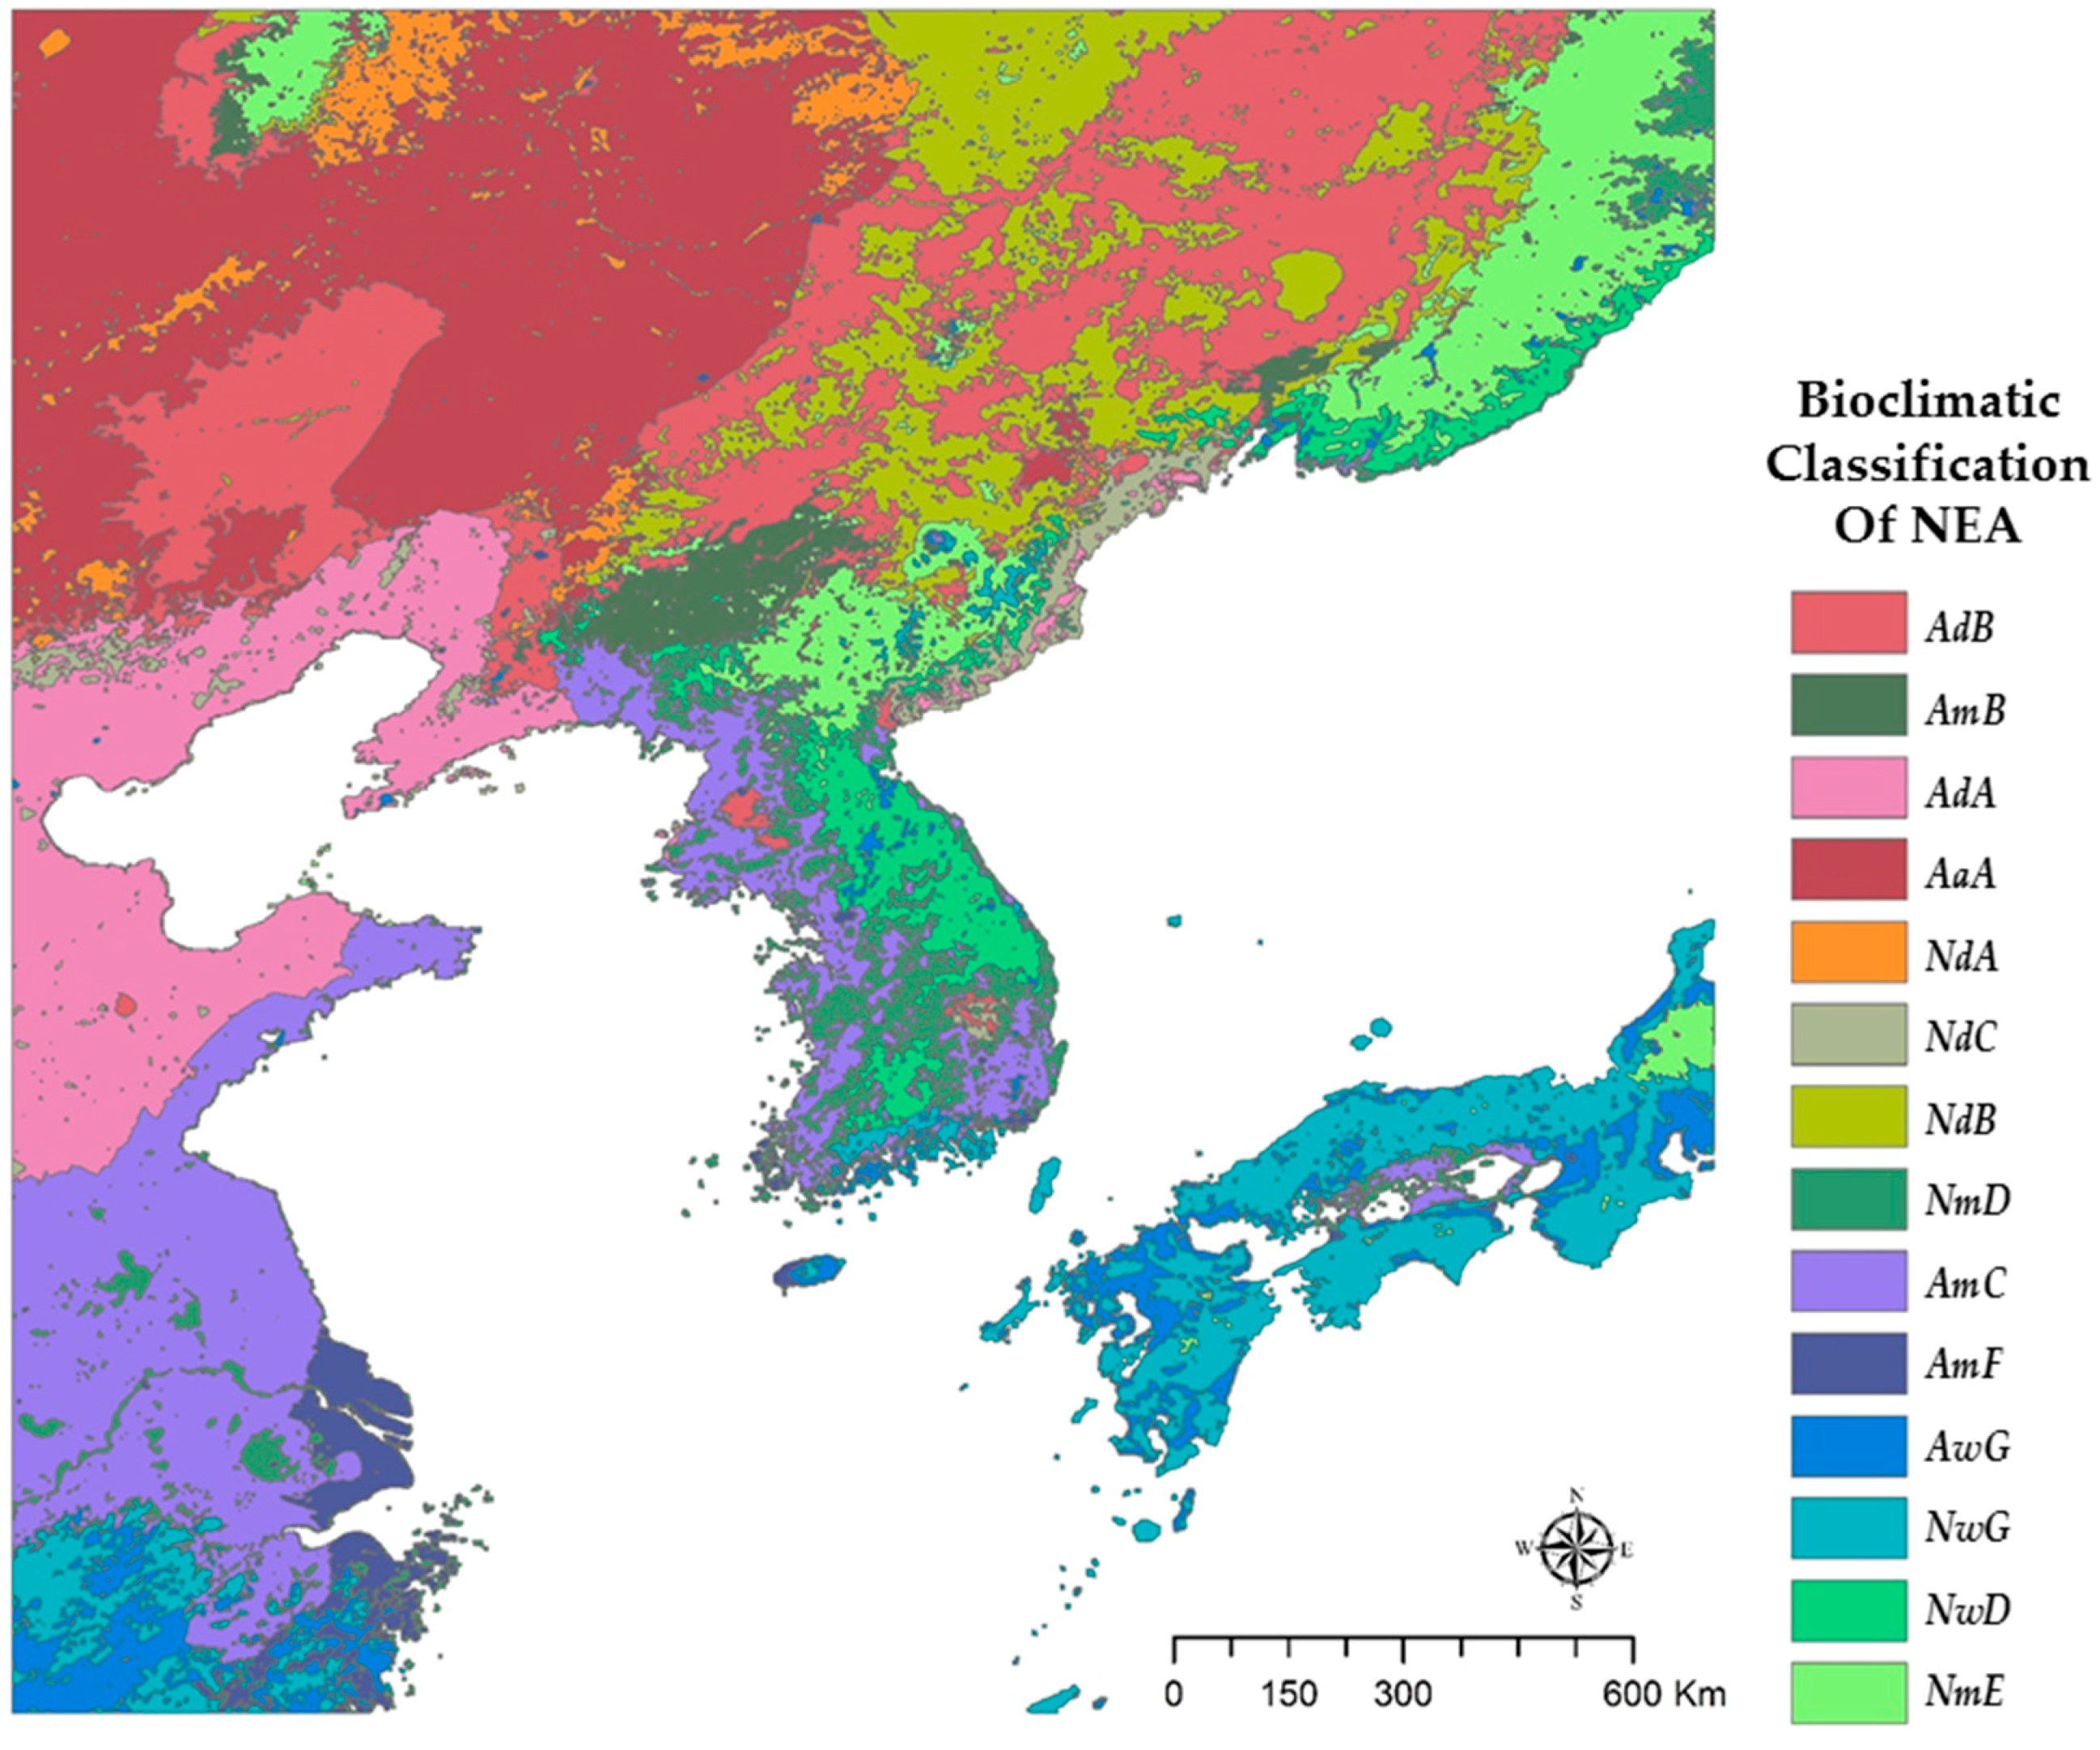
The color legend was constructed using the annual mean temperature, naturality, and AI to define the RGB scheme. Specifically, annual mean temperature was used to define the amount of red, the AI the blue, and naturality the green colorations (Figure 7).
3.3. Environmental Characteristics of Bioclimatic Zones (Response of Land Cover)
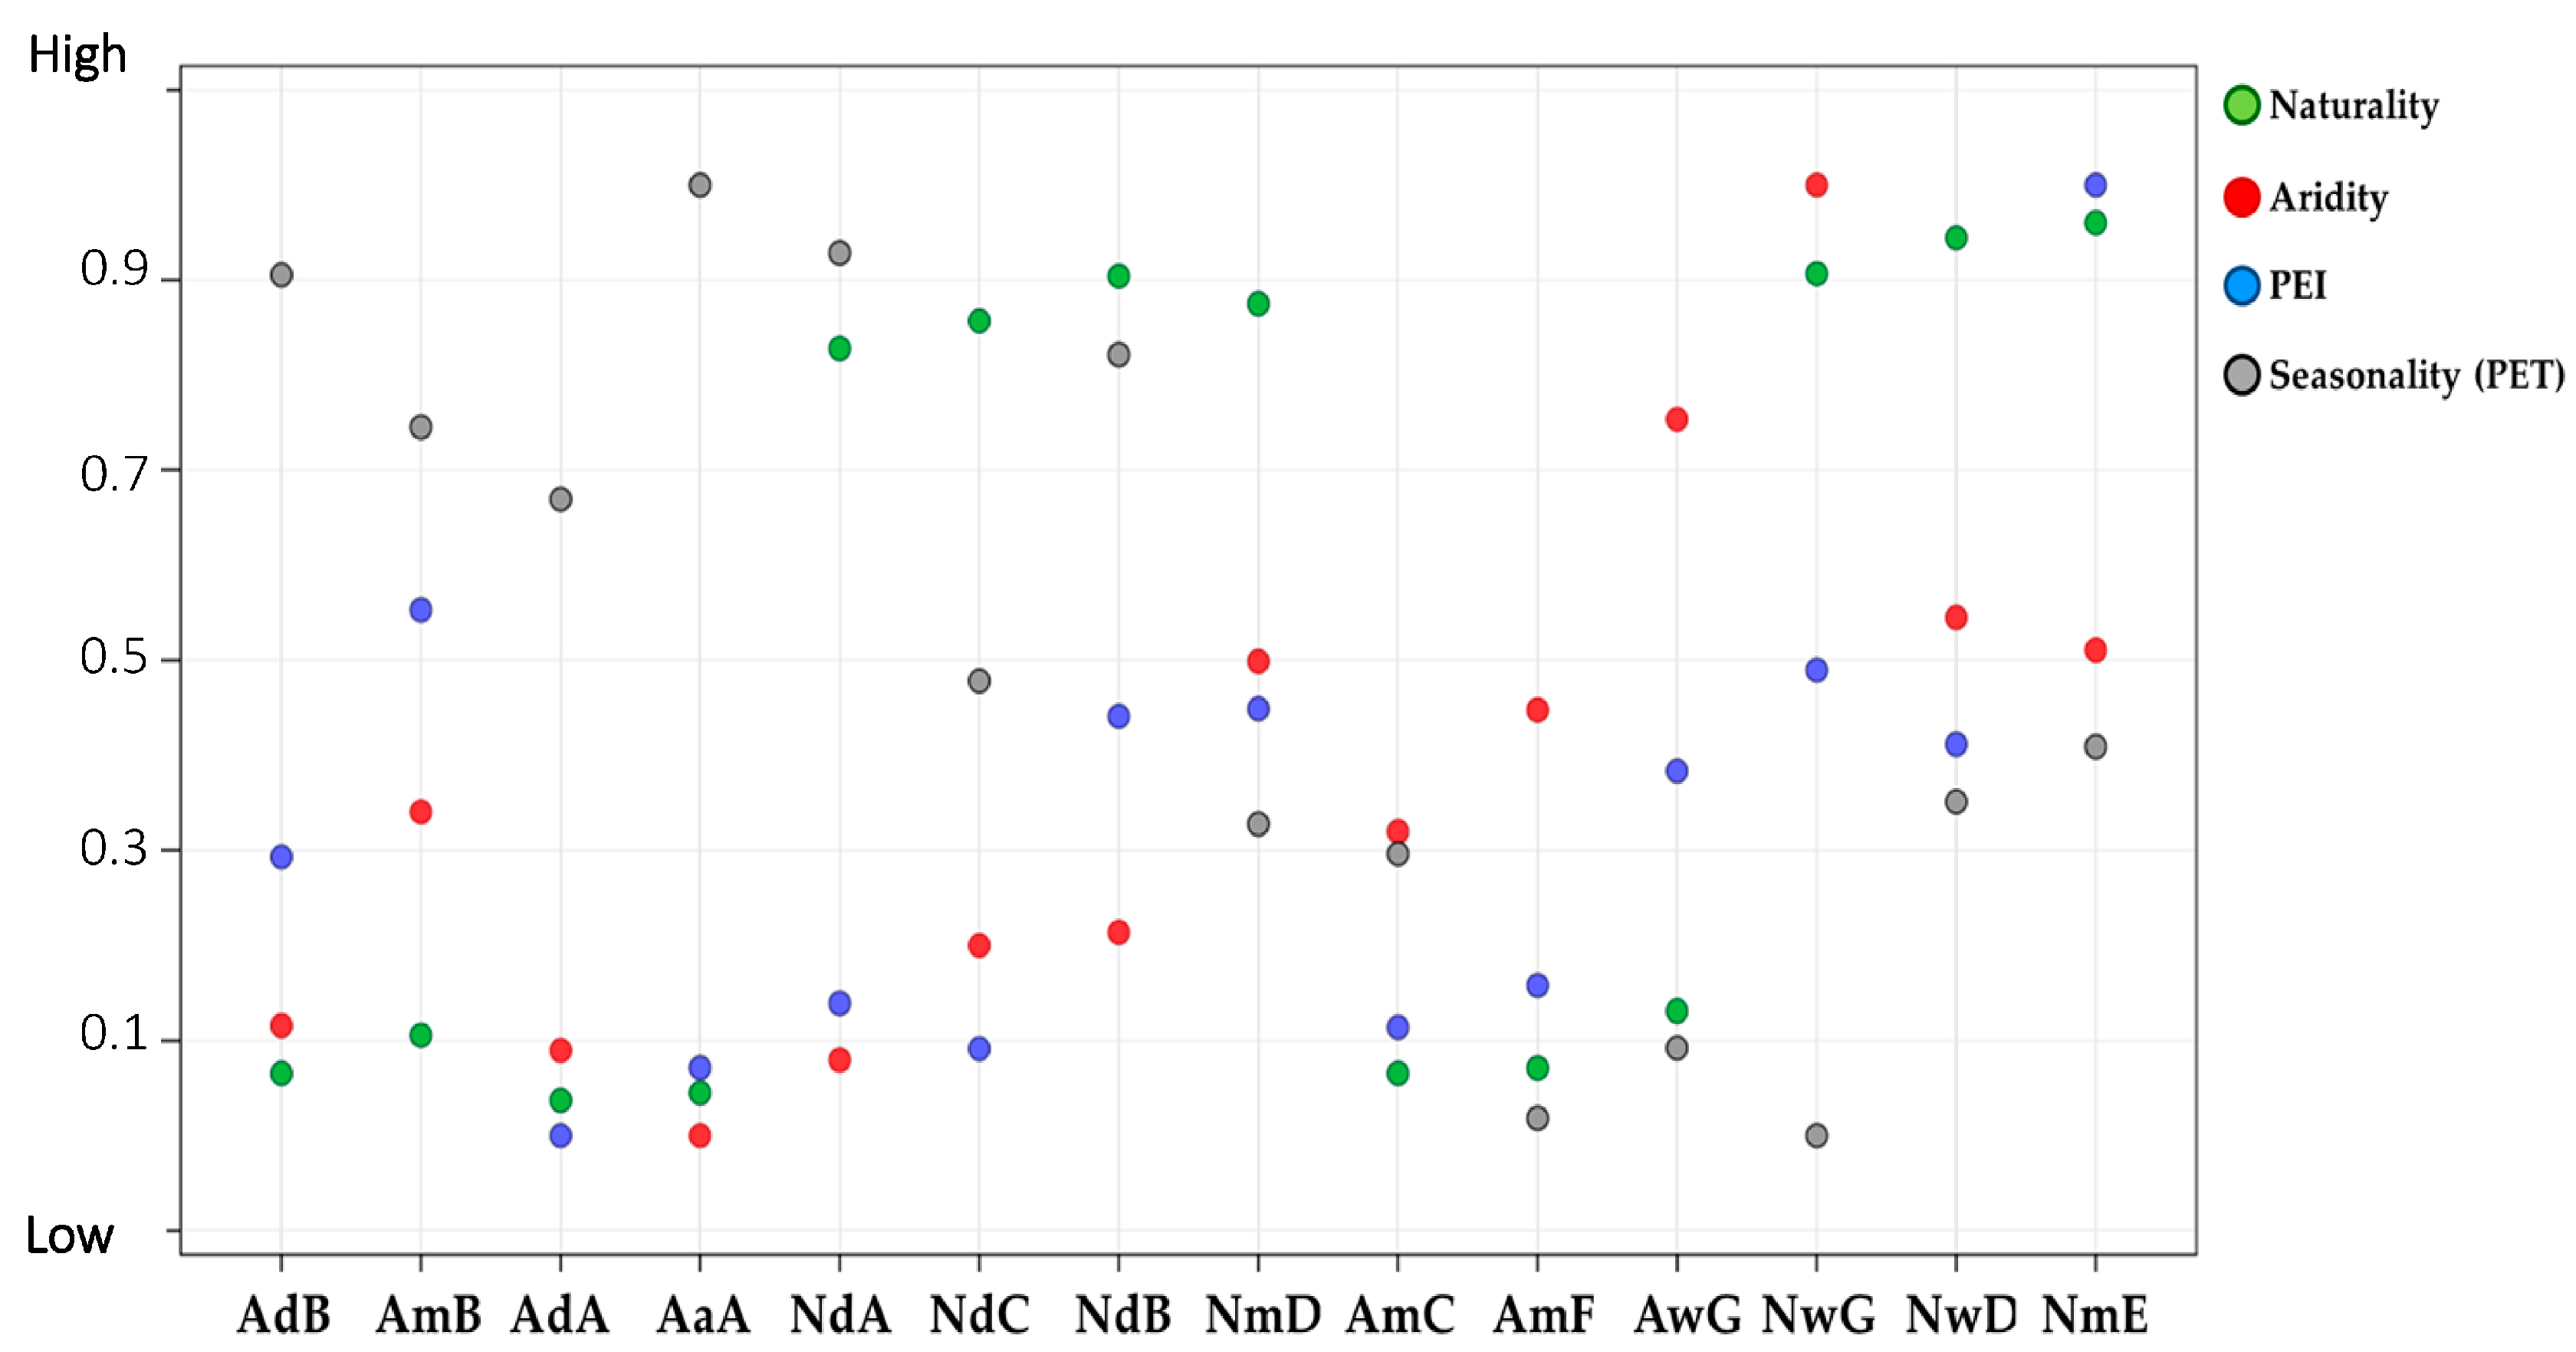
To characterize the environmental characteristics of the classified zones, the distribution of basic climate information such as annual mean temperature, precipitation, altitude, and land cover (Table 5) were studied. Furthermore, the AI, PEI, and PET seasonality, which are the main variables that determined the principal components, were analyzed for each zone (Figure 8). In addition, we extracted the land cover information for each zone and confirmed the naturality of the zone, which is the proportion of natural areas such as forest and water within the zone. The environmental characteristics of each zone are presented in Figure S2.
3.4. Assessment of Bioclimatic Classification by Qualitative Interpretation
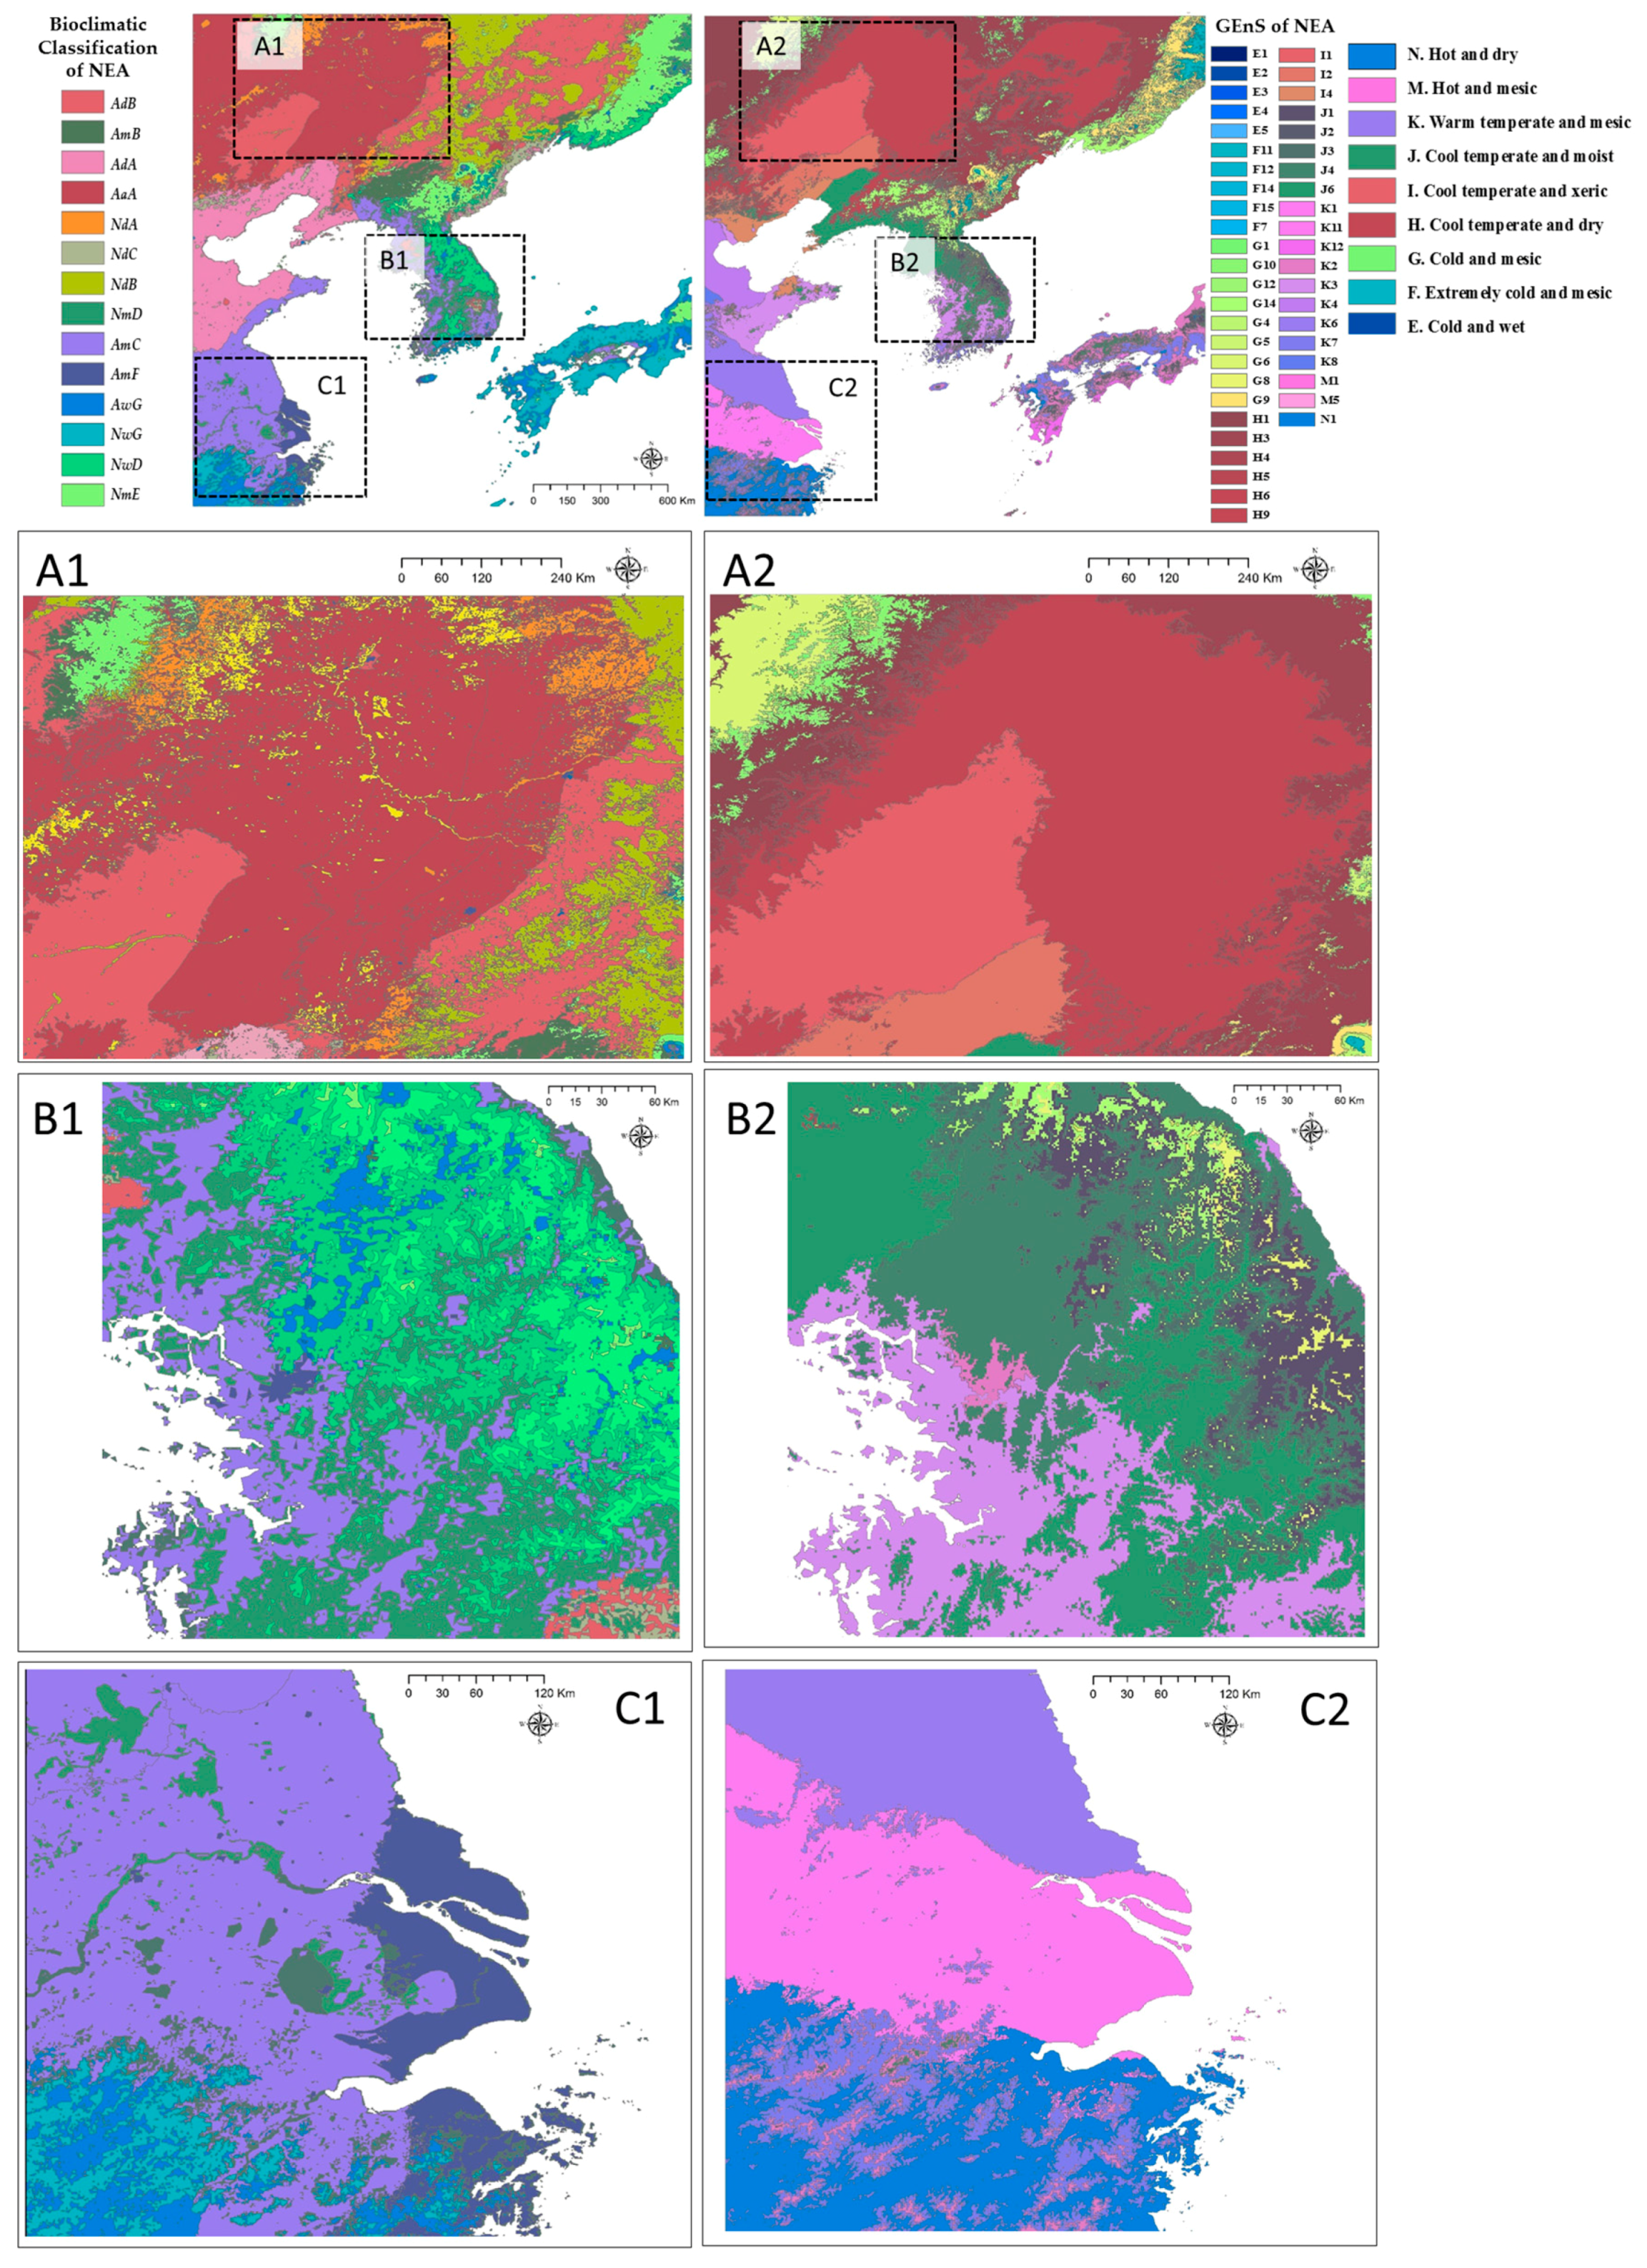
To consider as many bioclimatic variables as possible, in this study, 53 bioclimatic variables were constructed and used by integrating the variables used in previous studies. As a result, we extracted the main bioclimatic variables suitable for NEA that differed from the main variables at the global level. It was considered that the bioclimatic classification of NEA, which was constructed by adding these variables, better classified the regional biological climate than the bioclimate map of the world did. Specifically, we compared the results with those of Metzger et al. [24] (Figure 9). For convenience of comparison, the results of Metzger et al. [24] were expressed in color scheme similar to that used in this study.
From the aspect of regional climate pattern, it was judged that the result of this study distinguishes oceanic climate well. South Korea shows a clear climatic difference between the Baekdudaegan Mountains and the East Sea [47]. These differences are reflected in the results of this study (Figure 9(B1)), whereas the study by Metzger et al. [24] does not distinguish these oceanic climates and classifies the northern part of the Korean peninsula as the same zone (Figure 9(B2)). As can be seen by comparing Figure 9(C1,C2), the two studies clearly differ. In this study, the coastal areas including Shanghai lie in the AmF zone, with higher temperature and precipitation than the surrounding area has, whereas, in Metzger et al. [24], the climate in the coastal region is similar to that in the surrounding area and shows a horizontal climate distribution rather than distinguishing the oceanic climate. Actually, according to the Chinese climate map provided by the Ministry of Construction of the People’s Republic of China, the area near Shanghai and Ning Bo is affected by sea breeze and classified as being in a climate zone that has high temperature and high summer precipitation, which is different from that inland. These results are probably because the PEI selected as the main variable reflects the NEA monsoon climate, which has high precipitation seasonality.
What stands out most in this study are the effects of artificial factors on biological habitat along with natural factors (i.e., bioclimate) from application of the land cover to the statistical methods, which is unlike previous studies that used only climatic variables. In this study, land cover was added as one variable and the ratio of area occupied by natural areas (forest and water) was defined as naturality. Figure 9 displays an example in which naturality is expressed in detail. Firstly, the area that was classified into one zone in Figure 9(A2) is divided according to the land cover in Figure 9(A1). To be specific, in the case of Figure 9(A1), the river is classified as the NdA zone, which is divided into two detailed zones according to the climate. In addition, the distribution of the widely distributed AdB zone and the NdB zone are classified according to the distribution of forest, water, and urban areas.
In the case of Figure 9(B1), the forest is classified as the NwD and NmE zones, major cities in South Korea as the AmF zone, cropland around the cities as the AmC zone, and cropland around the mountains as the AwG zone. It can be judged that the environmental factors affecting the biological habitat are well distinguished in the adjacent areas according to the land cover condition. On the other hand, the distribution pattern of mountain ranges is similar in Figure 9(C2), but the details of these regional climates are not reflected. In the case of Figure 9(C1), the water and urban areas are expressed separately. Urban areas including Shanghai in China are assigned into the AmF zone, which includes urban areas on the Korean Peninsula, and the surrounding cropland is classified as AmC. In addition, the water areas are divided into the NmD zone, which were divided into two sub-zones along the river stem. The AwG zone and the NwG zone in the lower part are also classified according to forests and cropland.
In summary, from the results of classifying with the land cover as the third principal component as well as climate, it can be concluded that the environmental factors affecting biological habitat are well classified according to the climatic conditions in the same land cover, or according to the land cover in a similar climatic environment. In this way, the bioclimatic classification reflecting land cover can provide information that is more useful when applied practically, because it is appropriate for different types of land cover to be used in different policies.
3.5. Implications and Limitations
The results of this study can be used for monitoring and managing biodiversity if changes of the bioclimatic zones due to environmental variation, such as climate change or land cover change, are simulated. Through the simulation of regional changes in response to the environmental variation, it is possible to distinguish between rapidly changing zones and non-changing zones and to suggest different adaptation strategies for each zone [11,12,13,14]. For example, in zones with rapid changes due to climate change, there is a possibility of desertification and a high probability that the survival of species living in these areas will be threatened. Therefore, special adaptation measures are needed to conserve species inhabiting those zones. On the other hand, species in the rapidly changing surrounding zones are likely to move to the zones that are changing less, thus conservation strategies will be needed, such as making the less changing zones core sites of conservation. To use these strategies, it is necessary to identify the vulnerable species of climate change and major species in each region based on the environmental characteristics identified in this study.
Classification using statistical methods is limited in that field verification is not possible [11,16]. Thus, the results of previous studies have been verified by comparing them with existing classification maps or by CA with other environmental data [16]. However, in the current study, it was difficult to acquire environmental spatial data of NEA including North Korea. Therefore, instead of using those verification methods, we tried to analyze the characteristics of each zone and determined that the bioclimatic zones reflect the climatic characteristics and land cover of NEA quite well. In the future, it will be necessary to verify whether the climate affecting the biological habitats is well distinguished through other methods, such as identifying the distribution of representative flora for each zone.
Although the environmental data (climate and land cover data) used in this study are high-resolution data currently available for NEA, they are not the latest data reflecting current climate and land cover. It is necessary to use more detailed data that can reflect social factors, which include not only the distinction between natural and artificial areas but also the land use intensity and the human intervention. In addition, to reflect the land cover in classification using statistical techniques, the nominal data were converted numerically and reclassified into three categories: natural, semi-natural, and artificial areas. This was an attempt to determine whether the areas were habitable. It will be necessary to apply improved methods such as assigning weights to land cover/use types or developing clustering methods that can include species distribution information.
4. Conclusions
To preserve biodiversity, it is necessary to identify areas where the environments are similar and to express them spatially. In this study, NEA was classified into 27 bioclimatic zones, which were clustered into 14 larger groups, and the environmental characteristics of each group were identified.
In total, 53 bioclimatic variables affecting the biological habitats were constructed and a reclassified land cover map was used to reflect anthropogenic factors. From the CA and PCA, the AI, PET seasonality, and PEI were selected as the main climatic variables. The clustering was performed with the principal component generated from these main variables and the land cover. The codes and descriptive names of each zone were given based on aridity, seasonality, and naturality.
In this study, we attempted to establish bioclimatic zones of NEA. It is significant that this study enhances understanding of the bioclimatic environments in NEA and provides a basis for the monitoring and management of biodiversity. In addition, it showed the possibility and necessity of inclusion of social factors in bioclimatic classification. However, there is a limitation in that it cannot be verified because of problems with securing the data and it does not reflect the latest climate and land cover environment. Therefore, further studies such as collecting environmental data and upgrading the methodology that reflects the species habitats and social factors should be conducted in order to make practical use of this material in the future.
Supplementary Materials
The following are available online at www.mdpi.com/2071-1050/9/7/1137/s1, Table S1: 53 bioclimatic variables for statistical clustering, Figure S1: Pearson correlation matrix for 53 variables listed Table S1, Figure S2: Environmental characteristics with a smoothing line showing the trend as the number of zones increases.
Acknowledgments
This work was funded by the Korea Meteorological Administration as part of Research & Development Program with a See-At (See+Atmosphere) grant (KMIPA 2015-6140). We also specially thank Woo-Kyun Lee and Dongfan Piao (Korea University), Guishan Cui and Weihong Zhu (Yanbian University) for their co-operation.
Author Contributions
Y.C. and S.W.J. conceived and designed this research; Y.C. and C.-H.L. analyzed the results and wrote the paper; and J.R. improved and revised the manuscript. All authors provided comments on the manuscript and approved the final version.
Conflicts of Interest
The authors declare no conflict of interest.
Nomenclature
| Dry Crop-Grassland (AdA) | The AdA zone is a region with low naturality, which is composed of about 50% cropland and 26% grassland. It surrounds the Bohai Bay, and many Chinese coastal cities are adjacent to it. Annual mean temperatures are higher than those in the northern part of NEA, but the amount of precipitation is relatively low. Therefore, this zone is dry and has low precipitation effectiveness. |
| Dry Crop-Shrubland (AdB) | The AdB zone is a region where about 50% of the area within the zone is cropland and about 50% shrubland, so naturality is low. This zone is widely distributed in the northern part of NEA and is a low-altitude plain area. It is located in the northern inland area, thus it has a continental climate, which is represented by low annual mean temperature, low precipitation, and very high levels of PET. |
| Dry Mixed Forest (NdB) | The NdB zone is a high naturality region with a mixture of needleleaf and deciduous forests. It includes the largest area of forest among all zones. It occupies a large area in the northern part of NEA. Although it is a dry area, the PEI is high because of the low temperature. |
| Dry Natural Area (NdC) | The NdC zone is a high naturality region with a wide distribution of water, needleleaf forest, and mixed forest. It is scattered sporadically in the central part of NEA, including the eastern coast and the Kyongsang basin in the southern part of the Korean Peninsula and the Bohai Bay in China. It is classified as a dry zone, but it is relatively wet. Moreover, it shows boundary-level climate between the ocean and the inland in terms of seasonality and precipitation effectiveness. |
| Dry Woodland (NdA) | The NdA zone is where most of the deciduous needleleaf forest is distributed. In this zone, woodland occupies the largest area, so naturality is high. It is an inland forest area in north NEA with low temperature and low precipitation. As a result, seasonal fluctuation of PET is high, similar to the AaA zone. |
| Moist Built-up Area (AmF) | The AmF zone is the region with the lowest naturality, as it includes the major metropolitan areas of NEA (Shanghai in China, Seoul in South Korea, Pyongyang in North Korea, and Osaka in Japan). The annual mean temperature is the highest, and the altitude is the lowest. |
| Moist Cropland (AmC) | The AmC zone is a region with low naturality because of the high percentage of cropland. It is the representative granary zone of NEA. It covers the western plains of the Korean Peninsula and the North China Plain and surrounds the Yellow Sea. The average altitude is low because it includes many plains. Located in the south-central part of NEA, the annual mean temperature is high and the PEI is low. |
| Moist Mixed Forest (NmE) | The NmE zone is a highland region that includes the Kuma Plateau in the northern part of the Korean peninsula, the Sikhote-Alin Mountains in Russia, and Mt. Hotakake and Mt. Ontake in Japan. As a result, the altitude is the highest and the annual mean temperature is the lowest. In addition, it is wet and has the highest PEI. Most areas in this zone are made up of forests, with mixed forests accounting for about 40%. |
| Moist Natural Area (NmD) | The NmD zone is a region of high naturality that includes water, needleleaf forest, and woodland in similar proportions. This zone includes the northern and southern regions leading from the Maritime Provinces (Russia) to the northeastern part of NEA to the low mountains of the Korean Peninsula and the watersheds of the Yangtze River Basin. It includes several regions distributed over various latitudes, and thus exhibits a moderate level of environmental characteristics such as mean temperature and precipitation. |
| Moist Shrub-Bare Land (AmB) | The AmB zone is composed of about 40% closed shrubland and 40% bare land, so the proportion of natural area is low. This zone is a large shrub-bare land area located between the Liaodong Peninsula and Amnok River and is in a relatively high altitude area. Although the annual mean temperature is lower than that of the surrounding areas, it is relatively wet with high precipitation. |
| Semi-arid Cropland (AaA) | The AaA zone is a low naturality area, mostly composed of croplands. It is widely distributed in northwest NEA and is mostly affected by continental climate. It is located the most inland of the zones, therefore it has the highest seasonality and the average altitude is relatively high. It is the driest zone, adjacent to Chinese and Mongolian inland deserts, and has less than 500 mm of annual precipitation. |
| Wet Artificial Area (AwG) | The AwG zone is a region that includes grassland, cropland, and built-up areas, and similar to the AmF zone, its naturality is low. It is sporadically distributed near the southern part of NEA, with the annual mean temperature and precipitation the second highest among the zones. |
| Wet Evergreen Forest (NwG) | The NwG zone is the region that contains the most evergreen needleleaf forest, and its naturality is high. It includes most of the southern forest area of NEA and has a high average altitude. Because it is located in the southern coastal region, it has the highest annual precipitation and the lowest PET seasonality and is the wettest region among all zones. |
| Wet Mixed Forest (NwD) | The NwD zone includes the major mountains of the Korean Peninsula and southern coast of the Maritime Provinces, and its naturality is high because of the high proportion of mixed forests. Despite being located at low latitudes, the mean annual temperature is low because it contains many high-altitude mountains. |
References
- Tittensor, D.P.; Walpole, M.; Hill, S.L.L.; Boyce, D.G.; Britten, G.L.; Burgess, N.D.; Butchart, S.H.M.; Leadley, P.; Regan, E.C.; Alkemade, R.; et al. A mid-term analysis of progress toward international biodiversity targets. Science 2014, 346, 241–244. [Google Scholar] [CrossRef] [PubMed]
- Oliver, T.H.; Heard, M.S.; Isaac, N.J.B.; Roy, D.B.; Procter, D.; Eigenbrod, F.; Freckleton, R.; Hector, A.; Orme, C.D.L.; Petchey, O.L.; et al. Biodiversity and resilience of ecosystem functions. Trends Ecol. Evol. 2015, 30, 673–684. [Google Scholar] [CrossRef] [PubMed]
- Folke, C.; Carpenter, S.; Walker, B.; Scheffer, M.; Elmqvist, T.; Gunderson, L.; Holling, C.S. Regime shifts, resilience, and biodiversity in ecosystem management. Annu. Rev. Ecol. Evol. Syst. 2004, 35, 557–581. [Google Scholar] [CrossRef]
- Cardinale, B.J.; Duffy, J.E.; Gonzalez, A.; Hooper, D.U.; Perrings, C.; Venail, P.; Narwani, A.; Mace, G.M.; Tilman, D.; Wardle, D.A.; et al. Biodiversity loss and its impact on humanity. Nature 2012, 489, 326. [Google Scholar] [CrossRef]
- Díaz, S.; Fargione, J.; Chapin, F.S.; Tilman, D. Biodiversity Loss Threatens Human Well-Being. PLoS Biol. 2006, 4, e277. [Google Scholar] [CrossRef] [PubMed]
- Butchart, S.H.M.; Walpole, M.; Collen, B.; van Strien, A.; Scharlemann, J.P.W.; Almond, R.E.A.; Baillie, J.E.M.; Bomhard, B.; Brown, C.; Bruno, J.; et al. Global Biodiversity: Indicators of Recent Declines. Science 2010, 328, 1164–1168. [Google Scholar] [CrossRef] [PubMed]
- Araújo, M.B.; Pearson, R.G.; Thuiller, W.; Erhard, M. Validation of species-climate impact models under climate change. Glob. Chang. Biol. 2005, 11, 1504–1513. [Google Scholar] [CrossRef]
- Stokes, D.L.; Hanson, M.F.; Oaks, D.D.; Straub, J.E.; Ponio, A.V. Local land-use planning to conserve biodiversity: Planners’ perspectives on what works. Conserv. Biol. 2010, 24, 450–460. [Google Scholar] [CrossRef] [PubMed]
- Harding, J.S.; Winterbourn, M.J. An ecoregion classification of the South Island, New Zealand. J. Environ. Manag. 1997, 51, 275–287. [Google Scholar] [CrossRef]
- McMahon, G.; Gregonis, S.M.; Waltman, S.W.; Omernik, J.M.; Thorson, T.D.; Freeouf, J.A.; Rorick, A.H.; Keys, J.E. Developing a spatial framework of common ecological regions for the conterminous United States. Environ. Manag. 2001, 28, 293–316. [Google Scholar] [CrossRef]
- Leathwick, J.R.; Overton, J.; McLeod, M. An environmental domain classification of New Zealand and its use as a tool for biodiversity management. Conserv. Biol. 2003, 17, 1612–1623. [Google Scholar] [CrossRef]
- Awimbo, J.A.; Norton, D.A.; Overmars, F.B. An evaluation of representativeness for nature conservation, Hokitika Ecological District, New Zealand. Biol. Conserv. 1996, 75, 177–186. [Google Scholar] [CrossRef]
- Margules, C.R.; Pressey, R.L. Systematic conservation planning. Nature 2000, 405, 243–253. [Google Scholar] [CrossRef] [PubMed]
- Metzger, M.J.; Brus, D.J.; Bunce, R.G.H.; Carey, P.D.; Gonçalves, J.; Honrado, J.P.; Jongman, R.H.G.; Trabucco, A.; Zomer, R. Environmental stratifications as the basis for national, European and global ecological monitoring. Ecol. Indic. 2013, 33, 26–35. [Google Scholar] [CrossRef]
- Hossell, J.E.; Riding, A.E.; Brown, I. The creation and characterisation of a bioclimatic classification for Britain and Ireland. J. Nat. Conserv. 2003, 11, 5–13. [Google Scholar] [CrossRef]
- Metzger, M.J.; Bunce, R.G.H.; Jongman, R.H.G.; Mücher, C.A.; Watkins, J.W. A climatic stratification of the environment of Europe. Glob. Ecol. Biogeogr. 2005, 14, 549–563. [Google Scholar] [CrossRef]
- Omernik, J.M.; Griffith, G.E. Ecoregions of the conterminous United States: Evolution of a hierarchical spatial framework. Environ. Manag. 2014, 54, 1249–1266. [Google Scholar] [CrossRef] [PubMed]
- Haines-Young, R. Land use and biodiversity relationships. Land Use Policy 2009, 26, S178–S186. [Google Scholar] [CrossRef]
- Firbank, L.G.; Petit, S.; Smart, S.; Blain, A.; Fuller, R.J. Assessing the impacts of agricultural intensification on biodiversity: A British perspective. Philos. Trans. R. Soc. B Biol. Sci. 2008, 363, 777–787. [Google Scholar] [CrossRef] [PubMed]
- Parr, T.W.; Sier, A.R.; Battarbee, R.W.; Mackay, A.; Burgess, J. Detecting environmental change: Science and society—Perspectives on long-term research and monitoring in the 21st century. Sci. Total Environ. 2003, 310, 1–8. [Google Scholar] [CrossRef]
- Davidson, M.D. Equity and the Conservation of Global Ecosystem Services. Sustainability 2017, 9, 339. [Google Scholar] [CrossRef]
- Shim, C.S.; Oh, I.C.; Rho, T.H.; Seo, J.H.; Kim, Y.W.; Park, C.H. A study on the environmental change in East Asia (I): Atmospheric change and biodiversity. Korea Environ. Inst. 2014, 17, 49–68. [Google Scholar]
- Lugo, A.E.; Brown, S.B.; Dodson, R.; Smith, T.S.; Shugart, H.H. The Holdridge life zones of the conterminous United States in relation to ecosystem mapping. J. Biogeogr. 1999, 26, 1025–1038. [Google Scholar] [CrossRef]
- Metzger, M.J.; Bunce, R.G.H.; Jongman, R.H.G.; Sayre, R.; Trabucco, A.; Zomer, R. A high-resolution bioclimate map of the world: A unifying framework for global biodiversity research and monitoring. Glob. Ecol. Biogeogr. 2013, 22, 630–638. [Google Scholar] [CrossRef]
- Jongman, R.H.; Bunce, R.G.; Metzger, M.J.; Mücher, C.A.; Howard, D.C.; Mateus, V.L. Objectives and applications of a statistical environmental stratification of Europe. Landsc. Ecol. 2006, 21, 409–419. [Google Scholar] [CrossRef]
- Jeon, S.W.; Byun, B.S.; Lee, B.J. A basic plan for environmental preservation of DMZ members. Basic Res. Rep. 2003, 2003, 1–20. [Google Scholar]
- Park, Y.Y.; Han, K.S. Ecoclimatic map over North-East Asia using SPOT/VEGETATION 10-day synthesis data. Korean J. Agric. For. Meteorol. 2006, 8, 86–96. [Google Scholar]
- O’Donnel, M.S.; Ignizio, D.A. Bioclimatic Predictors for Supporting Ecological Applications in the Conterminous United States; U.S. Geological Survey: Reston, VA, USA, 2012.
- Hijmans, R.J.; Cameron, S.; Parra, J.; Jones, P.; Jarvis, A.; Richardson, K. WorldClim, version 1.3; University of California: Berkeley, CA, USA, 2005. [Google Scholar]
- Zomer, R.J.; Trabucco, A.; Bossio, D.A.; Verchot, L.V. Climate change mitigation: A spatial analysis of global land suitability for clean development mechanism afforestation and reforestation. Agric. Ecosyst. Environ. 2008, 126, 67–80. [Google Scholar] [CrossRef]
- Jarvis, A.; Reuter, H.I.; Nelson, A.; Guevara, E. Hole-filled SRTM for the Globe Version 4, Available from the CGIAR-CSI SRTM 90m Database. Available online: http://srtm.csi.cgiar.org (accessed on 15 December 2016).
- Langaas, S. Completeness of the Digital Chart of the World (DCW) Database; UNEP/GRID: Arendal, Norway, 1995. [Google Scholar]
- Dunbar, P.K.; Bilham, R.G.; Laituri, M.J. Earthquake loss estimation for India based on macroeconomic indicators. Risk Sci. Sustain. 2003, 112, 163–180. [Google Scholar]
- Dobson, J.E. LandScan Global Population 1998 Database, 1999. Retrieved 27 April 2001 from the World Wide Web. Available online: http://web.ornl.gov/sci/landscan/landscan_data_avail.shtml (accessed on 15 November 2016).
- Lee, K.; Lee, B.W.; Choi, D.-H.; Kim, T.-O.; Shin, D. A study on fault detection monitoring and diagnosis system of CNG stations based on principal component analysis (PCA). J. Korean Inst. Gas. 2014, 18, 53–59. [Google Scholar] [CrossRef]
- Yoo, J.Y.; Choi, M.H.; Kim, T.W. Spatial analysis of drought characteristics in Korea using cluster analysis. J. Korea Water Resour. Assoc. 2010, 43, 15–24. [Google Scholar] [CrossRef]
- Zomer, R.J.; Trabucco, A.; Metzger, M.J.; Wang, M.; Oli, K.P.; Xu, J. Projected climate change impacts on spatial distribution of bioclimatic zones and ecoregions within the Kailash Sacred Landscape of China, India, Nepal. Clim. Chang. 2014, 125, 445–460. [Google Scholar] [CrossRef]
- Thornthwaite, C.W. The climates of North America: According to a new classification. Geogr. Rev. 1931, 21, 633–655. [Google Scholar] [CrossRef]
- Clergeau, P.; Savard, J.P.L.; Mennechez, G.; Falardeau, G. Bird abundance and diversity along an urban-rural gradient: A comparative study between two cities on different continents. Condor 1998, 100, 413–425. [Google Scholar] [CrossRef]
- Blair, R.B. Birds and butterflies along an urban gradient: Surrogate taxa for assessing biodiversity? Ecol. Appl. 1999, 9, 164–170. [Google Scholar] [CrossRef]
- McKinney, M.L. Urbanization, biodiversity, and conservation. BioScience 2002, 52, 883–890. [Google Scholar] [CrossRef]
- Pimentel, D.; Stachow, U.; Takacs, D.A.; Brubaker, H.W.; Dumas, A.R.; Meaney, J.J.; Oneil, J.A.S.; Onsi, D.E.; Corzilius, D.B. Conserving biological diversity in agricultural forestry systems: Most biological diversity exists in human-managed ecosystems. BioScience 1992, 42, 354–362. [Google Scholar] [CrossRef]
- Vitousek, P.M.; Mooney, H.A.; Lubchenco, J.; Melillo, J.M. Human domination of Earth’s ecosystems. Science 1997, 277, 494–499. [Google Scholar] [CrossRef]
- Vitousek, P.M.; Ehrlich, P.R.; Ehrlich, A.E.; Matson, P.A. Human appropriation of the products of photosynthesis. BioScience 1986, 36, 368–373. [Google Scholar] [CrossRef]
- Pimm, S.L. The World According to Pimm; McGraw-Hill: New York, NY, USA, 2001. [Google Scholar]
- Yu, M.; Ellis, J.E.; Epstein, H.E. Regional analysis of climate, primary production, and livestock density in Inner Mongolia. J. Environ. Qual. 2004, 33, 1675–1681. [Google Scholar] [CrossRef] [PubMed]
- Lee, S.; Heo, I.; Lee, K.; Kwon, W. Classification of Local Climatic Regions in Korea. Korean Meteorol. Soc. 2005, 41, 983–995. [Google Scholar]
Figure 1.
Location of the mid-latitude region including: Northeast Asia (left); and land cover of the study area (right).
Figure 1.
Location of the mid-latitude region including: Northeast Asia (left); and land cover of the study area (right).
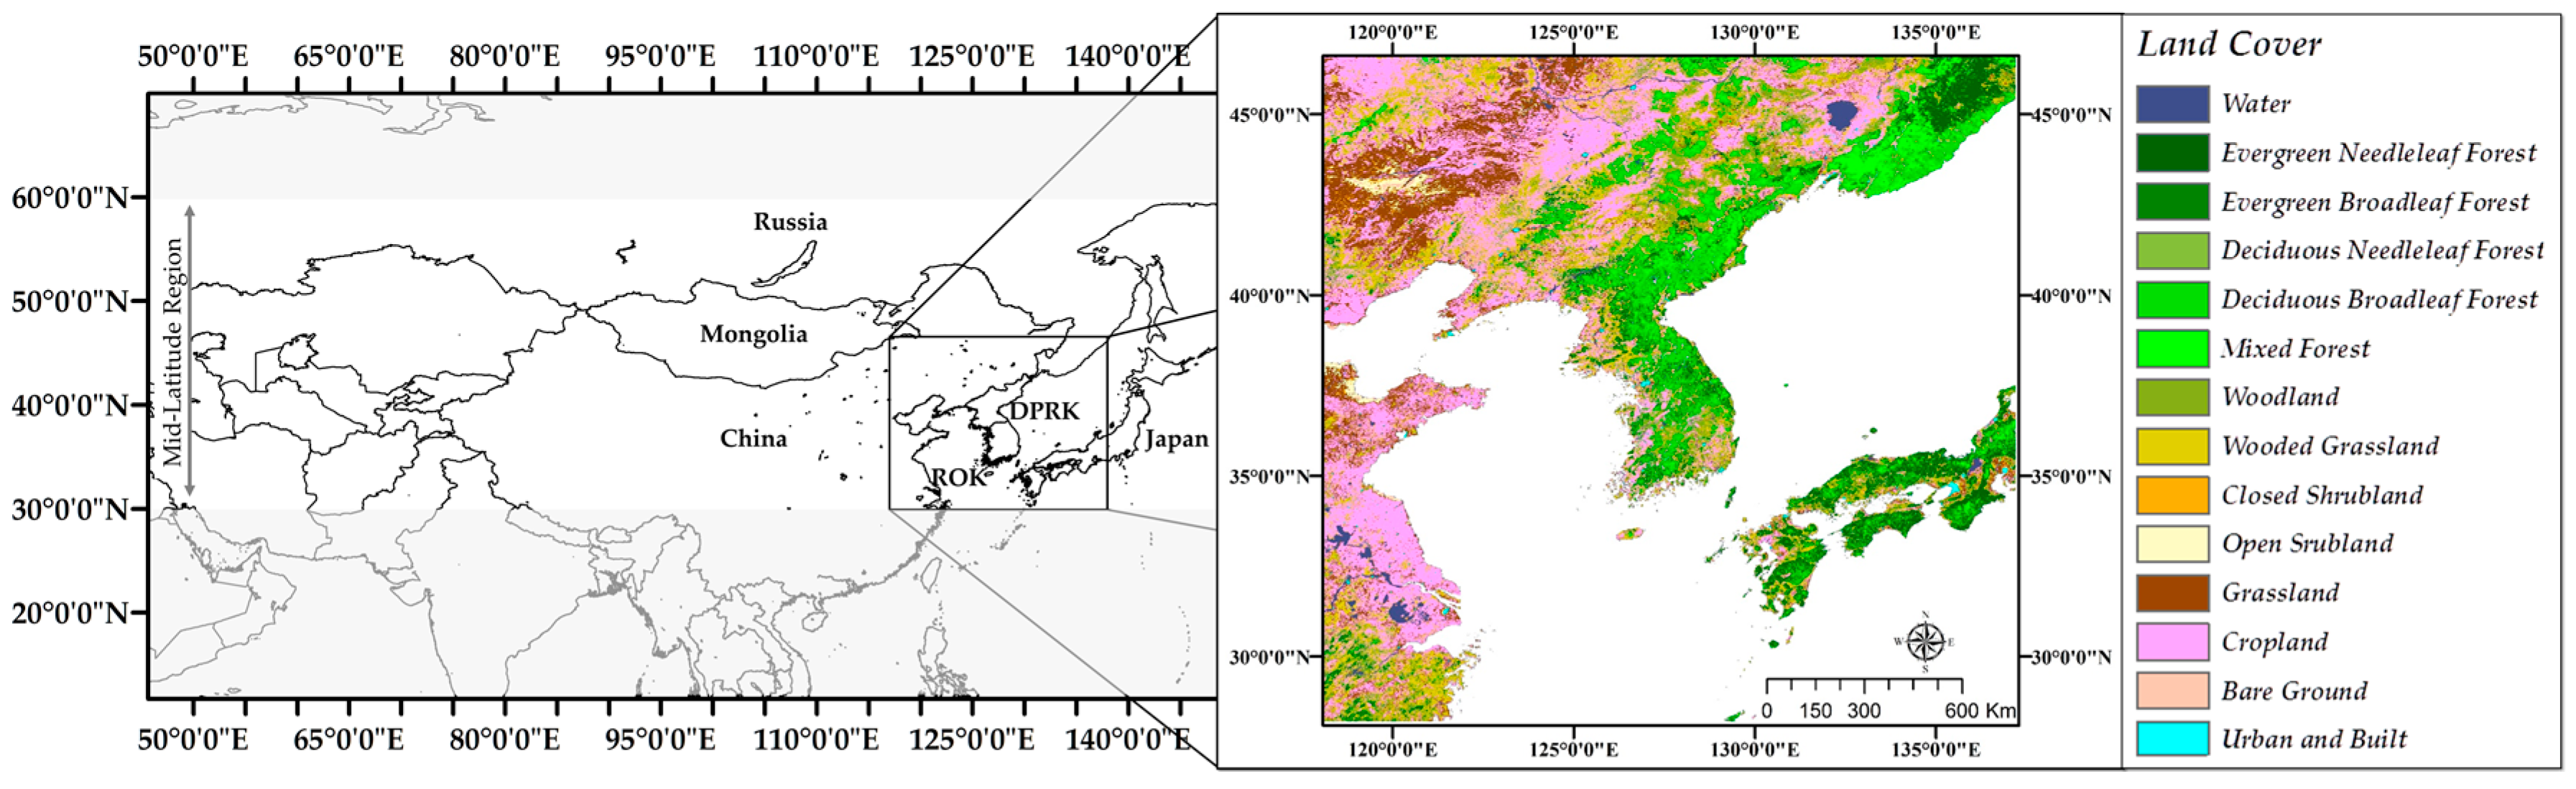
Figure 2.
Research flow of the development and characterization of the bioclimatic classification for Northeast Asia. CA: correlation analysis; PCA: principle component analysis; ISODATA: iterative self-organizing data analysis technique algorithm.
Figure 2.
Research flow of the development and characterization of the bioclimatic classification for Northeast Asia. CA: correlation analysis; PCA: principle component analysis; ISODATA: iterative self-organizing data analysis technique algorithm.

Figure 3.
(a) Selection process of social variables; and (b) an example of fragmentation by applying population density data.
Figure 3.
(a) Selection process of social variables; and (b) an example of fragmentation by applying population density data.
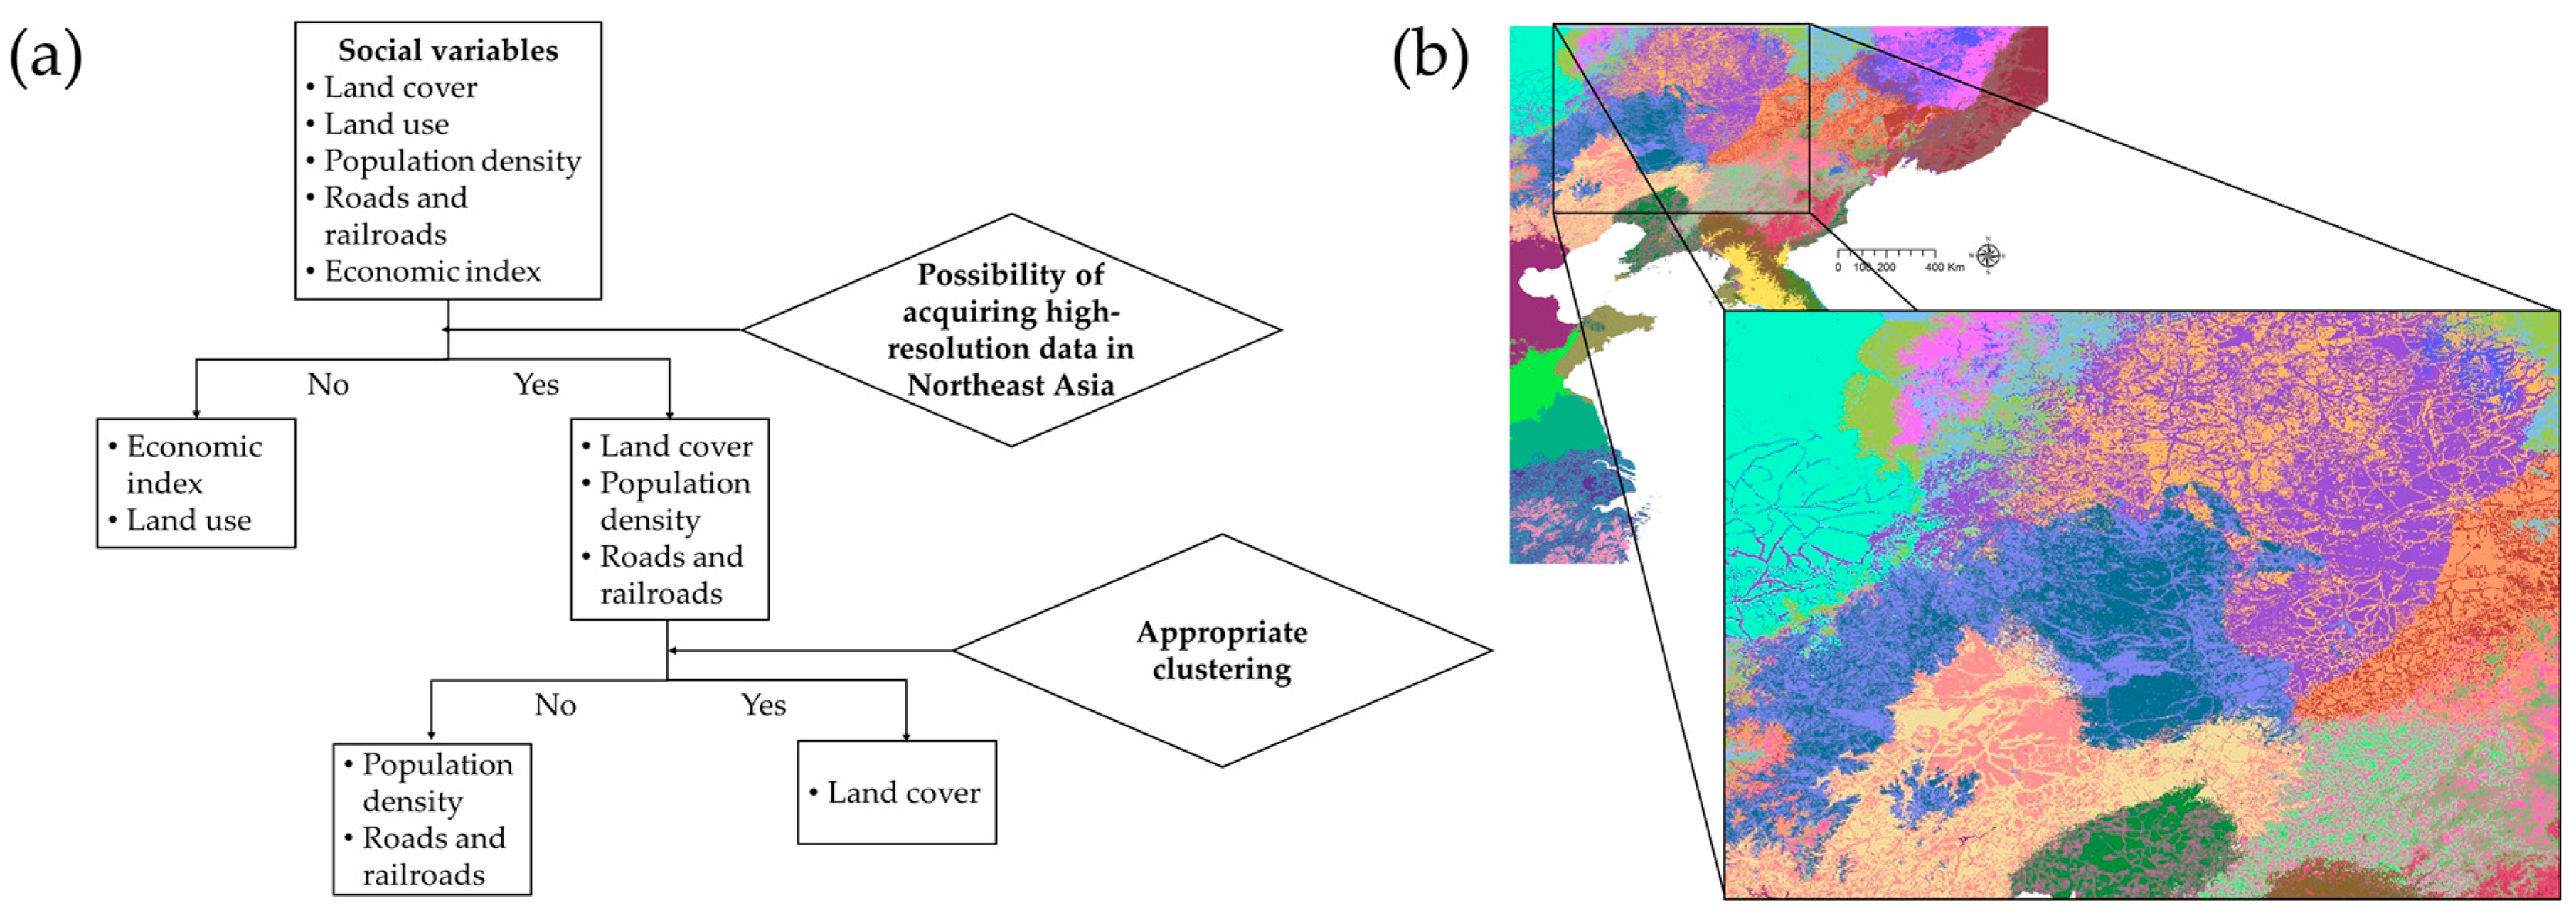
Figure 4.
(a) Map of the first principal component; (b) map of the second principal component; and (c) reclassified land cover map of Northeast Asia.
Figure 4.
(a) Map of the first principal component; (b) map of the second principal component; and (c) reclassified land cover map of Northeast Asia.
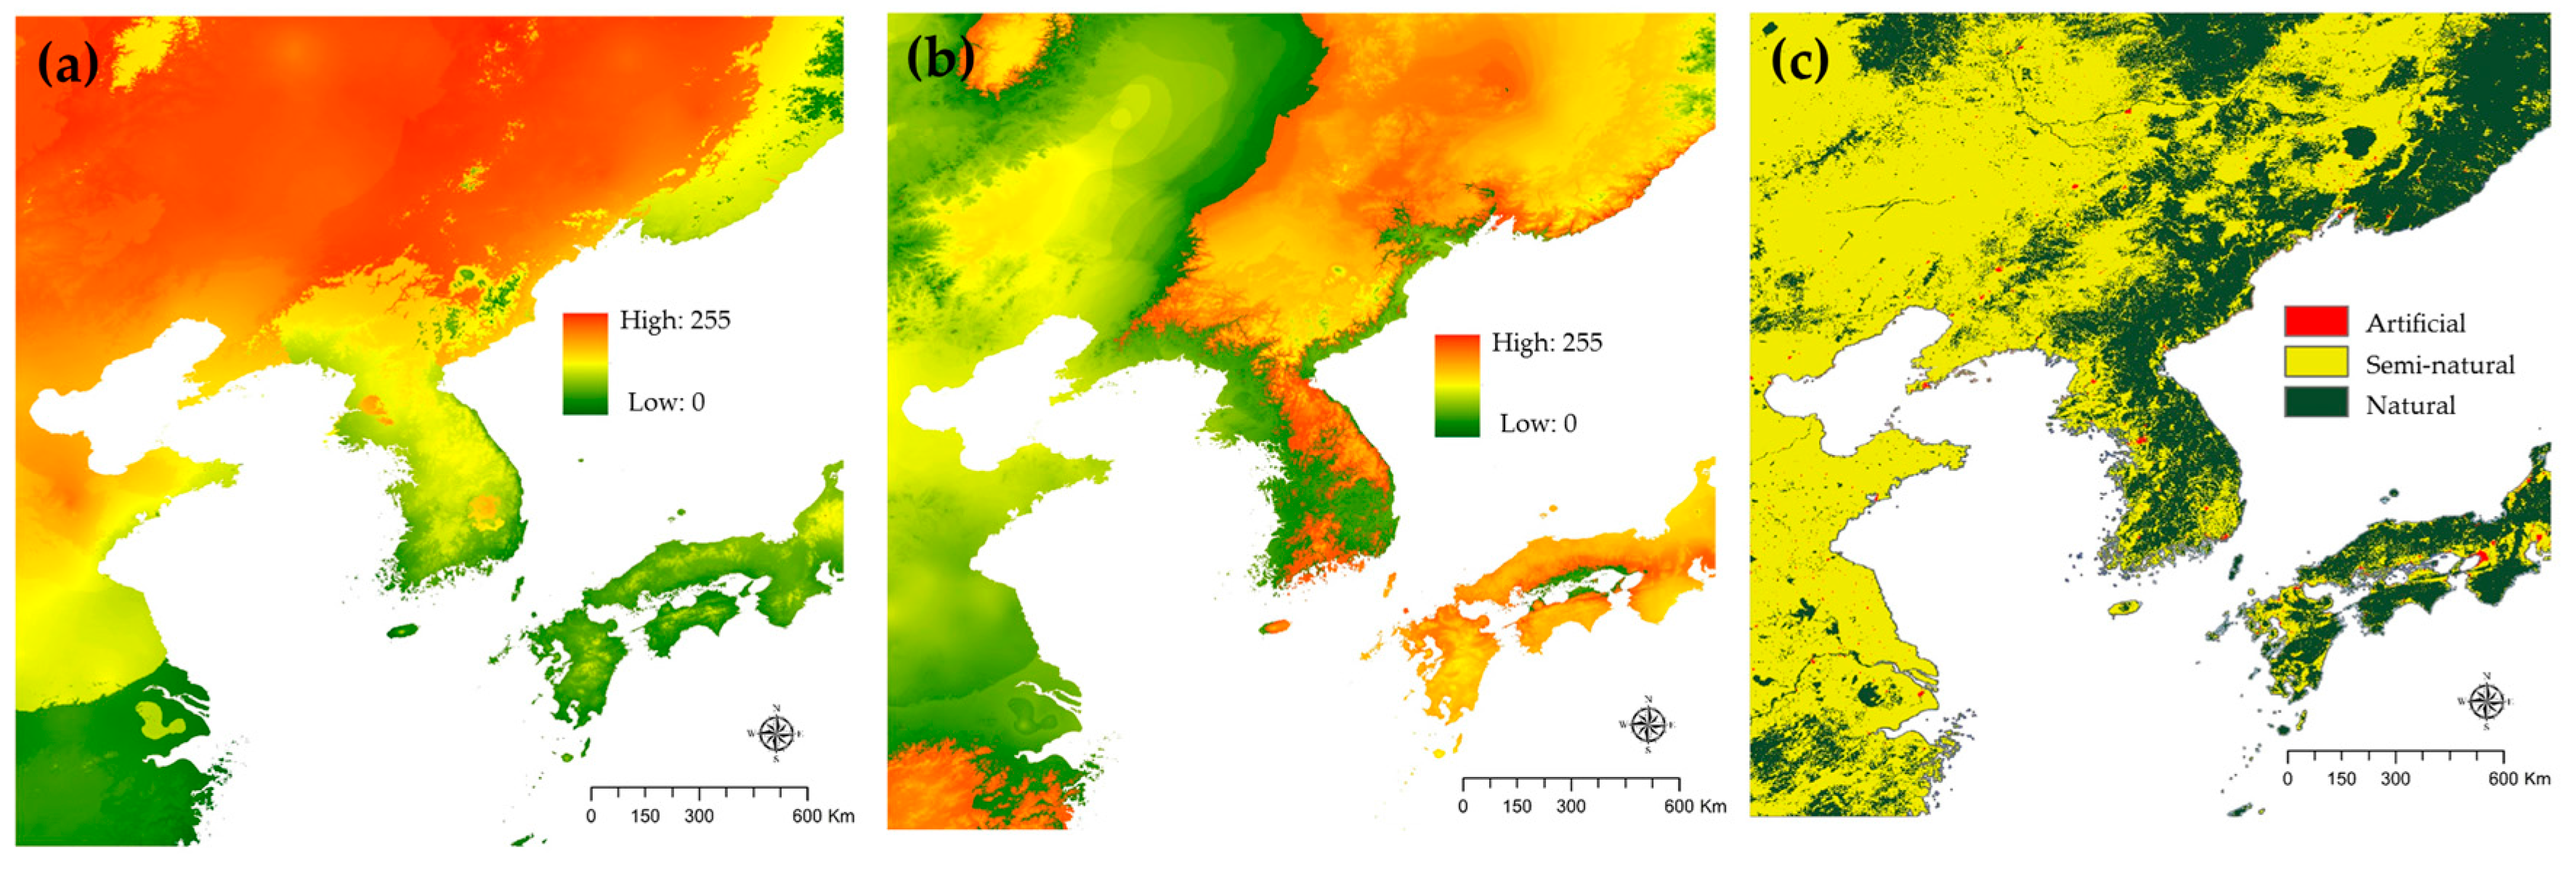
Figure 5.
Twenty-seven bioclimatic zones of Northeast Asia.
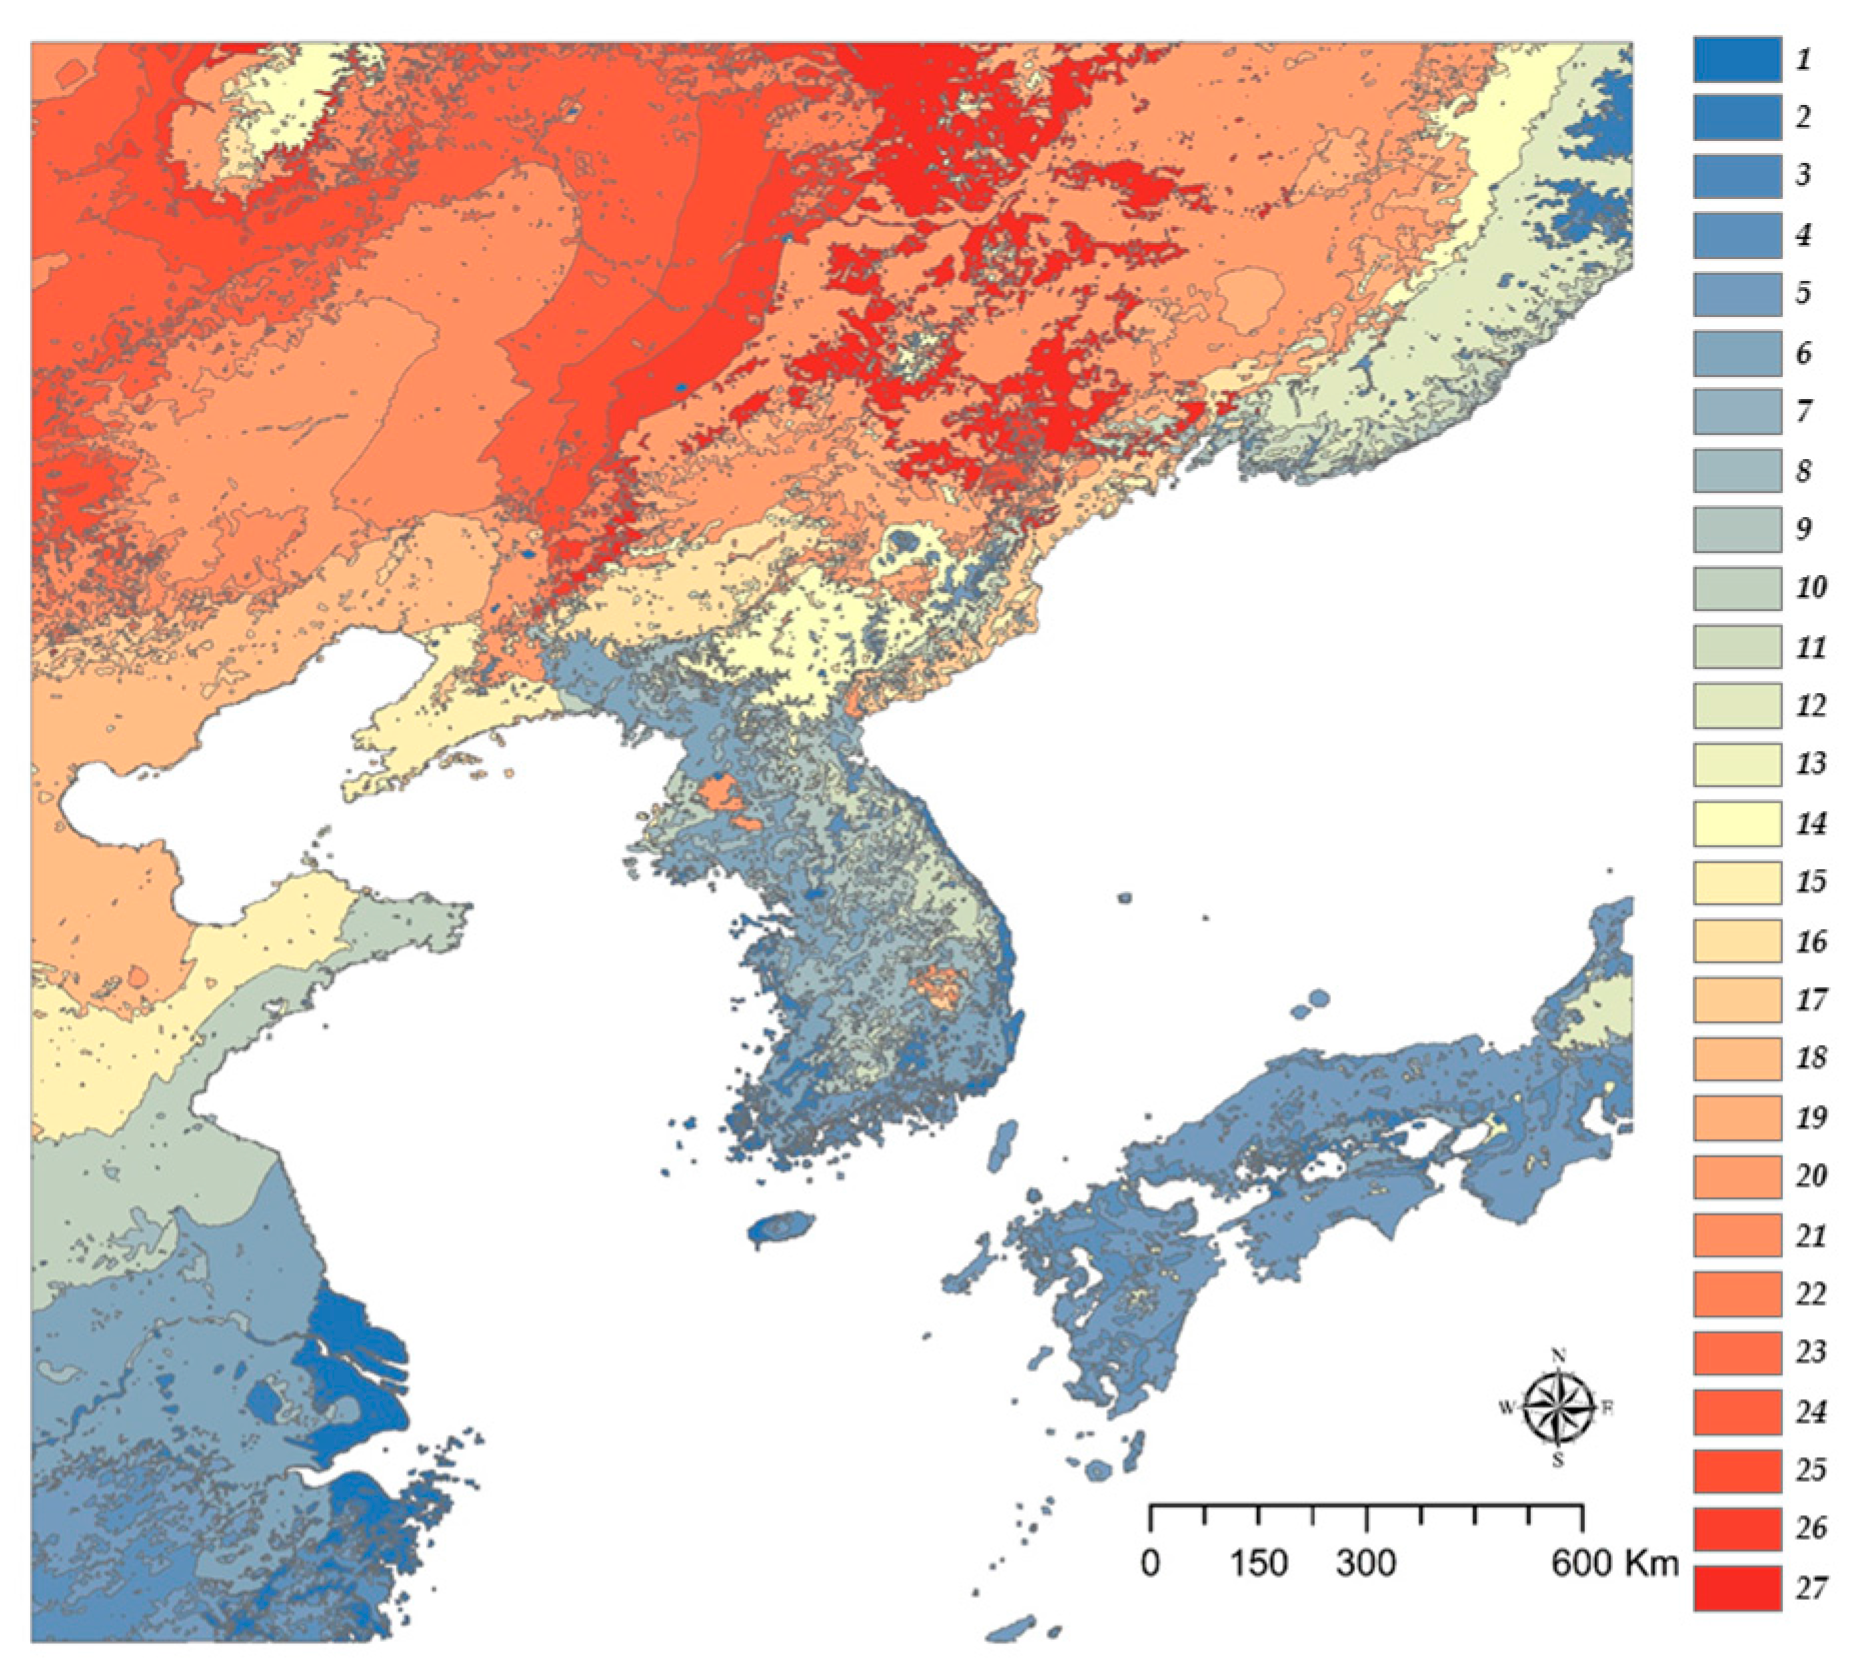
Figure 6.
Dendrogram based on Euclidean distance between cluster means explaining how each zone was clustered into 14 groups.
Figure 6.
Dendrogram based on Euclidean distance between cluster means explaining how each zone was clustered into 14 groups.
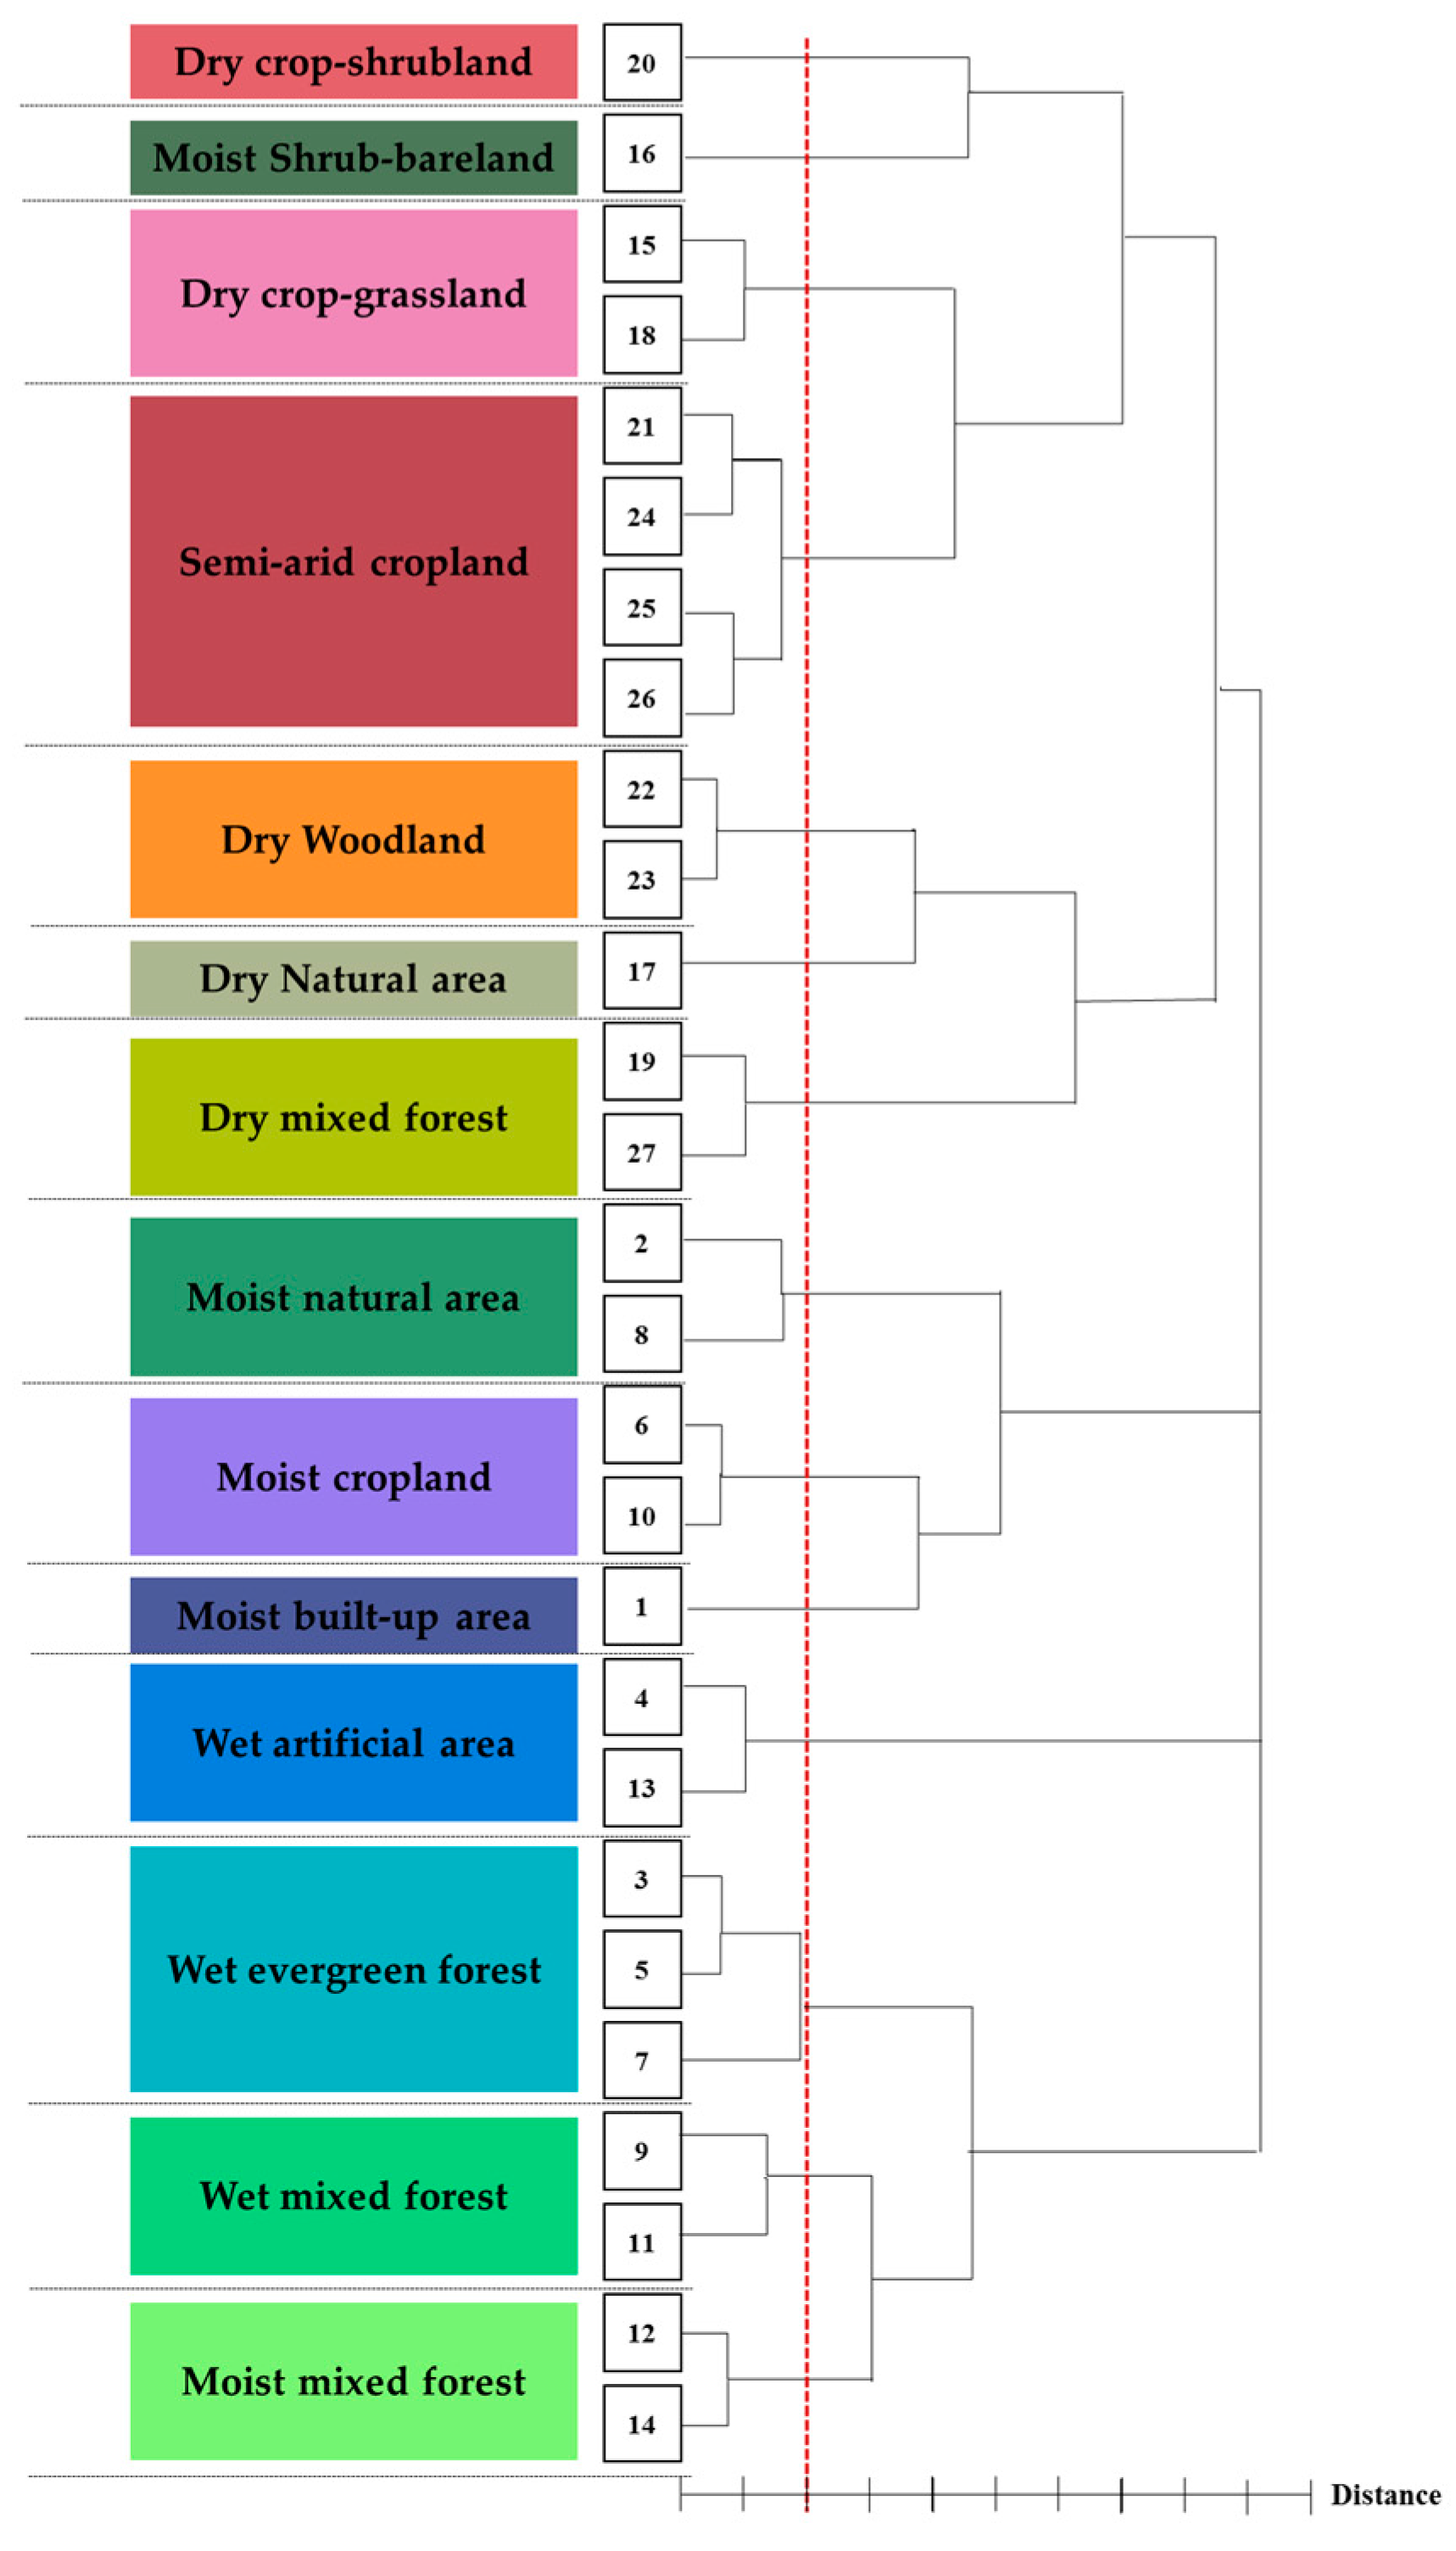
Figure 7.
Bioclimatic classification of Northeast Asia (NEA), depicting 14 groups.

Figure 8.
Graph representing naturality, aridity, precipitation effectiveness index (PEI), and potential evapotranspiration (PET) seasonality for each group.
Figure 8.
Graph representing naturality, aridity, precipitation effectiveness index (PEI), and potential evapotranspiration (PET) seasonality for each group.

Figure 9.
Map expanding three areas to compare with GEnS of Northeast Asia (NEA) made by Metzger et al. (2013) [24] and to illustrate naturality (A1: the result of this study in Northeast China, A2: GEnS in Northeast China, B1: the result of this study in East China, B2: GEnS in Eest China, C1: the result of this study in central Korean peninsula, C2: GEnS in central Korean peninsula).


Table 1.
Standard variation and eigenvectors for the three principal components (PCs) of the second principal component analysis.
Table 1.
Standard variation and eigenvectors for the three principal components (PCs) of the second principal component analysis.
| PC1 | PC2 | ||
|---|---|---|---|
| Standard deviation | 1.26 | 1.00 | |
| Proportion of variance | 0.53 | 0.33 | |
| Cumulative proportion | 0.53 | 0.86 | |
| Var36 | Aridity index | 0.71 | −0.05 |
| Var37 | Potential evapotranspiration seasonality | 0.71 | 0.02 |
| Var48 | Precipitation effectiveness index | 0.02 | 0.99 |
Table 2.
Indices and criteria used for descriptive names.
| Index | Criterion | Label |
|---|---|---|
| Land cover ratio | Nature area >80% | Natural (N) |
| Nature area <80% | Artificial (A) | |
| Aridity index | [0–0.6) | Semi-arid (a) |
| [0.6–1.0) | Dry (d) | |
| [1.0–1.3) | Moist (m) | |
| [1.3–) | Wet (w) | |
| Potential evapotranspiration seasonality | (–4500) | Oceanic |
| [4500–5000) | Semi-continental | |
| [5000–) | Continental | |
| Precipitation Effectiveness Index | (0–100) | Low precipitation efficiency |
| [100–200) | Mid precipitation efficiency | |
| [200–300) | High precipitation efficiency |
Table 3.
Criteria used for A–G classifications.
| Criterion | Label |
|---|---|
| Continental and Low precipitation efficiency | A |
| Continental and Mid precipitation efficiency | B |
| Semi-continental and Low precipitation efficiency | C |
| Semi-continental and Mid precipitation efficiency | D |
| Semi-continental and High precipitation efficiency | E |
| Oceanic and Low precipitation efficiency | F |
| Oceanic and Mid precipitation efficiency | G |
Table 4.
Code names, descriptive names, and contained zones by each group.
| Code | Name | Zone |
|---|---|---|
| AdB | Dry crop-shrubland | 20 |
| AmB | Moist shrub-bare land | 16 |
| AdA | Dry crop-grassland | 15, 18 |
| AaA | Semi-arid cropland | 21, 24, 25, 26 |
| NdA | Dry woodland | 22, 23 |
| NdC | Dry natural area | 17 |
| NdB | Dry mixed forest | 19, 27 |
| NmD | Moist natural area | 2, 8 |
| AmC | Moist cropland | 6, 10 |
| AmF | Moist built-up area | 1 |
| AwG | Wet artificial area | 4, 13 |
| NwG | Wet evergreen forest | 3, 5, 7 |
| NwD | Wet mixed forest | 9, 11 |
| NmE | Moist mixed forest | 12, 14 |
Table 5.
Environmental characteristics, including climate and land cover, of each group.
| Group | Code | Annual Mean Temp. (°C ) | Annual Mean Precipitation (mm/y) | Mean Altitude (m) | Land Cover (% of Area Occupied in the Zone) |
|---|---|---|---|---|---|
| Dry crop-shrubland | AdB | 4.04 | 576.36 | 293.39 | Cropland 48% Wooded grassland 24% Grassland 17% |
| Moist shrub-bare land | AmB | 3.66 | 861.70 | 584.03 | Closed shrubland 40% Bare land 39% Wooded grassland 9% |
| Dry crop-grassland | AdA | 10.95 | 667.31 | 118.55 | Cropland 50% Grassland 26% Wooded grassland 15% |
| Semi-arid cropland | AaA | 3.34 | 457.08 | 458.05 | Cropland 45% Grassland 26% Wooded grassland 23% |
| Dry woodland | NdA | 2.31 | 508.14 | 505.54 | Woodland 46% Evergreen needleleaf forest 14% Wooded grassland 10% |
| Dry natural area | NdC | 7.24 | 715.29 | 324.17 | Woodland 41% Mixed forest 17% Evergreen needleleaf forest 16% Wooded grassland 10% Water 10% |
| Dry mixed forest | NdB | 2.10 | 658.21 | 447.73 | Woodland 39% Mixed forest 26% Deciduous broadleaf forest 12% |
| Moist natural area | NmD | 9.48 | 1146.62 | 323.71 | Woodland 31% Evergreen needleleaf forest 29% Water 21% |
| Moist cropland | AmC | 13.82 | 963.64 | 49.85 | Cropland 60% Wooded grassland 20% Grassland 12% |
| Moist built-up area | AmF | 15.78 | 1214.51 | 44.62 | Bare land 49% Closed shrubland 22% Cropland 15% Urban and built-up 6% |
| Wet artificial area | AwG | 13.31 | 1469.23 | 138.01 | Wooded grassland 41% Cropland 24% Grassland 17% |
| Wet evergreen forest | NwG | 12.01 | 1864.80 | 512.35 | Evergreen needleleaf forest 46% Woodland 27% Mixed forest 10% |
| Wet mixed forest | NwD | 6.62 | 1147.96 | 479.72 | Mixed forest 37% Evergreen needleleaf forest 31% Woodland 22% |
| Moist mixed forest | NmE | 1.33 | 895.12 | 756.23 | Mixed forest 38% Evergreen needleleaf forest 29% Woodland 17% |
© 2017 by the authors. Licensee MDPI, Basel, Switzerland. This article is an open access article distributed under the terms and conditions of the Creative Commons Attribution (CC BY) license (http://creativecommons.org/licenses/by/4.0/).
Share and Cite
MDPI and ACS Style
Choi, Y.; Lim, C.-H.; Ryu, J.; Jeon, S.W. Bioclimatic Classification of Northeast Asia Reflecting Social Factors: Development and Characterization. Sustainability 2017, 9, 1137. https://doi.org/10.3390/su9071137
AMA Style
Choi Y, Lim C-H, Ryu J, Jeon SW. Bioclimatic Classification of Northeast Asia Reflecting Social Factors: Development and Characterization. Sustainability. 2017; 9(7):1137. https://doi.org/10.3390/su9071137
Chicago/Turabian StyleChoi, Yuyoung, Chul-Hee Lim, Jieun Ryu, and Seong Woo Jeon. 2017. "Bioclimatic Classification of Northeast Asia Reflecting Social Factors: Development and Characterization" Sustainability 9, no. 7: 1137. https://doi.org/10.3390/su9071137
Note that from the first issue of 2016, this journal uses article numbers instead of page numbers. See further details here.