Effects of Climate Change on Outdoor Skating in the Bei Hai Park of Beijing and Related Adaptive Strategies


1
Tourism School, Sichuan University, 24 South Section 1 Ring Road No. 1, Chengdu, Sichuan 610065, China
2
Key Laboratory of Land Surface Pattern and Simulation, Institute of Geographic Sciences and Natural Resources Research, CAS, Beijing 100101, China
*
Author to whom correspondence should be addressed.
Sustainability 2017, 9(7), 1147; https://doi.org/10.3390/su9071147
Submission received: 28 May 2017
/
Revised: 20 June 2017
/
Accepted: 21 June 2017
/
Published: 30 June 2017
(This article belongs to the Special Issue Sustainable Tourism and Climate Change: Impact, Adaptation and Mitigation)
Abstract
:This paper reports findings derived from a study of the impacts of climate change on winter outdoor skating activities in the Chinese park of Bei Hai from 1989 to 2015. Based on field observation data and in-depth interviews, it was concluded that the outdoor skating activities, with a history of more than 1000 years, are being threatened by the warming climate. The opening dates and duration times of skating over the last 26 years showed periodic variations over three-year cycles. Increases of temperatures by 1 °C in December were associated with a 3.80-day delay in the skating-field opening dates and a 4.49-day decrease in the operation duration times. In particular, climate change has resulted in a loss of the skating field area and a reduction in the operation duration times, and tourists are moving north for skating-related recreation or conducting alternative activities. The current adaptive strategies are not very effective.
1. Introduction
Certain aspects of the tourism industry are highly sensitive to climate change, such was winter sports [1]. Understanding the effects of climate change on tourism and the selection of proper adaptive strategies are important parts of current research programs aimed at sustainable tourism [2,3]. Studies have shown that global climate change has resulted in a significant negative effect on winter skiing-related tourism in the Alps [4]. Given that (i) the mean temperature increase rate in China is 0.27 °C/10 a [5]—higher than the global mean temperature increase rate of 0.12 °C/10 a [6]—(ii) the temperature increase in Beijing is as high as 0.30 °C/10 a [7], higher than the mean temperature increase rate in China; and (iii) the global mean surface temperature in 2016–2035 is expected to be 0.3 °C–0.7 °C [6], higher than that in 1986–2005, studies on the effects of climate change on winter tourism in Beijing, China, are urgently needed.
Beijing has obtained permission to host the 2022 Winter Olympics, and the Chinese government is hoping to capitalize on this opportunity to promote the popularity of winter sports. Specifically, goals have been set to encourage 0.3 billion people nationwide and 8 million people from Beijing to participate in winter sports. Public winter sport venues mainly consist of outdoor skiing fields, skating fields, and indoor skating fields. Compared with recreation on indoor fields, recreation on ice on outdoor fields—such as on rivers and lakes—provides people with valuable opportunities for closer contact with the natural environment and helps to establish a heritage within urban leisure culture [8]. However, temperatures should be low enough to ensure at least 15 cm of ice thickness on an outdoor skating field for safety purposes, and outdoor skating activities are subject to weather conditions. Therefore, evaluating the effects of climate change on outdoor skating activities and exploring related adaptive strategies in Beijing will not only determine whether the goal of promoting winter sports can be achieved, but also will provide information on whether historically meaningful folk customs can be inherited.
2. Literature Review
Since the 1980s, the effects of climate on winter tourism have gradually become a hot topic in tourism research. However, most of the available literature reports are focused on skiing, while only a limited number of reports are related to skating and other activities on ice. A skiing field should have a snow layer with a thickness of at least 30 cm for 100 days in order to make a skiing business profitable [9]. With snow lines moving up as a result of climate change, the reliability of low altitude skiing fields has decreased [10], operation duration times have shortened [11], and business profits have dropped [12,13]. In contrast to the effect of climate change on skiing activities, the effect on ice sports is less certain because of the lack of relevant investigation. From 1990 until now, literature searches uncovered only six references on this topic in the Web of Science database. Past studies have shown that climate change not only narrows the time window suitable for skating [14,15,16], but it also increases the occurrence possibility of skating-induced injuries [17] and changes tourists’ demands [18].
Effects of climate change on winter tourism are significantly different among different regions [19]. Therefore, case studies in different regions on a global scale are needed in order to comprehensively understand the effects of climate change on winter tourism. To this end, in-depth studies have recently been conducted in America, Europe, and Oceania. For instance, many studies investigated the effects of climate change on the ski industry in Canada and the USA [15,20], the European Alps [21,22,23,24], Australia, and New Zealand [25,26,27], but few studies have been conducted in other regions such as Asia and Africa—in particular, studies in China are quite rare. Scott and McBoyle [28] pointed out that “No climate change assessments of the ski industry in China have been conducted.” Since 2010, the Yulong Snow Mountain and the Shangri-La snow mountains in western China have drawn attention in relation to the effects of climate change on snow mountain-related tourism in these regions [29,30].
Assessments of the effects of climate change and explorations of adaptive strategies are important parts of current climate change research [31]. In particular, perception studies of climate change effects on stakeholders or the general public and their adaptive strategies can help with the development of effective practices to adapt to climate change [32]. Current assessments of climate change effects on winter tourism have typically focused on the duration of the business season [14,15,16], while more knowledge about stakeholders’ perceived impacts and implemented strategies to adapt to the impacts remains to be fully elucidated. Despite the widespread acknowledgment of climate change and attempted applications of methods to adapt to it, such as the use of artificial snow, increases in product types, and the operation of a variety of tourism businesses each year [33,34], there still remain economic and social obstacles to adaptation processes [35,36]. Moreover, given the differences in local economies, culture and ideologies, the general public in Asia has different perceptions of climate change and thus different adaptive strategies compared with those used in Europe and America [37,38]. Therefore, it is necessary to conduct more surveys and studies to better understand winter tourism stakeholder’s perceptions and adaptation methods in Asia.
3. Study Area
The case study area was located in Beijing, the capital of China (116°25′ E, 39°54′ N). Beijing has a northern temperate, semi-humid continental monsoon climate, with winters ranging from December to February of the next year [39], and winter temperatures are generally below 0 °C. Most of the outdoor skating fields of Beijing are located at the six “Hais” in western Beijing—Bei Hai, Zhong Hai, Nan Hai, Shi Cha Qian Hai, Hou Hai, and Xi Hai—among which Bei Hai has the most splendid scene, the widest water area, and the richest records of Bing Xi, which is an ancient phrase that means activities on ice. Therefore, Bei Hai Park was chosen as the research subject in this study. This park has an area of approximately 710,000 m2, of which 58.4% is occupied by water. Each winter since 1925, the park has been open to the general public for skating.
Skating, as a form of winter recreation, has a long history dating back as early as the Song Dynasty (960–1279) in China. The Song History [40] recorded an empire involved in “watching flowers and making recreation on ice,” and these activities took place in the rear garden of Kai Feng, the capital of the Song Dynasty. The Qing Dynasty (1636–1912)—a period in the Little Ice Age—was a golden era for the development of recreation on ice, and such recreation was advocated by imperial families and became very popular among the general public, ultimately becoming a “national custom” [8]. The Bei Hai Park was an imperial garden in the Qing Dynasty; under proper weather conditions, the emperor led all the civil and military officials to inspect the Eight Banners skating on the sixth day of “39”—a day around 13–15 January in the third nine-day period after the winter solstice. As shown by the Ice-Skating Game [41]—a renowned painting made during the Qian Long period (1736–1795) of the Qing Dynasty and now stored at the Palace Museum—people engaged in speed, figure, and acrobatic skating (Figure 1). On 31 January 1926—a date shortly after the opening of the Bei Hai Park’s skating field to the public—the first masquerade skating event was held there, with “approximately two thousand visitors” (Shuntian Times), as shown in Figure 2. As indicated by records since 1989, each year the skating field has had more than 10,000 visitors, and it has become a Beijing outdoor skating icon due to its history.
4. Data Sources and Methodology
4.1. Data Sources
Two types of data were collected in this study. The first data set consisted of monitoring data for the opening and closing dates during the period of 1989–2015 and temperature data for the winter half of the year (i.e., October to April of the next year). The skating field data were primarily collected from Bei Hai Jing Shan Records and the official database of Bei Hai Park, and this data set was supplemented with small amounts of data collected from reports by governmental authorities and the media. The temperature data were collected from the China Meteorological Data Sharing Network [42]. In 1998, the lotus pond skating field was dredged and it was not open to the public at this time; therefore only 26 years of data were included in this study. All the dates were normalized to 1 December of each year, with 31 representing 1 January.
The second data set consisted of survey data focused on the following three topics [33,34]: (1) interviewees’ perceptions of climate and ice phenology change and their predictions of changes in the future; (2) the effects of climate change on businesses and skating; (3) strategies for adaption to the changing climate. The criteria of inclusion for the interviewees were as follows: skating field operators who were directly involved in the skating field management; business operators whose business was directly related to the skating field; skaters who had more than five years of experience in outdoor skating in Beijing.
After training the interviewees with relevant background knowledge, we formed a four-member interview panel during 12–18 January 2017 and conducted semi-structured in-depth interviews with relevant business operators and frequent outdoor skaters relevant to the Bei Hai Park skating field and the Shi Cha Hai Park skating field—the latter belonging to the same river system as the former, and also being an important public skating field in Beijing. Each interview took 15–30 min, with the interviewees’ voices being recorded and later being transcribed to text for further analysis. After excluding the results of five interviews where the interview time was too short, 49 counts of effective interview results were finally obtained.
Of the 49 interviewees, seven were working staff of the Bei Hai Park and Shi Cha Hai Park skating fields, and these individuals were comprised of one from the administration department, two from the publicity department, and four from the in-field working group. Together, they had a professional history of 6.7 years on average; in particular, the staff in the publicity department of Bei Hai Park had a 23-year professional history. Eight of the other interviewees were business operators with responsibilities relevant to skating activities; one runs a skate-blade-grinding business, one provides a skating training course, and six run retail businesses selling gear to stay warm. Together, they had a professional history of 10.9 years on average; in particular, Peizhi Wang had a long professional history, as he joined with his father at young age to work in the family blade-grinding business, which had a 75-year history. Moreover, 34 frequent skaters were included in the interviews, and they had an outdoor skating history of 23.8 years on average; of the 34 frequent skaters, seven had skated for more than 30 years. The longest skating history was 58 years, and the shortest skating history was five years.
4.2. Methodology
This research was conducted in three steps. First, the ice phenology variation pattern was extracted with wavelet analysis to disclose the skating time fluctuations during the investigated time period. Wavelet analysis is able to not only disclose the scales on which a series changes, but also identify specific time intervals of change [43]. This study employed the Morlet wavelet analysis to investigate ice-time change periodicity.
This study employed the following wavelet transformation formula (Equation (1)) for time series f(t) [44]:
where represents the wavelet transformation coefficient, x is a scale determining the wavelet width, and y is a translation parameter representing the magnitude of the wavelet translation. Both x and y are real numbers, and x is unequal to 0. is the conjugated function of . This study chose MHAT functions as wavelet base functions [45]:
After the wavelet transformation of the normalized skating-field opening dates and duration times, one is able to observe—based on the wavelet real coefficients—the periodical change and distribution on different timescales, with dashed lines representing negative values and solid lines representing positive values; the wavelet coefficient line plot represents the fluctuation on certain timescales.
Second, with an ordinary least squares (OLS) regression, we examined by what percent winter half-year temperatures explained the ice phenology variance and to what extent winter half-year temperatures affected the ice phenology. Furthermore, we identified the months that showed the most important effect on the skating-field opening dates in winter half-year. In order to ensure the reliability of the regression analysis, the field opening dates, operation duration times, and temperature series data were subjected to an Augmented Dickey-Fuller (ADF) stationarity test. The results of the test, as shown in Table 1, indicated that all the variable series were stable at a 5% significant level and, therefore, the variables could be directly used in the regression analysis. The regression residuals were also subjected to the ADF test in order to confirm whether the regression results had a cointegration relationship. After these procedures, we extracted the temperature change cycles with the largest impact on the ice phenology and compared the data with the ice phenology change in order to test whether the field opening dates and operation duration times responded to the temperature change.
Last, based on the interview data, we analyzed the perceptions of business operators, managers, and tourists regarding the effects of climate change on outdoor skating and studied their adaptive strategies.
5. Results
5.1. Ice Phenology Change Patterns of the Skating Field
During 1989–2015, the Bei Hai Park’s outdoor skating field had an opening date of 1 January on average (standard deviation of 6.01 days) with an operation duration time of 36 days (standard deviation of 7.10 days) and a closing date of February 6 on average (standard deviation of 3.10 days); during that period, the skating field in 2012 had the earliest opening date (22 December) and the longest operation duration time (54 days). Among all the investigated years, the field in 2003 and 2007 had the latest opening dates—both falling on 16 January—and operation duration times of 23 and 19 days, respectively, with the 19 days being the shortest operation duration time during 1989–2015.
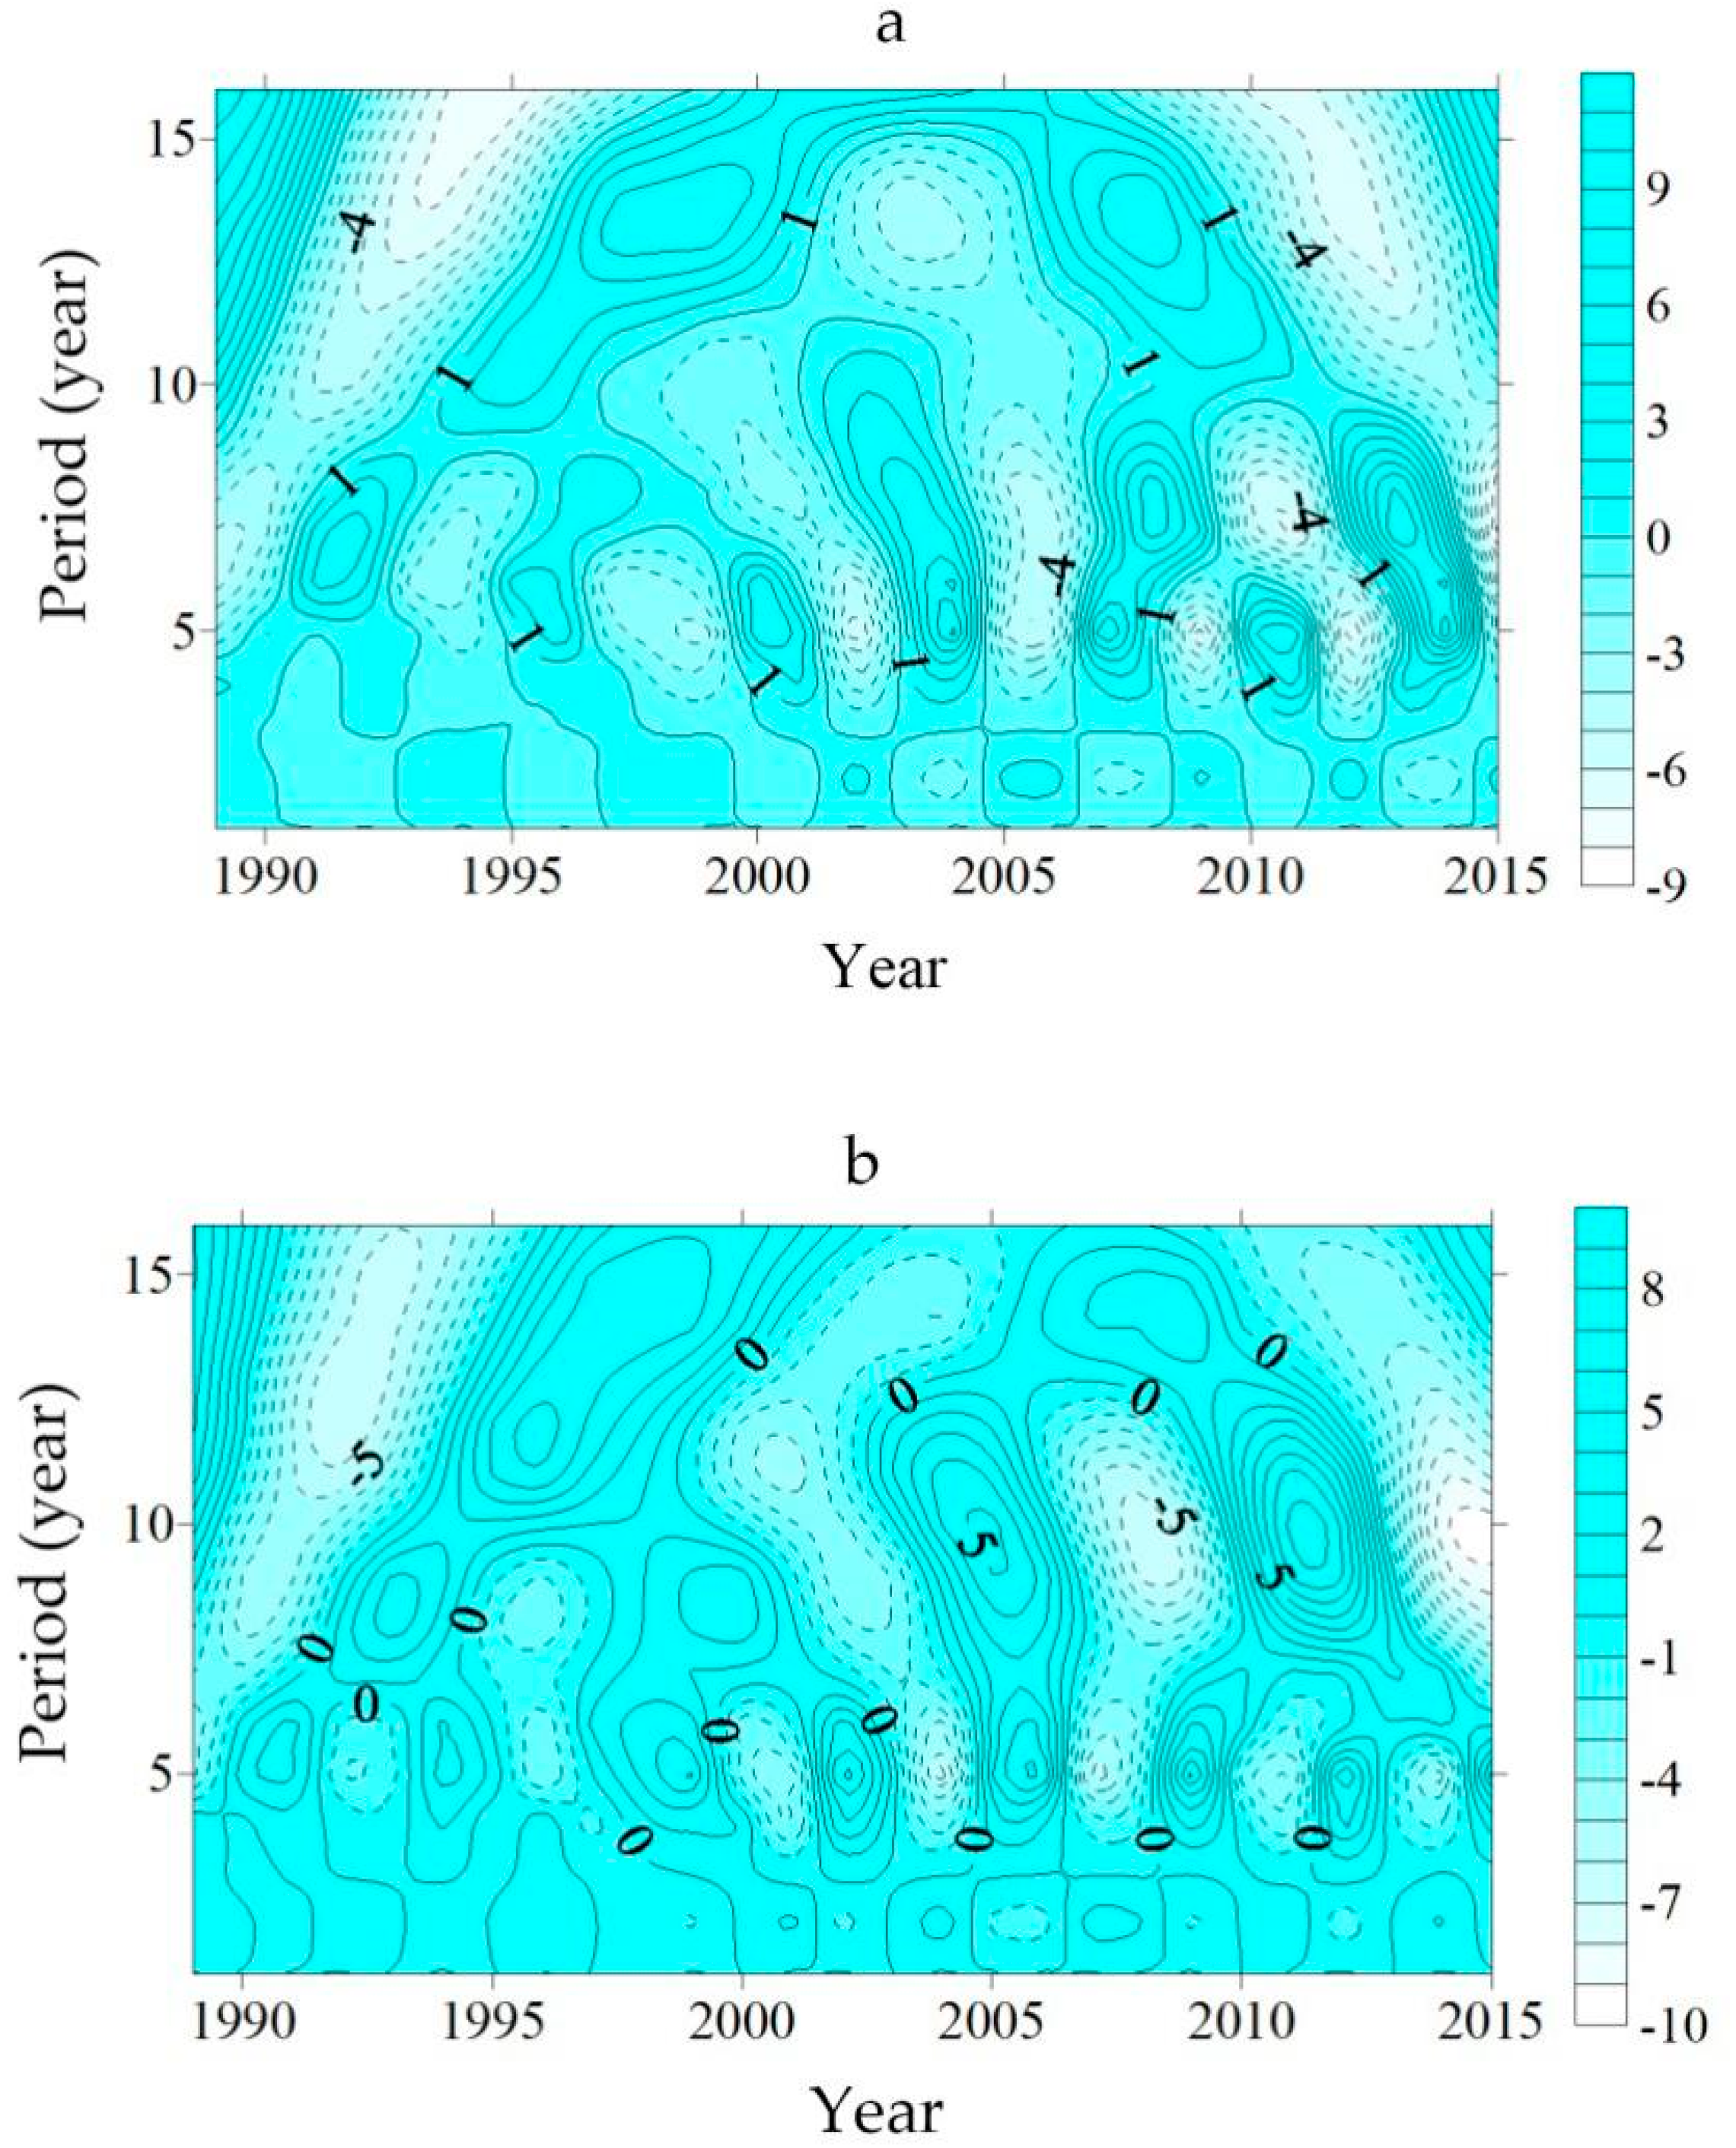
The wavelet analysis indicated that during 1989–2015, the field opening dates and duration times showed obvious annual changes (Figure 3a,b). On the timescale of 5a (“a” denotes unit year ), the opening dates experienced—with three years to form a cycle—seven cycles of earlier openings and later openings. In particular, the field openings dates in 2003, 2007, and 2013 showed obvious delays, while the openings dates in 2002, 2005, and 2012 were earlier.
The field operation duration times, on a scale of 5a, also showed a three-year periodicity in the change and experienced seven cycles of longer duration and shorter duration, with longer duration times in 2002, 2005, and 2012 and shorter duration times in 2003, 2007, and 2013, which was consistent with the earlier or later opening dates. The ice phenology in Bei Hai Park showed more marked fluctuations after 2000, with a higher frequency of abnormally earlier or later openings.
5.2. Main Factors Affecting Ice Phenology
The unit root test of the residuals of the regression between the ice phenology and temperature (Table 2) indicated that the residuals formed a stable series and, therefore, there existed a cointegration relationship between the field opening dates and the winter half-year temperatures, and one between the field operation duration times and the winter half-year temperatures as well. In the regression analysis, the R2 values for the field opening dates and operation duration times in relation to the winter half-year temperatures were 0.403 and 0.501, respectively, which indicates that the winter half-year temperatures explained a relatively high percentage of the opening date variance and operation duration time variance. The temperature in December showed a significant effect on the dependent variables (Figure 4). According to the statistical model, an increase of the temperature by 1 °C in December led to a delay of 3.80 days for the opening dates and a reduction of 4.49 days for the operation duration times.
The mean temperature in December during 1989–2015 was −0.99 °C with a standard deviation of 1.13 °C; the lowest temperature in December was −4.2 °C in 2012, while the highest one was 0.9 °C in 1996. The temperatures in December showed a periodical change pattern similar to that of the ice phenology, with the contour plot of wavelet coefficients (Figure 5) showing a dense distribution on a timescale of 1–2a, 3–7a, and 8–15a. In particular, the periodical change on the timescale of 3–7 a was the most obvious, with strong amplitudes throughout the cycles; the middle timescale was approximately 5a, and with three years to form a cycle, the temperature experienced seven cycles of low temperatures and high temperatures.
The wavelet coefficient plot of the ice phenology versus temperatures at a timescale of 5 a clearly indicated the relationship between the field opening dates and temperatures. The field opening dates varied consistently with the temperatures in December, and the relatively high temperatures in December of 2003, 2007, and 2013 obviously delayed opening dates; in contrast, the relatively low temperatures in December of 2002, 2005, and 2012 obviously led to earlier opening dates (Figure 6a).
The cyclical fluctuations of the field operation duration times were in line with those of the temperatures in December of the corresponding years. Since 1993, years with high temperatures in December were associated with short operation duration times (Figure 6b).
5.3. Effects of Climate Change upon the Skating Field and Adaptive Strategies
Climate change has resulted in a reduction of the skating field area. The area of the skating field dropped by two-thirds from the 1990s to the 21st century (Table 3). With climate warming in winters, not only has the ice area of the lake in Bei Hai Park shrunk, but the ice layer quality has also been degraded. Since 2014, Bei Hai Park has opened only a lotus lake—instead of three skating regions in previous years—to the general public. The management department of the skating field is now implementing regulations stipulating that no more than 10 tourists are allowed per square meter on the ice. The continual shrinkage of the fields is expected to further decrease the number of tourists visiting the field.
The skating-related business operators held various perceptions about the climate change that has occurred in Beijing. Eighty percent of the operators perceived that the winter temperature of Beijing in the last five years has been increasing, while 27% of the operators felt that the winter temperature of Beijing in the last two decades has been increasing. The effects of a warming winter on the skating-related businesses manifested in three key ways, as elaborated below.
First, some business operators (n = 14) articulated that a warming winter would lead to shorter frozen duration times of the field and shorter operation duration times as well. They recalled that the field operation duration times in the 1980s were obviously longer than those in recent years, and that the operation duration times have started to gradually decline since the 1990s.
Second, given the delay of the opening dates, the field has missed the maximal number of tourists on the first day of the year, thereby further affecting field business income. Thirteen percent of the operators thought that the trend of climate warming would continue, and such perceptions deepened their concerns about the operation of the field in the future.
It is not cold this year, and it was not very cold last year…now it is becoming warmer on the globe, and this would be a long-term trend. (Skating-related business operator 1)The change is very dramatic. We had the longest open duration of approximately 40 days in the 1980s and 1990s…the operation duration time started to decline in the 1990s…(this year), after the completion of the inspection, there may be more than 10 but less than 20 days (open to the general public). But, the investment—in addition to the current equipment and staff that you can see right now—would also include new investments for staff after the operation of the fields, and (these) would be quite high, and as such, this business may not be profitable in most cases—or simply does not have a deficit. (Skating field operator 7)
Third, the warming winters caused the ice layers to become thinner, thus increasing the operation uncertainty of the skating field (n = 3). The Chinese government regulations state that only when the ice layer is at least 15 cm thick is a skating field allowed to be open to the general public, with an allowed maximal density of one person per 10 square meters. Too high of a temperature would lead to instability of the ice layer, and the skate field would be closed or the operators would limit the number of visitors temporarily in order to ensure their safety.
Our first concern is safety. If there are too many visitors, we would take some measures to limit the number of visitors (using) the skating field during a given time interval. We will make judgments based on two criteria: the first is the 15 cm thickness standard for ice layers, and the second is the density of 10 square meters per person…Provided the temperature is higher, the range certainly would be a little greater. (Skating field operator 1)
When facing a warm winter, the operators have a limited number of adaptive strategies. The operators usually tried to fulfill the ice layer thickness requirement by sprinkling water onto the ice surface at night, but this measure did not generate a satisfying outcome in winters with relatively high temperatures. Moreover, the operators may host recreation on ice events and performances to attract tourists in order to reduce the revenue loss due to the shortened frozen duration.
Bei Hai Park is still considered the most authentic source place for recreation on ice. Therefore, after the opening of the field in this year, we (will) collaborate with the Sport Bureau and will hold three recreational ice events, with a recovery of the Eight Manners—which was explored once last year and proven very successful. These items are very precious, but may be difficult to recover, and now they are under a slow process. (Skating field operator 7)I have no measures. The field is closed in warm weather. It absolutely should not be opened in order to ensure the safety of visitors. Moreover, the ice definitely would not pass the inspection. This business totally depends on the weather. (Skating field operator 6)
The business operators around the skating field have only a few adaptive strategies for dealing with the climate change. Thus, the warming climate is likely to force them to give up outdoor skating-related business operations. Vendors may give up selling winter equipment for staying warm and begin to run new businesses; the skating training class operators—with concerns about safety—could use indoor skating fields or simulated ice instead of real ice when providing skating training. Of the operators, only Mr. Peizhi Wang, a skate blade-grinding business operator, stated that he would continue his family business regardless of the potential impacts due to climate change—he along with his family plan to continue this traditional craft.
Nowadays, there is a type of simulated ice floor where you can skate with normal ice skates, and it will give you the same feeling as (when) you skate on real ice. There is no need for equipment that is used in indoor ice fields to make ice. The simulated ice fields have very low cost, and would not be affected even (on) a sunny day. (Relevant operator 3)The generation of my father was committed to this business (and) very hard working, (thus) making the handicraft gradually recognized and accepted by the general public until now in my generation. Even if only one person skated, I would persist doing this business. My father had devoted his whole lifetime to this business, (as) would I. This is inheritance. (Skating-related business operator 4)
5.4. Effects of Climate Change upon Frequent Skaters and Their Adaptive Strategies
Eighty-five percent of frequent outdoor skating tourists perceived the winter warming in Beijing. The increase in winter temperatures since 2000 has made the available skating time much shorter. As recalled by five frequent visitors with more than 30 years of experience skating, the skating time (including the time in informal skating fields) in the 1970s–1990s could be as long as two or three months, while the time has dropped to approximately one month since the year of 2000.
(Skating time) on the whole is decreased, and now it is only a little longer than one month, showing much decrease as compared with previous time. It was about in the 1980s that the skating time could be as long as three months. I remember that the ice formed on November (20th), and the field was officially opened around early December…In the 1990s, the field (official opening day) was also around mid-December, and it was mainly after the 2000s that the weather became warmer, and it was approximately around 1995 or 2000 when the skating time began to shorten. (Frequent visitor 7)
Aside from the decreases in the available skating time, the warming winters have also worsened the personal skating experience of tourists. The decrease of personal experience quality has already made some tourists consider giving up outdoor skating. In particular, for speed skaters, their available skating range has already been greatly reduced as a result of the shrinkage of the ice area. Because the temperatures at night have not been low enough, the operators could not sprinkle water every day to maintain a smooth ice surface and, therefore, the skating experience of tourists has also been affected.
The impact was huge. (This year) the opening dates were at least half (a) month later than previous years, and moreover, the surface was not good enough. I have a strict requirement for ice surface quality, and would not come if the quality is too bad. (Frequent visitor 32)
Given the changes in climate, outdoor skaters applied three main types of adaptive strategies. One was to move to high-latitude regions. Four interviewees—before or after the opening date of Beijing’s outdoor skating fields—had visited northeastern China’s outdoor skating fields, and the major regions that they visited included China Harbin (126°38′E, 45°45′N) and Qiqihaer (123°58′E, 47°20′N). Three frequent visitors expressed that if the available skating time in Beijing continued dropping, they would consider skating in northeastern China in the future. The main advantage of skating in northeastern China is that—compared with Beijing—the winter is colder and outdoor skating fields can have longer operation duration times; the fare is also cheaper.
Many people leave Beijing in late October to early November to go to the northeast for skating. (Frequent visitor 33)Some people go to Qiqihaer. They leave as soon as the ice here softens. (Frequent visitor 32)Some people even go to the northeast for skating, but my schedule does not permit…(later) it will depend on the schedule. If the schedule permits, I would consider (skating in the northeast). (Frequent visitor 34)
Another adaptive strategy was to reduce outside skating times and replace the sport with other alternative winter sports (n = 16). Four skating lovers expressed that they would frequently go to indoor skating fields, and 12 skaters stated that they would go roller skating near the Bird Nest. Indoor skating fields have better quality and management than outdoor skating fields, but there are not any large indoor skating fields open to the general public for the whole day. Moreover, the fare for indoor skating fields is more expensive, and speed skaters are subject to the limited skating area.
Indoor skating fields are better. There is a wind outside, and therefore there will be sands on the ice surface, which would make the blades be worn out more quickly. (Indoor fields) are not as big as this field, but they are very standard—which is quite important to those playing ice hockey games. (Frequent visitor 9)Then I will not skate, and do the roller skating instead. (Frequent visitor 2)In summer we go roller skating, and (there) are speed roller skater shoes. We conduct roller skating in the Bird Nest in summer. (Frequent visitor 4)
Another adaptive strategy that some tourists took was “wild skating”—skating on natural lake-ice fields without curators, but the skaters would face a relatively high safety risk. Many small-sized, shallow lakes are available for skating approximately half a month earlier than the formal skating fields. In the interview, 12 skating lovers mentioned that they once started to skate on ice with a thickness of only 6–7 cm—a thickness much less than the official 15-cm standard—in their “wild skating” experience in order to fulfill their desire for skating. The skaters’ personal safety cannot be secured, and it is extremely easy for accidents to take place. In the last five years, a total of eight incidents of skaters falling into the water during “wild skating” took place in the winter in Beijing.
We usually go wild skating…You just need to take a look at the ice. Isn’t it transparent? A thickness of 6–7 cm is good enough…The business operation requires a thickness of 15 cm, but there is no thickness requirement in wild skating, as long as you can keep yourself safe and do not fall in the water. (Frequent visitor 30)
6. Discussion and Conclusions
6.1. Discussion
The opening dates and operation duration times of the Bei Hai Park skating field varied periodically with three-year cycles. Knowledge of this periodical change pattern should be useful for outdoor skating business operators and tourists because it may help them to judge long-term ice phenology changes in the future and thereby prepare themselves for the change. The outdoor skating opening dates and operation duration times were both sensitive to temperature changes in December—according to the statistical model, an increase of temperature by 1 °C in December led to a 3.80-day delay in the skating-field opening dates and a 4.49-day reduction in the operation duration times. With such models, it may be possible to forecast ice phenology based on temperature, such as forecasting sakura [46,47], and provide scientific support to outdoor skating and recreational activities. However, it should be noted that besides air temperature, the water area size and water depth also affect ice dates. Meanwhile, the ice phenology in different regions has different responses to climate change [48], and studies have shown that different water area conditions in the same region are associated with different ice dates [49]. Therefore, more case studies are needed in order to further assess the sensitivity of skating dates to temperature.
Of all the winter outdoor sports, outdoor skating appears to be more vulnerable than skiing to climate change. Global climate change has led to a reduction of the ski season and snow in the Alps, but the ski industry can cope with the change by making artificial snow [23,28]. In this study, it was found that the outdoor skating businesses tried to adapt to the climate change by sprinkling water on the ice at night to increase the ice, but this effort was not very successful. Currently, a dismountable ice-field technique [50] is available, but it is only suitable for making ice on indoor ice fields or on a small scale. Presently, there is not a high-efficiency ice making technique suitable for natural lakes. Ice making techniques of high efficiency and low cost, if developed, would enhance the adaptive capability of the outdoor skating industry.
6.2. Conclusions
Outdoor skating is highly sensitive to climate change, and increases in temperature directly affect outdoor skating opening dates and operation duration times. During 1989–2015, the available skating duration time of the Bei Hai Park skating field was 36 days on average, with the longest time being 54 days (in the year of 2012) and the shortest time being 19 days (in the year of 2007). The opening dates and operation duration times of the Bei Hai Park skating field showed a three-year periodicity in terms of the change. Winter temperatures in December of a given year were the key factor influencing the running of outdoor skating fields: a temperature increase by 1 °C in December led to a 3.80-day delay of the opening dates and a 4.49-day reduction of the operation duration times according to the statistical model.
Warming winters are having significant adverse impacts upon outdoor skating-business operations in Beijing. Climate change has resulted in shrinkage of the field area open to the public, and the area of the Bei Hai Park skating field has decreased by two-thirds over the time period ranging from the 1990s to now. The warming winters have decreased the frozen period duration and delayed the opening dates, which has caused the fields to miss the maximal number of tourists over the New Year’s Day holiday, thereby further decreasing the operating revenue. In order to deal with the warming winters, field operators have attempted to sprinkle water onto the ice surface at night to increase the ice thickness and meet regulatory ice thickness requirements, but this practice usually did not have a satisfying outcome. The operators often held recreation on ice and performance events to attract tourists in order to compensate for the income loss due to the shortened frozen durations.
Climate change is already altering the behaviors of frequent skaters. More than five frequent skaters with more than 30 years of experience skating recalled that after the year 2000, the time available for outdoor skating was only one month, far less than the time of two or even three months in the 1970s–1990s. Aside from shortening the available skating time, warming winters are also degrading the tourists’ personal experience of skating, and this has forced some tourists to consider giving up outdoor skating. In particular for speed skaters, the shrinkage of the skating areas has negatively impacted their sport. Facing such climate changes, outdoor skaters have begun moving to high-latitude regions in northeastern China to skate or have been reducing their time spent outdoor skating; some are even replacing outdoor skating with other winter sports or skating on obsolete, natural, unsupervised lakes for a “wild skating” experience, but the latter option puts the skaters in great danger.
Interviews with people having many years of experience running and managing outdoor skating businesses and participating in outdoor skating activities helped to reveal the effects of climate change on outdoor skating. Moreover, the findings showed that perceptions of climate change are a key factor that influences decision making regarding adaption measures. Perception, which is a prerequisite for humans to respond to climate change, not only affects the selection by the general public of adaptive strategies, but also—perhaps to a higher degree—affects the effectiveness of adaptive strategies and plans, i.e., it is of pivotal importance to climate change adaptation measures [51]. However, perceived information may not be based on precise data. Therefore, comprehensive collections of data relevant to ice field operations are a prerequisite for quantitatively assessing the effects of climate change on the number of outdoor skaters and outdoor skating-related business revenue. The present Chinese tourism statistical system emphasizes macroscopic tourism-economic indicators—such as the number of tourists on a regional scale—rather than microscopic data, especially data on a scenic spot scale useful for statistics and sharing, and this has resulted in data deficiencies in regard to quantitative assessments of the effects of climate change on relevant tourism activities. Therefore, data statistics and data sharing improvements should be prioritized in future work for scientifically assessing climate change effects and properly proposing adaptive strategies.
Acknowledgments
The author(s) disclosed receipt of the following financial support for the research, authorship, and/or publication of this article: the National Natural Science Foundation of China (Grant No. 41630529, 41430528, 41671036), Social Science Planning Annual Project of Sichuan, China (Grant No. SC15B046), Soft Science Research Project of Sichuan, China (Grant No. 2015ZR0225), the Fundamental Research Funds for the Central Universities (Grant No. skqy201639), and the Ministry of Education of Humanities, Social Science Project (Grant No. 16YJC790060).
Author Contributions
J.L. and H.L. conceived and designed the research; H.C., X.S., L.H., and Q.F. collected the data; H.C. analysed the data; all authors wrote and reviewed the paper.
Conflicts of Interest
The authors declare no conflict of interest.
References
- Morrison, C.; Pickering, C.M. Perceptions of climate change impacts, adaptation and limits to adaption in the Australian Alps: The ski-tourism industry and key stakeholders. J. Sustain. Tour. 2013, 21, 173–191. [Google Scholar] [CrossRef]
- Scott, D. Why sustainable tourism must address climate change. J. Sustain. Tour. 2011, 19, 17–34. [Google Scholar] [CrossRef]
- Wang, L.; Ge, Q.; Ning, Z.; Cui, H.; Dai, J.; Zhong, S.; Wang, H. Effect of phenological change in ornamental plants on the dates of spring outings to popular locations, Beijing, China. Clim. Res. 2017, 72, 177–182. [Google Scholar] [CrossRef]
- Gilaberte Búrdalo, M.; López Martín, F.; Pino Otín, M.R.; López Moreno, J.I. Impacts of climate change on ski industry. Environ. Sci. Policy 2014, 44, 51–61. [Google Scholar] [CrossRef]
- Cao, L.; Zhu, Y.; Tang, G.; Yuan, F.; Yan, Z. Climatic warming in china according to a homogenized data set from 2419 stations. Int. J. Climatol. 2016, 36, 4384–4392. [Google Scholar] [CrossRef]
- IPCC. Climate Change 2014 Synthesis Report; IPCC: Geneva, Switzerland, 2014; p. 151. [Google Scholar]
- Li, S.; Yang, S. Changes of extreme temperature events in Beijing during 1960–2014. Sci. Geogr. Sin. 2015, 35, 1640–1647. [Google Scholar] [CrossRef]
- Qi, Z. Traditional physical cultural implication of manzu nationality by appreciating “picture of ice-skating game”. J. Shenyang Sport Univ. 2009, 28, 118–121. [Google Scholar]
- Witmer, U. Erfassung, Bearbeitung und Kartierung von Schneedaten in der Schweiz; University of Bern—Geographical Institiute: Bern, Germany, 1986; Volume 6, pp. 1–215. [Google Scholar]
- Elsasser, H.; Messerli, P. The vulnerability of the snow industry in the Swiss Alps. Mt. Res. Dev. 2001, 21, 335–339. [Google Scholar] [CrossRef]
- Elsasser, H.; Burki, R. Climate change as a threat to tourism in the Alps. Clim. Res. 2002, 20, 253–257. [Google Scholar] [CrossRef]
- Whetton, P.; Haylock, M.; Galloway, R. Climate change and snow-cover duration in the Australian Alps. Clim. Chang. 1996, 32, 447–479. [Google Scholar] [CrossRef]
- Moen, J.; Fredman, P. Effects of climate change on alpine skiing in sweden. J. Sustain. Tour. 2007, 15, 418–437. [Google Scholar] [CrossRef]
- Damyanov, N.N.; Damon Matthews, H.; Mysak, L.A. Observed decreases in the canadian outdoor skating season due to recent winter warming. Environ. Res. Lett. 2012, 7, 014028. [Google Scholar] [CrossRef]
- Brammer, J.R.; Samson, J.; Humphries, M.M. Declining availability of outdoor skating in canada. Nat. Clim. Chang. 2014, 5, 2–4. [Google Scholar] [CrossRef]
- Robertson, C.; McLeman, R.; Lawrence, H. Winters too warm to skate? Citizen-science reported variability in availability of outdoor skating in canada. Can. Geogr. Le Géogr. Can. 2015, 59, 383–390. [Google Scholar] [CrossRef]
- Fiennes, A.; Melcher, G.; Ruedi, T.P. Winter sports injuries in a snowless year skiing, ice skating, and tobogganing. Br. Med. J. 1990, 300, 659–661. [Google Scholar] [CrossRef]
- Smith, J.W.; Seekamp, E.; McCreary, A.; Davenport, M.; Kanazawa, M.; Holmberg, K.; Wilson, B.; Nieber, J. Shifting demand for winter outdoor recreation along the north shore of Lake Superior under variable rates of climate change: A finite-mixture modeling approach. Ecol. Econ. 2016, 123, 1–13. [Google Scholar] [CrossRef]
- Amelung, B.; Nicholls, S.; Viner, D. Implications of global climate change for tourism flows and seasonality. J. Travel Res. 2007, 45, 285–296. [Google Scholar] [CrossRef]
- Rutty, M.; Scott, D.; Johnson, P.; Pons, M.; Steiger, R.; Vilella, M. Using ski industry response to climatic variability to assess climate change risk: An analogue study in eastern canada. Tour. Manag. 2017, 58, 196–204. [Google Scholar] [CrossRef]
- François, H.; Morin, S.; Lafaysse, M.; George-Marcelpoil, E. Crossing numerical simulations of snow conditions with a spatially-resolved socio-economic database of ski resorts: A proof of concept in the French Alps. Cold Reg. Sci. Technol. 2014, 108, 98–112. [Google Scholar] [CrossRef]
- Klein, G.; Vitasse, Y.; Rixen, C.; Marty, C.; Rebetez, M. Shorter snow cover duration since 1970 in the swiss alps due to earlier snowmelt more than to later snow onset. Clim. Chang. 2016, 139, 637–649. [Google Scholar] [CrossRef]
- Bonzanigo, L.; Giupponi, C.; Balbi, S. Sustainable tourism planning and climate change adaptation in the Alps: A case study of winter tourism in mountain communities in the dolomites. J. Sustain. Tour. 2016, 24, 637–652. [Google Scholar] [CrossRef]
- Butsic, V.; Hanak, E.; Valletta, R.G. Climate change and housing prices: Hedonic estimates for ski resorts in western North America. Land Econ. 2011, 87, 75–91. [Google Scholar] [CrossRef]
- Pickering, C. Changes in demand for tourism with climate change: A case study of visitation patterns to six ski resorts in Australia. J. Sustain. Tour. 2011, 19, 767–781. [Google Scholar] [CrossRef]
- Hopkins, D.; Maclean, K. Climate change perceptions and responses in Scotland’s ski industry. Tour. Geogr. 2014, 16, 400–414. [Google Scholar] [CrossRef]
- Hopkins, D. The perceived risks of local climate change in Queenstown, New Zealand. Curr. Issues Tour. 2015, 18, 947–965. [Google Scholar] [CrossRef]
- Scott, D.; McBoyle, G. Climate change adaptation in the ski industry. Mitig. Adapt. Strateg. Glob. Chang. 2007, 12, 1411–1431. [Google Scholar] [CrossRef]
- Wang, S.; He, Y.; Song, X. Impacts of climate warming on alpine glacier tourism and adaptive measures: A case study of baishui glacier no. 1 in Yulong Snow Mountain, southwestern china. J. Earth Sci. 2010, 21, 166–178. [Google Scholar] [CrossRef]
- Yan, Y.; Zhang, Y.; Shan, P.; Zhao, C.; Wang, C.; Deng, H. Snow cover dynamics in and around the Shangri-La county, southeast margin of the tibetan plateau, 1974–2012: The influence of climate change and local tourism activities. Int. J. Sustain. Dev. World Ecol. 2014, 22, 156–164. [Google Scholar] [CrossRef]
- Intergovernmental Panel on Climate Change (IPCC). IPCC Climate Change Impacts, Adaptation, and Vulnerability, Summaries, Frequently Asked Questions, and Cross-Chapter Boxes; IPCC: Geneva, Switzerland, 2014. [Google Scholar]
- Hopkins, D. Public opinion: Country comparisons. Nat. Clim. Chang. 2015, 5, 975–976. [Google Scholar] [CrossRef]
- Trawoger, L. Convinced, ambivalent or annoyed: Tyrolean ski tourism stakeholders and their perceptions of climate change. Tour. Manag. 2014, 40, 338–351. [Google Scholar] [CrossRef] [PubMed]
- Haanpää, S.; Juhola, S.; Landauer, M. Adapting to climate change: Perceptions of vulnerability of down-hill ski area operators in southern and middle Finland. Curr. Issues Tour. 2015, 18, 966–978. [Google Scholar] [CrossRef]
- Hopkins, D. The sustainability of climate change adaptation strategies in New Zealand’s ski industry: A range of stakeholder perceptions. J. Sustain. Tour. 2014, 22, 107–126. [Google Scholar] [CrossRef]
- Matasci, C.; Kruse, S.; Barawid, N.; Thalmann, P. Exploring barriers to climate change adaptation in the swiss tourism sector. Mitig. Adapt. Strateg. Glob. Chang. 2014, 19, 1239–1254. [Google Scholar] [CrossRef]
- Lee, T.M.; Markowitz, E.M.; Howe, P.D.; Ko, C.-Y.; Leiserowitz, A.A. Predictors of public climate change awareness and risk perception around the world. Nat. Clim. Chang. 2015, 5, 1014–1020. [Google Scholar] [CrossRef]
- Hornsey, M.J.; Harris, E.A.; Bain, P.G.; Fielding, K.S. Meta-analyses of the determinants and outcomes of belief in climate change. Nat. Clim. Chang. 2016, 6, 622–626. [Google Scholar] [CrossRef]
- Zhang, Y.; Meng, W.; Chen, D.; Guo, W.; Wang, J. The trend of variation for low temperature days over Beijing and its surrounding area. Chin. J. Agrometeorol. 2011, 32, 33–37. [Google Scholar]
- Alutu, T. Song Dynasty History; Zhonghua Book Company: Beijing, China, 1985. [Google Scholar]
- The Palace Museum. Painting of Ice-Skating Game. Available online: http://www.dpm.org.cn/collection/paint/233288.html (accessed on 18 August 2016).
- China Meteorological Date Sharing Network. Monthly Value Dataset of Chinese Ground Annual Value; China Meteorological Date Sharing Center: Beijing, China, 1989. [Google Scholar]
- He, W.; Bu, R.; Xiong, Z.; Hu, Y. Characteristics of temperature and precipitation in Northeastern China from 1961 to 2005. Acta Ecol. Sin. 2013, 33, 519–531. [Google Scholar] [CrossRef]
- Liu, J.; Li, Y.; Liu, H.; Ge, Q.; Dai, J. Climate change and peach blossom viewing: Impact and adaptation. Geogr. Res. 2016, 35, 504–512. [Google Scholar]
- Pindoriya, N.M.; Singh, S.N.; Singh, S.K. An Adaptive Wavelet Neural Network-Based Energy Price Forecasting in Electricity Markets. IEEE Trans. Power Syst. 2008, 23, 1423–1432. [Google Scholar] [CrossRef]
- Zhang, Z.; Wang, Y.; Yang, Y.; Ye, J.; Zhou, Y.; Hao, Y.; Jiang, A. Changes and prediction of florescence of ligneous plants in Nanjing. Ecol. Sci. 2014, 33, 642–648. [Google Scholar]
- Zhang, A.; Zhang, J.; Ga, Y.; Guo, W.; Wang, H. Prediction of first flowering date of prunus discoidea in Beijing Yuyuantan Park using phenological medel. Meteorol. Sci. Technol. 2015, 43, 309–313. [Google Scholar]
- Magee, M.R.; Wu, C.H. Effects of changing climate on ice cover in three morphometrically different lakes. Hydrol. Proc. 2017, 31, 308–323. [Google Scholar] [CrossRef]
- Yang, J.; Yang, X.; Zhang, C.; Zhou, H.; Zhang, C. Variation characterisrtics of ice days in Shiyang River basin. Arid Land Geogr. 2016, 39, 712–720. [Google Scholar]
- Xu, S.; Lin, Z.; Li, J. Developing the curling to promote 300 million people participating in winter sports. China Winter Sports 2016, 38, 35–40. [Google Scholar]
- Myers, T.A.; Maibach, E.W.; Roser-Renouf, C.; Akerlof, K.; Leiserowitz, A.A. The relationship between personal experience and belief in the reality of global warming. Nat. Clim. Chang. 2012, 3, 343–347. [Google Scholar] [CrossRef]
Figure 1.
Portions of the painting titled the Ice-Skating Game, which was created by Qing Dynasty painters, Jin Kun et al. [41]. It is now in the collections of the Palace Museum; this picture is cited from The Web of Palace Museum.
Figure 1.
Portions of the painting titled the Ice-Skating Game, which was created by Qing Dynasty painters, Jin Kun et al. [41]. It is now in the collections of the Palace Museum; this picture is cited from The Web of Palace Museum.
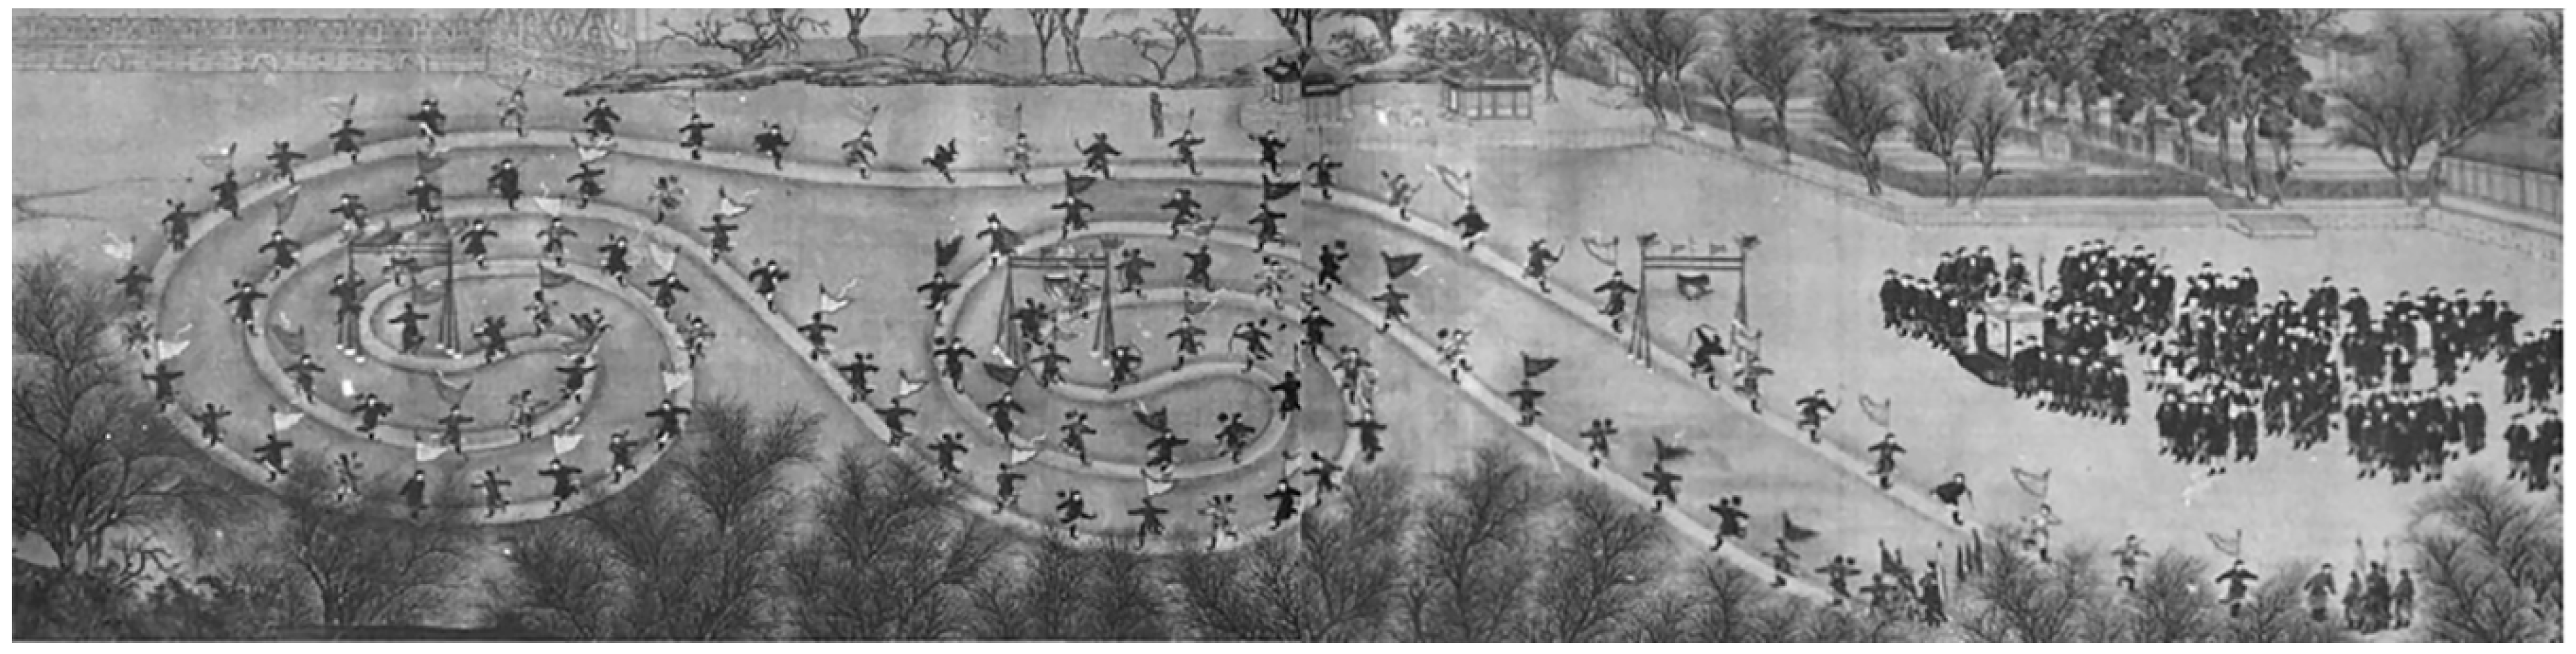
Figure 2.
Report of the first masquerade skating event published in the Shuntian Times in January 1926.
Figure 2.
Report of the first masquerade skating event published in the Shuntian Times in January 1926.
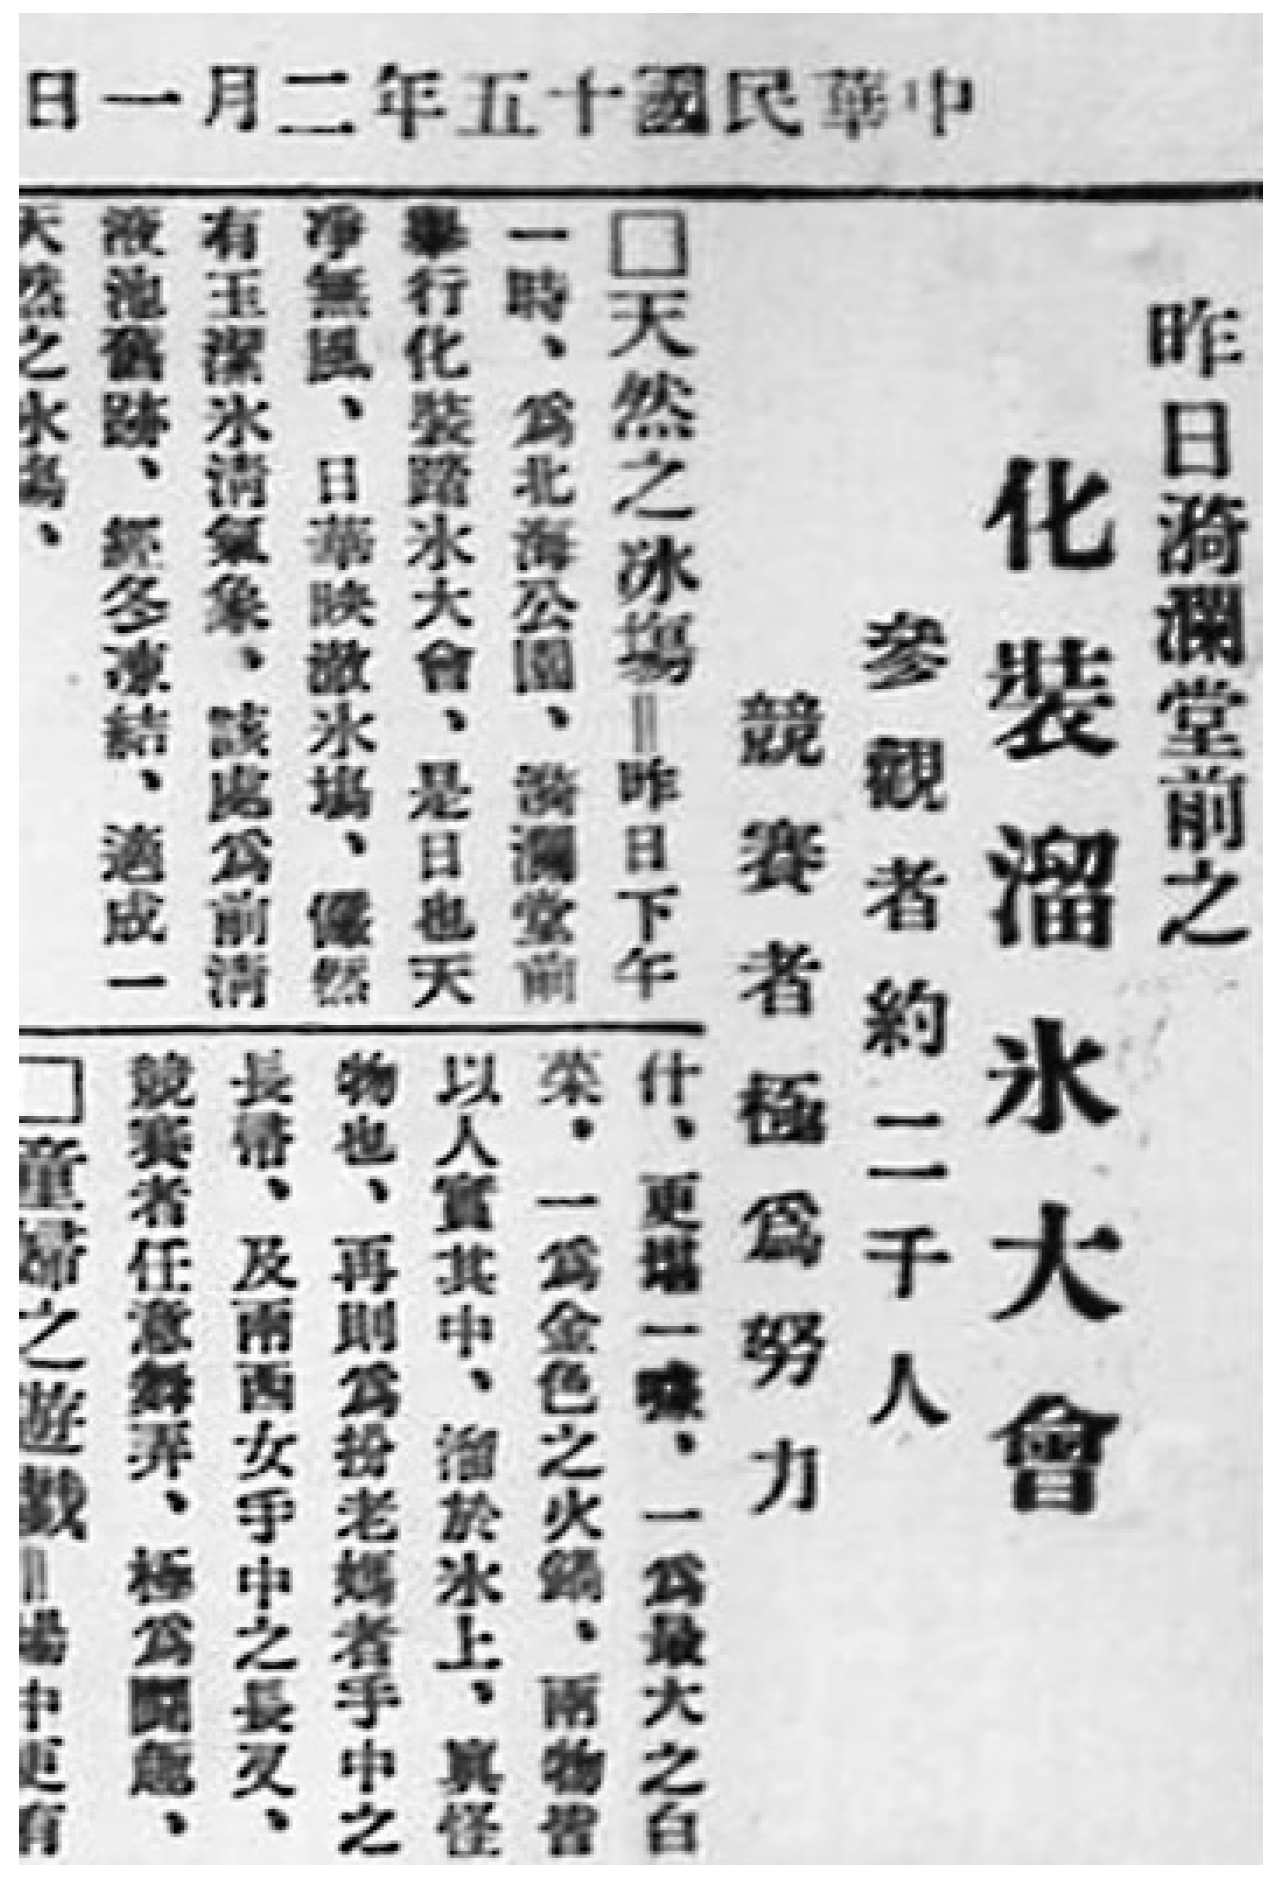
Figure 3.
Contour plots of the real parts of wavelet coefficients for the (a) opening date and (b) duration.
Figure 3.
Contour plots of the real parts of wavelet coefficients for the (a) opening date and (b) duration.

Figure 4.
Ordinary least squares (OLS) coefficient estimates for linear models of the opening date and duration. Opening date: R2 = 0.403, F = 1.738, DW = 1.376. Duration: R2 = 0.501, F = 2.577, Durbin-Watson statistic (DW) = 1.129. The month ranges from October to April of the next year; *** denote 1% significance levels.
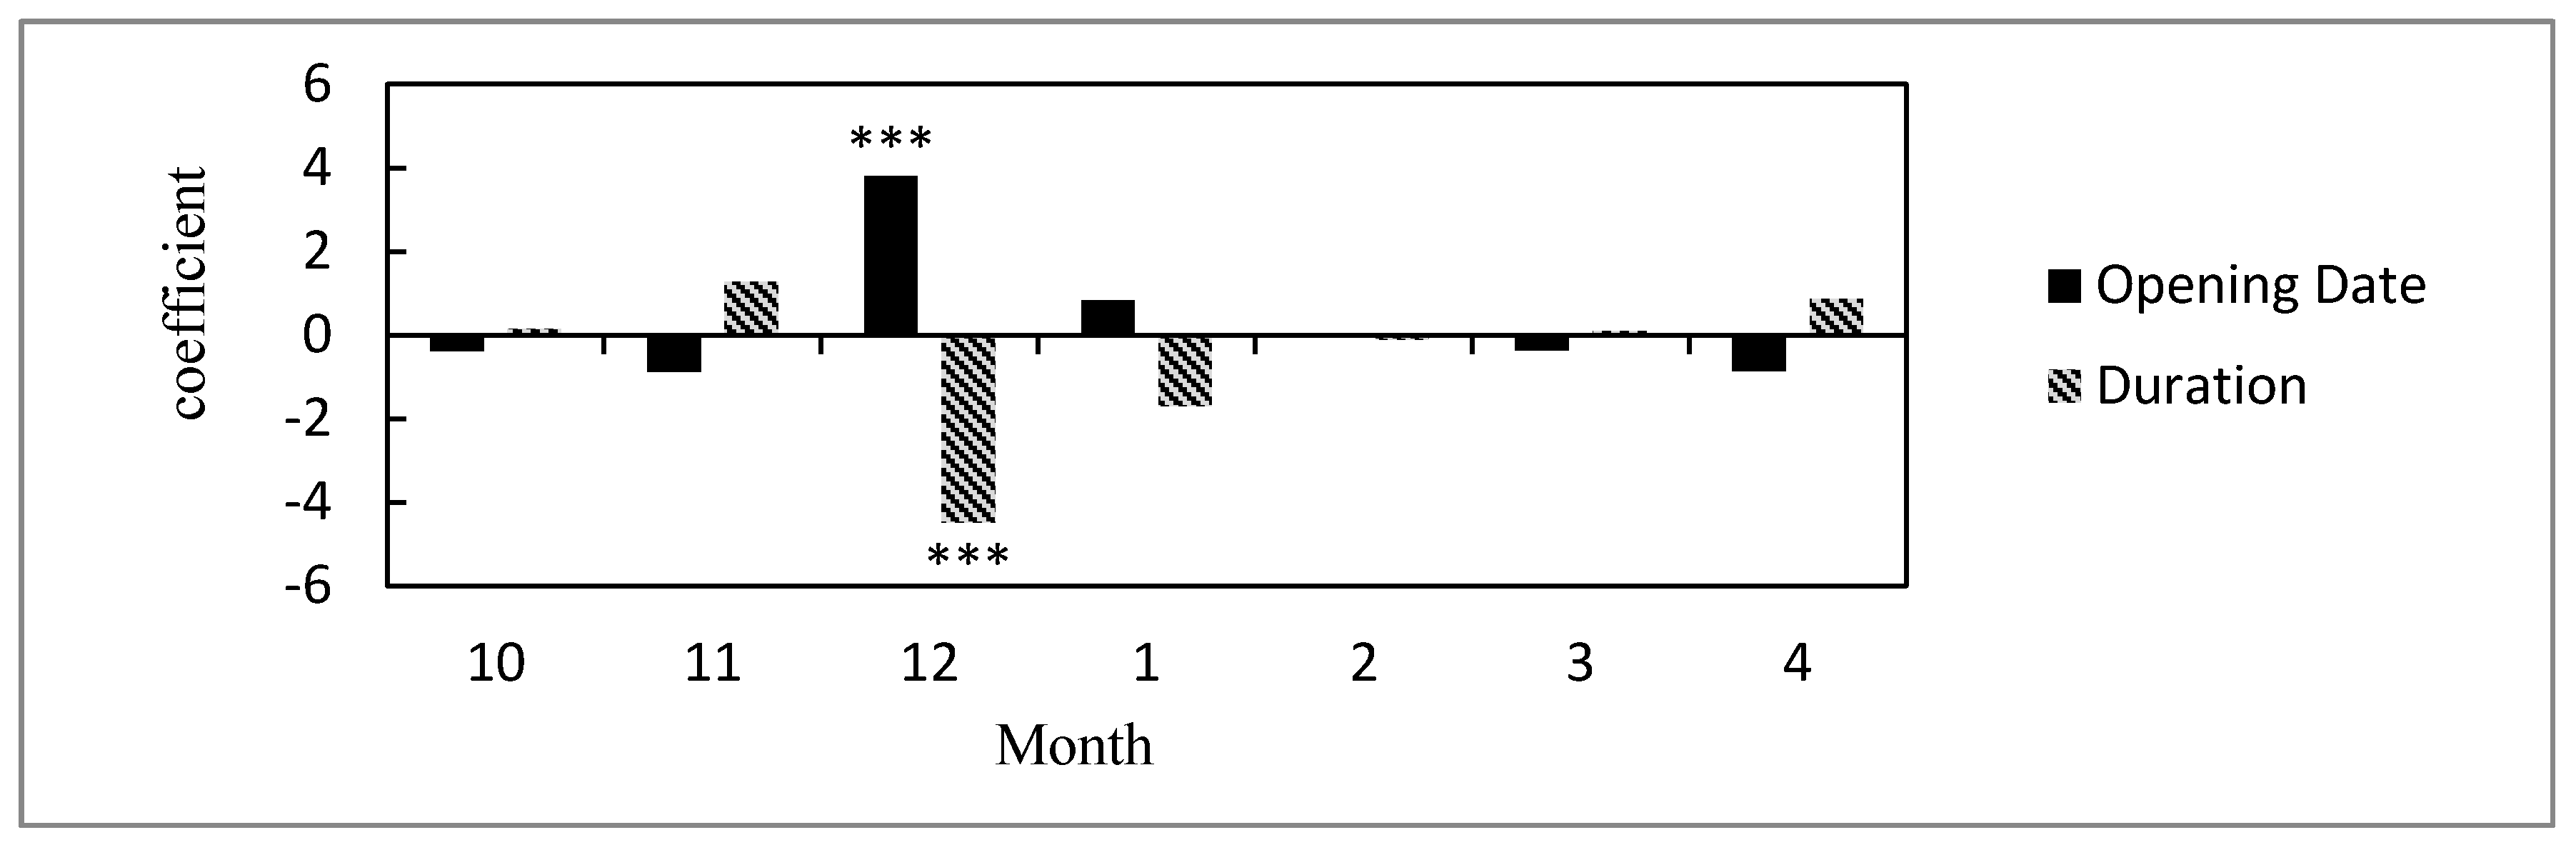
Figure 5.
The contour plot of the real parts of wavelet coefficients for the December average air temperatures.
Figure 5.
The contour plot of the real parts of wavelet coefficients for the December average air temperatures.
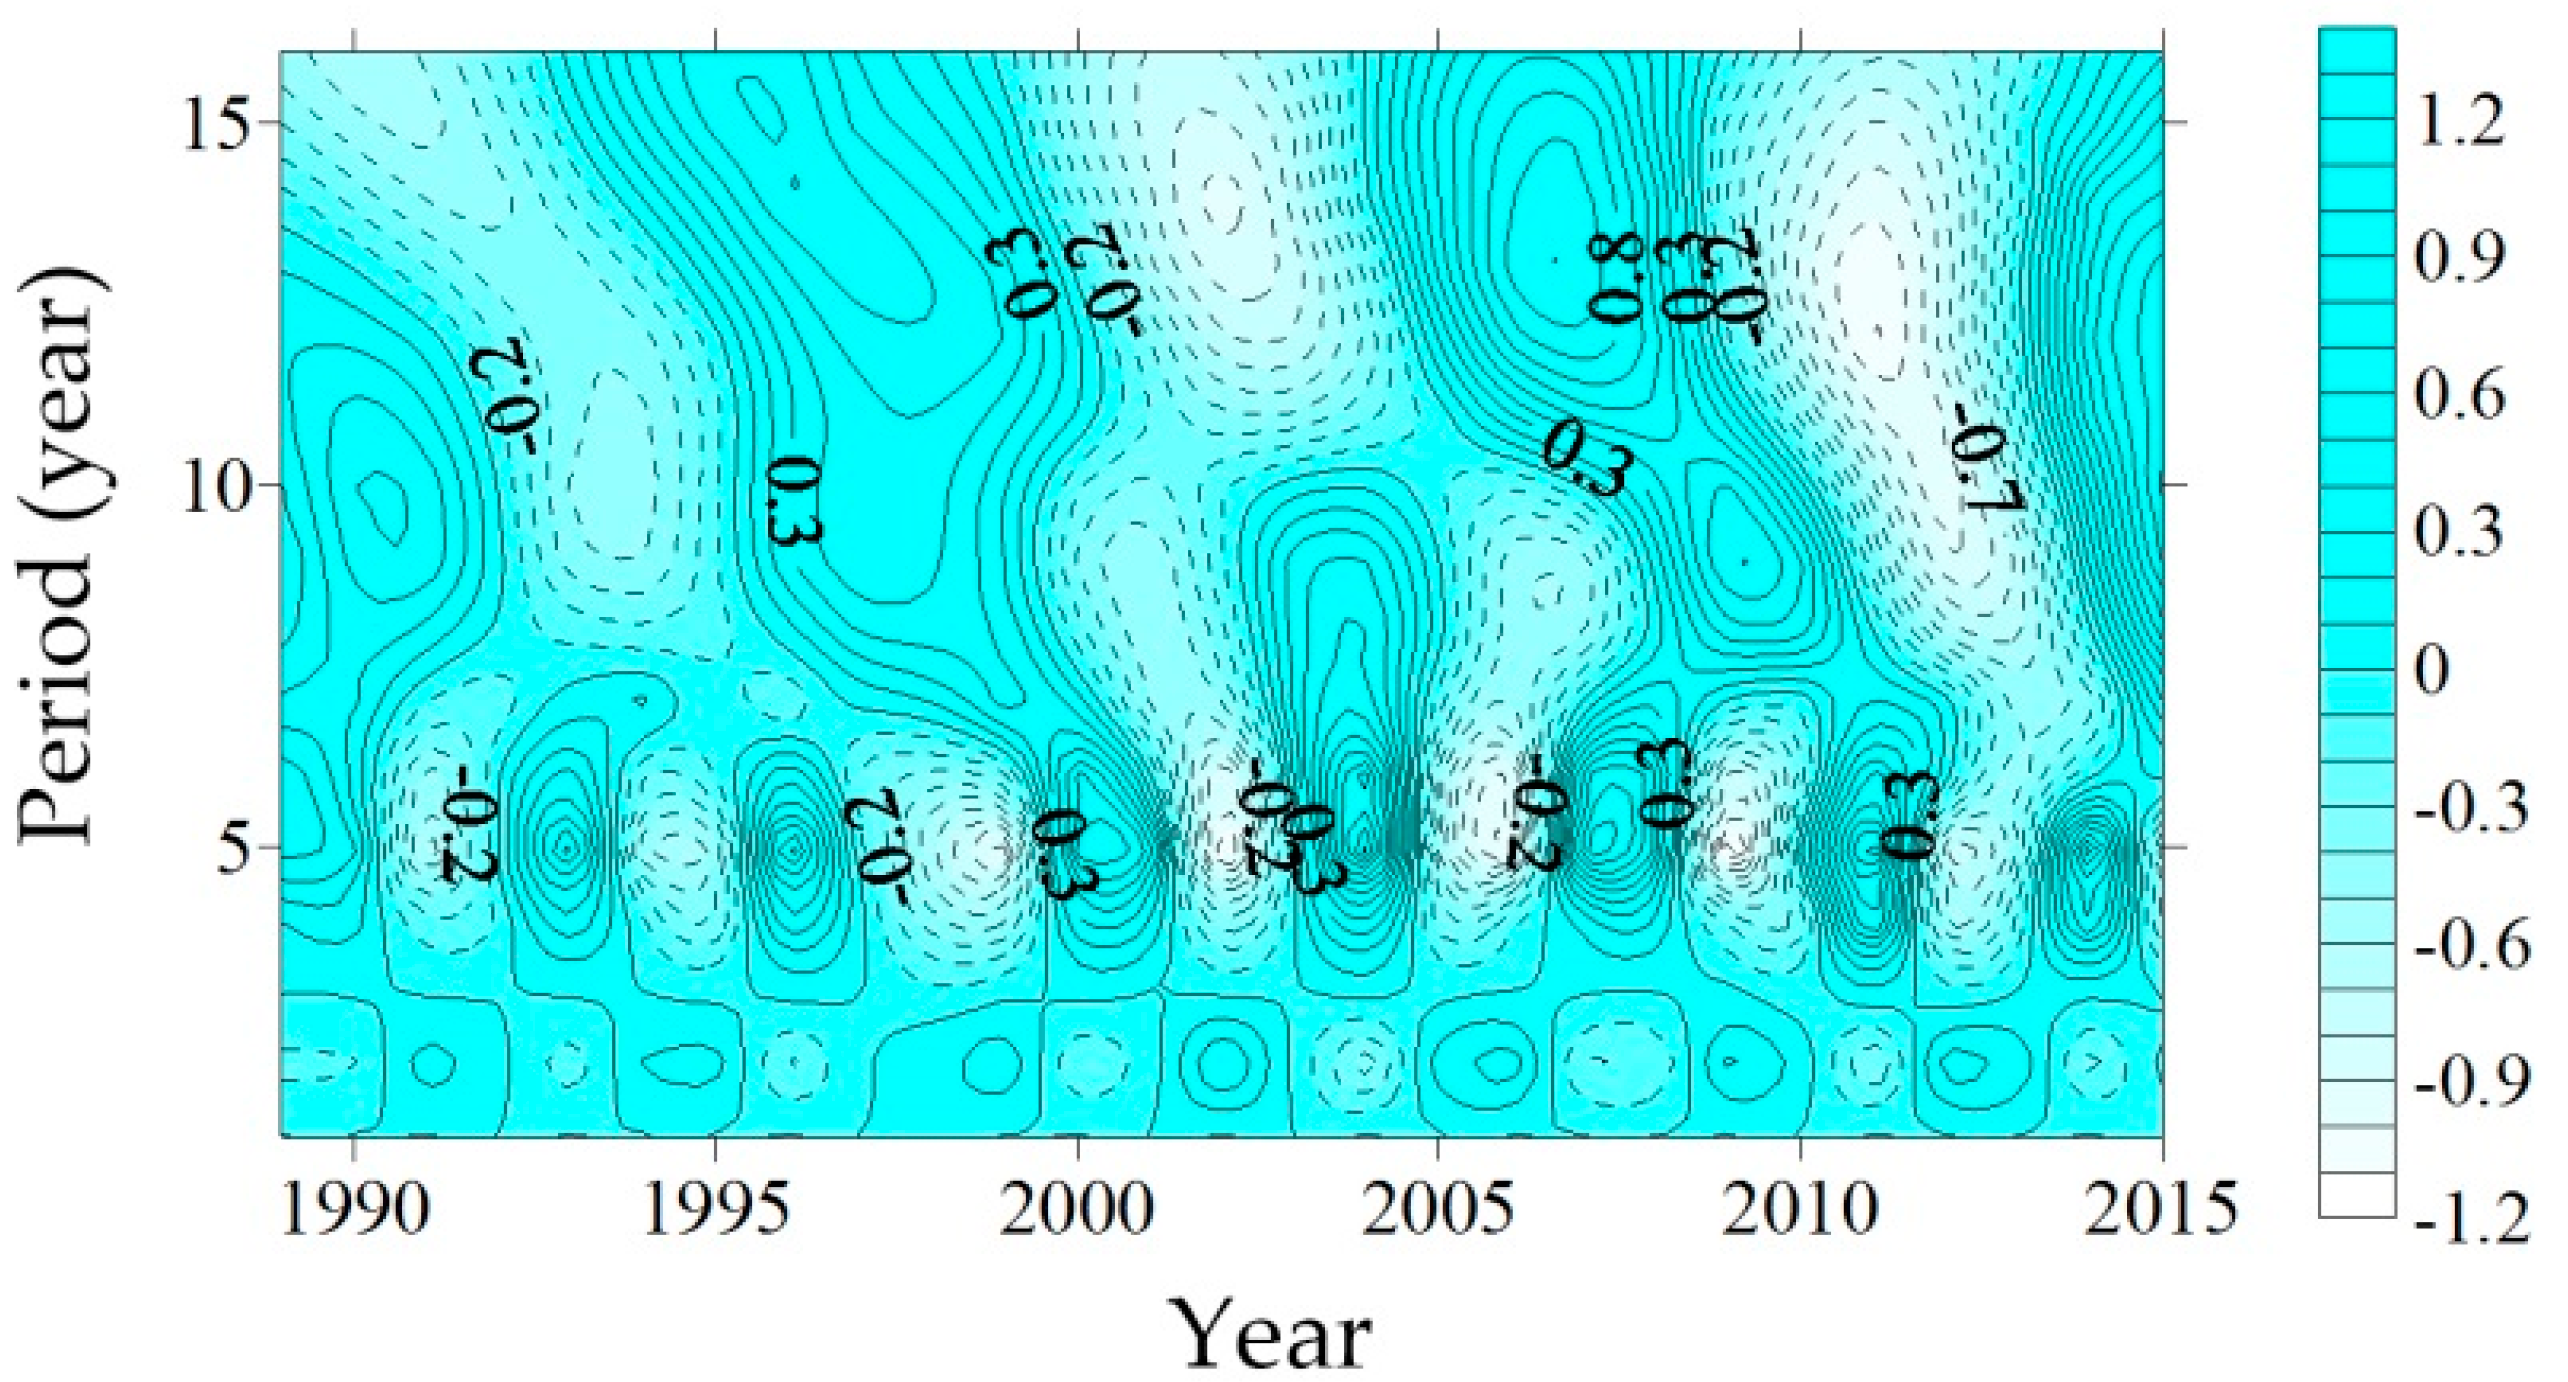
Figure 6.
The wavelet coefficient curves in the 5a period scales for the December average air temperatures; (a) opening dates and (b) duration.
Figure 6.
The wavelet coefficient curves in the 5a period scales for the December average air temperatures; (a) opening dates and (b) duration.


Table 1.
The Augmented Dickey–Fuller (ADF) test and its critical values.
| Variable | Test Type a | ADF Statistic | 1% Level | 5% Level | 10% Level |
|---|---|---|---|---|---|
| Opening date | (C,T,1) | −5.039 | −4.374 | −3.603 | −3.238 |
| Duration | (C,T,1) | −4.361 | −4.374 | −3.603 | −3.238 |
| Tem10 b | (C,T,1) | −4.116 | −4.374 | −3.603 | −3.238 |
| Tem11 | (C,T,1) | −4.578 | −4.374 | −3.603 | −3.238 |
| Tem12 | (C,T,1) | −5.079 | −4.394 | −3.612 | −3.243 |
| Tem1 | (C,T,1) | −4.055 | −4.374 | −3.603 | −3.238 |
| Tem2 | (C,T,1) | −5.171 | −4.374 | −3.603 | −3.238 |
| Tem3 | (C,T,1) | −5.563 | −4.374 | −3.603 | −3.238 |
| Tem4 | (C,T,1) | −5.941 | −4.374 | −3.603 | −3.238 |
a C, T, K denote the constant terms, time-series tendency parts, and lag lengths, respectively; b The terms tem10, tem11, tem12, tem1, tem2, tem3, and tem4 denote the corresponding average temperatures of October, November, December, January, February, March, and April, respectively, of each year.
Table 2.
The ADF test of residuals from the regression model.
| Variable | Test Type a | ADF Statistic | 1% Level | 5% Level | 10% Level |
|---|---|---|---|---|---|
| Opening date | (0,0,0) | −3.629 | −2.661 | −1.955 | −1.609 |
| Duration | (0,0,0) | −3.152 | −2.661 | −1.955 | −1.609 |
a Test types denote the constant terms, time-series tendency parts, and lag lengths, respectively.
Table 3.
Annual variation of the open area of the Bei Hai ice field.
| Open Area (m2) | 1991 | 1992 | 1993 | 2009 | 2010 | 2011 |
|---|---|---|---|---|---|---|
| Mean | 14,300 | 13,000 | 15,000 | 2000 | 6000 | 6000 |
| Three-year mean | 14,100 | 4667 | ||||
© 2017 by the authors. Licensee MDPI, Basel, Switzerland. This article is an open access article distributed under the terms and conditions of the Creative Commons Attribution (CC BY) license (http://creativecommons.org/licenses/by/4.0/).
Share and Cite
MDPI and ACS Style
Liu, J.; Cheng, H.; Sun, X.; Huang, L.; Fan, Q.; Liu, H. Effects of Climate Change on Outdoor Skating in the Bei Hai Park of Beijing and Related Adaptive Strategies. Sustainability 2017, 9, 1147. https://doi.org/10.3390/su9071147
AMA Style
Liu J, Cheng H, Sun X, Huang L, Fan Q, Liu H. Effects of Climate Change on Outdoor Skating in the Bei Hai Park of Beijing and Related Adaptive Strategies. Sustainability. 2017; 9(7):1147. https://doi.org/10.3390/su9071147
Chicago/Turabian StyleLiu, Jun, Han Cheng, Xiaoqian Sun, Li Huang, Qiuchan Fan, and Haolong Liu. 2017. "Effects of Climate Change on Outdoor Skating in the Bei Hai Park of Beijing and Related Adaptive Strategies" Sustainability 9, no. 7: 1147. https://doi.org/10.3390/su9071147
Note that from the first issue of 2016, this journal uses article numbers instead of page numbers. See further details here.