The Relationships between Urban Form and Urban Commuting: An Empirical Study in China

1
Institute of Remote Sensing and Earth Sciences (IRSE), College of Science, Hangzhou Normal University, Hangzhou 311121, China
2
Department of Forestry and Natural Resources, Purdue University, West Lafayette, IN 47907, USA
3
College of Geomatics & Municipal Engineering, Zhejiang University of Water Resources and Electric Power, Hangzhou 310018, China
4
College of Management and Economics, Tianjin University, Tianjin 300072, China
5
Key Lab of Urban Environment and Health, Institute of Urban Environment, Chinese Academy of Sciences, Xiamen 361021, China
*
Author to whom correspondence should be addressed.
Sustainability 2017, 9(7), 1150; https://doi.org/10.3390/su9071150
Submission received: 27 April 2017
/
Revised: 28 June 2017
/
Accepted: 29 June 2017
/
Published: 1 July 2017
Abstract
:Urban sustainable development strategies are of great importance to rapidly urbanized countries such as China. One of the most challenging problems is how to coordinate urban spatial development with social efficiency and environmental protection, e.g., highly efficient low-carbon urban traffic. Despite broad research efforts with respect to the influence of urban form on travel patterns, questions persist as to the impact of compact urban form on travel distance and modes. In this study, we adopted urban form metrics to capture key dimensions of urban form with the aid of image processing and spatial analysis based on satellite images and statistical data from the cases of 35 cities. Combined with urban travel survey data, we empirically examined the relationships between urban form and travel patterns of local urban residents. The results showed that urban form and travel patterns have regionalized characteristics, e.g., the eastern cities are characterized by disperse urban development patterns and longer commuting times on average compared with western and central cities. We found that relatively smaller built-up areas, higher degrees of urban spatial agglomeration and more paved road area per person would decrease the commuting time of urban residents. We also found that the public transport choices of urban residents are positively associated with built-up areas and commuting times, which suggests the need for provision and promotion of facilities for a high-quality public transport system. The findings provide helpful suggestions for the planning of sustainable urban form and development of transportation.
1. Introduction
Research on sustainable urban form has been largely stimulated by the increasingly serious worldwide environmental and social problems related with urban development [1,2,3]. The relationship between transportation and urban land use is one of the crucial aspects in urban sustainability research [4]. Some studies have shown that urban sprawl, referring to the rapid expansion of metropolitan areas to rural areas, with low-density development strategy at the urban fringe usually means more driving demand, longer commuting distance, increased vehicle emissions and related social costs [5,6]. However, compact development, on the contrary, is not a panacea to the sprawling urban areas when considering the existing urban inner structure and urban historical development patterns [4,7,8]. Increasing the rate of public transport utilization, e.g., by controlling car traffic to save energy and reduce pollution emissions, has been a common consensus in low carbon city development agendas [9]. Cycling and walking, regarded as “green travel” modes, are believed to be positive in reducing carbon footprints in urban areas [10,11,12]. During the past decades, a series of urban space development strategies have been proposed to curb disordered urban sprawl and reorient towards low-carbon urban transport, through for example compact cities, smart growth and new urbanism [13,14].
Urban form has diverse impacts on travel distance and mode. Compact development patterns, featured by relatively high population density, mixed land use, and easily accessible facilities, are beneficial for walking, cycling and public transportation. Their direct advantages are reduced travel demand and shortened travel distance and time [15,16,17]. The widely cited ECOTEC report provided several factors in the link between population density and travel patterns, e.g., increased accessibility of contacts and activities for the local residents, reduced average spatial distances between destinations of various services, and distance to public transport facilities [18]. Frank et al. [19] found that population density and mix land use both relate with traffic mode choices, even excluding non-urban form factors for both commuting and shopping trips. As Lee et al. [20] pointed out, destination, distance, density and route are key factors in travel mode choice for urban residents. High quality public transport systems linked to employment centers can greatly reduce the usage frequency of automobiles, while highly mixed land uses were found to be positively correlated with transit, cycling and walking commuting rates [21]. Higher destination accessibility, a larger number of exclusive bicycle lanes, and greater connectivity between local streets might have significant correlations with the choice of cycling [22].
Various empirical studies about the influences of urban form on travel patterns were presented in different regions and at different spatial scales [23,24,25,26,27]. However, the relationship between urban form and travel patterns remains far from entirely clear. The lack of comparability in different studies causes the present understanding of the relationship between urban form and travel behavior to be perplexing [28,29,30,31]. It is reasonable to believe that there is certain relationship between urban form and travel patterns as described above. However, there are still several issues with respect to compact urban form that need to be addressed. For example, could it reduce the travel time to improve travel efficiency, and if possible, what characteristics play key roles? Is it effective in promoting the transformation of the travel modes that residents usually prefer in order to achieve low-carbon travel targets?
The spatially distributed urban form data could be conveniently extracted from geographic data of urban areas, and the feature details are only limited by the map scale. However, if such kinds of data are unavailable, remote sensing data could be used to extract construction land data, including for buildings, in urban areas [32,33]. The various optical remote sensing sensors provide natural generalizations of land surface features to fit different research purposes in urban areas, e.g., from urban block to building levels, including 3D building information extraction [34,35,36,37]. In recent years, remote sensing has been extensively applied in urban spatial growth monitoring (e.g., urban sprawl), building reconstruction, urban land use classification, and socio-economic analysis [33,38,39].
For this purpose, we performed an empirical study by using 35 Chinese large cities and megacities as case studies with the aid of remote sensing and spatial analysis. We interpreted the urban construction land for all the case cities by using Landsat TM imageries, and then we calculated urban form-related metrics. A questionnaire survey was carried out in all case cities to assist in the analysis between urban form and travel patterns of local urban residents. We then investigated the relationships between compact urban form and urban travel patterns. The purpose of this study is to provide effective urban form metrics related to time-efficient and low-carbon travel patterns. The findings in this study would provide helpful suggestions for sustainable urban form planning and transportation development.
2. Materials and Methods
2.1. Study Area
There are some discrepancies about the definitions of urban or urbanized areas. In Britain, for example, the key principle underlying the urban and rural domains is its reliance on the identification and characterization of physical settlements based on the dwelling density calculation [40]. In the United States, the Census Bureau defines urban area as areas with population density of at least 1000 persons per square mile, which is based on the residential population density while omitting the administrative boundaries [41]. In China, the term “urban area” refers to a specific administrative unit. A municipal district (pronounced as “shixiaqu” in Chinese) or urban district (“shiqu” in Chinese) consisting of several sub-districts is usually referred to as an urban area and is the basic spatial unit in urban-related statistical reports [42,43]. We adopted the concept of urban district (shiqu) in this study. The following data analysis, including urban construction land interpretation, statistical data analysis, and questionnaire survey, are all carried out at the level of the urban district.
In this study, a total of 35 major cities in China, including 4 municipalities directly under the Central Government of China, 5 cities with independent planning, and 26 provincial capitals (Taipei and Lasa cities were excluded due to unavailability of data), were selected as the case cities (Figure 1). As a general rule, the status of urban land development and infrastructure construction is closely related to the level of economic development. For China, the level of economic development gradually decreases from coastal areas (eastern) to western regions [44]. According to the traditional zoning practice, we divided the case cities into east, central and west subsets, respectively (Figure 1).
2.2. Remote Sensing Data Processing
The urban construction land of each city was interpreted from Landsat TM imagery collected around 2010. The urban construction land or built-up land refers to human-constructed elements [45]. The selected scenes are of good image quality and are cloud-free. To enhance the accuracy of image classification, the satellite transit time of each city was purposely selected to be overlapped with vigorous vegetation growth stages locally.
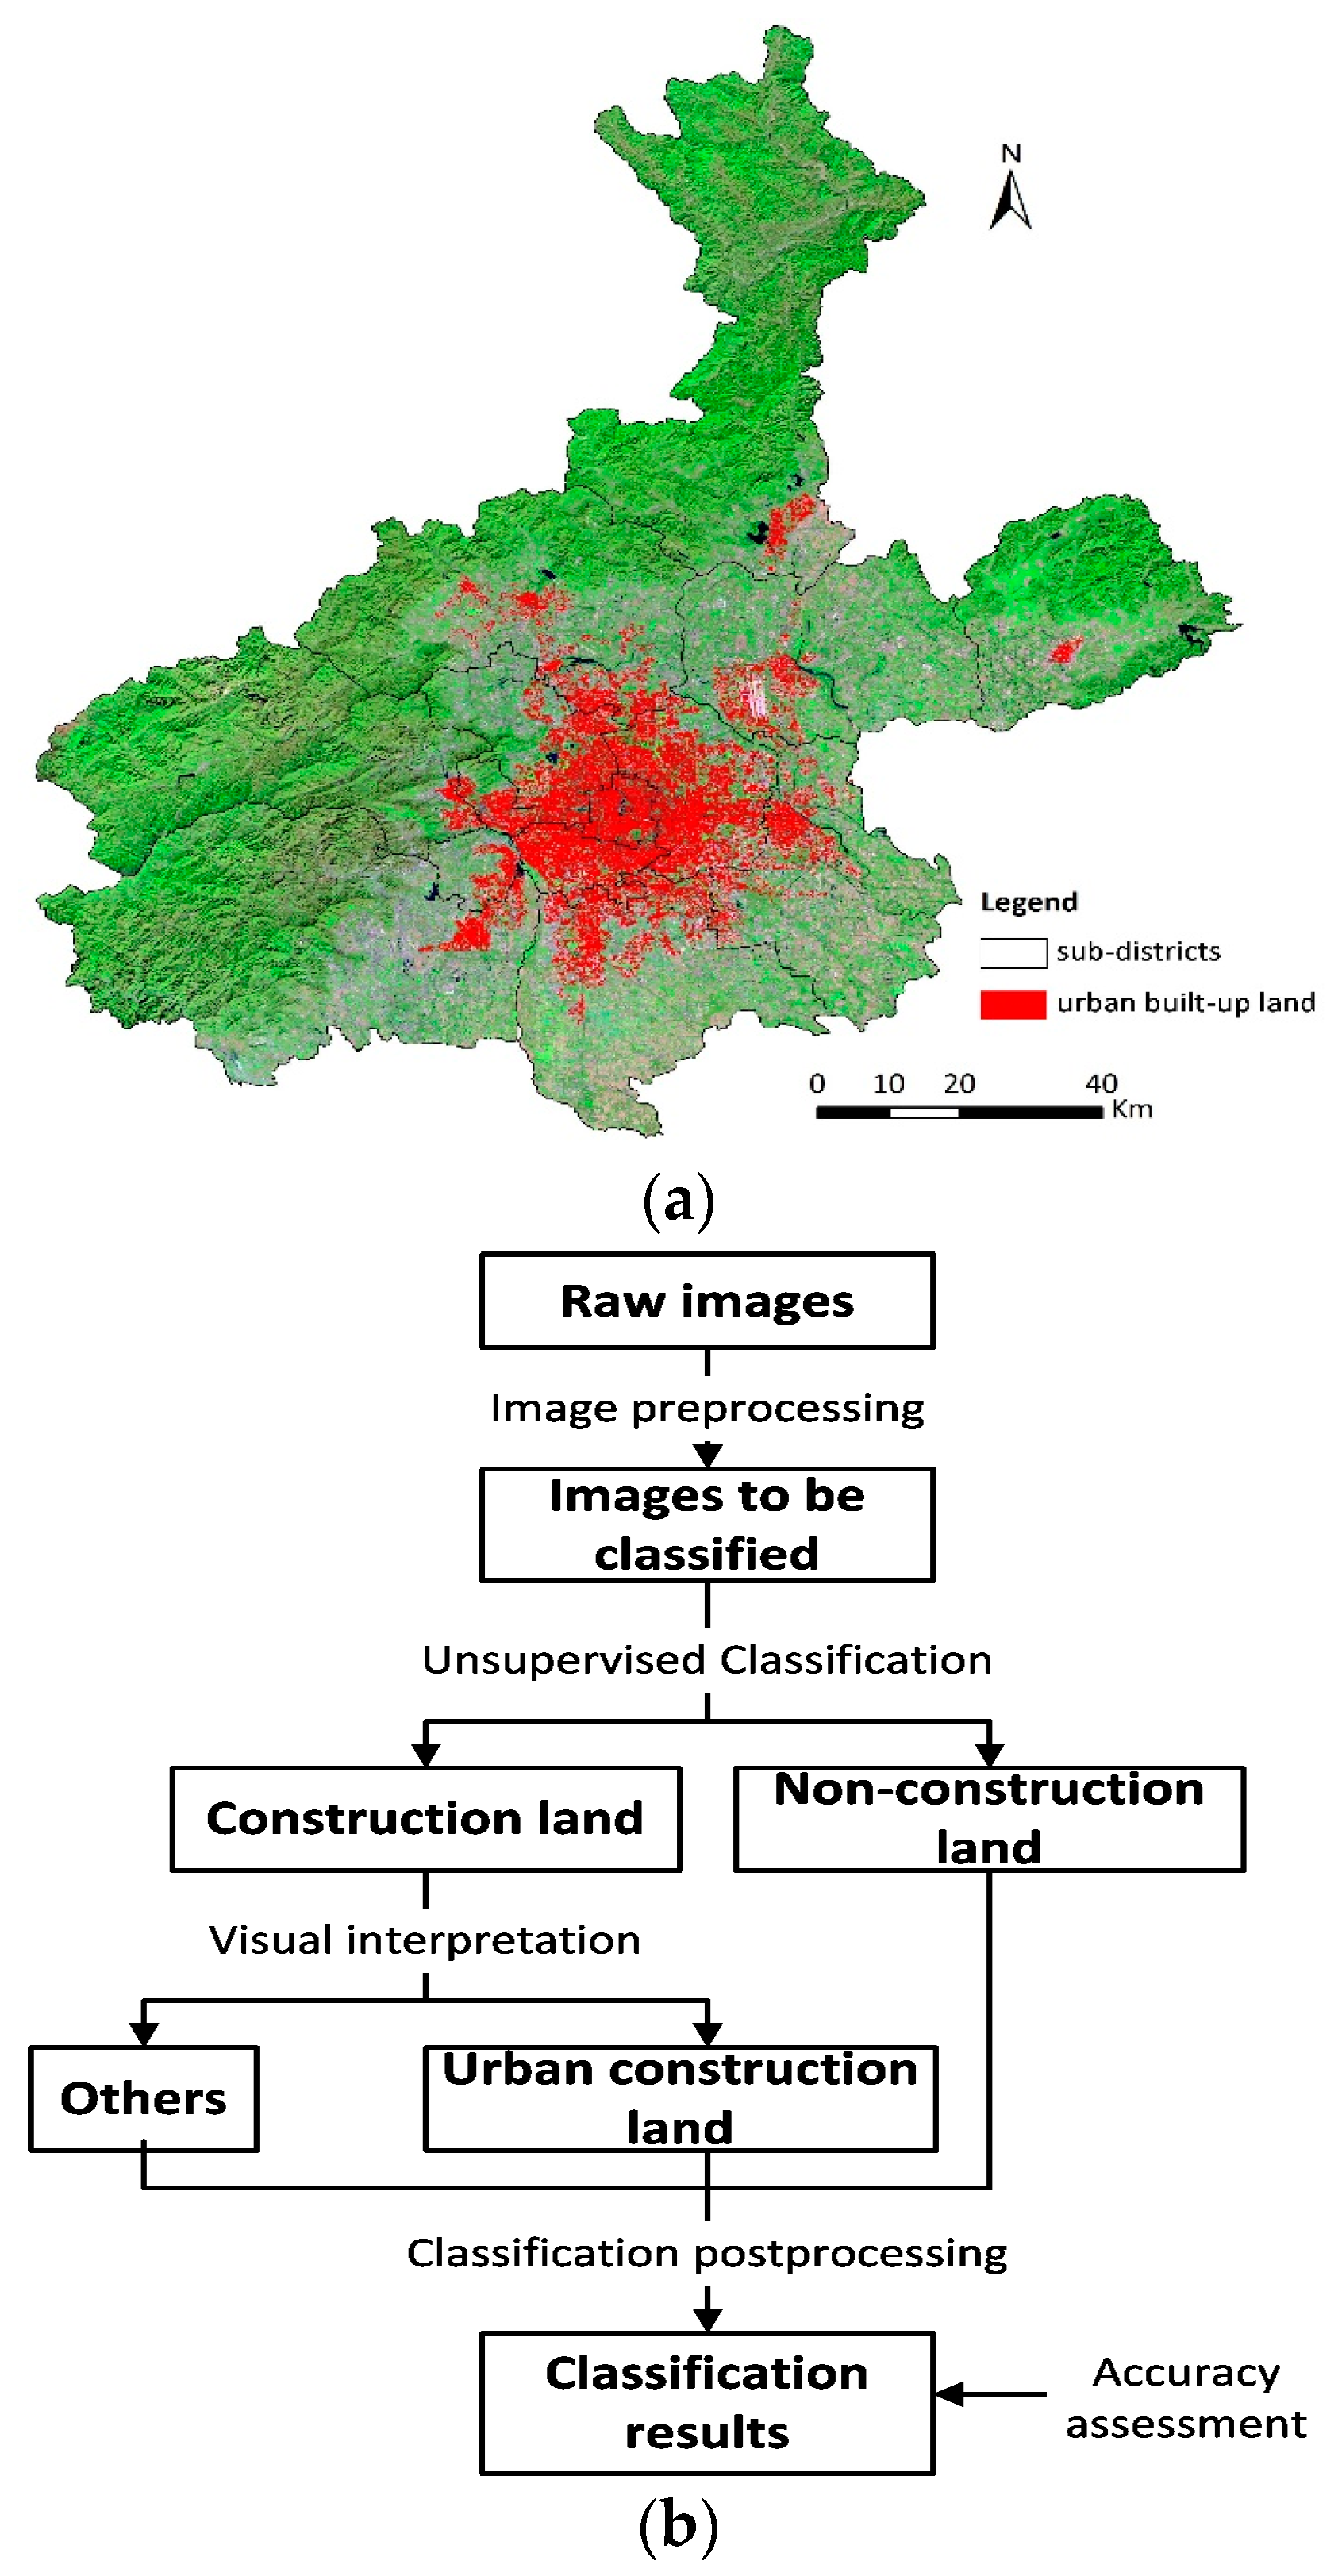
All images were processed using ENVI 5.1 and ArcGIS 10.1. The radiometric and atmospheric corrections were adopted with the dark-object subtraction method. The error of geometric correction was controlled to under 0.5 pixels. The urban construction land was extracted by using unsupervised classification [46,47]. The pre-processed reflective image was classified into 15 classes using the ISODATA classification method, and then each of the classes was assigned and recoded into one of the two land-use classes, i.e., construction land or non-construction land. Afterwards, the urban construction land and rural construction land were distinguished by using 1:100,000 land-use map in 2010 and visual interpretation under the aid of Google Earth images for reference [48,49]. Finally, the accuracy of classification of each city was evaluated by a set of 200 samples using random sampling with reference to the high-resolution aerial images and land-use data set. The assessment results showed that the overall accuracy of urban construction land classification in the case cities is above 90% (Figure 2).
2.3. Urban Form Metrics
The following urban form metrics, including urban compactness, agglomeration degree, size, density, and vehicle availability that represent the multi-faceted physical dimensions of compact urban form, were introduced to quantify the influence of urban form on travel patterns.
2.3.1. Compactness
We proposed a modified version of urban compactness metric based on the law of gravitation. The value of T, proposed by Thinh (2002), positively correlates with the compactness of construction land of a specific city [50]. However, it is not reasonable when comparing the compactness of cities with different spatial scales [17]. In this study, a modified urban compactness index, named the normalized compactness index (NCI) is used to overcome the limitation of T. The formula of NCI is as follows [2]:
where T is the average gravity of a specific urban space, i.e., the urban construction land compactness; Pi and Pj are the construction areas for grid i and j, respectively; d(i, j) is the Euclidean distance between grid i and j; and N is the total number of grids in the study area. Tmax is the compactness of the equivalent circular-shaped urban area; Si′ and Sj′ are the construction areas in grid i′ and j′ in the equivalent circular-shaped urban area, respectively; and M is the total number of grids in the equivalent circular-shaped urban area. NCI is dimensionless and within the range of 0 and 1.
2.3.2. Spatial Agglomeration
The global spatial autocorrelation methods use a single metric to detect spatial patterns and reflect the average degree of agglomeration throughout the study area [51]. In this study, we used the global Moran’s I (GMI) index to represent the spatial agglomeration degree of urban construction land. The calculation of GMI follows the same meshing scheme as NCI and its formula is as follows [52]:
where is the deviation of construction land percentage for grid i from its mean (), is the proportion of urban construction in grid i, is the average construction land percentage for all grids, is the spatial weight between feature i and j, n is the total number of grids, and is the aggregate of all the spatial weights:
The value of GMI ranges from −1 to 1. The significance of GMI can be tested by Z statistics. Given a certain significance level, the value of a GMI closer to 1 suggests a more clustered global spatial pattern, while a value closer to −1 suggests a more dispersed pattern. We specified the neighborhood relationship using the “inverse distance” weight function to obtain Moran’s I statistics. All analyses were computed using the ArcGIS spatial statistics tools package.
2.3.3. Urban Scale and Density
1. Built-up area (BuA)
BuA (“jianchengqu” in Chinese) is not a recognized administrative unit, but is actually construction land with mature infrastructure, which is used to represent the urban expansion scale.
2. Population Density (PD)
PD is defined as:
where RP is the urban resident population. In this study, we selected the urban resident population as the urban population, but not the registered non-agricultural population in order to guarantee the validity of the urban population density calculation [53].
3. Transportation Infrastructure Availability
The transportation infrastructure availability metrics consist of three quantities, i.e., road area per capita (RAC), availability of public transportation (APT), and availability of taxi (AT); the three metrics represent road density, number of public transportation vehicles per ten thousand people, and number of taxis per ten thousand people, respectively [54]. The definitions are as follows:
where RA is paved road area (m2), PT is the number of public transportation vehicles in operation, and T is the number of taxis in operation.
2.4. Questionnaire Survey
The typical daily travel data of local residents in the case cities were collected by a questionnaire campaign conducted from January to March 2011, and in total, 2535 valid questionnaires were collected. The theme of the questionnaire focused on the travel patterns of the urban residents in major cities in China [55].
We designed the questionnaire based on the review of related literature (e.g., Stead et al. [29] and Kenworthy et al. [43]). As a general practice, travel time and travel mode are the most common contents in urban form and travel characteristic-related studies. The questionnaire survey was carried out at the level of the urban district, geographically the same as the corresponding urban statistical sources. We travelled to the 35 case cities in 2011 and conducted the questionnaire surveys [17]. During the questionnaire survey in a specific city, the respondents were randomly selected from each sub-district of that city. We excluded the respondents whose accommodation was close to their places of work.
The questions in this questionnaire related with this study are as follows: age (≤20, 20–39, 30–39, 40–49, 50–59, ≥60); place of residence (specific to sub-district); occupation (office worker, service staff, merchant, freelancer and others); daily commuting time in minutes between home and working place; and the most common kind of commuting mode (i.e., the most frequently used transportation mode, including walking, cycling, automobile, bus, bus rapid transit, electromobile, subway, light rail, and others). The questionnaire also collected information on the major leisure activities (e.g., recreation, shopping, outside eating, visiting friends and others) of the respondent during the weekend. Specifically, we asked the respondent to estimate the travel times for all the activities he/she preferred as listed above. We assumed that the main travel cost on workdays is commuting time, while the main travel cost in weekend is leisure time. The average daily one-way travel time per week is calculated as (workday × 5 + weekend × 2)/7.
3. Results
3.1. Urban Form Characteristics
The maximum, minimum, mean and standard deviation of the urban form metrics for each case city were calculated (Table 1).
The comparison of urban form metrics among different regions (see Figure 1 in this study for the classification) enables a more detailed view of how urban form varies in China. The cities in East China have the largest BuA, with an average area of 510 km2, followed by the Central and West China, at 331 km2 and 292 km2, respectively. Meanwhile, cities in East China have lower compactness and agglomeration degree as measured by NCI of 0.096 and GMI of 0.513 on average, compared with 0.123 and 0.579 in Central China, and 0.147 and 0.572 in West China. The western cities have the smallest BuA, the highest NCI, and medium GMI accordingly, indicating lower levels of urban expansion, greater urban compactness, and moderate spatial agglomeration degrees.
The central cities have a relatively higher road area per capita and number of taxis per ten thousand people, as well as a slightly lower population density and number of public transportation vehicles per ten thousand people on average than the other regions, indicating better taxi availability and road construction, but relatively sparse urban density and a weak urban public transport system. Note that the road area per capita in western cities is the lowest, an obvious indication of inadequate investment in road construction.
The sizes of the eastern cities vary greatly. The BuA of Haikou city is only 98 km2, just above that of the city of Xining, which has the smallest BuA among the case cities, in West China. Meanwhile, the cities of Beijing (1223 km2), Shanghai (999 km2), and Guangzhou (952 km2) in East China are almost three or four times larger than the average urban BuAs of central and western regions. Similarly, the PD and AT in western cities also show large variations. For example, the densest city is Xi’an, and the sparsest is Urumchi city, with 172 and 82 person/ha, respectively.
3.2. Urban Travel Patterns
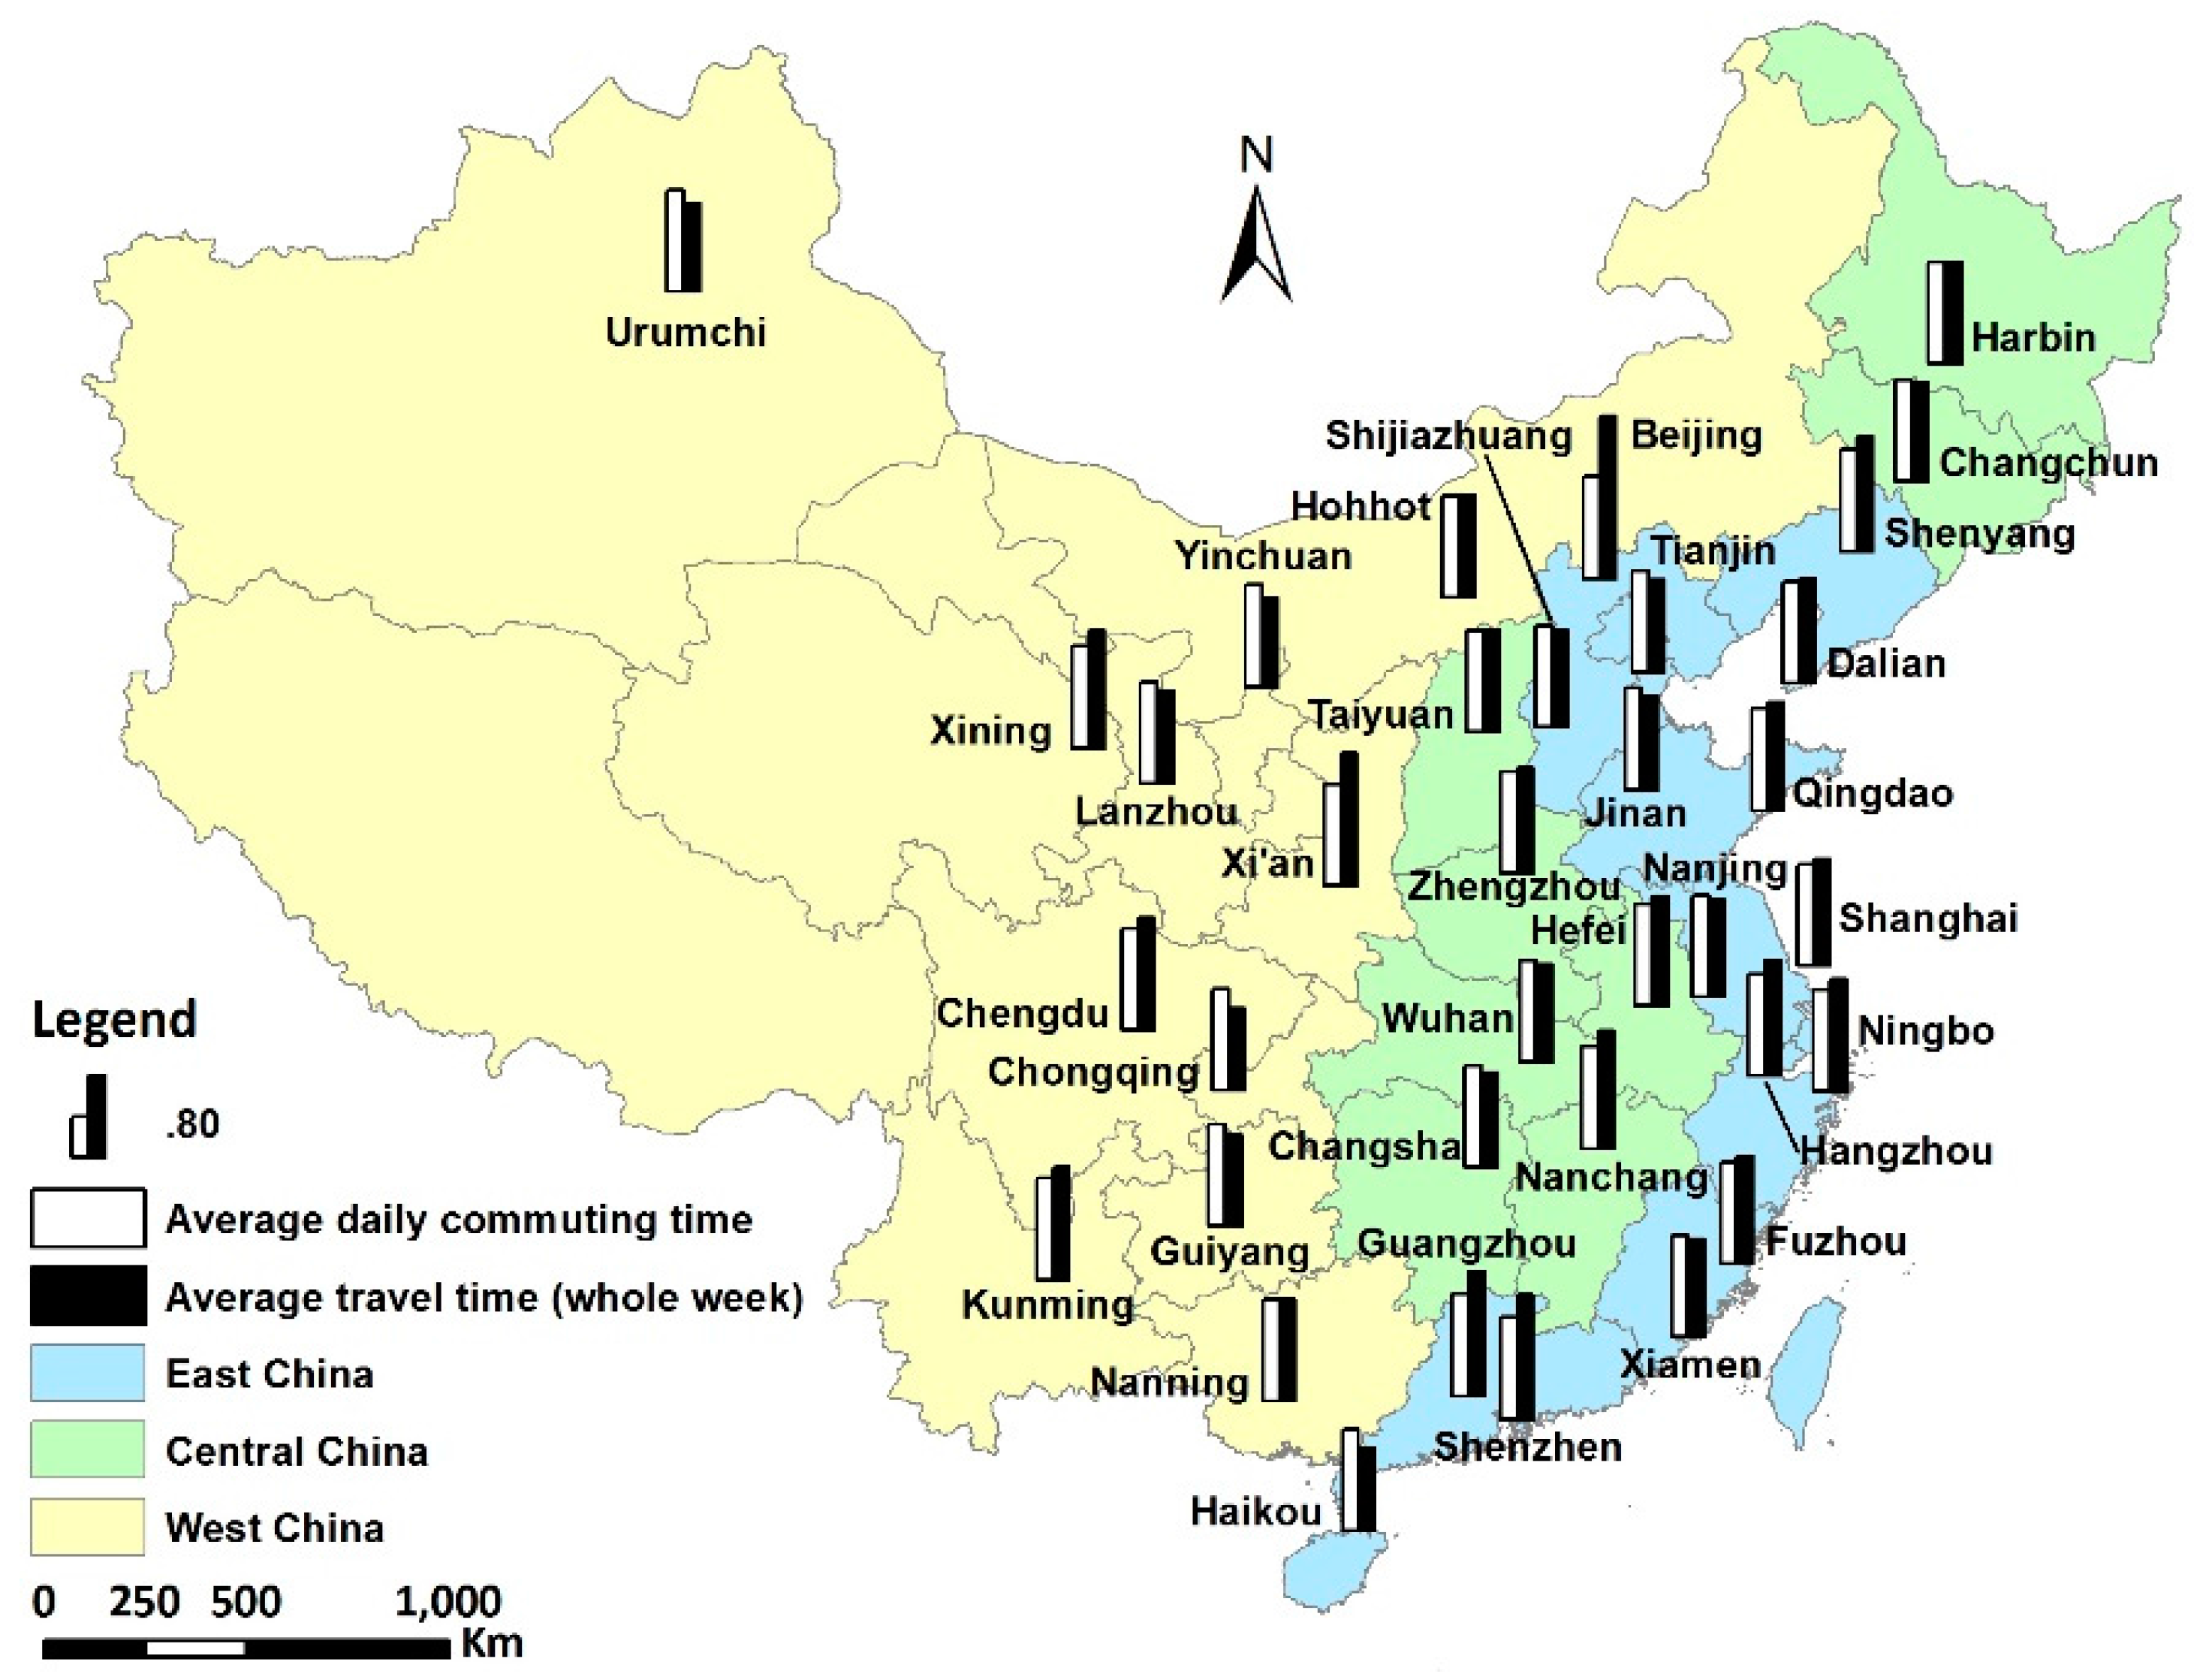
The comparative analysis of the questionnaire reflects the general travel patterns of the case cities, including both work and life aspects (Figure 3). The difference between average daily commuting time (one-way, hereinafter) and average travel time over the whole week (one-way, hereinafter) of urban residents is about 2 min, and the latter is slightly higher. In East China, the average daily commuting time of urban residents is about 30 min, longer than the 27 and 26 min found in West and Central China, respectively. In terms of the average travel time over the whole week, for the eastern cities this time is 33 min, and for the other regions this value is 1 minute more than the corresponding average daily commuting times.
In all case cities, the three most time-consuming cities for commuting are located in East China. The daily commuting time in Shenzhen city is the longest—up to 45 min, followed by 43 min in Shanghai and 38 min in Hangzhou, respectively. Meanwhile, the three cities with the shortest commuting times at less than 18 min are also located in East China: Haikou, Qingdao, and Nanjing. For the average travel time during the whole week, in Shenzhen it is 55 min, which is the longest time among all case cities, followed by Shanghai, Hangzhou and Chengdu, with times of more than 40 min. It is noted that in Urumchi, the average travel time per week is 5 min less than on workdays, while it is over 18 min less than in Beijing, which partially signifies the different intensities of leisure activities between the two cities.
The most common commuting mode choice for urban residents is shown in Figure 4. The public transport modes, including bus, subway and light rail have the highest frequency of usage, and the average utilization rate is 43.69%. In Shenzhen this rate is 79.69%, which is the highest amongst all cities. Even in Shijiazhuang, the city with the lowest utilization rate, use is above 20%.
The second most common commuting mode choice following public transport is the private car, and its average usage ratio is 22.58%. The highest usage ratio is 36.11% in Hangzhou, a core city located at southern Yangtze River Delta in China. The lowest usage ratio is in the mountainous city Chongqing, where only 10.00% urban residents prefer motoring as a common commuting mode.
The average ratios of walking and cycling are 15.37% and 8.39%, respectively. In Guiyang, 46.88% residents prefer walking as a common commuting mode; while in Shijiazhuang, 23.44% residents use cycling as a common commuting mode, which is the highest figure in all the case cities. Additionally, the average usage ratios of the autocycle and the other means of transportation are 7.91% and 2.43%, respectively.
The correlation analysis results between the commuting time and mode is shown in Table 2. The average daily commuting time negatively correlates with walking, cycling, and autocycle use, but positively correlates with the usage of private car and public transportation means; the most significant correlations are with walking and public transportation.
3.3. Effects of Urban form on Urban Commuting
The linear regressions between average commuting time in workdays (CTW) with NCI, GMI, BuA, PD, and RAC shown in Figure 5. Except for BuA, the CTW decreases linearly with the metrics. The linear regressions are significant between CTW and GMI (R = −0.48, p < 0.01), RAC (R = −0.41, p < 0.01), and BuA (R = 0.54, p < 0.01). In other words, the CTWs of urban residents are shorter, with a higher spatial agglomeration degree of urban construction land and road construction area per capita, but longer with a larger BuA. The most typical example is Shenzhen. This city has the lowest GMI (0.36), a lower RAC (8.63 m2/person), a relatively higher BuA (830 km2), and the longest CTW (45 min). It is worth noting that although the BuA of Nanjing is more than 600 km2, the CTW is only 18 min; this could be attributed to its high RAC and GMI, with values of 16.43 m2/person and 0.64, respectively, the second and third highest in all the case cities.
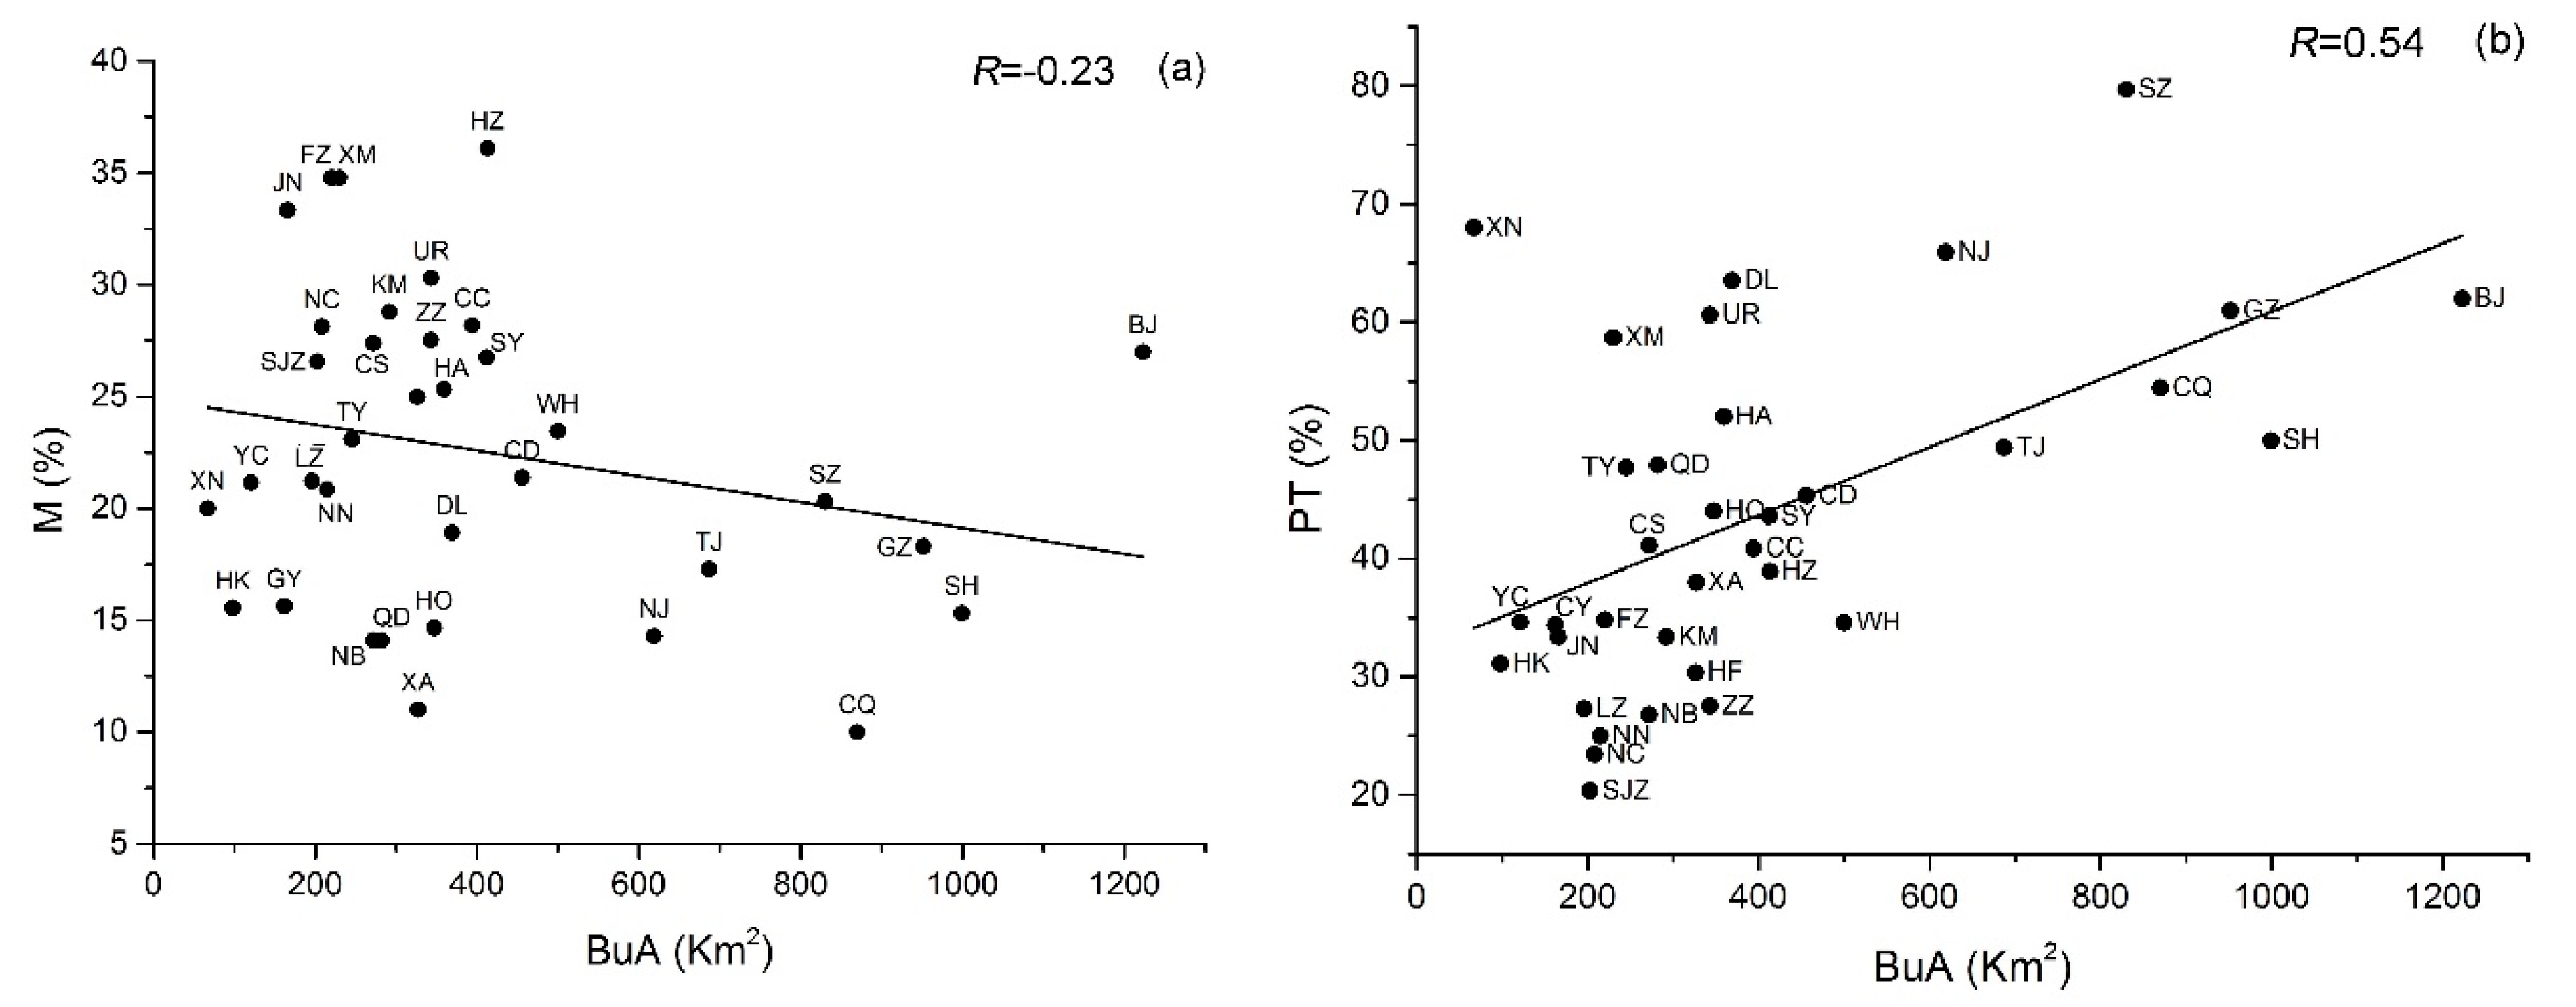
Figure 6 shows the linear regressions between the proportion of motoring (M) and public transportation (PT) with BuA in case cities. Both of the regressions are significant; for M, R = −0.23 and p < 0.05, while for PT, R = 0.54 and p < 0.01.
There is large difference in the private car usage ratio for cities with BuA distributed in the range of 200 to 400 km2. For example, Hangzhou has the highest usage of private cars at 36.11%, and the lowest is only 11.00% for the city of Xi’an. The public transport usage ratio exhibits the same features in those cities. For example, Dalian has the highest usage of public transport at 63.51%, while Shijiazhuang is the city with the lowest usage at only 20.31%.
There are no significant correlations between APT and AT with urban commuting time, and urban form metrics excluding BuA do not show significant correlations with urban commuting mode. In addition, the relationship between the average daily travel time of whole week and urban form metrics is similar as that of the weekday.
4. Discussion
4.1. Regional Differences in Urban Form
Urban form is the combined result of natural, social, and economic factors. In turn, the spatial form of a specific city will exert feedback on its sustainability in economy, society and environment. Our results confirmed that there exist certain differences in urban form characteristics in East, Central and West China (Table 1). The spatial forms of the cities in East China, one of the most developed regions in China, are featured by the dispersed, scattered or leap-frogging kind of development patterns, according to the quantity of NCI, GMI, BuA and remote sensing data. Since the late 1970s, rapid urbanization (from 17.92% in 1978 to 54.77% in 2014) has been witnessed in China [56]. The expansion of urban space in China followed a large-scale, low-density, fragmented and discontinued spatial sprawl pattern with significantly different mechanisms compared with the western developed countries [57]. During this round of rapid industrialization and urbanization, the urban land in eastern cities expanded much faster than the cities in Central and West China [58]. Much of the fragmentation at the urban fringes, especially for the eastern cities, could be attributed to the newly established satellite cities around the central city and a series of urban expansion programs, e.g., high-tech development zone, high-tech park and large shopping plaza, which had emerged on a large scale in many cities in China. This kind of disordered urban spatial expansion has caused dispersed urban form and negative consequences, such as inefficient use of land, traffic jams, and an encroached suburban green belt [59,60].
Although the spatial extents expanded greatly, the urban populations in eastern cities still maintain a relatively high density (Table 1). Due to a great number of migrants from Central and West China and the rural areas around the cities in the past decades, the urban population in eastern cities has experienced a dramatic increase [61,62]. The surging population has put a lot of pressure on urban infrastructure and public service facilities, especially traffic. Despite this, the availability of public transport vehicles and the levels of paved-road construction in eastern cities are still at high levels (the proportion of public transport vehicles is the highest and the level of paved-road construction is the second-highest of the studied cities). This is obviously correlated with local economic development.
4.2. High-Efficient and Low-Carbon Travel Pattern
The significant urban sprawl state of the eastern cities is verified by the highest mean BuA, and lowest NCI and GMI. Considering CTW of urban residents, this is 3–4 min longer in the eastern cities than in the western and central cities (Figure 3). This suggests that the dispersed (scattered) pattern of construction land development pattern at urban scale is associated with low efficiency of commuting. The results of regression analysis further showed that the relatively smaller built-up area and higher urban spatial agglomeration degree would decrease the commuting time of urban residents in case cities (Figure 5). In other words, compact urban form could improve urban commuting efficiency.
However, NCI does not show significant relationship with urban commuting time. It is noted that the cities located at the lower left corner in Figure 5a, e.g., Nanjing, Haikou, Guiyang and Qingdao, with relative lower NCI and CTW values, are featured by either a relatively higher spatial agglomeration degree (e.g., Nanjing and Guiyang), smaller urban BuA (e.g., Haikou and Qingdao), or more paved road area per person (e.g., Nanjing and Qingdao). Actually, limited by the nature of metrics of compactness we adopted, NCI utilizes the spatial distances between each grid (individual settlement areas) to assess the dispersion degree of the whole city but not the specific home–work distance, which might be more important, as some researchers argue [63,64]. We argued that urban spatial form metrics, e.g., NCI, could not well explain the causes of urban commuting time solely, and it is necessary to combine it with other urban metrics for understanding the complicated contributors to urban commuting time.
Meanwhile, we found that PD at urban scale does not have significant effect on commuting time in case cities, which is inconsistent with the general point of view that urban population density is negatively correlated with the CWT [18,19]. As we mentioned above, high urban density and dispersed urban development are concurrent in eastern cities, which inevitably increases the complexity in this problem.
The choice of any specific kind of commuting mode is the outcome of balance between efficiency and convenience. The travel time by means of the private car seems more likely to be impacted by the traffic conditions. China’s urban population and construction areas expanded quickly in recent years, which have caused an explosive demand for car ownership and consequently, traffic jams [65]. Interestingly, our results showed that the car usage rate is negatively correlated with urban BuA. In contrast, urban construction land expansion-induced longer travel distances will usually result more private car usage, especially in North America [66]. Additionally, there is large difference in private car usage ratio in the case cities, with BuAs ranging from 200 to 400 km2. It would be beneficial to understand this phenomenon in traffic mode preferences by jointly considering traffic conditions and socioeconomic factors [67,68].
In our study, the most common commuting mode is public transportation, due to its stable commuting time (Figure 4). We also found that the most part of the public transport choices of urban residents are significantly associated with larger built-up areas (Figure 6), and are positively correlated with longer commuting times (Table 2), which might suggest the need for provision and promotion of facilities for a high-quality public transport system. However, we checked the subway mileages for the cities involved in this study up to the middle of 2016 (the mileage of light rail system is included), and found that only 6 cities’ subway mileages were above 200 km (Table 3). Considering the huge populations and large urban areas for most of the case cities, the subway (light rail) systems to date are still far from sufficient, although the developing speed is quite quick. Therefore, it is important for this development to reach wider Chinese cities and regions to maintain equal economic distribution across the nation.
Although per capita car ownership and average energy consumption in China are still lower than in Europe and North America, it has brought enormous pressure and challenges to the sustainable development for Chinese large cities and megacities. The provision and promotion of facilities for low-carbon travel modes, such as high-quality public transport systems, should be regarded as key influential factors in the urban resident’s travel mode choice in low carbon city construction practices in China.
4.3. Limitations and Future Work
In this study, we applied remote sensing data to extract the urban construction land for all the case cities. However, it is noteworthy that cross sectional remote sensing data cannot well inform the properties of land use in urban areas, e.g., the population density and 3D volumes of the buildings. For densely populated cities, the population density (building volumes) might differ greatly from the center to the suburbs, so it might be more reasonable to combine the population density (building volumes) at each parcel as a weight factor when calculating the urban form metrics, e.g., the urban compactness index.
The commuting pattern of local urban residents in the case cites was collected by questionnaire survey. Due to the limited registered questionnaire in each case city, there might exist relative large variations in commuting pattern data. For the case cities in each region, i.e., Eastern, Central and Western China, the commuting patterns may also have large differences due to the varied socio-economic status and supply of urban infrastructure. Therefore, the commuting pattern showed in this study is not suitable for a horizontal comparison, and it can only be used as a general reference to illustrate the coupling relationship between urban form and urban commuting in the case cities in China.
Our results showed some empirical correlationships between urban form and urban commuting pattern in the case cities. Further, it would be a beneficial attempt to correlate the specific commuting pattern with a carbon dioxide emission index in the study of urban form and sustainable transportation, and then to correlate this index with the proposed urban form metrics.
5. Conclusions
Due to the increasingly problematic environmental and social problems in large cities in China, sustainable urban development strategies have received a great deal of attention. This study aimed to explore the relationship between urban form and urban travel patterns, which remains far from clear, despite broad research efforts in this area.
In this study, we used satellite images and statistical data to calculate representative urban form metrics of 35 Chinese large cities and megacities; we also carried out a questionnaire campaign in case cities focused on travel time and mode of local urban residents. We analyzed the urban form metrics and travel patterns for all the case cities, and empirically examined whether compact urban form is associated with high-efficient and low-carbon travel pattern. We found that dispersed urban development pattern plays a significant role in increasing travel time, while cities with larger built-up areas usually have more public transport but a lower ratio of motoring. The results also show that there is no statistically significant relationship between population density and travel patterns at an urban scale.
This study could provide some empirical insights into sustainable urban form planning and transportation development. Further studies should take more causal socioeconomic factors into analysis, and might also benefit from a more refined classification of urban land use.
Acknowledgments
This research is supported by Natural Science Foundation of Zhejiang Province, China (No. LQ13C030007) and the National Natural Science Foundation of China (No. 41301484). We would also like to thank the financial support of China Scholarship Council (CSC) for collaborative research at Purdue University.
Author Contributions
Xiaodong Song and Yu Song conceived and designed the framework of the research structure; Yu Song and Yong Liu analyzed the data and drafted the initial manuscript; Guofan Shao and Xiaodong Song reviewed and revised on the manuscript; Lei Pan and Hong Ye commented on the manuscript.
Conflicts of Interest
The authors declare no conflict of interest.
References
- Burton, E.; Jenks, M.; Williams, K. Achieving Sustainable Urban Form; Routledge: Abingdon, UK, 2013. [Google Scholar]
- Ye, H.; He, X.Y.; Song, Y.; Li, X.H.; Zhang, G.Q.; Lin, T.; Xiao, L.S. A sustainable urban form: The challenges of compactness from the viewpoint of energy consumption and carbon emission. Energy Build. 2015, 93, 90–98. [Google Scholar] [CrossRef]
- Lee, S.; Lee, B. The influence of urban form on GHG emissions in the us household sector. Energy Policy 2014, 68, 534–549. [Google Scholar] [CrossRef]
- Aditjandra, P.T. The impact of urban development patterns on travel behaviour: Lessons learned from a british metropolitan region using macro-analysis and micro-analysis in addressing the sustainability agenda. Res. Transp. Bus. Manag. 2013, 7, 69–80. [Google Scholar] [CrossRef]
- Frumkin, H. Urban sprawl and public health. Public Health Rep. 2002, 117, 201. [Google Scholar] [CrossRef]
- Jabareen, Y.R. Sustainable urban forms their typologies, models, and concepts. J. Plan. Educ. Res. 2006, 26, 38–52. [Google Scholar] [CrossRef]
- Bontje, M. A ‘planner’s paradise’ lost? Past, present and future of dutch national urbanization policy. Eur. Urban Reg. Stud. 2003, 10, 135–151. [Google Scholar] [CrossRef]
- Giuliano, G.; Narayan, D. Another look at travel patterns and urban form: The US and Great Britain. Urban Stud. 2003, 40, 2295–2312. [Google Scholar] [CrossRef]
- Nakamura, K.; Hayashi, Y. Strategies and instruments for low-carbon urban transport: An international review on trends and effects. Transp. Policy 2013, 29, 264–274. [Google Scholar] [CrossRef]
- Durand, C.P.; Andalib, M.; Dunton, G.F.; Wolch, J.; Pentz, M.A. A systematic review of built environment factors related to physical activity and obesity risk: Implications for smart growth urban planning. Obes. Rev. 2011, 12, e173–e182. [Google Scholar] [CrossRef] [PubMed]
- Saelens, B.E.; Sallis, J.F.; Frank, L.D. Environmental correlates of walking and cycling: Findings from the transportation, urban design, and planning literatures. Ann. Behav. Med. 2003, 25, 80–91. [Google Scholar] [CrossRef] [PubMed]
- Woodcock, J.; Edwards, P.; Tonne, C.; Armstrong, B.G.; Ashiru, O.; Banister, D.; Beevers, S.; Chalabi, Z.; Chowdhury, Z.; Cohen, A. Public health benefits of strategies to reduce greenhouse-gas emissions: Urban land transport. Lancet 2009, 374, 1930–1943. [Google Scholar] [CrossRef]
- Burgess, R.; Jenks, M. Compact Cities: Sustainable Urban Forms for Developing Countries; Routledge: London, UK, 2002. [Google Scholar]
- Handy, S. Smart growth and the transportation-land use connection: What does the research tell us? Int. Reg. Sci. Rev. 2005, 28, 146–167. [Google Scholar] [CrossRef]
- Boussauw, K.; Neutens, T.; Witlox, F. Relationship between spatial proximity and travel-to-work distance: The effect of the compact city. Reg. Stud. 2012, 46, 687–706. [Google Scholar] [CrossRef]
- Cervero, R.; Kockelman, K. Travel demand and the 3ds: Density, diversity, and design. Transp. Res. Part D Transp. Environ. 1997, 2, 199–219. [Google Scholar] [CrossRef]
- Zhao, J.; Xiao, L.; Tang, L.; Shi, L.; Su, X.; Wang, H.; Song, Y.; Shao, G. Effects of spatial form on urban commute for major cities in China. Int. J. Sustain. Dev. World Ecol. 2014, 21, 361–368. [Google Scholar] [CrossRef]
- Banister, D. Unsustainable Transport: City Transport in the New Century; Taylor & Francis: Abingdon, UK, 2005; pp. 102–106. [Google Scholar]
- Frank, L.D.; Pivo, G. Impacts of mixed use and density on utilization of three modes of travel: Single-occupant vehicle, transit, and walking. Transp. Res. Rec. 1994, 1466, 44–52. [Google Scholar]
- Lee, C.; Moudon, A.V. The 3Ds + R: Quantifying land use and urban form correlates of walking. Transp. Res. Part D Transp. Environ. 2006, 11, 204–215. [Google Scholar] [CrossRef]
- Clark, B.; Chatterjee, K.; Melia, S. Changes to commute mode: The role of life events, spatial context and environmental attitude. Transp. Res. Part A Policy Pract. 2016, 89, 89–105. [Google Scholar] [CrossRef]
- Zhao, P. The impact of the built environment on bicycle commuting: Evidence from Beijing. Urban Stud. 2014, 51, 1019–1037. [Google Scholar] [CrossRef]
- Camagni, R.; Gibelli, M.C.; Rigamonti, P. Urban mobility and urban form: The social and environmental costs of different patterns of urban expansion. Ecol. Econ. 2002, 40, 199–216. [Google Scholar] [CrossRef]
- Milakis, D.; Cervero, R.; van Wee, B. Stay local or go regional? Urban form effects on vehicle use at different spatial scales: A theoretical concept and its application to the San Francisco Bay area. J. Transp. Land Use 2015, 8, 59–86. [Google Scholar] [CrossRef]
- Naess, P. Urban form and travel behavior: Experience from a nordic context. J. Transp. Land Use 2012, 5, 21–45. [Google Scholar] [CrossRef]
- Susilo, Y.O.; Maat, K. The influence of built environment to the trends in commuting journeys in The Netherlands. Transportation 2007, 34, 589–609. [Google Scholar] [CrossRef]
- Van Acker, V.; Witlox, F. Commuting trips within tours: How is commuting related to land use? Transportation 2011, 38, 465–486. [Google Scholar] [CrossRef]
- Crane, R. The influence of urban form on travel: An interpretive review. J. Plan. Lit. 2000, 15, 3–23. [Google Scholar] [CrossRef]
- Stead, D.; Marshall, S. The relationships between urban form and travel patterns: An international review and evaluation. Eur. J. Transp. Infrastruct. Res. 2001, 1, 113–141. [Google Scholar]
- Neuman, M. The compact city fallacy. J. Plan. Educ. Res. 2005, 25, 11–26. [Google Scholar] [CrossRef]
- Yang, J.; Shen, Q.; Shen, J.; He, C. Transport impacts of clustered development in Beijing: Compact development versus overconcentration. Urban Stud. 2012, 49, 1315–1331. [Google Scholar] [CrossRef]
- Weng, Q.; Quattrochi, D.A. Urban Remote Sensing; CRC Press: Boca Raton, FL, USA, 2007. [Google Scholar]
- Yang, X. Urban Remote Sensing: Monitoring, Synthesis and Modeling in the Urban Environment; Wiley-Blackwell: Oxford, UK, 2011. [Google Scholar]
- Schneider, A.; Friedl, M.A.; Potere, D. A new map of global urban extent from modis satellite data. Environ. Res. Lett. 2009, 4, 44003–44011. [Google Scholar] [CrossRef]
- Bagan, H.; Yamagata, Y. Landsat analysis of urban growth: How tokyo became the world’s largest megacity during the last 40 years. Remote Sens. Environ. 2012, 127, 210–222. [Google Scholar] [CrossRef]
- Myint, S.W.; Gober, P.; Brazel, A.J.; Grossmanclarke, S.; Weng, Q. Per-pixel vs. Object-based classification of urban land cover extraction using high spatial resolution imagery. Remote Sens. Environ. 2011, 115, 1145–1161. [Google Scholar] [CrossRef]
- Awrangjeb, M.; Zhang, C.; Fraser, C.S. Automatic extraction of building roofs using lidar data and multispectral imagery. ISPRS J. Photogramm. Remote Sens. 2013, 83, 1–18. [Google Scholar] [CrossRef]
- Jat, M.K.; Garg, P.K.; Khare, D. Monitoring and modelling of urban sprawl using remote sensing and gis techniques. Int. J. Appl. Earth Obs. Geoinf. 2008, 10, 26–43. [Google Scholar] [CrossRef]
- Yin, J.; Yin, Z.; Zhong, H.; Xu, S.; Hu, X.; Wang, J.; Wu, J. Monitoring urban expansion and land use/land cover changes of Shanghai metropolitan area during the transitional economy (1979–2009) in China. Environ. Monit. Assess. 2011, 177, 609–621. [Google Scholar] [CrossRef] [PubMed]
- Huang, J.; Lu, X.X.; Sellers, J.M. A global comparative analysis of urban form: Applying spatial metrics and remote sensing. Landsc. Urban Plan. 2007, 82, 184–197. [Google Scholar] [CrossRef]
- U.S. Census Bureau. Qualifying Urban Areas for the 2010 Census; Notice. 2012. Available online: https://www.gpo.gov/fdsys/pkg/FR-2012-03-27/pdf/2012-6903.pdf (accessed on 30 June 2017).
- Ma, L.J.C. Urban administrative restructuring, changing scale relations and local economic development in China. Political Geogr. 2005, 24, 477–497. [Google Scholar] [CrossRef]
- Kenworthy, J.; Hu, G. Transport and urban form in Chinese cities: An international comparative and policy perspective with implications for sustainable urban transport in China. disP Plan. Rev. 2002, 38, 4–14. [Google Scholar] [CrossRef]
- Li, Y.; Wei, Y.D. The spatial-temporal hierarchy of regional inequality of China. Appl. Geogr. 2011, 30, 303–316. [Google Scholar] [CrossRef]
- Schneider, A. Monitoring land cover change in urban and peri-urban areas using dense time stacks of landsat satellite data and a data mining approach. Remote Sens. Environ. 2012, 124, 689–704. [Google Scholar] [CrossRef]
- Rozenstein, O.; Karnieli, A. Comparison of methods for land-use classification incorporating remote sensing and gis inputs. Appl. Geogr. 2011, 31, 533–544. [Google Scholar] [CrossRef]
- Wang, L.; Li, C.; Ying, Q.; Cheng, X.; Wang, X.; Li, X.; Hu, L.; Liang, L.; Yu, L.; Huang, H. China’s urban expansion from 1990 to 2010 determined with satellite remote sensing. Chin. Sci. Bull. 2012, 57, 2802–2812. [Google Scholar] [CrossRef]
- Liu, F.; Zhang, Z.; Wang, X. Forms of urban expansion of chinese municipalities and provincial capitals, 1970s–2013. Remote Sens. 2016, 8, 930. [Google Scholar] [CrossRef]
- Mering, C.; Baro, J.; Upegui, E. Retrieving urban areas on google earth images: Application to towns of west Africa. Int. J. Remote Sens. 2010, 31, 5867–5877. [Google Scholar] [CrossRef]
- Thinh, N.X.; Arlt, G.; Heber, B.; Hennersdorf, J.; Lehmann, I. Evaluation of urban land-use structures with a view to sustainable development. Environ. Impact Assess. Rev. 2002, 22, 475–492. [Google Scholar] [CrossRef]
- Getis, A.; Ord, J.K. The analysis of spatial association by use of distance statistics. Geogr. Anal. 1992, 24, 189–206. [Google Scholar] [CrossRef]
- Fortin, M.-J.; Dale, M.R. Spatial Analysis: A Guide for Ecologists; Cambridge University Press: Cambridge, UK, 2005. [Google Scholar]
- Chan, K.W. The household registration system and migrant labor in China: Notes on a debate. Popul. Dev. Rev. 2010, 36, 357–364. [Google Scholar] [CrossRef] [PubMed]
- Chen, H.; Jia, B.; Lau, S. Sustainable urban form for chinese compact cities: Challenges of a rapid urbanized economy. Habitat Int. 2008, 32, 28–40. [Google Scholar] [CrossRef]
- Song, Y. Study on the Theories and Assessment Methodologies of the Compact City. Ph.D. Thesis, University of Chinese Academy of Sciences, Beijing, China, 2011. [Google Scholar]
- Guan, W.; Yao, Y.; Peng, X.; Wei, Y.; Zhang, H. The relationship of urbanization and economic growth in China based on the provincial panel data in 1978–2014. Sci. Geogr. Sin. 2016, 36, 813–819. [Google Scholar]
- Liu, J.; Liu, M.; Zhuang, D.; Zhang, Z.; Deng, X. Study on spatial pattern of land-use change in China during 1995–2000. Sci. China Ser. D Earth Sci. 2003, 46, 373–384. [Google Scholar]
- Hu, X.; Zhou, Y.; Gu, C. Dynamics of Spatial Agglomeration and Diffusion in Metropolis in Coastal China; Science Press: Beijing, China, 2000. [Google Scholar]
- Liu, Y.; Wang, L.; Long, H. Spatio-temporal analysis of land-use conversion in the eastern coastal China during 1996–2005. J. Geogr. Sci. 2008, 18, 274–282. [Google Scholar] [CrossRef]
- Yu, X.J.; Ng, C.N. Spatial and temporal dynamics of urban sprawl along two urban–rural transects: A case study of Guangzhou, China. Landsc. Urban Plan. 2007, 79, 96–109. [Google Scholar] [CrossRef]
- Zhang, K.H.; Song, S. Rural–urban migration and urbanization in China: Evidence from time-series and cross-section analyses. China Econ. Rev. 2003, 14, 386–400. [Google Scholar] [CrossRef]
- Chen, J.; Guo, F.; Wu, Y. One decade of urban housing reform in China: Urban housing price dynamics and the role of migration and urbanization, 1995–2005. Habitat Int. 2011, 35, 1–8. [Google Scholar] [CrossRef]
- Manaugh, K.; Miranda-Moreno, L.F.; El-Geneidy, A.M. The effect of neighbourhood characteristics, accessibility, home–work location, and demographics on commuting distances. Transportation 2010, 37, 627–646. [Google Scholar] [CrossRef]
- Horner, M.W. A multi-scale analysis of urban form and commuting change in a small metropolitan area (1990–2000). Ann. Reg. Sci. 2007, 41, 315–332. [Google Scholar] [CrossRef]
- Zhao, S.; Da, L.; Tang, Z.; Fang, H.; Song, K.; Fang, J. Ecological consequences of rapid urban expansion: Shanghai, China. Front. Ecol. Environ. 2006, 4, 341–346. [Google Scholar] [CrossRef]
- Newman, P.W.; Kenworthy, J.R. The land use—Transport connection: An overview. Land Use Policy 1996, 13, 1–22. [Google Scholar] [CrossRef]
- Dunphy, R.; Fisher, K. Transportation, congestion, and density: New insights. Transp. Res. Rec. J. Transp. Res. Board 1996, 1552, 89–96. [Google Scholar] [CrossRef]
- Van de Coevering, P.; Schwanen, T. Re-evaluating the impact of urban form on travel patternsin Europe and North-America. Transp. Policy 2006, 13, 229–239. [Google Scholar] [CrossRef]
Figure 1.
Location of the 35 case cities in China. Note: for Chongqing city, the urban area includes the districts of Yuzhong, Dadukou, Jiangbei, Shapingba, Jiulongpo, Nan’an, Beibei, Yubei, and Banan. For Wuhan city, Caidian district, Jiangxia district, Huangpi district and Xinzhou district are excluded due to lack of statistical data. For Zhengzhou city, Shangjie district is excluded as an urban enclave. For Shijiazhuang city, Jiangxingkuang district is excluded as an urban enclave.
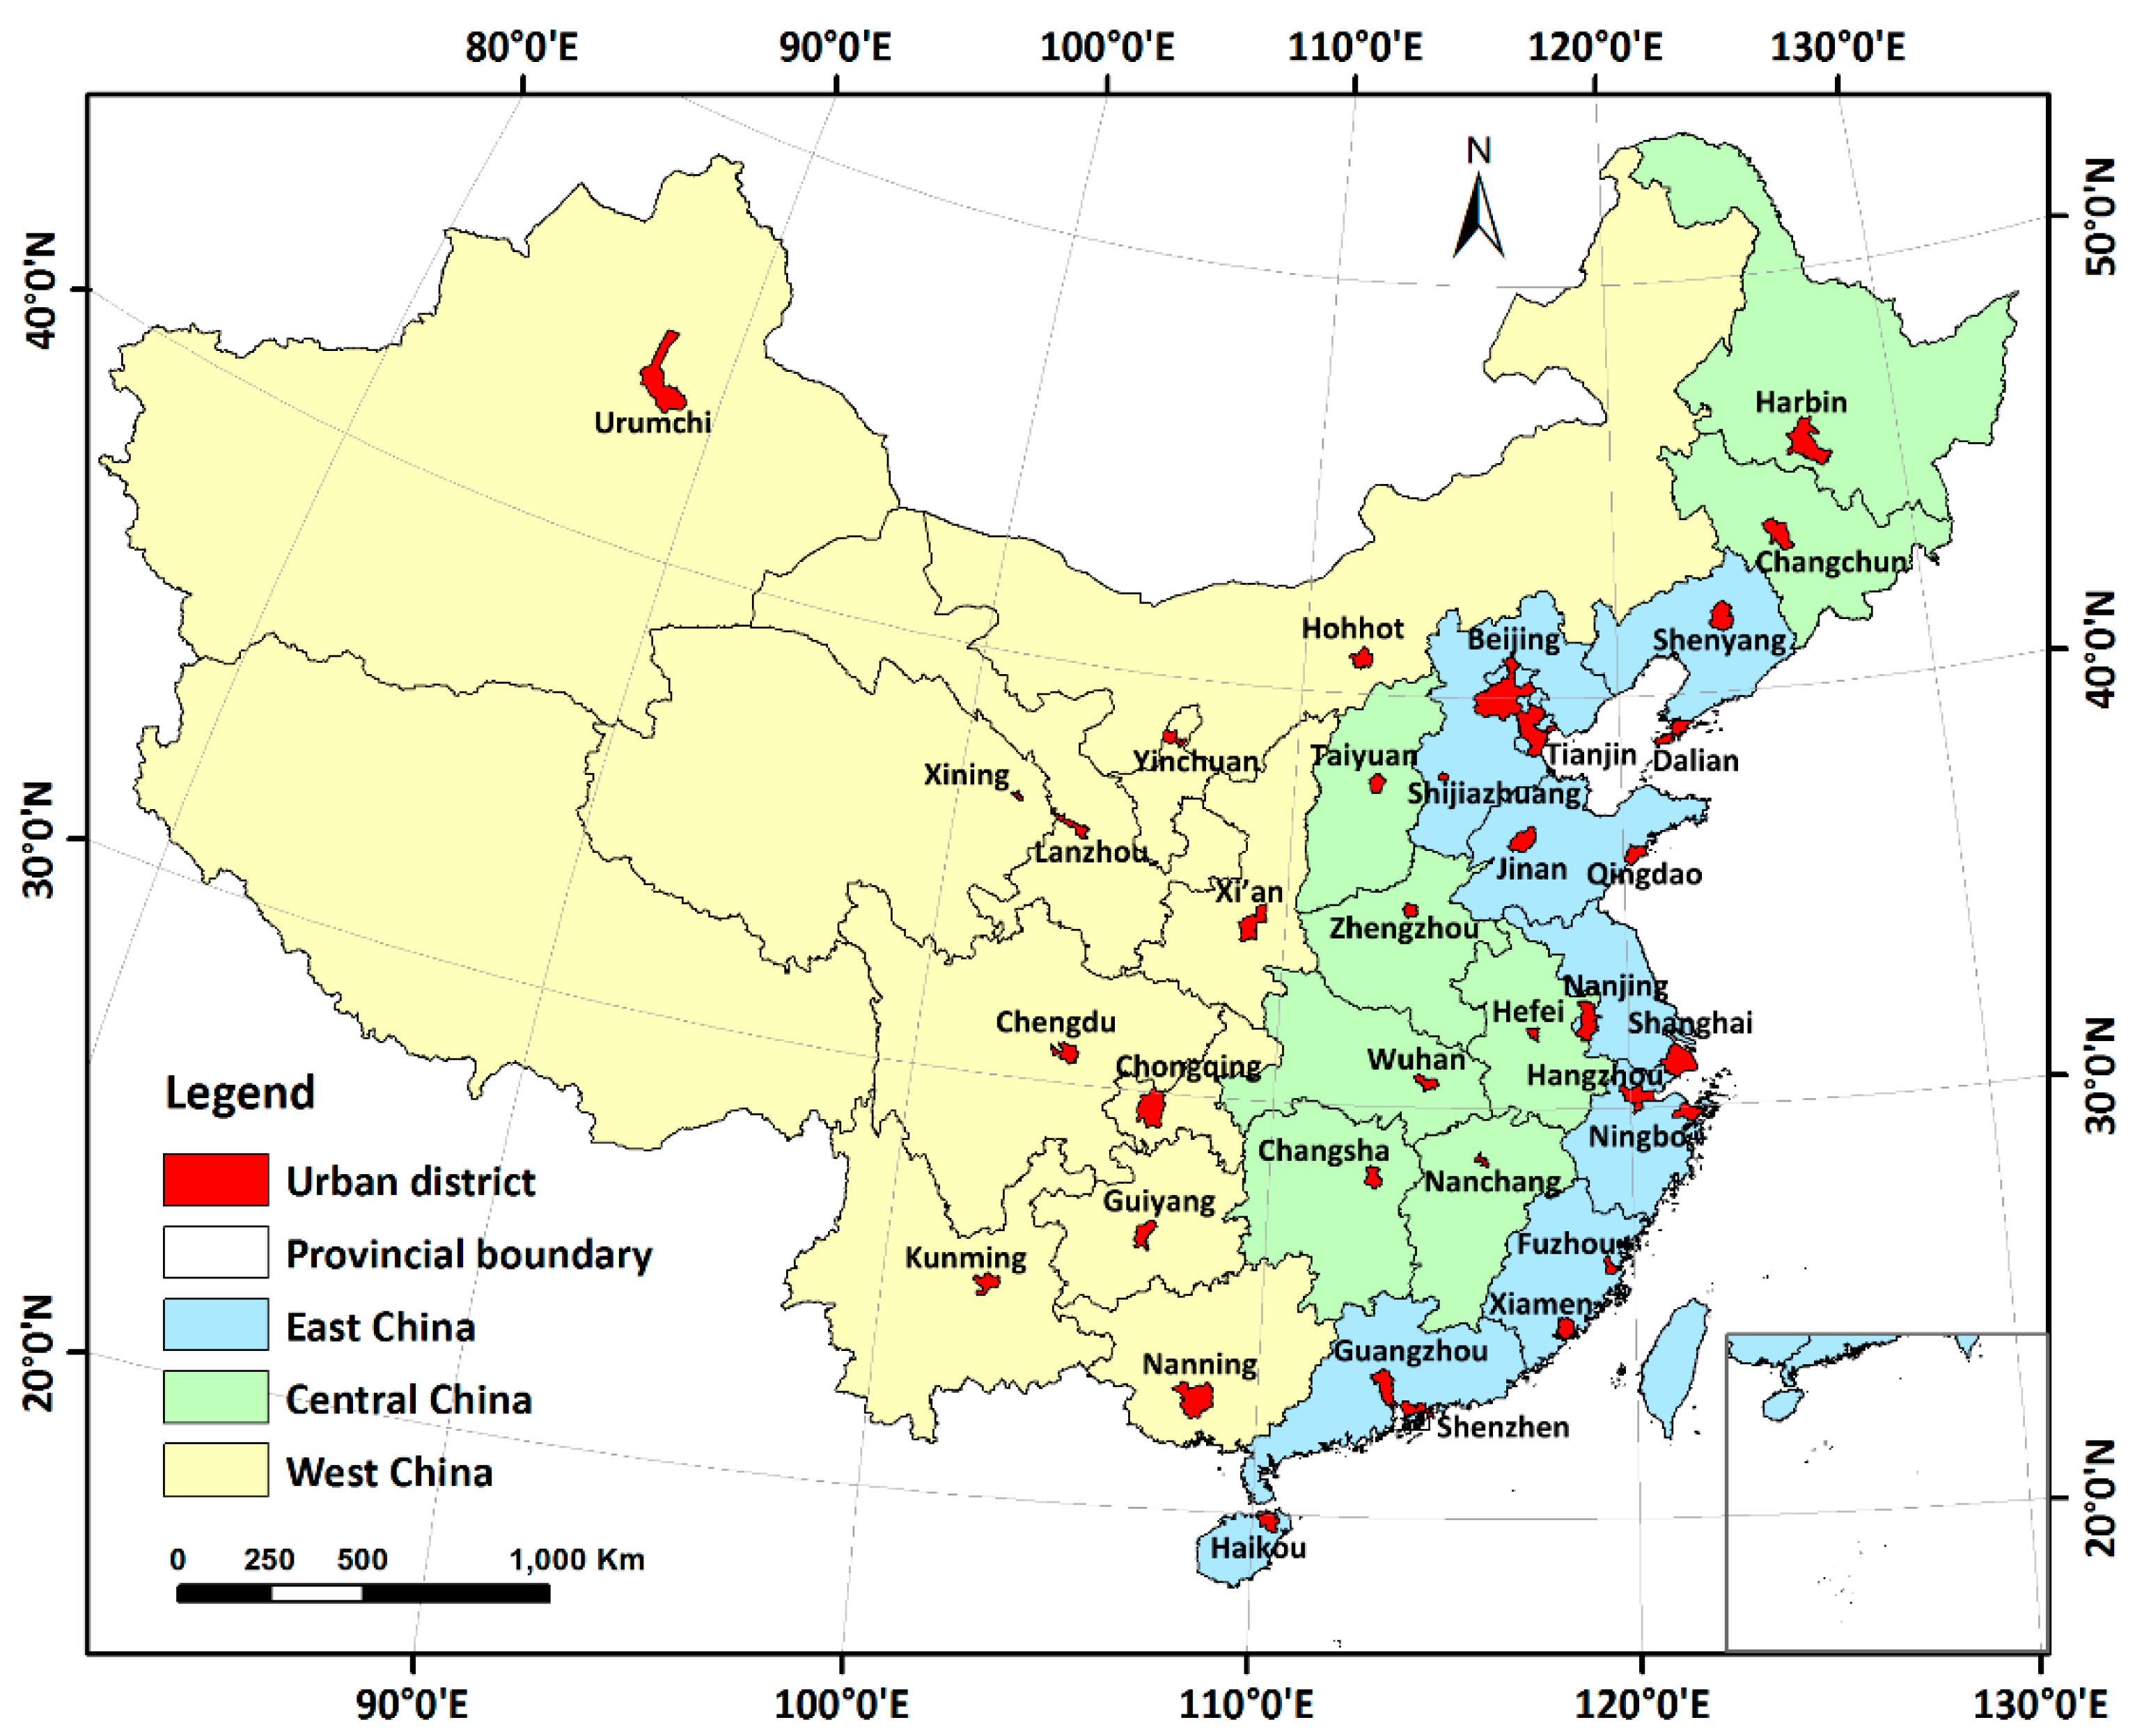
Figure 2.
An example of urban construction land interpretation for Beijing City in the 2010s based on Landsat TM imagery. (a) The Landsat TM image and interpreted urban built-up area of Beijing City in 2010; and (b) the technical flow chart of the interpretation.
Figure 2.
An example of urban construction land interpretation for Beijing City in the 2010s based on Landsat TM imagery. (a) The Landsat TM image and interpreted urban built-up area of Beijing City in 2010; and (b) the technical flow chart of the interpretation.

Figure 3.
The average daily commuting time and the average daily travel time over the whole week for the 35 case cities. The time shown in this figure is normalized by the average daily commuting time.
Figure 3.
The average daily commuting time and the average daily travel time over the whole week for the 35 case cities. The time shown in this figure is normalized by the average daily commuting time.

Figure 4.
The most common commuting mode choices of urban residents.
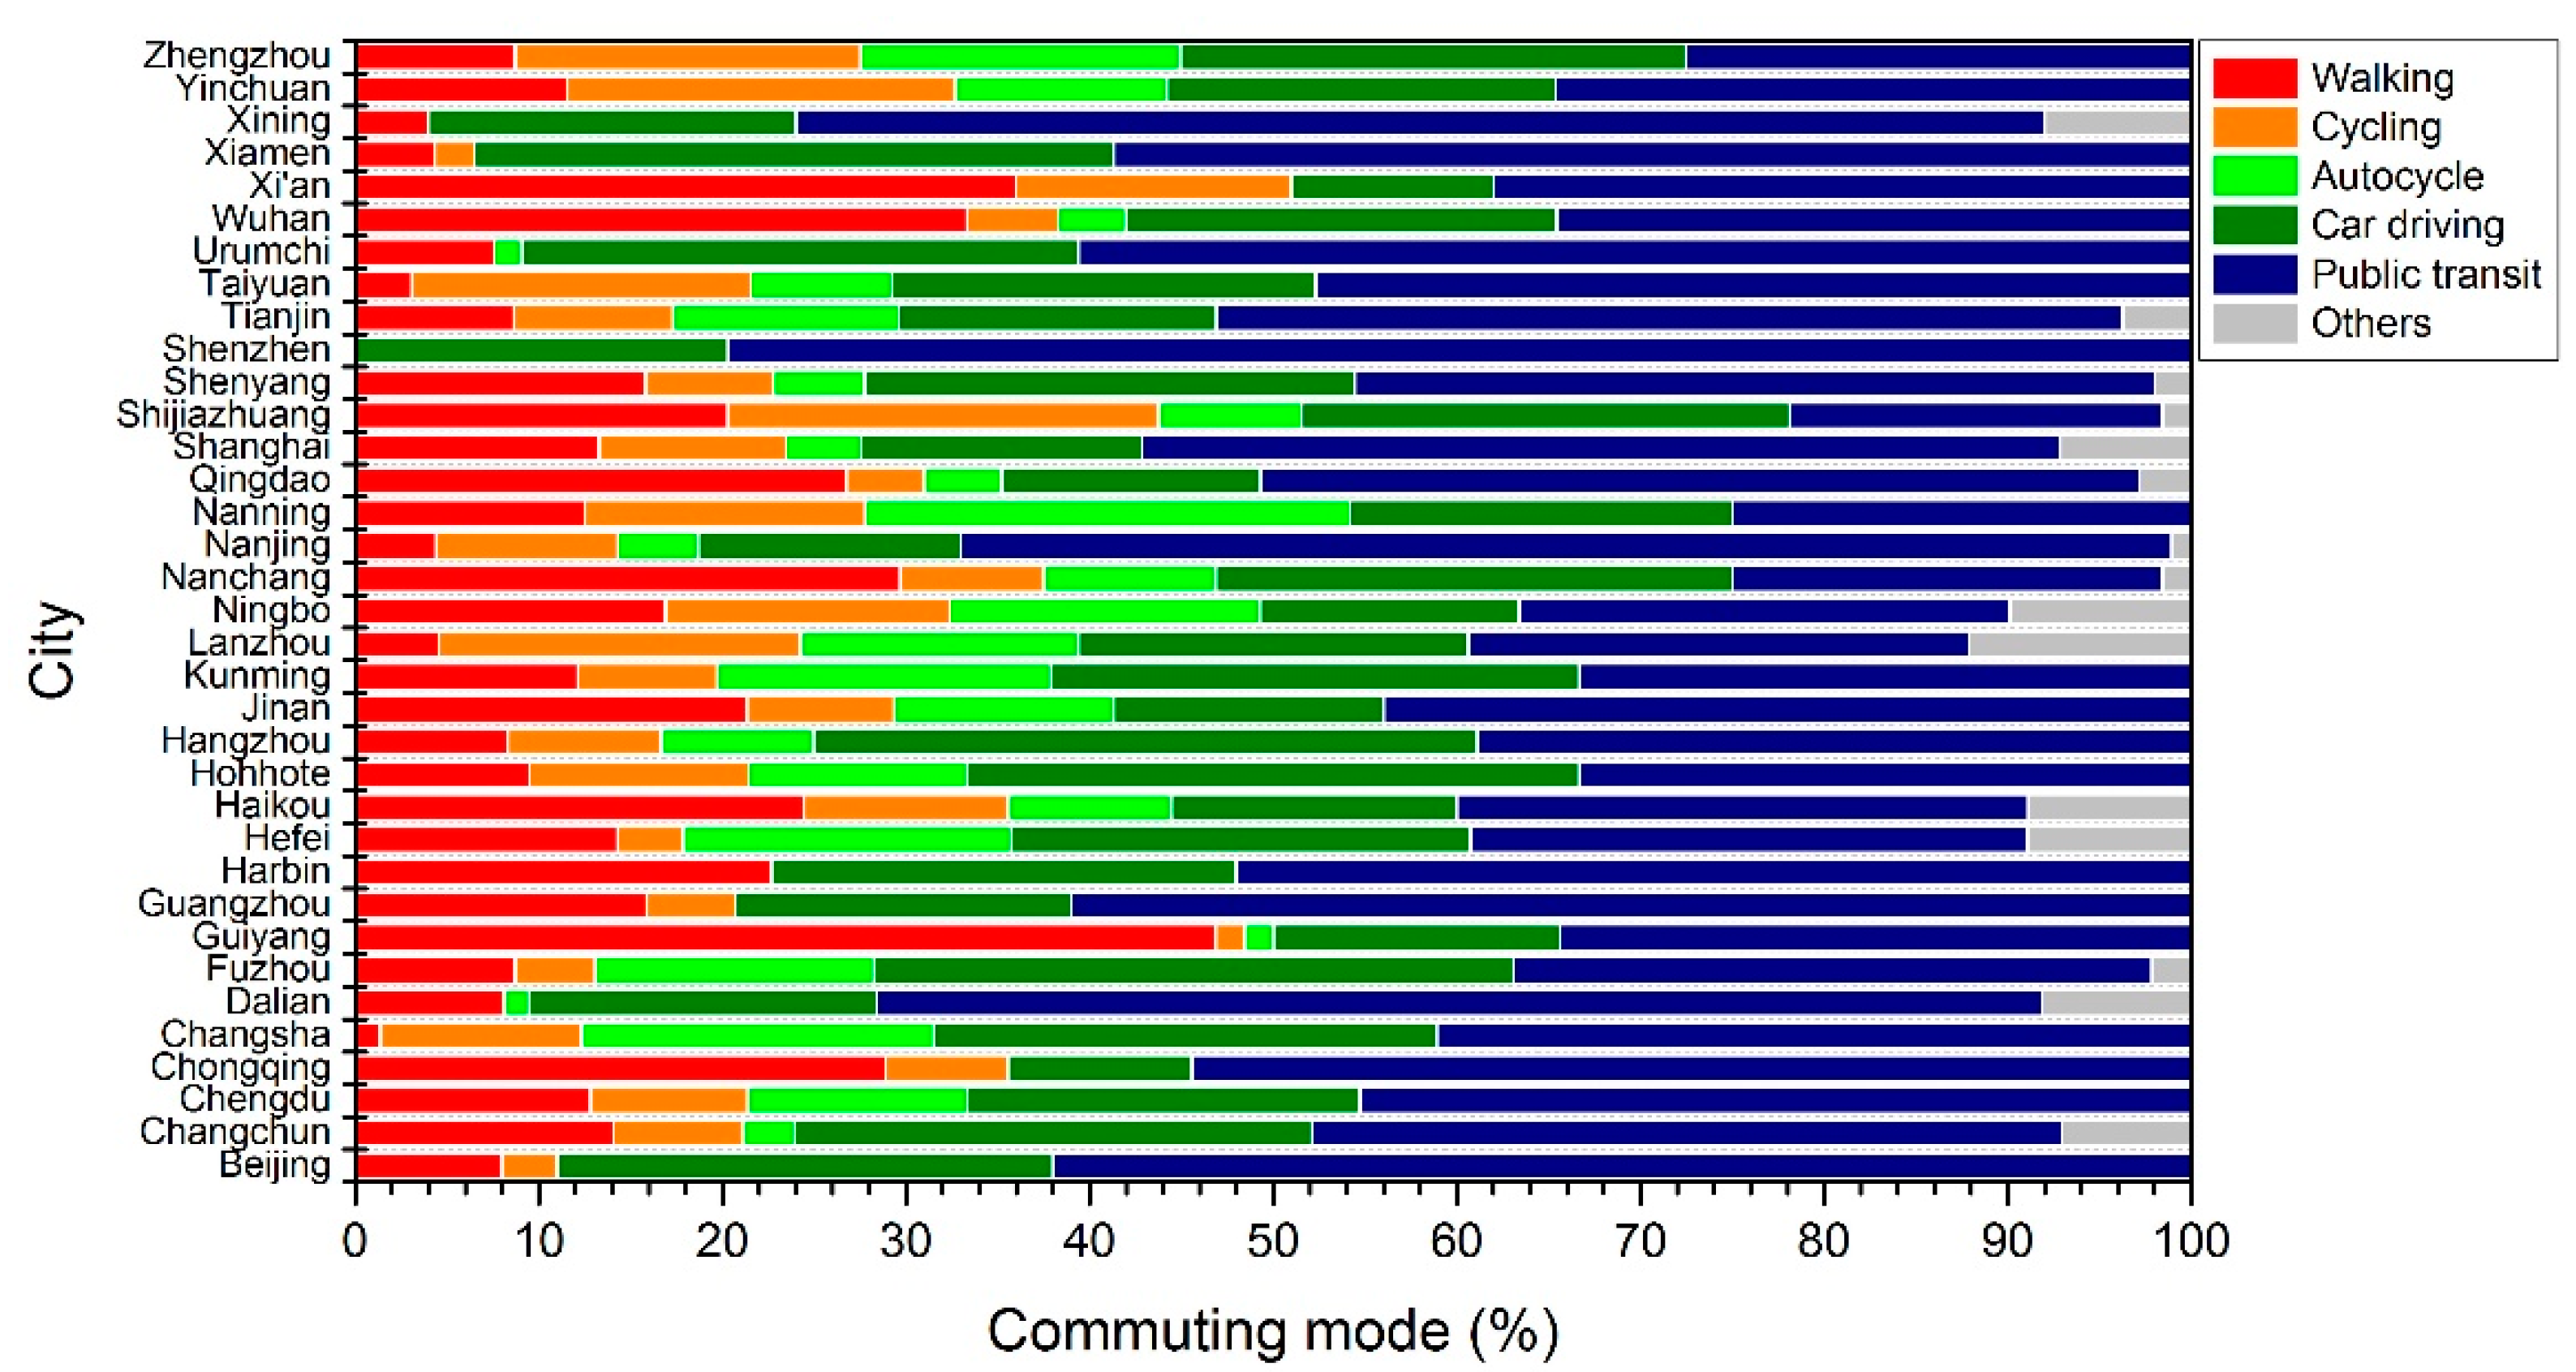
Figure 5.
The relationship between the average commuting time in workdays (CTW) and (a) normalized compactness index (NCI), (b) global Moran’s I (GMI), (c) built-up area (BuA), (d) population density (PD), and (e) road area per capita (RAC). (BJ: Beijing; CC: Changchun; CS: Changsha; CD-Chengdu; DL: Dalian; FZ: Fuzhou; GZ: Guangzhou; GY: Guiyang; HA: Harbin; HK: Haikou; HZ: Hangzhou; HF: Hefei; HO: Hohhote; JN: Jinan; KM: Kunming; LZ: Lanzhou; NC: Nanchang; NJ: Nanjing; NN: Nanning; NB: Ningbo; QD: Qingdao; SH: Shanghai; SZ: Shenzhen; SY: Shenyang; SJZ: Shijiazhuang; TY: Taiyuan; TJ: Tianjin; UR: Urumchi; WH: Wuhan; XA: Xi’an; XN: Xining; XM: Xiamen; YC: Yinchuan; ZZ: Zhengzhou; CQ: Chongqing, the same hereinafter. Note: the city of Shanghai represented by empty dot is excluded due to its extremely high population density).
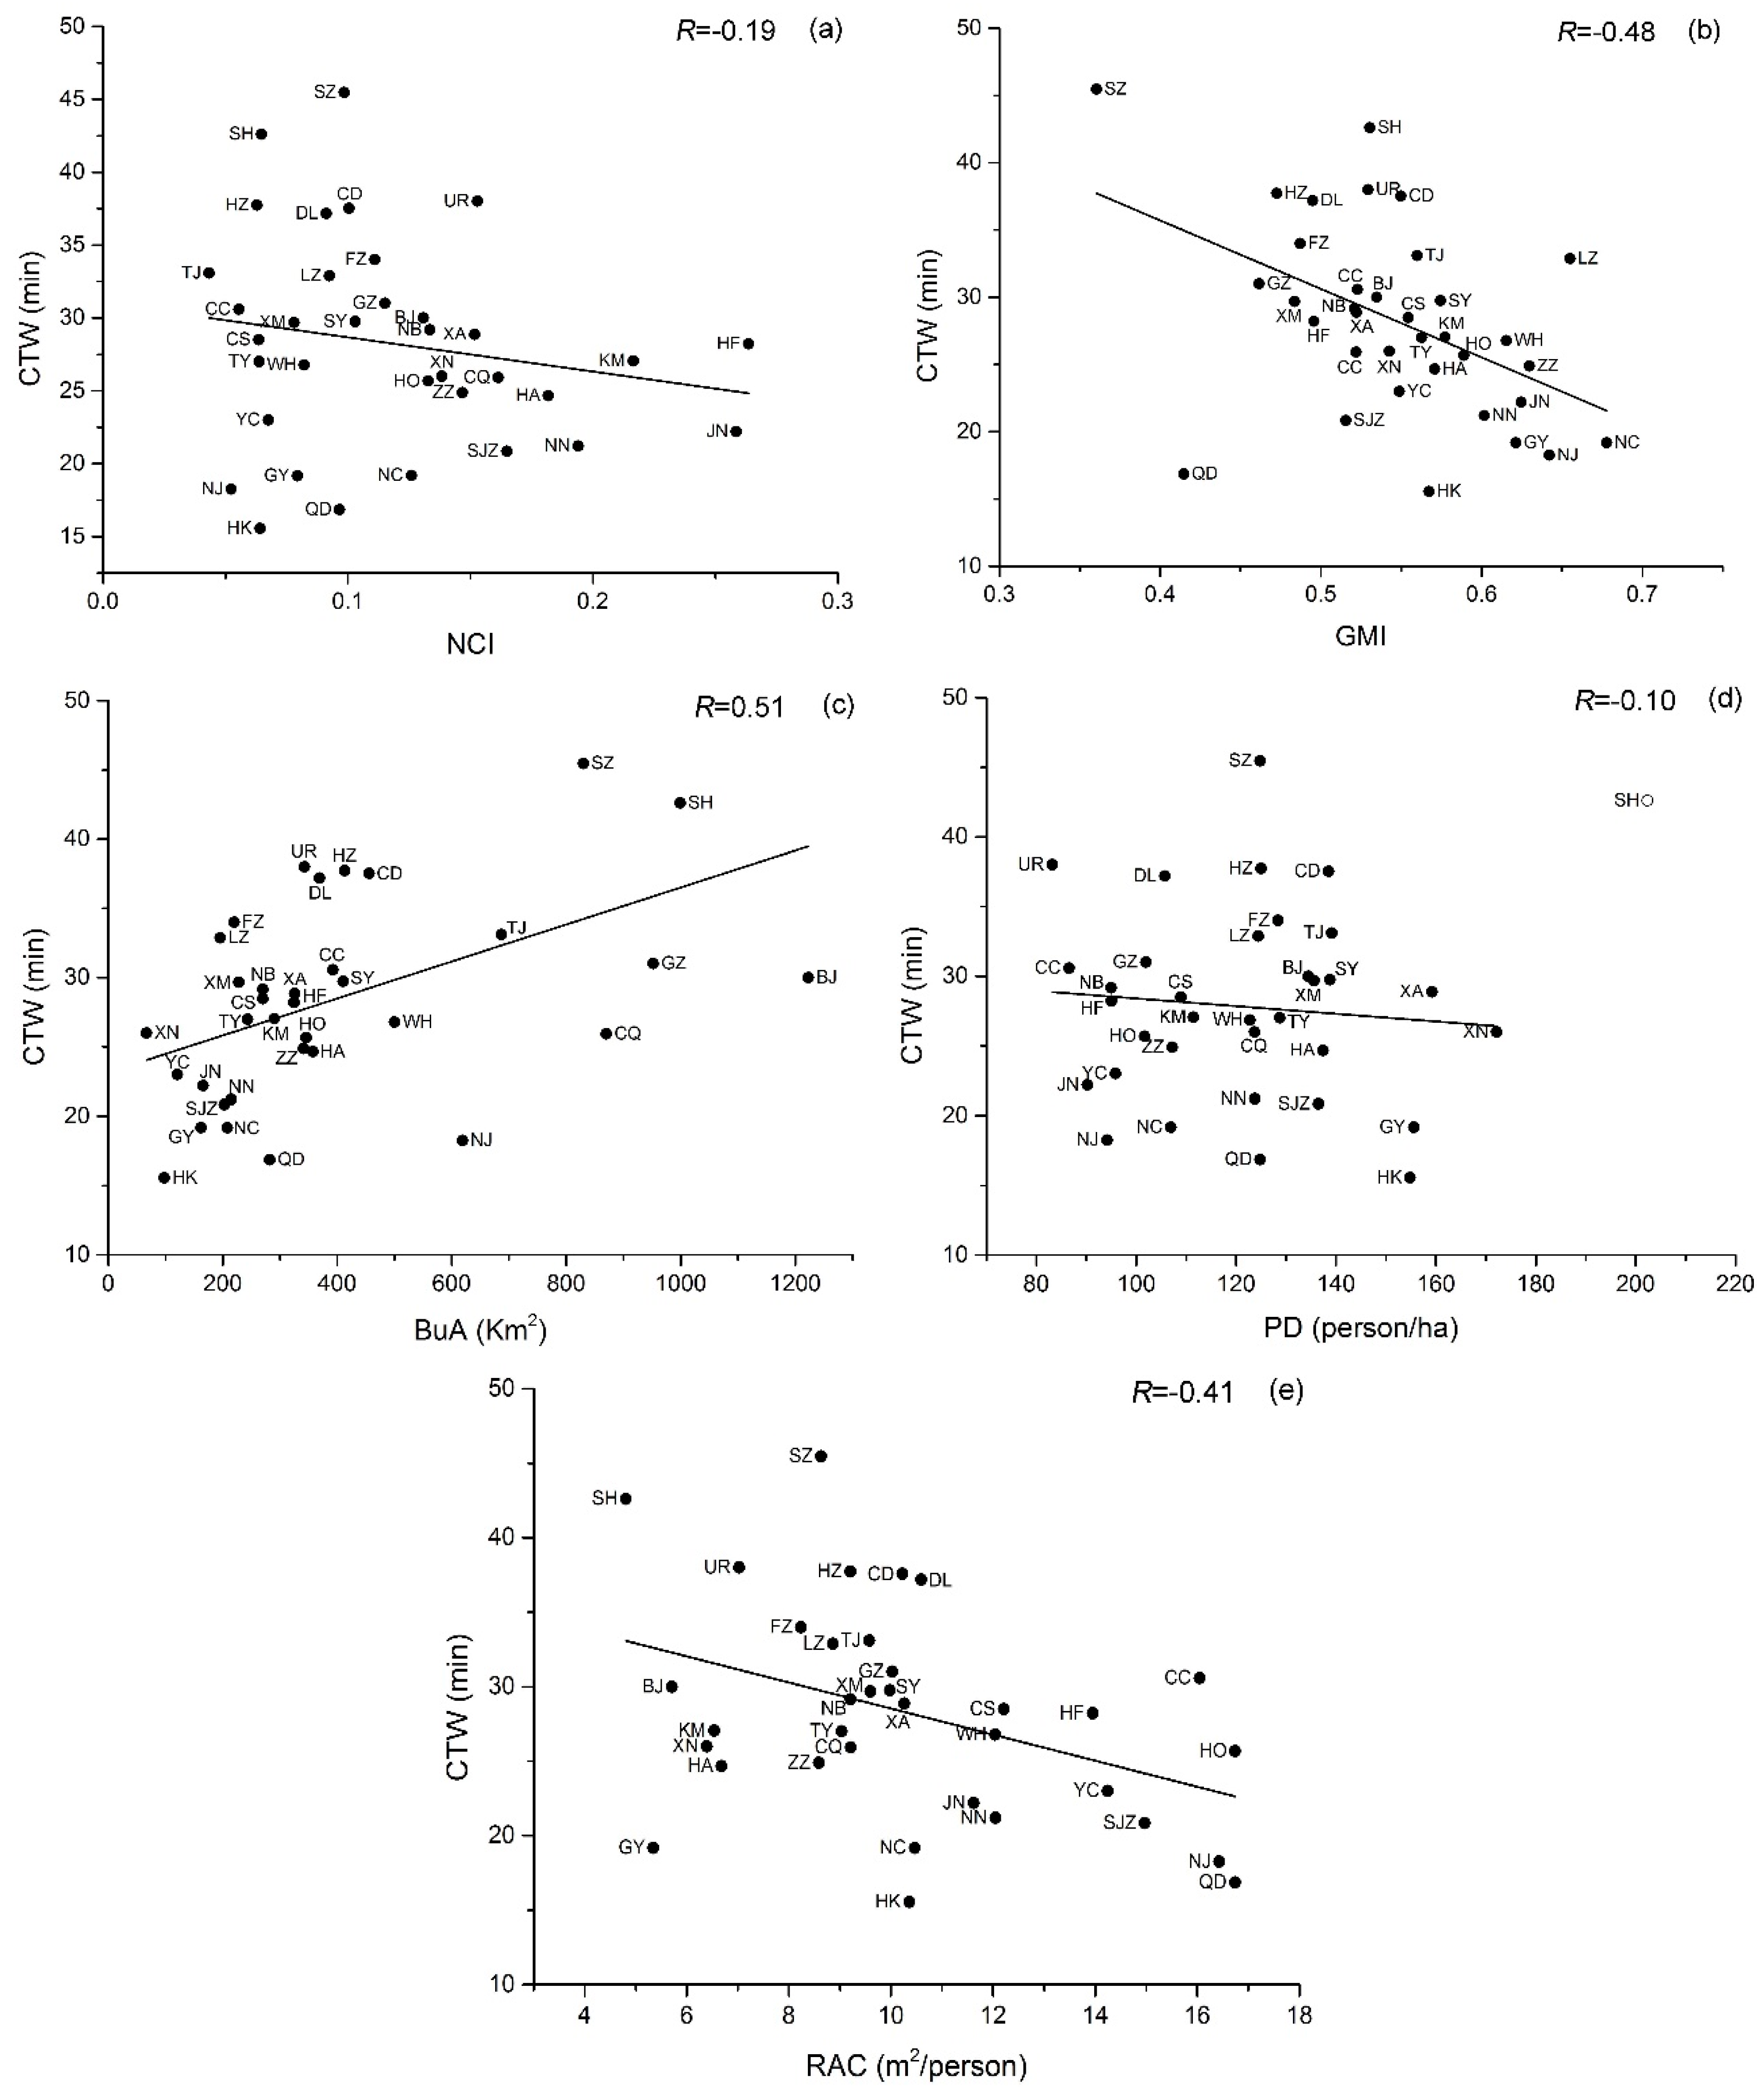
Figure 6.
The relationship between the Built-up area (BuA) with (a) proportion of motoring (M), and (b) public transportation (PT).
Figure 6.
The relationship between the Built-up area (BuA) with (a) proportion of motoring (M), and (b) public transportation (PT).

Table 1.
Values of the metrics of urban form for the case cities.
| Indicator 1 | Maximum | Minimum | Mean (std.) | ||||||
|---|---|---|---|---|---|---|---|---|---|
| East | Central | West | East | Central | West | East | Central | West | |
| NCI (-) | 0.165 | 0.265 | 0.259 | 0.043 | 0.055 | 0.067 | 0.096 (0.034) | 0.123 (0.073) | 0.147 (0.060) |
| GMI 2 (-) | 0.642 | 0.678 | 0.655 | 0.360 | 0.496 | 0.522 | 0.513 (0.069) | 0.579 (0.059) | 0.572 (0.047) |
| BuA (km2) | 1223 | 500 | 870 | 98 | 208 | 67 | 510 (336) | 331 (92) | 292 (222) |
| PD (person/ha) | 202 | 137 | 172 | 94 | 87 | 83 | 128 (27) | 112 (17) | 125 (29) |
| RAC (m2/person) | 16.745 | 16.047 | 14.248 | 4.809 | 6.681 | 5.349 | 10.678 (3.670) | 11.127 (3.052) | 9.253 (2.761) |
| APT (vehicles/104 person) | 26 | 13 | 17 | 7 | 7 | 7 | 12 (4) | 11 (2) | 12 (3) |
| AT (vehicles/104 person) | 41 | 50 | 48 | 14 | 18 | 13 | 23 (8) | 28 (10) | 27 (12) |
1 Data sources: Landsat TM, China City Statistical Yearbook (2011), and the Sixth National Population Census of the People’s Republic of China (2010 Chinese Census). 2 z-score > 2.58, p-value < 0.01. NCI: normalized compactness index; GMI: global Moran’s I; BuA: built-up area; PD: population density; APT: availability of public transportation; AT: availability of taxi.
Table 2.
Correlation analysis between urban resident daily commuting time and the proportions for the most common commuting modes.
Table 2.
Correlation analysis between urban resident daily commuting time and the proportions for the most common commuting modes.
| Public Transit | Car | Walking | Cycling | Autocycle | |
|---|---|---|---|---|---|
| Average daily commuting time | 0.461 * | 0.325 | −0.433 * | −0.356 | −0.168 |
| N | 35 | 35 | 35 | 35 | 35 |
* Correlation is significant at the 0.05 level (two-tailed).
Table 3.
Subway mileage of part of the case cities in this study up to the middle of 2016.
| City | Subway Mileage (km) | City | Subway Mileage (km) |
|---|---|---|---|
| Shanghai | 650 | Changsha | 69 |
| Beijing | 554 | Kunming | 60 |
| Guangzhou | 266 | Changchun | 60 |
| Shenzhen | 230 | Shenyang | 55 |
| Nanjing | 225 | Xi’an | 52 |
| Chongqing | 202 | Nanchang | 29 |
| Dalian | 144 | Zhengzhou | 25 |
| Tianjin | 140 | Fuzhou | 25 |
| Wuhan | 125 | Harbin | 18 |
| Chengdu | 88 | Qingdao | 12 |
| Hangzhou | 82 | Nanning | 10 |
| Ningbo | 75 |
© 2017 by the authors. Licensee MDPI, Basel, Switzerland. This article is an open access article distributed under the terms and conditions of the Creative Commons Attribution (CC BY) license (http://creativecommons.org/licenses/by/4.0/).
Share and Cite
MDPI and ACS Style
Song, Y.; Shao, G.; Song, X.; Liu, Y.; Pan, L.; Ye, H. The Relationships between Urban Form and Urban Commuting: An Empirical Study in China. Sustainability 2017, 9, 1150. https://doi.org/10.3390/su9071150
AMA Style
Song Y, Shao G, Song X, Liu Y, Pan L, Ye H. The Relationships between Urban Form and Urban Commuting: An Empirical Study in China. Sustainability. 2017; 9(7):1150. https://doi.org/10.3390/su9071150
Chicago/Turabian StyleSong, Yu, Guofan Shao, Xiaodong Song, Yong Liu, Lei Pan, and Hong Ye. 2017. "The Relationships between Urban Form and Urban Commuting: An Empirical Study in China" Sustainability 9, no. 7: 1150. https://doi.org/10.3390/su9071150
Note that from the first issue of 2016, this journal uses article numbers instead of page numbers. See further details here.