A Hybrid MCDM Approach for Strategic Project Portfolio Selection of Agro By-Products
by
 and
and
Animesh Debnath
1, 
Jagannath Roy
2,
Samarjit Kar
2,
Edmundas Kazimieras Zavadskas
3,* and
and
Jurgita Antucheviciene
3
1
Vivekananda Mahavidyalaya, Sripally, Burdwan 713103, India
2
Department of Mathematics, National Institute of Technology, Durgapur 713209, India
3
Department of Construction Technology and Management, Vilnius Gediminas Technical University, Saulėtekio al. 11, Vilnius LT-10223, Lithuania
*
Author to whom correspondence should be addressed.
Sustainability 2017, 9(8), 1302; https://doi.org/10.3390/su9081302
Submission received: 27 June 2017
/
Revised: 18 July 2017
/
Accepted: 19 July 2017
/
Published: 26 July 2017
(This article belongs to the Special Issue Advances in Multiple Criteria Decision Making for Sustainability: Modeling and Applications)
Abstract
:Due to the increasing size of the population, society faces several challenges for sustainable and adequate agricultural production, quality, distribution, and food safety in the strategic project portfolio selection (SPPS). The initial adaptation of strategic portfolio management of genetically modified (GM) Agro by-products (Ab-Ps) is a huge challenge in terms of processing the agro food product supply-chain practices in an environmentally nonthreatening way. As a solution to the challenges, the socio-economic characteristics for SPPS of GM food purchasing scenarios are studied. Evaluation and selection of the GM agro portfolio management are the dynamic issues due to physical and immaterial criteria involving a hybrid multiple criteria decision making (MCDM) approach, combining modified grey Decision-Making Trial and Evaluation Laboratory (DEMATEL), Multi-Attributive Border Approximation area Comparison (MABAC) and sensitivity analysis. Evaluation criteria are grouped into social, differential and beneficial clusters, and the modified DEMATEL procedure is used to derive the criteria weights. The MABAC method is applied to rank the strategic project portfolios according to the aggregated preferences of decision makers (DMs). The usefulness of the proposed research framework is validated with a case study. The GM by-products are found to be the best portfolio. Moreover, this framework can unify the policies of agro technological improvement, corporate social responsibility (CSR) and agro export promotion.
1. Introduction
A state of deprivation in developing countries is usually linked to low agricultural productivity. Inadequate quantity and quality of food impacts human development potential, physically and mentally. Reduced immunity to diseases due to poor nutrition increases the health burden. Plant Biotechnology has great potential to improve the situation [1]. Genetically modified (GM) crops are alive; they can migrate and spread worldwide. In this regard, clear signals should be sent to biotech companies to proceed with caution and avoid causing unintended harm to the health of humans, animals and the environment. It is widely believed that it is the right of consumers to demand mandatory labeling of GM food products, independent testing for safety and environmental impacts, and liability for any damage associated with GM crops [2,3]. GM foods are produced from GM agro seeds or ingredients resulting from plants’ gene that have been handled using the methods of genetic engineering, although this is under debate [4].
From the mid-1990s, the comprehensive cultivation of GM crops at an average annual rate of 4% has been noticed. Authors in [5] found that up to 2014, 18 million farmers of 28 countries were able to cultivate over 181 million hectares of GM yields. GM yields with enhanced tolerance to pests and conservation stresses may reduce the use of chemical pesticides in the production of agricultural yields [6]. Moreover, because of their advanced yields, such crops may limit deforestation in developing countries and can preserve biodiversity [7]. Researchers and developers of GM technology believe that this advancement may sustain agro-food production and can combat the challenges of water shortages and the bacterial contamination of food crops [8]. Currently, various food products comprised of GM ingredients or originating from GM crops are available worldwide [9]. However, GM foods still incite lively debate in the public domain [10], where conflicting opinions about the production, consumption, and marketing of such products are notable [11,12]. Compared to traditional foods, customers also have faith in GM food products that contain richer nutritional ingredients, can be bought at cheaper prices, and increase the existing variety of food products [13]. As a result, they seem to be confident about the transmission of GM foods that can contribute to more sustainable agro-food supplies that may reduce the state of starvation in underdeveloped countries [9]. On the other hand, there are consumers who fear genetic technology that may change the natural physical characteristics of food products [11] and have unfavorable effects on both the environment and human body [13]. Secondly, consumer’s outlooks in the direction of GM foods are a significant interpreter of their intensity of buying such products [10,14]. This intensity is also considered as the best forecaster of real buying behavior [15].
Here, it is our endeavor to meet to the main objectives of the present study:
- To recognize and select the valuation criteria for strategic project portfolio selection (SPPS) of agro by-products for socially responsible National Agro Research Institutes;
- To make an estimate for the hierarchical priorities of these valuation criteria for SPPS;
- To make a choice for the most well-organized alternatives of strategic project portfolio management of in the research institutes;
- To look to the future to propose decision-making and rational suggestions of the study.
To see the usefulness of the proposed exploration framework, the case of “Vaighai Agro Products Limited”, which has national importance, is conferred from the practical viewpoint of National Agro Research Institutes for initial strategic portfolio management of the GM agro industry. It is well-known that the GM agro by-product industry is one of the foremost groups of actors in global perspectives. However, to date no study has investigated whether and how a corporate social responsibility (CSR) business approach can intensify the GM food consumption and production [16]. The companies’ actions over GM food production are driven by reasons of higher production and consumer-ecological safety can go above and beyond economic and business interests [17,18]. This is positively affecting consumers’ attitudes and buying intentions towards GM foods. Furthermore, this institute identifies the importance of paying attention to selecting dimensions and criteria of SPPS of Ab-Ps. Ab-Ps are the secondary products resulting from a manufacturing process. In this case, two by-products such as rice bran oil and De oiled rice bran are being derived at the time of manufacturing process of rice. Thus, we wish to advance a hierarchical model in order to excel and appraise the most effective SPP from a set of substitutes in the project portfolio management.
The remainder of the paper is organized in the following way. A systematic literature review of relevant existing works is presented in Section 2. In Section 3, a modified grey DEMATEL based grey MABAC method is proposed as the solution methodology in the current research work. Section 4 outlines the proposed research structure. The usefulness of the proposed framework is presented in Section 5. In Section 6, a comparison analysis and benefit of the proposed integrated MCDM model compared to existing methods are discussed. A sensitivity analysis is performed to validate the robustness of the proposed MCDM model in Section 7. Finally, Section 8 presents closing remarks, boundaries, and recommends future directions.
2. Background of the Study
2.1. Portfolio Management of Agro Products
The context of consumers’ observations about genetically modified (GM) agro product makers and their authorized responsibility to GM nutrients is being positively associated with consumers’ intentions towards GM foods. It is a challenge to find the provision of intension to buy the GM agro products by way of CSR. This likelihood is based on the idea that consumers generally correlate the safety and quality of GM foods and CSR with producers’ admiration of permissible standards and regulations [19]. In reality, consumers are less concerned about the safety and quality of GM foods [9] and are worried about the lack of transparency and information about how the raw material of Ab-Ps production is processed [20].
To assess consumers’ perceptions of the production of GM by-product with CSR, prior research has usually been engaged either in a one-dimensional or multi-dimensional approach [21]. Studies adopting a one-dimensional approach [22] claim that consumers recognize CSR broadly as a corporation’s responsibility to expand the wellbeing of the general public where they operate. In contrast, a lesson adopting a multidimensional approach [23] proposes that the association of the stockholder of GM products and CSR are combined with diverse initiatives so that corporations commence in numerous spheres from safeguarding the environment to the foundation of satisfactory working conditions, and so on. Hence, consumers’ decisions about companies’ CSR obligation are based on their individual assessment of different initiatives consistent with GM foods production [24].
The studies about consumers’ perceptions from a multidimensional perspective of GM food production have resulted in three main conceptualizations of CSR [24]: (1) a four-dimensional model of economic, legal, ethical, and philanthropic responsibility [25]; (2) The Sustainable agro product Development Theory as the combination of social, economic, and environmental apprehensions [26]; and (3) The Stakeholder Management Theory balancing the welfares of different stakeholders, together with consumers, employees, shareholders, the environment, the market, and society at large [24,27].
2.2. Methodologies Used in SPP of Agro Products
As this study proposes three agro project portfolios, many solution methodologies can be applied in the area of project portfolio selection towards strategic decision making. Diverse decision support tools and methods have been recommended by different scholars and practitioners in this area. A precise and instantaneous overlook of the methodologies by several scientists and researchers in SPPS of Ab-Ps for socially responsible national agro institutes is presented in Table 1. Researchers and scientists have exercised many tactics of decision analysis related SPPS problems. Although many papers applied a specific decision analysis method to discuss their investigation in the problem, there is a rising trend for integrated or hybrid approaches that has been noticed in recent years [28,29]. A review of applications of hybrid multiple-criteria decision-making methods in various fields of engineering was provided [30]. Numerous applications for sustainability issues are summarized [31].
2.3. Dimensions and Criteria for SPPS of Ab-Ps
The significant dimension and criteria for SPPS of Ab-Ps for socially responsible national agro institutes have been acknowledged in a complete wide-ranging literature survey and according to experts’ contributions. In total, 13 SPP selection criteria were identified through a detailed literature search (Table 2). Finally, the substantial 13 selection criteria for SPPS were authorized with the assistance of expert’s approval and characterized into three main dimensions of SPPS of Ab-Ps for socially responsible national agro institutes (see Section 5.1).
The applicability of the framework to various empirical contexts of the last four decades have seen a wide number of theoretical and empirical studies [60,61]. The framework of agro products and its sustainability requires a boost of the GM agro and its related products. In this case, the consumption of GM agricultural products (A1) → by-products (A2) → De-by-products (A3) may reduce consumers’ health hazards in terms of the human body (Here, “→” indicates the flow of GM agro product consumption). The GM De-by-Products (like De oiled rice bran cake, De oiled soya cake, etc.) have been used for cattle and poultry feed, organic fertilizer, fish feed, as fuel for boilers, and also used for manufacturing sodium silicate silica gel, insulation bricks, etc. This maintains an environmental and ecological balance. However, all of the alternatives of the framework of agro products, if these are GM or healthy ones, will increase Ab-Ps’ substantial export volume. Detailed analysis for SPP is shown in Table 2.
2.4. Research Gaps and Highlights
CSR is the unending responsibility of industries ethically and philanthropically, who must perform and contribute to economic development while refining the quality of life of their employees, families, and the local community and society at large [64]. Consumers’ unawareness and misjudgments of a company’s business practices of GM food production affect their perceptions of said company’s CSR commitment [65]. Such awareness may, in turn, influence consumers’ attitudes toward the company’s products or services about GM foods and also their perception of purchasing [66].
This paper fills this gap by examining the effect of Indian consumers’ perceptions about GM Ab-Ps manufacturers; CSR approaches postulate the said consumers’ attitudes and purchasing intentions towards healthy GM foods’ consumption. Operationally, this study proposes a model of GM by-product production with CSR that encompasses four main dimensions of responsibility: social, economic, environmental and administrative [7]. Using this framework, the study forecasts that Indian consumers’ optimistic opinions about certain CSR dimensions will positively affect their attitudes toward plans to purchase GM by-products through Genomics, Molecular approaches, Novel agrochemicals, integrated crop health management of the raw materials of Ab-Ps. This prediction deals with the fact that a consumer’s final decisions to consume GM foods for Ab-Ps are heavily deep-rooted in their outlooks and buying intentions [10,14].
3. Method
In order to accomplish the aforesaid aims, a novel integrated MCDM method, namely, grey DEMATEL-MABAC method is developed for assessment and prioritization of the available SPPs of the national agro research institute. The present research work on the Edible Oil Company is a preliminary attempt to integrate grey DEMATEL and grey MABAC methods for classifying and arranging the SPPS criteria and finally identify the most effective SPP among the existing three portfolios such as agro raw products, Ab-Ps and De-by-products.
Grey DEMATEL [67] analyses the cause-effect relationships and inter-influential degrees within the dimensions and criteria of SPPS. In a real situation, a hierarchical structure with incomplete information always exists and a robust MCDM method should consider the interactions among criteria. Moreover, DEMATEL makes better decisions in uncertainty [68]. However, there are other tools, namely Analytic Network Process (ANP), Interpretive Structural Modeling (ISM), Fuzzy Measures and the Choquet Integral, which also help modeling interactions among criteria. However, DEMATEL is superior to these models and provides some advantages: (1) representing the contextual relation as well as strength of influence of the elements for the target system (2) determining the direct and indirect relationships between criteria and (3) converting the cause-effect relationship of elements into visible structural models and having less computational complexity compared to them [69]. It can also be successfully applied for corporate social responsibility issues [70].
On the other hand, the MABAC technique [71] can be applied for the evaluation and selection of the best SPP from the set of SPPs of Ab-Ps. Selecting alternatives is a typical procedure due to human participation. The MABAC model, an inclusive evaluation tool, has been acknowledged as an efficient decision support system for selection problems. Concerning the assessment and selection of alternatives, VIKOR (Vise Kriterijumska Optimizacija I Kompromisno Resenje) and TOPSIS (Technique for Order Preference by Similarity to Ideal Solution) may also be used. Comprehensive reviews on methodologies and applications of the latter methods are available [72,73]. However, [71] showed that MABAC has benefits in producing consistent (stable) solutions under the same conditions. Due to that special advantage, it has attracted many researchers since its inception. The MABAC method is a predominantly practical and consistent tool for rational decision making [74]. Additionally, the structure of the MABAC method could be defined as being similar to prospect theory, affirming that individuals can make conclusions based on the potential value of gains and losses rather than on final outcomes [75]. It is interesting to notice that this method has gained numerous potential applications in diverse research areas, namely, transport and handling resources selection in logistics centers [71], material selection [74], evaluation and selection of medical tourism sites [76], system engineer selection [77], assessment of healthcare waste treatment technologies [78], location selection of wind farms [79], and selecting hotels on a tourism website [75]. The main reasons for conjoining DEMATEL, MABAC and grey systems (see Appendix A) in this study are:
- DEMATEL can effectively explore the relationships between and within the dimensions and or criteria of the decision-making problems, while the MABAC method efficiently appraises experts’ judgments at the most important level of decision making.
- The incorporation of these two MCDM tools is significant due to the proficiency of twofold remitting tactics of MABAC to DEMATEL.
- This combination will be able to handle multifaceted decision making problems more easily and efficiently.
- This combined methodology might deliver a practical, rational, and operative answer in such decision-making conditions.
The incorporated DEMATEL-MABAC method is applied by only a few researchers in diverse disciplines, including transport and handling resources selection in logistics centers [71], and location selection of wind farms [79]. The complete processes for DEMATEL and MABAC methods are given as follows. To the best of our knowledge, grey MABAC and its integration with grey DEMATEL are new to the literature and no research work has focused on SPPS.
3.1. Modified Grey DEMATEL Method for Criteria Weighing
The aim of DEMATEL is to investigate the major relationship between criteria that have been identified in the literature. Although the grey DEMATEL [67] works well in analyzing the prominence-relations in dimensions and criteria and dividing them into cause and effect groups, it has some limitations. (1) It considers a group of decision experts but there the hierarchical importance of them is avoided. In reality, imposing such importance is more acceptable, rational or practical. (2) It does not help to find the relative weights of criteria. So, in the present study, the modified grey DEMATEL method for heterogeneous decision experts has been extended for computing the relative priorities of the criteria set. The steps of the model are as follows:
Steps 1. Develop grey direct-relation matrices.
The direct dependency degree indicators, used by experts, are defined in the following scale (Table 3).
The interval numbers [0, 0.1], [0.1, 0.3], [0.3, 0.5], [0.4, 0.7], [0.6, 0.9], [0.9, 1.0], represent “no influence”, “very low influence”, “medium low influence”, “medium influence”, “medium high influence”, “high influence”, “very high influence” respectively among the dimensions and criteria. Thus, initial direct-relation matrices were developed based on the influence ratings from experts having hierarchical priorities.
Step 2. Establish the initial grey direct-relation matrices.
For relationship between criteria set , a group of experts develop pair-wise comparison (dependency) grey decision matrices (using Equation (1)) with principal diagonal elements initially set to grey value of zero.
is a grey number for the influence (dependency degree) of criterion on criterion for expert . Taking experts and criteria for the case study, the above matrices are shown in Equation (1).
Step 3. Calculate the aggregated grey direct-relation matrix.
Since decision makers may come from different divisions and have different backgrounds and expertise, each decision maker is given a weight , () to reflect his/her influence on overall prioritization of portfolio selection criteria weights. The individual grey direct-relation matrixes are aggregated into the group grey direct-relation matrix as:
The aggregated grey numbers in the group grey direct relation matrix can be obtained as follows:
where and are the lower limit and the upper limit of grey number , respectively.
Step 4. Calculate normalized grey direct-relation matrix ().
After obtaining the grey direct-relation matrix , the linear scale conversion is used as a normalization method to convert the dependency ratings of SPPS dimensions and criteria into comparable scales. The normalized grey direct-relation matrix can be obtained as follows:
where and are the lower limit and upper limit of the grey number , respectively.
Step 5. Calculate the total relation matrix (.).
As soon as the normalized group direct strength-relation matrix is established, the grey numbers within this matrix can be divided into two sub-matrices, i.e., and .
The total relation matrices
and are determined by expression (7) and (8) where represents an identity matrix.
The total relation matrices and exist, since the series in the Equations (7) and (8) converges, if at least one row sum of both of and elements are less than 1. This is guaranteed by the normalization defined by Equation (5) [84].
Thus, the total relation matrix can be characterized as
where is the total impact grade for the dimension/criterion () against the dimension/criterion considering the inner influence among criteria. Here, and are the lower limit and the upper limit of the grey interval in the grey total relation matrix respectively.
Step 6. Convert the grey total relation matrix into white total relation matrix .
The grey numbers are transformed into white numbers using relations (10), proposed by [85].
where is the orientation coefficient of the grey numbers . Thus, the total relation matrix can be written as follows:
Step 7. Determine the cause and effect relationships between SPPS dimensions.
The sum of rows and the sum of columns of the whitened total relation-matrix , denoted by the and , can be obtained as follows:
The row sum of all entries in the th row of the matrix is regarded as the total influence exercised by the SPPS dimensions on SPPS criterion of the current study. On the other hand, the column sum of all SPPS criteria in the th column of the matrix is understood as the total influence exercised by all other risk factors on the SPPS criterion .
Step 8. Determine prominence and relational maps among SPPS criteria.
The prominence vector () and relation vector are calculated by:
The vector is construed as a global impact of those SPPS dimensions. The higher the value of the larger the global prominence (visibility/importance/influence) of dimension at the point of complete association with SPPS criteria. The vector demonstrates the alteration between the employed and received influence, and it is a basis for organization of the SPPS criteria. A positive relational value tells us that the th SPPS dimension goes to the cause group while a negative relational value indicates that th SPPS dimension is a net cause for other SPPS criteria.
Graphical description of the interrelationship maps between SPPS dimensions/criteria is essential to show the inter-relational digraph to recognize most significant interactions of dimensions and criteria based on the data in the grey total relation matrix . The grey numbers in the matrix must be transformed into crisp numbers. Now, one needs to set a threshold value in order to identify significant interrelations between SPPS dimensions/criteria. An extremely low threshold value will generate all possible relational maps that might contain maps that are too complex to show essential insights for decision-making. Similarly, a very high threshold value will make SPPS factors (dimensions/criteria) independent, avoiding the interrelationships among them. Thus, an appropriate threshold value can be computed according to Equation (14) [86].
Step 9. Calculate the local and global weights of criteria.
Authors in [87] proposed a formula to measure the weightage and normalized weight of dimensions which are shown in Equation (15) and (16) respectively.
The global weight of the th criteria under th dimensions is symbolized by and computed as in Equation (17):
where, is the local priority of the criteria within the dimension and is the weight priority of the dimension .
3.2. Proposed Grey MABAC for Group Decision Making
After obtaining the weight coefficients, the conditions are ready to introduce the mathematical formulation of the MABAC method. The process of implementing the MABAC method consists of the following steps:
Step 1. Formation of the initial decision matrices ().
Consider a general SPPS problem with alternatives (), which are evaluated on the basis of evaluation criteria (). Consider is a grey decision matrix given by the decision maker , i.e.,:
Here, denotes the performance rating or grade of with respect to the criterion according to (). As before in step 1 of Section 3.1, decision makers from different expertise and backgrounds are included in the evaluation process. Each of the DMs is given an importance (where, ) in such a way that everyone can reflect his/her influence on overall selection of SPP. In response to this, the grey theory is adopted to tackle the uncertainty in assessment grades of alternatives provided by the decision makers.
Step 2. Construct the group grey decision matrix.
Once the decision matrices are obtained from all the DMs, it is necessary to aggregate the initial decision matrices into a group grey decision matrix, according to the following equations:
where indicates the number of the alternatives, indicates the total number of criteria.
Step 3. Normalization of the elements from the aggregated grey decision matrix.
The elements of the normalized grey decision matrix () are determined from the initial matrix using the following Equations:
- For Benefit type criteria (a higher value of the criterion is preferable).
- For Cost type criteria (a lower value of the criterion is preferable).where and . Thus, the normalized grey decision matrix is given by:
Step 4. Calculation of the elements from the weighted grey decision matrix .
The elements of the weighted matrix are calculated on the basis of the following expression:
where are the elements of the normalized matrix () and is the weight coefficients of the criterion . Using Equation (25), the weighted matrix can be represented as follows:
Step 5. Determining the grey border approximation area matrix ().
The grey border approximation area (BAA) for each criterion function is determined by Equation (26) as follows:
where are elements of the weighted matrix and the total number of alternatives. After calculating the value for each criterion function, a border approximation area vector, is formed which works as a reference point of performances of each alternative according to every criteria function. Next, the grey border approximation area matrix using the border approximation area vector as rows of that matrix is in the form:
Step 6. Calculation of the preference index matrix ().
The preference index matrix of the alternatives from the border approximation area for the matrix elements has been conducted. The preferences are measured using Euclidean distance between the grey numbers and and the preference index matrix is found as follows:
The preference indices are calculated using the following relations:
- For benefit type criteria:
- For cost type criteria:
The preference indices of the alternatives from the border approximation area (BAA) of each criterion function is determined as the difference between the elements in the weighted matrix and the value of the border approximation area . Here, is the BAA for criterion , are the elements of the weighted matrix .
Step 7. Ranking the alternatives.
A calculation of the values of the criterion functions for the alternatives (Equation (31)) is obtained as the sum of the distance of the alternatives from the border approximation areas . By calculating the sum of the elements of distance matrix, by rows we can obtain the closeness coefficient of each alternative from the border approximation area (BAA).
4. Proposed Research Framework
The proposed research framework for SPPS of Ab-Ps for a socially responsible national agro research institute, based on the integrated grey DEMATEL-MABAC approach, consists of three phases which is graphically shown in Figure 1. The proposed framework can assist managers and decision analysts in terms of:
- Understanding and determining the proposed criteria for SPPS of by-products.
- Determining the relative importance weights of criteria for SPPS of by-products.
- Ranking the alternative portfolios and selecting the most efficient SPP of by-product for socially responsible national agro research institute.
The other details for the proposed framework are given in the following:
Phase I. Identify and finalize the SPP evaluation criteria and alternatives.
The identification and finalization of the related criteria and alternatives in selection of SPP of by-product are the first phase of the proposed framework. These selection criteria should cover most of the aspects of the socially responsible national agro research institute. A decision group is formed at the case institute in order to fulfill this objective. The socially responsible SPP-related evaluation criteria have been compiled through relevant literature and input from experts. Further, a list of 13 criteria have been sorted and categorized into 3 dimensions considering social responsibility with the help of brainstorming sessions with experts. After finalizing the evaluation dimensions, criteria and alternatives, a hierarchical structural is framed (Figure 2).
Phase II. Grey DEMATEL application: Compute dimension weights, criteria weights and influential network relationship map (INRM).
As any criterion may impact another one, this study used the DEMATEL technique to acquire the structure of the MCDM problems. It also enables us to determine the relative weights of each criterion from the direct-relation matrices obtained from experts’ judgments.
Phase III. Grey MABAC application: Select the most efficient SPP among alternatives.
After approval of criteria weights, the decision group is asked for ratings to select the most efficient SPP of by-product for the socially responsible national agro research institute’s most efficient portfolios. As a result, the alternatives are assessed and the most effective SPP is carefully chosen among the alternatives by using the proposed grey MABAC technique.
5. An Application Example of Proposed Hybrid MADM Framework
To demonstrate the feasibility and usefulness of the proposed evaluation method for SPP management which has been applied through the National Agro Research Institute, we develop R&D project portfolios to process in the initial stages of productive organizations. The ‘National agro Foundation’ established in 2000 is the central agro research institute in India and has a robust existence for initial strategic agro portfolio management in the country. They have the responsibility to develop strategic R&D project portfolio management for agro products with social responsibility. Fundamentally, from the practical viewpoint, the case institute seeks to assess and appraise social responsibility through SPPS as a part of R&D aspects. It also needs to employ its ecological, social and corporate impression. The institute administrators encountered some hitches in picking the appropriate SPP of by-products and in providing connected R&D regulations in view of societal value. Hence, the institute is focusing on implementing a wide-ranging tactic for a thoughtful approach to the assessment of relevant criteria and potential alternatives, which should be obliging in employing social responsibility in their R&D project management. The executive directors also want to arrange the SPPS attributes and to choose the most effective SPP from available substitutes in account of their significances. Thus, to assist the executives, the grey DEMATEL-MABAC combined method, a novel approach in MCDM, is effectively applied in this paper. The other particulars are specified in the subsequent subsections.
5.1. Identify and Finalize the Related Evaluation Criteria and Alternatives
To be able to evaluate the identified GM agro-portfolio selection indicators through literature review and viewpoints of highly skilled and experienced experts who are active in differently located yet important Edible Oil product plants (e.g., mustard oil, rice bran oil, soyabean oil, sunflower oil, etc.) of the country. Also, a questionnaire survey was conducted which allows rich opinions and attitudes from a certain respondent as a sample with a quantitative performance [88,89]. The final purpose is to assign the importance levels to the indicators to be consequently usable for the decision-making process. In order to verify the appropriateness on the indicators’ list and to make sure that the identified indicators are practically applicable, a pilot survey was carried out through semi-structured interviews with six experts (DM1, DM2 DM3, DM4, DM5 and DM6) involved in Edible Oil product projects in India. The characteristics required to define an individual as an “expert” are equivocal, according to [90].
Having no complete guidance, they introduced some specific expertise requirements for the qualification of expert panelists served in a Delphi panel, which are used for identification and qualification of the following experts in this study, and are listed in Table 4.
In this study, the questionnaire is structured in order to face an interview with an expert panel, as performed in the first round of the Delphi survey. In this regard, the experts were able to bring up their ideas, correct possible errors, and check the compatibility of the indicators with the current concerns in India. The results of the pilot survey verified that the identified indicators are to a large extent compatible with the concerns, and no conflicting opinions were received from the expert panel. As a result, performing the second round of pilot survey was not necessary. The questionnaire was distributed among professionals and experts, including accountability assurance provider, agro-researcher, stakeholder, and consultant companies with at least ten years of working experience in feasibility studies of Edible Oil product projects in India.
For group decisions, two types of questionnaires are used to generate the decision matrices to be utilized in both the grey DEMATEL and MABAC model. The usual method to determine the respondents’ perceptions regarding the importance degrees is the Likert scale. Respondents are asked to rate their perceptions using numbers attributed to some linguistic evaluations for criteria (like 0.1: low, 0.3: medium, 0.4: medium good, 0.6: good, 0.7: very good, 0.9: very very good and 1: extremely good) and alternatives (like 1: very poor, 3: poor, 4: medium poor, 6: fair, 7: medium good, 9: good and 10: very good). However, the perception of the respondents can be vague and subjective and the same words can be perceived individually and different by the respondents due to vagueness [91].
Therefore, crisp values are not suitable to define the linguistic terms and perceptions addressing importance degrees. In order to deal with this vagueness and uncertainty, grey numbers are used to define the linguistic importance weights. The respondents have chosen the linguistic terms, and then, to obtain the integrated vague importance weights, corresponding grey numbers are aggregated using the operation laws [85] of grey numbers and the average amount is calculated. It should be noted that these importance weights are in interval forms as grey numbers (Table 3).
5.2. Grey DEMATEL Application: Compute Dimension Weights, Criteria Weights and Influential Network Relationship Map (INRM)
Grey DEMATEL method [67] analyzes the causal relationships among the SPPS dimensions—social (D1), differential (D2) and beneficial (D3) as well as among their corresponding criteria (D11, D12 D13, D14, D21, D22, D23, D24, D25, D31, D32, D33, D34). The causal relationships among dimensions are expressed by means of grey numbers. The intensities of relationships among dimensions are transformed into the local priorities. The same calculations are performed within each dimension to find the local and global priorities of the 13 criteria.
Steps 1 to 2. In order to compute the grey DEMATEL method, the causal dependencies grades among the main dimensions are evoked by a group of six decision experts (DM1, DM2, …, DM6). The grey initial direct relation (influence) matrices, (as shown in Equation (1)) are obtained from these experts who specify the degree of dependency among the dimensions. Due to limited space, only one of the dependency matrices is shown in Table 5. Further, Table 6 represents the initial grey direct relation matrix.
Step 3. Employing Equations (2) and (3), the grey average initial direct-relation matrix, , is constructed as given in Table 7.
Step 4 to 5. The normalized average initial direct-relation matrix is computed via Equations (4) and (5). The grey total-relation matrix (Table 8) is determined by using Equations (6)–(9).
Steps 6. Next, Equation (10) helps the conversion of grey total relation matrix into white/crisp total relation matrix as shown in Table 9.
Step 7. Based on the whitened total-relation matrix obtained in the previous step, the structural correlation analysis is performed. The row sum vector () and column sum vector () of the whitened total relation matrix are calculated based on Equation (12). The calculated and values for each SPPS dimensions are given in Table 10. The same computations are performed within each dimension to evaluate the causal relations among the criteria. Employing Equation (13), expected values of prominence () and relation () are calculated. Based on the crisp values of , and , Table 10 summarizes the crisp prominence and relation values, and cause/effect group of criteria. A threshold value (θ) can be computed according to Equation (14) for drawing the interpretational diagraph to graphically describe the interrelationship maps between SPPS dimensions/criteria.
Step 8. Equations (15) and (16) are used to calculate relative and normalized weights for each SPPS dimension and criteria. Finally, Equation (17) is applied to obtain the global weights of each SPPS criteria (Table 11).
Figure 3 signifies the causal diagram of the dimensions. The causal diagram of the SPPS dimensions does not only provide the comparative standing of each dimension, but it also has the benefit of recognizing the cause and effect groups. The cause group dimensions are acknowledged as the influencing criteria whereas the effect group represents the meaning of the influenced dimensions [85]. In order to increase the organization’s performance, management must stress the cause dimension since they have significant influence on the other dimensions. Investigating the causal diagram of the SPPS dimensions, D2 belongs to the cause group while D1 and D3 become members of the effect group. Now, D2 has the greatest relation () value (0.0386) which indicates that D2 could not be easily influenced by other criteria (Table 10).
In contrast, D1 and D3 have negative relation degrees −0.0112 and −0.0274 respectively. That implies that both D1 and D3 are very easily influenced by D2. However, D3 has the lowest relation degree (−0.0274), which means its performance is extremely dependent on D2. The performance of D1 and D3 can be simply enhanced as they are dependent on D2. On the other hand, the cause dimension D2 is difficult for others to move. Furthermore, D1 has the highest prominence () value (0.9356) followed by D3 with prominence degree 0.8333 and then, D2 with prominence value of 0.7673. These suggest the relative importance (priority) order of the dimensions is D1 > D3 > D2. From the analytical results shown in Table 11, the D1 is found to be the most highly important dimension with the normalized weight of 36.87%, followed by D3 with the priority of 32.86%, and then D2 with the weight of 30.28%. In the next level, all criteria are ranked within their respective dimension. Weight priorities of criteria for evaluation of SPP of by-products for socially responsible agro institutes have been concisely summarized in Table 11.
The same calculations are performed within each dimension. Since differential (D2) dimension belongs to the cause group, related criteria are analyzed first. Figure 3a represents the causal diagram of the differential dimension. In this dimension, D22 and D23 belong to the cause group, while D21, D24 and D25 are members of the effect group. The most important criterion is found to be D23 with the local priority of 21.23%. The least important criterion is D22 with the local priority of 18.62% since it has the smallest prominence value (0.4068).
On the other hand, Figure 3b depicts the causal relationships within a socially responsible strategy (D1). Here, D14 and D11 are the members of the cause group while D12 and D13 belong to the effect group. D13 is the most important criteria with local priority of 28.46%. D14 is the least important criteria with local priority of 20.08%. Finally, Figure 3c shows the causal diagram of beneficial (D3) criteria. D33 and D32 are the members of the cause group, and D31 and D34 belong to effect group. D34 was found to be the most important criterion with the local priority of 27.86%. D32 ranks second in terms of local priority of 24.58%. The least important criterion is found to be D31 with the weight of 23.77%.
After calculating all dimensions and criteria weights, the global priorities can be calculated by multiplying dimension and criteria weights as in Equation (17). For instance, the global weight of the D11 is calculated by . The global weight of each criterion is given in Table 11. Once the global weights of all criteria are computed, the next step is to prioritize the SPP alternatives.
5.3. Evaluation of the Alternatives/Portfolios Using Proposed Grey MABAC Model
The most efficient SPP among alternatives is selected using grey MABAC analysis. Assessment matrix of the alternatives is formed by using a scale mentioned in Table 3. Here, only one expert’s assessment matrix is provided due to space constraints (see Table 12).
In this section, Grey-MABAC calculations are described in a step by step routine.
Step 1. Convert the linguistic expressions into grey numbers and compute the aggregated grey decision matrix via Equations (19) and (20), which are collected from the six DMs. The aggregated grey decision matrix () is presented in Table 13.
Step 2. The aggregated grey decision matrix is normalized grey decision matrix () according to Equations (21)–(23). Table 14 represents the normalized grey decision matrix.
Step 3. Using the weight vector , the weighted grey decision matrix () can be calculated based on Equations (24) and (25) and shown in Table 15.
Step 4. Obtain the border approximation area vector using Equation (26). Thus this vector as rows of a matrix, the grey border approximation area matrix (by Equation (27)) is built which works as a reference matrix to measure the overall performance of each alternative from the ideal solution with respect to the other ideal solutions (see Table 16).
Step 5. The distance matrix () is computed according to Equations (28)–(30). This single matrix (Table 17) shows numerically the overall relative advantage (strength) and under-performance (weakness) of an alternative with others in each criterion.
Step 6. The closeness coefficients for each alternative to the border approximation area can be computed using Equation (31). The are listed in Table 18.
Step 7. The alternatives are ranked based on their closeness coefficients. Sorting the closeness coefficients in a descending order, final ranking (Table 18) of alternative strategies is obtained as: A2 > A1 > A3. Additionally, based on overall performance, Figure 4 indicates that the second portfolio (A2) belongs to the upper approximation area (which holds the ideal solutions) while A1 and A3 fall in the lower approximation area (which holds the anti-ideal solutions).
6. Comparative Analysis and Discussion
In order to validate the practicability and efficiency of the projected grey MABAC method, a comparative analysis with few existing approaches grounded on the same example can be performed. Some of them are MABAC [71], IVIF-MABAC [74], TOPSIS-Grey [92], Grey-VIKOR [93]. In order to sustain a better contrast for the final outcome, the criteria weights determined by modified grey DEMATEL method in this study are directly incorporated for all the existing MCDM models.
For MABAC [71], the aggregated grey numbers are transformed into white numbers which are used for computation of this model. The computation steps are not included here since this section is devoted for comparison of final rankings. Table 19 shows the ranking order is same as the order due to the proposed grey MABAC.
- Now, IVIF-MABAC needs IVIFNs as inputs. So, the linguistic ratings are converted to their corresponding IVIFNs and IVIF-MABAC [74] steps are performed. Here, the ranking order is not same as the original study. A3 enjoys advantage over A1 according to this method. However, A2 remains the best alternative as the SPP (Table 19).
- TOPSIS-Grey [92] and Grey-VIKOR [93] have not been developed considering group decision making. So, they have to directly adopt the aggregated grey decision matrix for producing any fruitful result. Table 19 shows that the ranking orders produced by both of them are similar to the original ranking order in this study.
Thus, from the above three cases, it can be summarized that the results are harmonious to each other and they agree moderately with the results of the original preference order. Compared with the above four methodologies, the proposed grey MABAC have the following advantages:
- In the classical MABAC [71] method, the evaluations are performed using crisp ratings. In real-life problems, an expert may feel it is inappropriate and inflexible to rate the performance using only white numbers. For example, agro industries may feel some criteria are “highly important” and the rating scale should be more flexible in order to express its importance. They may choose “highly important” as an interval number [8,10] in a grey systems rather than “highly important” as a single number 9. However, in the proposed methodology, grey numbers are applied for assessment of alternative portfolios and rating the importance of criteria. So, the current study allows decision makers flexibility in expressing their opinions and evaluation ratings.
- Another advantage of the proposed methodology is the utilization of modified grey DEMATEL model as an important tool to visualize the inter-relations among the criteria and divide them into two groups, namely, “Cause group” and “Effect group”. The grey DEMATEL [67] is applicable for a single decision maker since it does not consider the heterogeneity of decision makers. However, in reality, there exists a hierarchical importance of each expert according to his/her experience and expertise. So, this issue has been defined a modified grey DEMATEL model to overcome the limitation of grey DEMATEL [67].
- In comparison with IVIF-MABAC, the proposed grey MABAC has an advantage. The grey systems theory reflects the situation of fuzziness which is a foremost benefit of grey systems theory over fuzzy set theory. The other benefit of grey systems over fuzzy models is that, it does not require any robust fuzzy membership function [80,81,82]. Grey theory is established to reflect the uncertainty problem of small samples and poor information. Further, the proposed grey MABAC has computational advantage over IVFI-MABAC since grey MABAC possesses relatively simple calculations.
- Finally, our proposed model has a big advantage over both of the TOPSIS-Grey [92] and Grey-VIKOR [93]. These two models are incapable of group decision making which is more often exercised in real-world problems. So, they have this limitation. On the other hand, our model includes heterogeneous decision makers in the evaluation process where each decision maker can influence the overall portfolio selection results. Thus, the proposed grey MABAC model is more realistic and flexibly handles a consensus among them.
7. Sensitivity Analysis
In MCDM, it is convenient to perform sensitivity analyses in order to test the stability of the proposed framework and the final ranking. A large number of sensitivity analyses are performed due to a slight variation in the criteria relative weights [94]. Relative weights of some criteria are increased and some of them are decreased according to Equation (32):
where is the percentage of change of As original weights, the total new sum is also kept unity, i.e., . In this work, the SPP of by-products evaluation dimension and criteria weights are calculated by means of human inputs. Thus, the robustness testing of the final ranking of the portfolios by assigning changed weights of the criteria has been conducted. This also has the benefit of reliability in decision making. Small changes in weights of dimensions (D1, D2, D3) and criteria (D11-D14, D21-D25, D31-D34) of the alternatives A1, A2 and A3 have a little effect in the final ranking of SPPS. Outcomes of the sensitivity analyses endorse the proposal that A2 has the uppermost priority followed by A1 and A3. The observed ranking order (Figure 5) A2 > A1 > A3 can be followed in five out of 11 scenarios. Additionally, A2 has top ranking in maximum number of scenarios except in scenario 9 and 11. In these two cases, there are drastic changes (increase and or decrease) in priorities of “D1, D2, and D3” and consequently (Table 20) have been observed with severe changes in weights of criteria. Such actions affect the final ranking and A1 gets the highest ranking followed by A2 and A3 in such scenarios.
The ranking remains consistent unless some drastic changes are made in the weights of dimensions (D1, D2, and D3). Otherwise, sensitivity analysis shows robustness in ranking order (Table 21) of alternative portfolios. A2 or A1 enjoy top rank in all scenarios and may be selected as best by the decision makers since A2 is always followed by A1 (Figure 5). At the end, the sensitivity analysis may be meaningful to assess the alternatives for SPPS of a by-product for socially responsible National Agro Research Institutes.
8. Conclusions, Boundaries, and Future Direction
SPPM provided practical and robust expert advice through which the Productive Organizations were able to present a clear framework for complete impactful strategic projects. The executive-level direction builds a dominant and well-organized process from the initial adoption to portfolio alignment. The essential resource contained in this study applies to socially responsible agro product organization from a small to global scale. With these organizational insights, the efficient strategic portfolio management to GM agro by-product projects will ensure the delivery of resources for business and will have the impact needed from both the organization and society.
The current study is applied as a hierarchical MCDM method which offers inclusive understandings on SPPS of by-products. The grey DEMATEL model has been used for appraising the inter-influential relationships among the SPPS criteria and comparative importance weights them. It also divides the criteria into two clusters, namely the cause group and effect group. On the other hand, the grey MABAC method has been utilized for picking the most effective SPP of by-products. The attained weights of criteria for SPPS via grey DEMATEL have been employed as input in the proposed grey MABAC model for evaluating the alternatives and selecting the top SPP among them.
The research results were conferred upon 45 professionals to examine the topics linked to R&D projects for SPPS of enterprises. The findings were acknowledged by them and there was a good agreement among them about the results found here. Initially, grey DEMATEL suggests that NARIs should control the “cause factors” (D2) beforehand if it is willing to take care of the “effect factors” (D1, D3). This is because the “social” (D1) and “beneficial” (D3) strategic factors are influenced and can be improved and the “differential” (D2) is considered as the influencing strategy. There is disapproval in terms of its influence on other strategies. Unlike previous studies (e.g., [48]), this study shows the mutual influences between “differential and social factors” and “social and beneficial factors”. In contrast, there is one convincing relation between “differential and beneficial factors”. This also helps managers to derive local and global weights for each criterion to find the optimal portfolio. The best three criteria are: “Genomics, improved diagnostics and biosystematics” (D11), “Use of agrochemicals” (D13), and “Space technology for mapping and monitoring pest population and development of weather based forewarning in GIS environment” (D34). Next, grey MABAC shows us how to aggregate DMs’ judgments and evaluate and select a project portfolio in socially responsible National Agro Research Institutes. The second portfolio A2 (GM agricultural by-products) turned out to be the optimal choice for the case industry. Finally, the managers of the case industry would be able to implement the optimal portfolio to impact the domestic and export business. Thus, the presented MCDM framework may serve as a reference for portraying and analyzing key factors as well as portfolios in SPPS management. Therefore, GM agro portfolio specialists, mentors, and associated commercial administrations can use the proposed framework of generating applicable decisions to explore portfolio management problems to control the best business practice. Moreover, from the scientific viewpoints of socially responsible National Agro Research Institutes for R&D portfolio management, this paper could deliver a practical and simplified visualization of a complicated portfolio evaluation problem-management of the agro by-product industry: “Vaighai Agro Products Limited”. The vital advantage of the proposed framework is to follow constructive and systematic literature survey and experts’ feedback and is considered to select the SPPS alternatives and criteria for the practice of GM agro food product selection. These dimensions will help the executive officials of the SPP management to appraise and choose the most effective GM agro portfolio management of by-products for socially responsible agro national research institutes incorporating the enterpriser’s differential as well as beneficial aspects.
The present work has a few restrictions as well. Only 3 dimensions and 13 important criteria for SPPS have been acknowledged in the evaluation method. Additional criteria and dimensions (economic, environmental, technology) have not been documented here. The integrated grey DEMATEL and proposed grey MABAC framework is applied to appraise SPP dimensions/criteria and to find the most effective SPP among the alternatives. The essential calculations are achieved by taking the experts’ ideas into consideration. Henceforth, it is recommended to complete these assessments in a vigilant way. The research verdicts are grounded on a single case institute; hence, the results cannot be globally accepted for GM organization’s usage in the agro business. Further, various methods and MCDM tools (such as ISM, DEMATEL based ANP, fuzzy grey cognitive maps) can be pragmatic to examine the inter-relationships and strength of relationships between or among dimensions and criteria. In future works, ELECTRE and PROMETHEE could also be used for SPPS of by-product for a socially responsible National Agro Research Institute. Finally, it would be interesting to apply the Interpretive Ranking Process (IRP) for such evaluation problems.
Acknowledgments
We appreciate anonymous referees and the editor for their comments and manuscript processing. The second author extends his sincere thanks to the Department of Science and Technology, India for their financial support under INSPIRE Fellowship program with the research grant No. DST/INSPIRE Fellowship/2013/544.
Author Contributions
The individual contribution and responsibilities of the authors were as follows: Animesh Debnath, Jagannath Roy and Samarjit Kar designed the research, collected and analyzed the data and the obtained results, performed the development of the paper. Edmundas Kazimieras Zavadskas and Jurgita Antucheviciene provided extensive advice throughout the study, regarding the research design, methodology, findings and revised the manuscript. All the authors have read and approved the final manuscript.
Conflicts of Interest
The authors declare no conflicts of interest.
Appendix A
Preliminaries of Grey theory [95]:
Grey theory which was proposed by Deng in 1982, is one of the new mathematical theories born out of the concept of the grey set. It is an effective method used to solve uncertainty problems with discrete data and incomplete information. The theory includes five major parts: grey prediction, grey relational analysis (GRA) [95] grey decision, grey programming and grey control. Here, some basic definitions of the grey system, grey set and grey number in grey theory are followed as:
Definition A1.
A grey system is defined as a system containing uncertain information presented by a grey number and grey variables. The concept of a grey system is shown in Figure 1.
Definition A2.
Let be the universal set. Then a grey set of is defined by its two mappings and .
where,, , , and are the upper and lower membership functions in respectively. When the grey set becomes a fuzzy set. It shows that grey theory considers the condition of the fuzziness and can deal flexibly with the fuzziness situation.
Definition A3.
The grey number can be defined as a number with uncertain information. For example, the ratings of attributes are described by the linguistic variables; there will be a numerical interval expressing it. This numerical interval will contain uncertain information. Generally, grey number is written as , where .
Definition A4.
Only the lower limit of can be possibly estimated and is defined as a lower-limit grey number.
Definition A5.
Only the upper limit of can be possibly estimated and is defined as a lower-limit grey number.
Definition A6.
The lower and upper limits of can be estimated and is defined as an interval grey number.
Definition A7.
Grey number operation is an operation defined on sets of intervals, rather than real numbers. The modern development of interval operation began with R.E. Moore’s dissertation. [95] have discussed the basic operation laws of grey numbers and on intervals where the four basic grey number operations on the interval are the exact range of the corresponding real operation.
Definition A8.
The length of grey number is defined as
Definition A9.
The nth root of grey number is defined as
Definition A10.
Distance function between grey numbers. The Euclidean distance between and is defined as
References
- Potrykus, I. Constraints to biotechnology introduction for poverty alleviation. New Biotechnol. 2010, 5, 447–448. [Google Scholar] [CrossRef] [PubMed]
- Glass, S.; Fanzo, J. Genetic modification technology for nutrition and improving diets: An ethical perspective. Curr. Opin. Biotechnol. 2017, 44, 46–51. [Google Scholar] [CrossRef] [PubMed]
- Eenennaam, A.L.V. Genetic modification of food animals. Curr. Opin. Biotechnol. 2017, 44, 27–34. [Google Scholar] [CrossRef] [PubMed]
- Ejnavarzala, H. Genetically modified food. Wiley-Blackwell Encycl. Glob. 2012. [Google Scholar] [CrossRef]
- James, C. 20th Anniversary (1996 to 2015) of the Global Commercialization of Biotech Crops and Biotech Crop Highlights in 2015. 2015. Available online: http://isaaa.org/resources/publications/briefs/51/executivesummary/default.asp (accessed on 14 April 2017).
- Weisenfeld, U. Corporate social responsibility in innovation: Insights from two cases of Syngenta’s activities in genetically modified organisms. Creat. Innov. Manag. 2012, 21, 199–211. [Google Scholar] [CrossRef]
- Qaim, M.; Kouser, S. Genetically modified crops and food security. PloS ONE 2013, 8, e64879. [Google Scholar] [CrossRef] [PubMed]
- Bennett, D.J.; Jennings, R.C. Successful Agricultural Innovation in Emerging Economies: New Genetic Technologies for Global Food Production; Cambridge University Press: London, UK, 2013. [Google Scholar]
- Bawa, A.S.; Anilakumar, K.R. Genetically modified foods: Safety, risks and public concerns—A review. J. Food Sci. Technol. 2013, 50, 1035–1046. [Google Scholar] [CrossRef] [PubMed]
- Kim, Y.G.; Jang, S.Y.; Kim, A.K. Application of the theory of planned behavior to genetically modified foods: Moderating effects of food technology neophobia. Food Res. Int. 2014, 62, 947–954. [Google Scholar] [CrossRef]
- Frewer, L.J.; Coles, D.; Houdebine, L.M.; Kleter, G.A. Attitudes towards genetically modified animals in food production. Br. Food J. 2014, 116, 1291–1313. [Google Scholar] [CrossRef]
- Wohlers, T.E. The role of risk perception and political culture: A comparative study of regulating genetically modified food. Risk Cognit. 2015, 80, 21–59. [Google Scholar]
- Phillips, D.M.; Hallman, W.K. Consumer risk perceptions and marketing strategy: The case of genetically modified food. Psychol. Market. 2013, 30, 1520–6793. [Google Scholar] [CrossRef]
- Prati, G.; Pietrantoni, L.; Zani, B. The prediction of intention to consume genetically modified food: Test of an integrated psychosocial model. Food Qual. Preference 2012, 25, 163–170. [Google Scholar] [CrossRef]
- Spence, A.; Townsend, E. Examining consumer behavior toward genetically modified (GM) food in Britain. Risk Anal. 2006, 26, 1539–6924. [Google Scholar] [CrossRef] [PubMed]
- Pino, G.; Amatulli, C.; De Angelis, M.; Peluso, A.M. The influence of corporate social responsibility on consumers’ attitudes and intentions toward genetically modified foods: Evidence from Italy. J. Clean. Prod. 2016, 112, 2861–2869. [Google Scholar] [CrossRef]
- Carroll, A.B. The pyramid of corporate social responsibility: Toward the moral management of organizational stakeholders. Bus. Horiz. 1991, 34, 39–48. [Google Scholar] [CrossRef]
- Lozano, R.; Huisingh, D. Inter-Linking issues and dimensions in sustainability reporting. J. Clean. Prod. 2011, 19, 99–107. [Google Scholar] [CrossRef]
- Emirogˇlu, H. Foods produced using biotechnology: How does the law protect consumers? Int. J. Consum. Stud. 2002, 26, 1470–6431. [Google Scholar] [CrossRef]
- Legge, J.S.; Durant, R.F. Public opinion, risk assessment, and biotechnology: Lessons from attitudes toward genetically modified foods in the European Union. Rev. Policy Res. 2010, 27, 59–76. [Google Scholar] [CrossRef]
- Mohr, L.A.; Webb, D.J.; Harris, K.E. Do consumers expect companies to be socially responsible? The impact of corporate social responsibility on buying behavior. J. Consum. Aff. 2001, 35, 1745–6606. [Google Scholar] [CrossRef]
- Bigné, E.; Currás-Pérez, R.; Aldás-Manzano, J. Dual nature of cause-brand fit: Influence on corporate social responsibility consumer perception. Eur. J. Mark. 2012, 46, 575–594. [Google Scholar] [CrossRef]
- Stanaland, A.J.S.; Lwin, M.O.; Murphy, P.E. Consumer perceptions of the antecedents and consequences of corporate social responsibility. J. Bus. Ethics 2011, 102, 47–55. [Google Scholar] [CrossRef]
- Pérez, A.; Rodríguez del Bosque, I. Measuring CSR image: Three studies to develop and to validate a reliable measurement tool. J. Bus. Ethics 2013, 118, 265–286. [Google Scholar] [CrossRef]
- Carroll, A.B. A Three-Dimensional conceptual model of corporate performance. Acad. Manag. Rev. 1979, 4, 497–505. [Google Scholar]
- Van Marrewijk, M. Concepts and definitions of CSR and corporate sustainability: Between agency and communion. J. Bus. Ethics 2003, 44, 95–105. [Google Scholar] [CrossRef]
- Öberseder, M.; Schlegelmilch, B.B.; Murphy, P.E.; Gruber, V. Consumers’ perceptions of corporate social responsibility: Scale development and validation. J. Bus. Ethics 2014, 124, 101–115. [Google Scholar] [CrossRef] [Green Version]
- Luthra, S.; Govindan, K.; Devika, K.; Mangla, S.K.; Garg, C.P. An integrated framework for sustainable supplier selection and evaluation in supply chains. J. Clean. Prod. 2017, 140, 1686–1698. [Google Scholar] [CrossRef]
- Mardani, A.; Jusoh, A.; Zavadskas, E.K.; Cavallaro, F.; Khalifah, Z. Sustainable and renewable energy: An overview of the application of multiple criteria decision making techniques and approaches. Sustainability 2015, 7, 13947–13984. [Google Scholar] [CrossRef]
- Zavadskas, E.K.; Antucheviciene, J.; Turskis, Z.; Adeli, H. Hybrid multiple-criteria decision-making methods: A review of applications in engineering. Sci. Iran 2016, 23, 1–20. [Google Scholar]
- Zavadskas, E.K.; Govindan, K.; Antucheviciene, J.; Turskis, Z. Hybrid multiple criteria decision-making methods: A review of applications for sustainability issues. Econ. Res. Ekon. Istraz. 2016, 29, 857–887. [Google Scholar] [CrossRef]
- Kao, H.P.; Wang, B.; Dong, J.; Ku, K.C. An event-driven approach with makespan/cost tradeoff analysis for project portfolio scheduling. Comput. Ind. 2006, 57, 379–397. [Google Scholar] [CrossRef]
- Chiou, H.K.; Tzeng, G.H.; Cheng, D.C. Evaluating sustainable fishing development strategies using fuzzy MCDM approach. Omega 2005, 33, 223–234. [Google Scholar] [CrossRef]
- Tsai, W.H.; Leu, J.D.; Liu, J.Y.; Lin, S.J.; Shaw, M.J. A MCDM approach for sourcing strategy mix decision in IT projects. Expert Syst. Appl. 2010, 37, 3870–3886. [Google Scholar] [CrossRef]
- Fasanghari, M.; Montazer, G.A. Design and implementation of fuzzy expert system for Tehran Stock Exchange portfolio recommendation. Expert Syst. Appl. 2010, 37, 6138–6147. [Google Scholar] [CrossRef]
- Lee, H.; Kim, C.; Park, Y. Evaluation and management of new service concepts: An ANP-Based portfolio approach. Comput. Ind. Eng. 2010, 58, 535–543. [Google Scholar] [CrossRef]
- Amiri, M.P. Project selection for oil-fields development by using the AHP and fuzzy TOPSIS methods. Expert Syst. Appl. 2010, 37, 6218–6224. [Google Scholar] [CrossRef]
- Ho, W.R.J.; Tsai, C.L.; Tzeng, G.H.; Fang, S.K. Combined DEMATEL technique with a novel MCDM model for exploring portfolio selection based on CAPM. Expert Syst. Appl. 2011, 38, 16–25. [Google Scholar]
- Jiang, Z.; Zhang, H.; Sutherland, J.W. Development of multi-criteria decision making model for remanufacturing technology portfolio selection. J. Clean. Prod. 2011, 19, 1939–1945. [Google Scholar] [CrossRef]
- Bhattacharyya, R.; Kumar, P.; Kar, S. Fuzzy R&D portfolio selection of interdependent projects. Comput. Math. Appl. 2011, 62, 3857–3870. [Google Scholar]
- Özkır, V.; Demirel, T. A fuzzy assessment framework to select among transportation investment projects in Turkey. Expert Syst. Appl. 2012, 39, 74–80. [Google Scholar] [CrossRef]
- Ghapanchi, A.H.; Tavana, M.; Khakbaz, M.H.; Low, G. A methodology for selecting portfolios of projects with interactions and under uncertainty. Int. J. Proj. Manag. 2012, 30, 791–803. [Google Scholar] [CrossRef]
- Bilbao-Terol, A.; Arenas-Parra, M.; Cañal-Fernández, V. Selection of socially responsible portfolios using goal programming and fuzzy technology. Inf. Sci. 2012, 189, 110–125. [Google Scholar] [CrossRef]
- Khalili-Damghani, K.; Sadi-Nezhad, S. A decision support system for fuzzy multi-objective multi-period sustainable project selection. Comput. Ind. Eng. 2013, 64, 1045–1060. [Google Scholar] [CrossRef]
- Aragonés-Beltrán, P.; Chaparro-González, F.; Pastor-Ferrando, J.P.; Pla-Rubio, A. An AHP (Analytic Hierarchy Process)/ANP (Analytic Network Process)-based multi-criteria decision approach for the selection of solar-thermal power plant investment projects. Energy 2014, 66, 222–238. [Google Scholar] [CrossRef]
- Lim, S.; Oh, K.W.; Zhu, J. Use of DEA cross-efficiency evaluation in portfolio selection: An application to Korean stock market. Eur. J. Op. Res. 2014, 236, 361–368. [Google Scholar] [CrossRef]
- An, D.; Yang, Y.; Chai, X.; Xi, B.; Dong, L.; Ren, J. Mitigating pollution of hazardous materials from WEEE of China: Portfolio selection for a sustainable future based on multi-criteria decision making. Resour. Conserv. Recycl. 2015, 105, 198–210. [Google Scholar] [CrossRef]
- Jeng, D.J.F.; Huang, K.H. Strategic project portfolio selection for national research institutes. J. Bus. Res. 2015, 68, 2305–2311. [Google Scholar] [CrossRef]
- Aliakbari Nouri, F.; Khalili Esbouei, S.; Antucheviciene, J. A hybrid MCDM approach based on fuzzy ANP and fuzzy TOPSIS for technology selection. Information 2015, 26, 369–388. [Google Scholar]
- Turskis, Z.; Zavadskas, E.K.; Antucheviciene, J.; Kosareva, N. A hybrid model based on fuzzy AHP and fuzzy WASPAS for construction site selection. Int. J. Comput. Commun. Contr. 2015, 10, 873–888. [Google Scholar] [CrossRef]
- Pourahmad, A.; Hosseini, A.; Banaitis, A.; Nasiri, H.; Banaitiene, N.; Tzeng, G.H. Combination of Fuzzy-AHP and DEMATEL-ANP with GIS in a new hybrid MCDM model used for the selection of the best space for leisure in a blighted urban site. Technol. Econ. Dev. Econ. 2015, 21, 773–796. [Google Scholar] [CrossRef]
- Beheshti, M.; Mandiraji, H.A.; Zavadskas, E.K. Strategy portfolio optimisation: A copras G-MODM hybrid approach. Transform. Bus. Econ. 2016, 15, 500–519. [Google Scholar]
- Valipour, A.; Yahaya, N.; Md Noor, N.; Mardani, A.; Antucheviciene, J. A new hybrid fuzzy cybernetic analytic network process model to identify shared risks in PPP projects. Int. J. Strateg. Prop. Manag. 2016, 20, 409–426. [Google Scholar] [CrossRef]
- Turskis, Z.; Juodagalviene, B. A novel hybrid multi-criteria decision-making model to assess a stairs shape for dwelling houses. J. Civ. Eng. Manag. 2016, 22, 1078–1087. [Google Scholar] [CrossRef]
- Cereska, A.; Zavadskas, E.K.; Cavallaro, F.; Podvezko, V.; Tetsman, I.; Grinbergiene, I. Sustainable assessment of aerosol pollution decrease applying multiple attribute decision-making methods. Sustainability 2016, 8, 586. [Google Scholar] [CrossRef]
- Yang, C.H.; Lee, K.C.; Chen, H.C. Incorporating carbon footprint with activity-based costing constraints into sustainable public transport infrastructure project decisions. J. Clean. Prod. 2016, 133, 1154–1166. [Google Scholar] [CrossRef]
- Rodríguez, A.; Ortega, F.; Concepción, R. An intuitionistic method for the selection of a risk management approach to information technology projects. Inf. Sci. 2017, 375, 202–218. [Google Scholar] [CrossRef]
- Valipour, A.; Yahaya, N.; Md Noor, N.; Antucheviciene, J.; Tamosaitiene, J. Hybrid SWARA-COPRAS method for risk assessment in deep foundation excavation project: An Iranian case study. J. Civ. Eng. Manag. 2017, 23, 524–532. [Google Scholar] [CrossRef]
- Büyüközkan, G.; Karabulut, Y. Energy project performance evaluation with sustainability perspective. Energy 2017, 119, 549–560. [Google Scholar] [CrossRef]
- Bansal, P.; Song, H.C. Similar but not the same: Differentiating corporate sustainability from corporate responsibility. Acad. Manag. Ann. 2017, 11, 105–149. [Google Scholar] [CrossRef]
- Swanson, D.L. Addressing a theoretical problem by reorienting the corporate social performance model. Acad. Manag. Rev. 1995, 20, 43–64. [Google Scholar]
- Miles, S.; Ueland, Q.; Frewer, L.J. Public attitudes towards genetically-modified food. Br. Food J. 2005, 107, 246–262. [Google Scholar] [CrossRef]
- Wu, D.; Aasaraai, K.; Moshovos, A. Low-cost, high-performance branch predictors for soft processors. In In Proceedings of the 23rd International Conference on Field programmable Logic and Applications, Porto, Portugal, 2–4 September 2013. [Google Scholar]
- World Business Council for Sustainable Development. Corporate Social Responsibility (CSR). 2006. Available online: http://www.wbcsd.org/work-program/business-role/previous-work/corporate-social-responsibility.aspx (accessed on 1 April 2015).
- MacDonald, C.; Whellams, M. Corporate decisions about labelling genetically modified foods. J. Bus. Ethics 2007, 75, 181–189. [Google Scholar] [CrossRef]
- Wolf, M.M.; Bertolini, P.; Parker-Garcia, J. 12 a comparison of consumer attitudes towards GM food in Italy and the USA. In Consumer Acceptance of Genetically Modified Foods; CABI: Oxfordshire, UK, 2004. [Google Scholar]
- Bai, C.; Sarkis, J. A grey-based DEMATEL model for evaluating business process management critical success factors. Int. J. Prod. Econ. 2013, 146, 281–292. [Google Scholar] [CrossRef]
- Tseng, M.L. A causal and effect decision making model of service quality expectation using grey-fuzzy DEMATEL approach. Expert Syst. Appl. 2009, 36, 7738–7748. [Google Scholar] [CrossRef]
- Shen, K.Y.; Tzeng, G.H. Combining DRSA decision-rules with FCA-Based DANP evaluation for financial performance improvements. Technol. Econ. Dev. Econ. 2016, 22, 685–714. [Google Scholar] [CrossRef]
- Chen, F.H.; Tzeng, G.H.; Chang, C.C. Evaluating the enhancement of corporate social responsibility websites quality based on a new hybrid MADM model. Int. J. Inf. Technol. Decis. Mak. 2015, 14, 697–724. [Google Scholar] [CrossRef]
- Pamučar, D.; Ćirović, G. The selection of transport and handling resources in logistics centers using Multi-Attributive Border Approximation area Comparison (MABAC). Expert Syst. Appl. 2015, 42, 3016–3028. [Google Scholar]
- Mardani, A.; Zavadskas, E.K.; Govindan, K.; Senin, A.A.; Jusoh, A. VIKOR technique: A systematic review of the state of the art literature on methodologies and applications. Sustainability 2016, 8, 37. [Google Scholar] [CrossRef] [Green Version]
- Zavadskas, E.K.; Mardani, A.; Turskis, Z.; Jusoh, A.; Nor MD, K. Development of TOPSIS method to solve complicated decision-making problems–An overview on developments from 2000 to 2015. Int. J. Inf. Technol. Decis. Mak. 2016, 15, 645–682. [Google Scholar] [CrossRef]
- Xue, Y.X.; You, J.X.; Lai, X.D.; Liu, H.C. An interval-valued intuitionistic fuzzy MABAC approach for material selection with incomplete weight information. Appl. Soft Comput. 2016, 38, 703–713. [Google Scholar] [CrossRef]
- Yu, S.M.; Wang, J.; Wang, J.Q. An interval type-2 fuzzy likelihood-based MABAC approach and its application in selecting hotels on a tourism website. Int. J. Fuzzy Sys. 2016, 19, 1–15. [Google Scholar] [CrossRef]
- Roy, J.; Chatterjee, K.; Bandhopadhyay, A.; Kar, S. Evaluation and Selection of Medical Tourism Sites: A Rough AHP Based MABAC Approach. 2016. Available online: https://arxiv.org/ftp/arxiv/papers/1606/1606.08962v2.pdf (accessed on 24 July 2017).
- Roy, J.; Ranjan, A.; Debnath, A.; Kar, S. An Extended MABAC for Multi-Attribute Decision Making Using Trapezoidal Interval Type-2 Fuzzy Numbers. 2016. Available online: https://arxiv.org/pdf/1607.01254v4.pdf (accessed on 24 July 2017).
- Shi, H.; Liu, H.C.; Li, P.; Xu, X.G. An integrated decision making approach for assessing healthcare waste treatment technologies from a multiple stakeholder. Waste Manag. 2017, 59, 508–517. [Google Scholar] [CrossRef] [PubMed]
- Gigović, L.; Pamučar, D.; Bajić, Z.; Milićević, M. The combination of expert judgment and GIS-MAIRCA analysis for the selection of sites for ammunition depots. Sustainability 2016, 8, 372. [Google Scholar] [CrossRef]
- Xia, X.; Govindan, K.; Zhu, Q. Analyzing internal barriers for automotive parts remanufacturers in China using grey-DEMATEL approach. J. Clean. Prod. 2015, 87, 811–825. [Google Scholar] [CrossRef]
- Memon, M.S.; Lee, Y.H.; Mari, S.I. Group multi-criteria supplier selection using combined grey systems theory and uncertainty theory. Expert Syst. Appl. 2015, 42, 7951–7959. [Google Scholar] [CrossRef]
- Govindan, K.; Khodaverdi, R.; Vafadarnikjoo, A. A grey DEMATEL approach to develop third-party logistics provider selection criteria. Ind. Manag. Data Syst. 2016, 116, 690–722. [Google Scholar] [CrossRef]
- Liou, J.J.H.; Tamosaitiene, J.; Zavadskas, E.K.; Tzeng, G.H. New hybrid COPRAS-G MADM model for improving and selecting suppliers in green supply chain management. Int. J. Prod. Res. 2016, 54, 114–134. [Google Scholar] [CrossRef]
- Grinstead, C.M.; Snell, J.L. Introduction to Probability; American Mathematical Society: Providence, RI, USA, 2012. [Google Scholar]
- Zhang, J.; Wu, D.; Olson, D.L. The method of grey related analysis to multiple attribute decision making problems with interval numbers. Math. Comput. Model. 2005, 42, 991–998. [Google Scholar] [CrossRef]
- Yang, Y.P.O.; Shieh, H.M.; Leu, J.D.; Tzeng, G.H. A novel hybrid MCDM model combined with DEMATEL and ANP with applications. Int. J. Oper. Res. 2008, 5, 160–168. [Google Scholar]
- Dalalah, D.; Hayajneh, M.; Batieha, F. A fuzzy multi-criteria decision making model for supplier selection. Expert Syst. Appl. 2011, 38, 8384–8391. [Google Scholar] [CrossRef]
- Creswell, J.W. A Concise Introduction to Mixed Methods Research; Sage Publications: London, UK, 2014. [Google Scholar]
- Cinelli, M.; Coles, S.R.; Sadik, O.; Karn, B.; Kirwan, K. A framework of criteria for the sustainability assessment of nanoproducts. J. Clean. Prod. 2016, 126, 277–287. [Google Scholar] [CrossRef]
- Alexander, D.; Hallowell, M.; Gambatese, J. Precursors of construction fatalities. I: Iterative experiment to test the predictive validity of human judgment. J. Constr. Eng. Manag. 2017, 143, 04017023. [Google Scholar] [CrossRef]
- Deng, W.J. Fuzzy importance-performance analysis for determining critical service attributes. Int. J. Serv. Ind. Manag. 2008, 19, 252–270. [Google Scholar] [CrossRef]
- Oztaysi, B. A decision model for information technology selection using AHP integrated TOPSIS-Grey: The case of content management systems. Knowl. Based Syst. 2014, 70, 44–54. [Google Scholar] [CrossRef]
- Çelikbilek, Y.; Tüysüz, F. An integrated grey based multi-criteria decision making approach for the evaluation of renewable energy sources. Energy 2016, 115, 1246–1258. [Google Scholar] [CrossRef]
- Moghassem, A.R. Comparison among two analytical methods of multi-criteria decision making for appropriate spinning condition selection. World Appl. Sci. J. 2013, 21, 784–794. [Google Scholar]
- Li, G.D.; Yamaguchi, D.; Nagai, M. A grey-based decision-making approach to the supplier selection problem. Math. Comput. Model. 2007, 46, 573–581. [Google Scholar] [CrossRef]
Figure 1.
Projected research framework to evaluate strategic project portfolio of by-products for socially responsible National Agro Research Institutes.
Figure 1.
Projected research framework to evaluate strategic project portfolio of by-products for socially responsible National Agro Research Institutes.

Figure 2.
Hierarchical framework for evaluating criteria and SPPS of by products for socially responsible National Agro Research Institutes.
Figure 2.
Hierarchical framework for evaluating criteria and SPPS of by products for socially responsible National Agro Research Institutes.
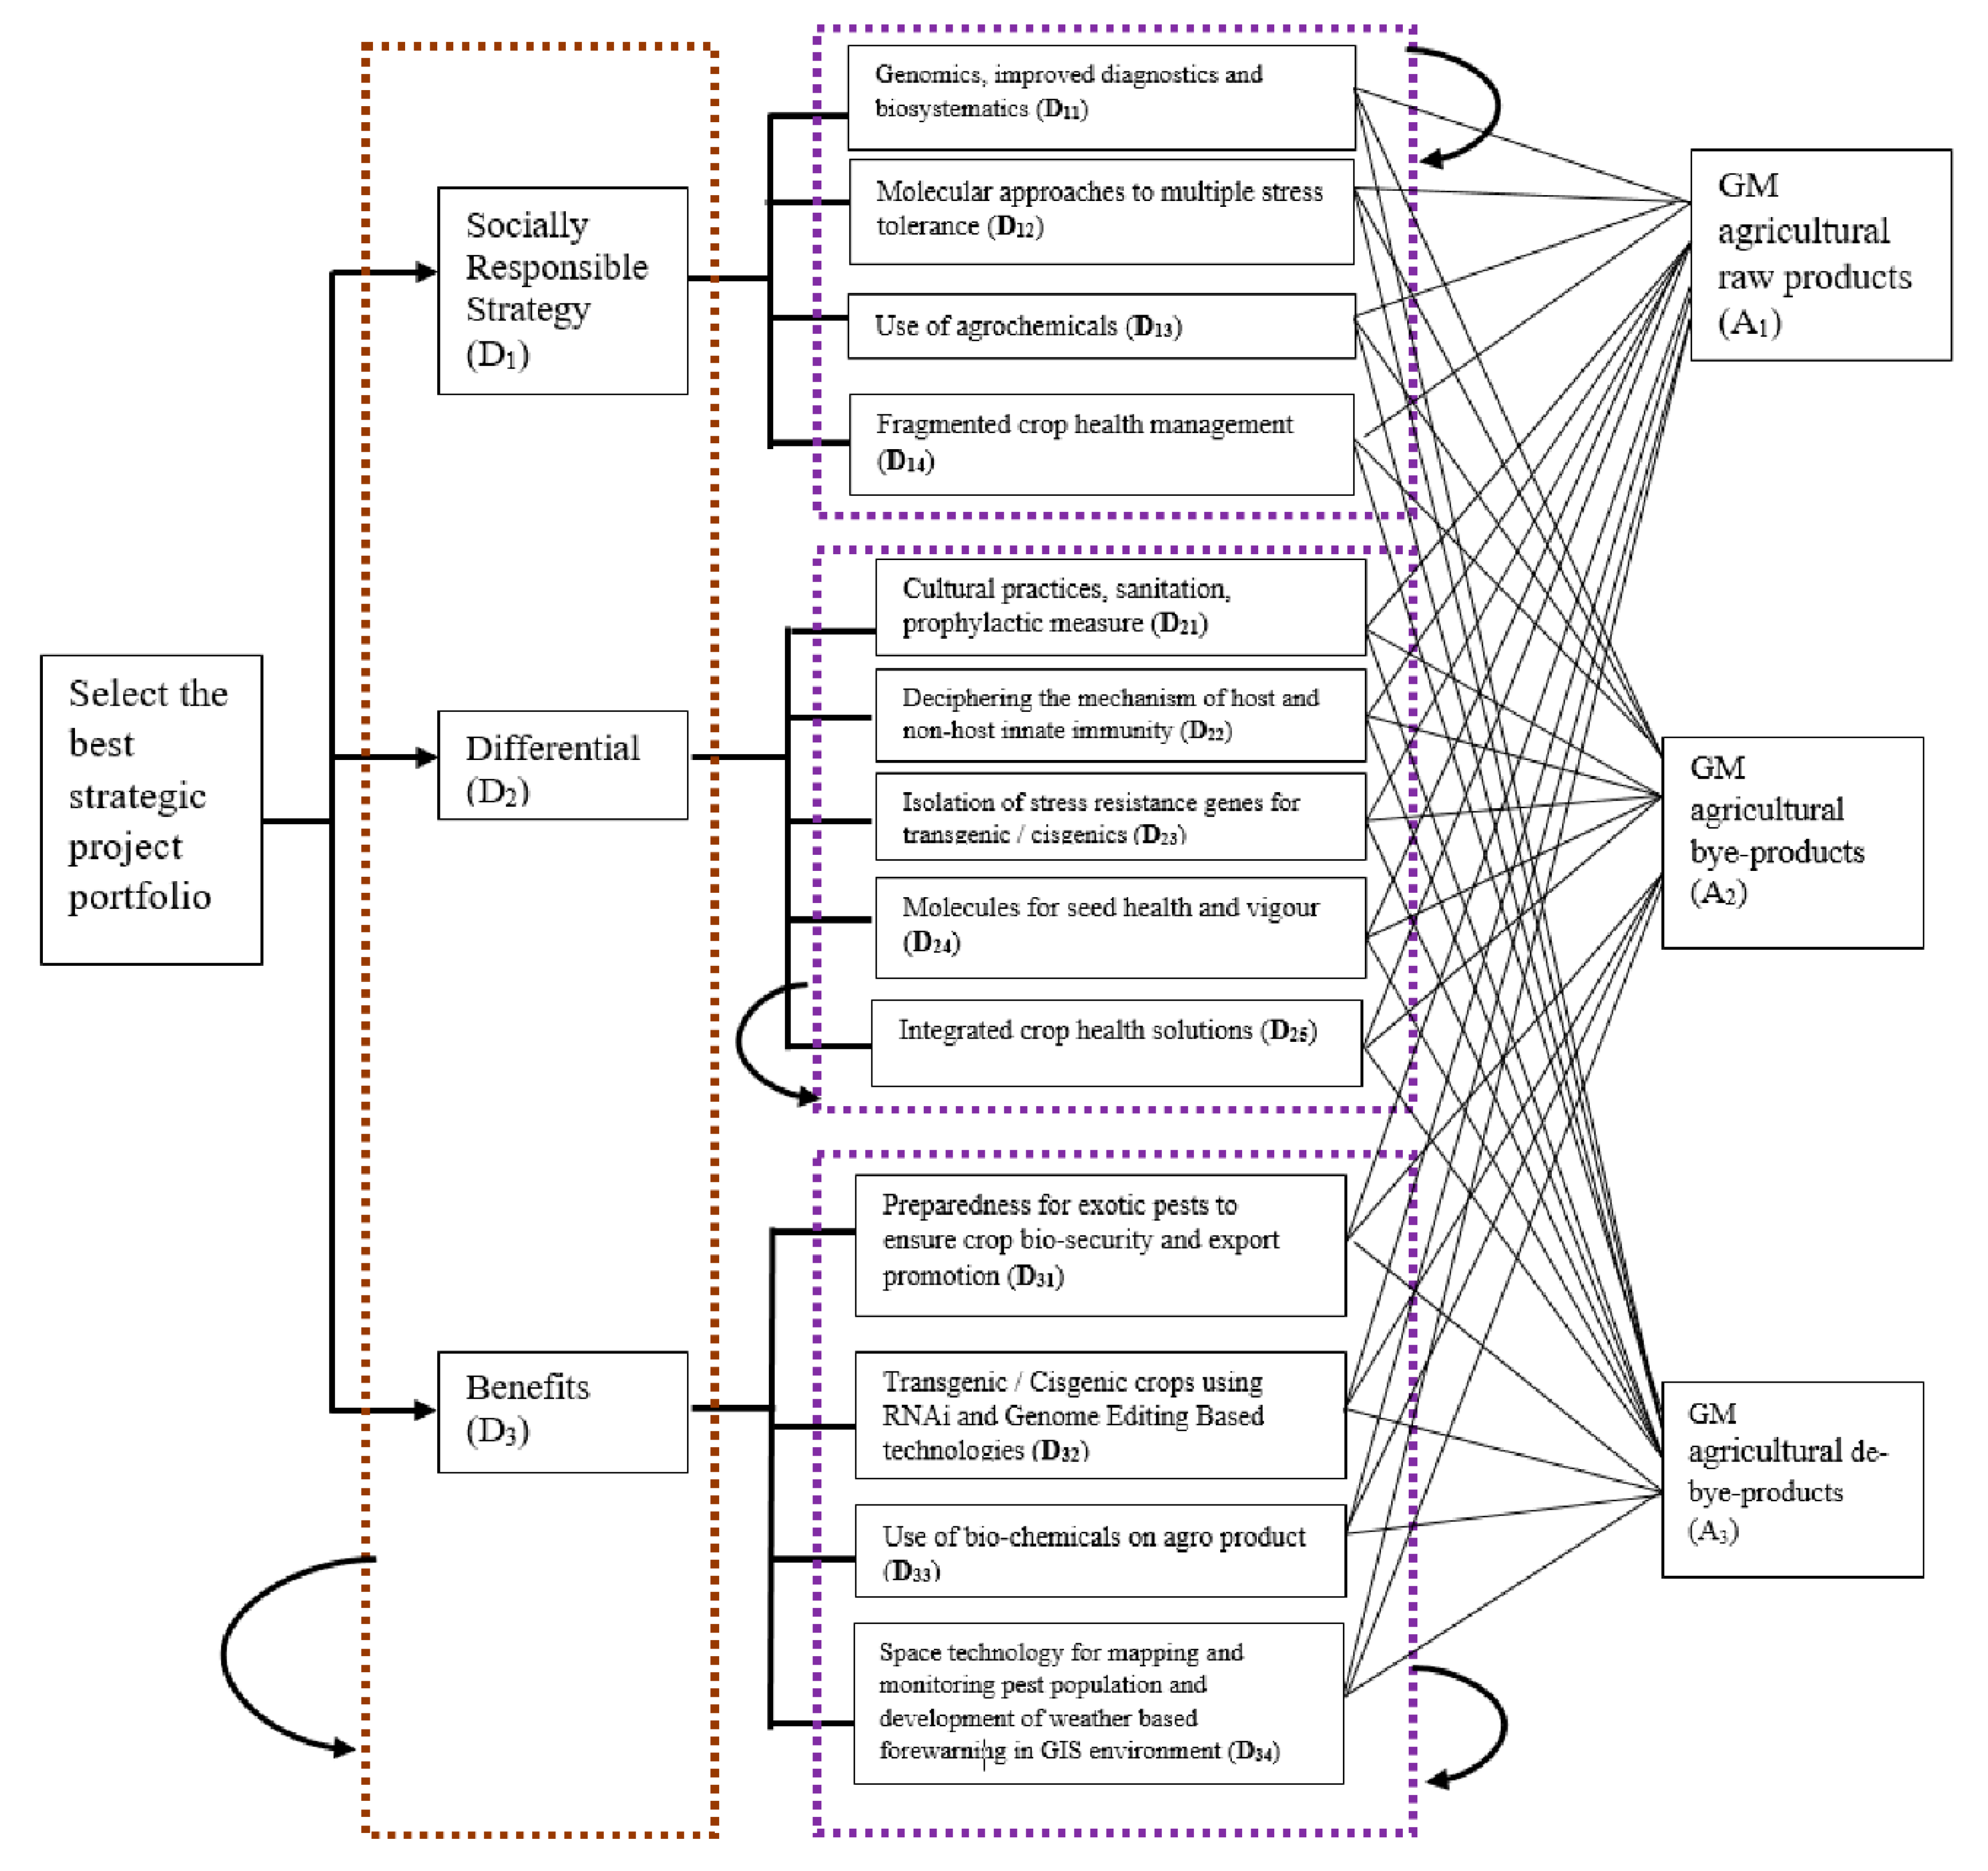
Figure 3.
Overall grey DEMATEL prominence–causal relationship diagram (The impact-relation map and inter-influential map of SPPS dimensions and criteria).
Figure 3.
Overall grey DEMATEL prominence–causal relationship diagram (The impact-relation map and inter-influential map of SPPS dimensions and criteria).
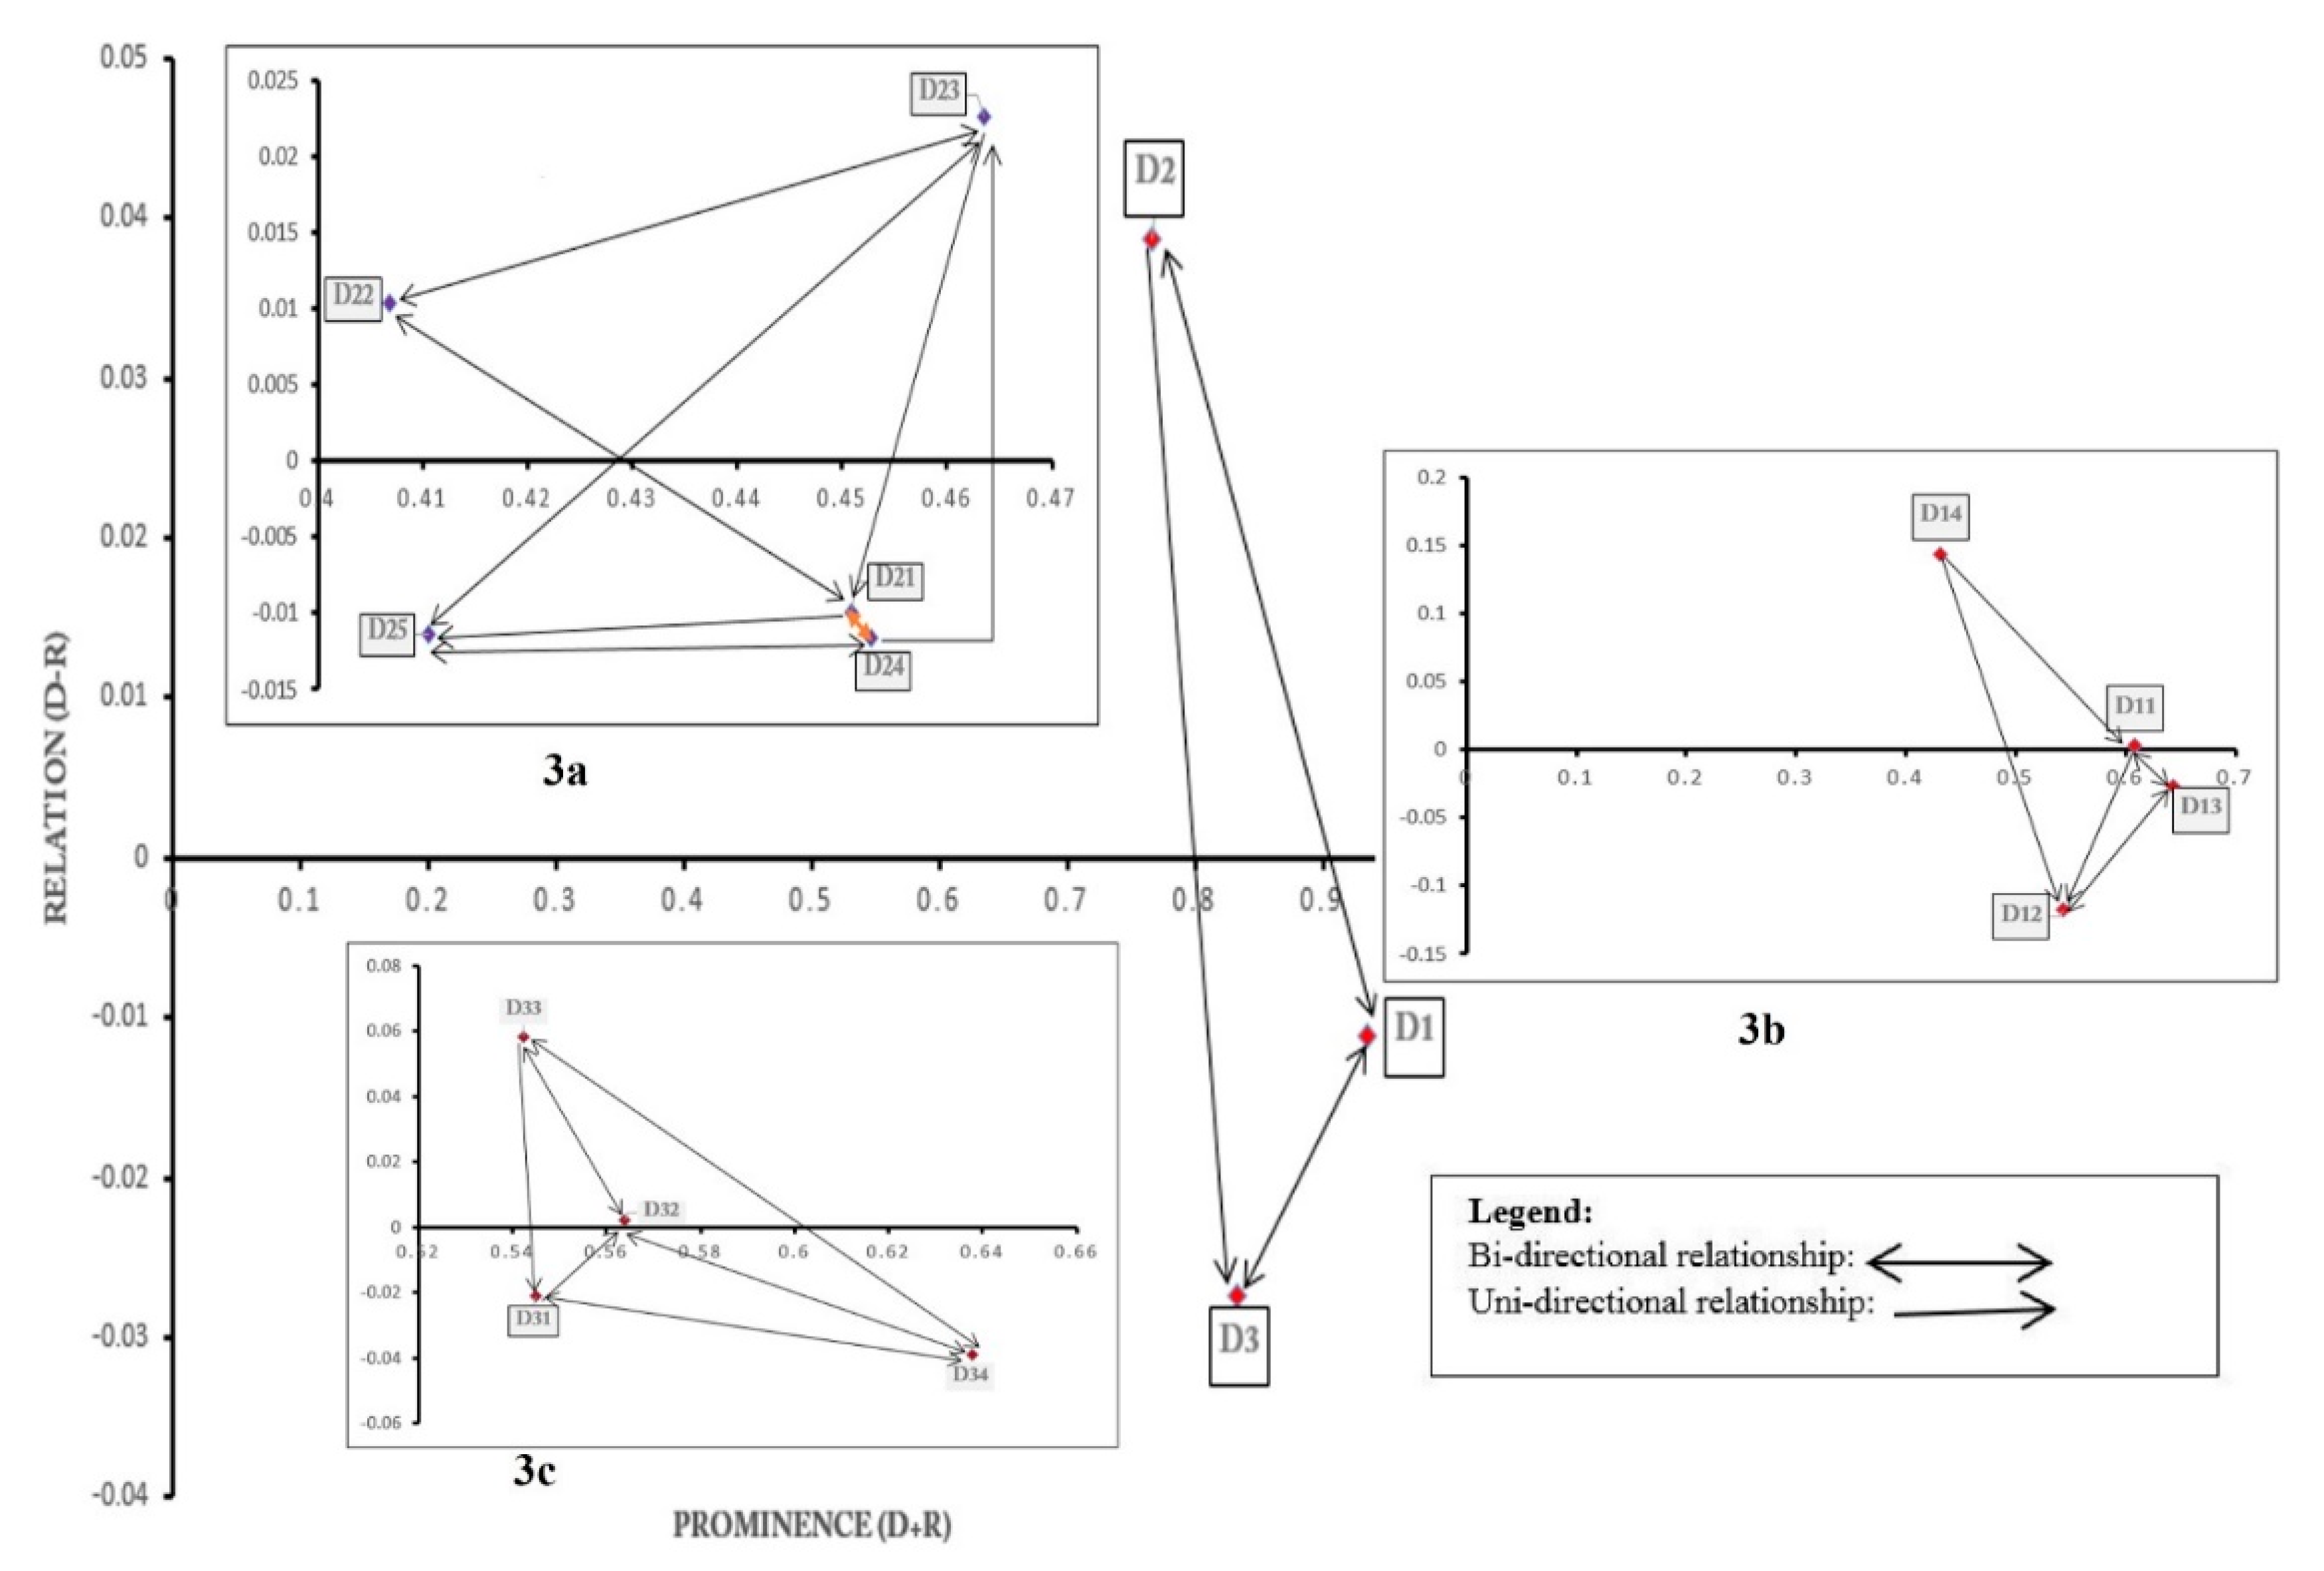
Figure 4.
Results of grey Multi-Attributive Border Approximation area Comparison (MABAC) evaluation.
Figure 4.
Results of grey Multi-Attributive Border Approximation area Comparison (MABAC) evaluation.

Figure 5.
Consequences of sensitivity analysis.


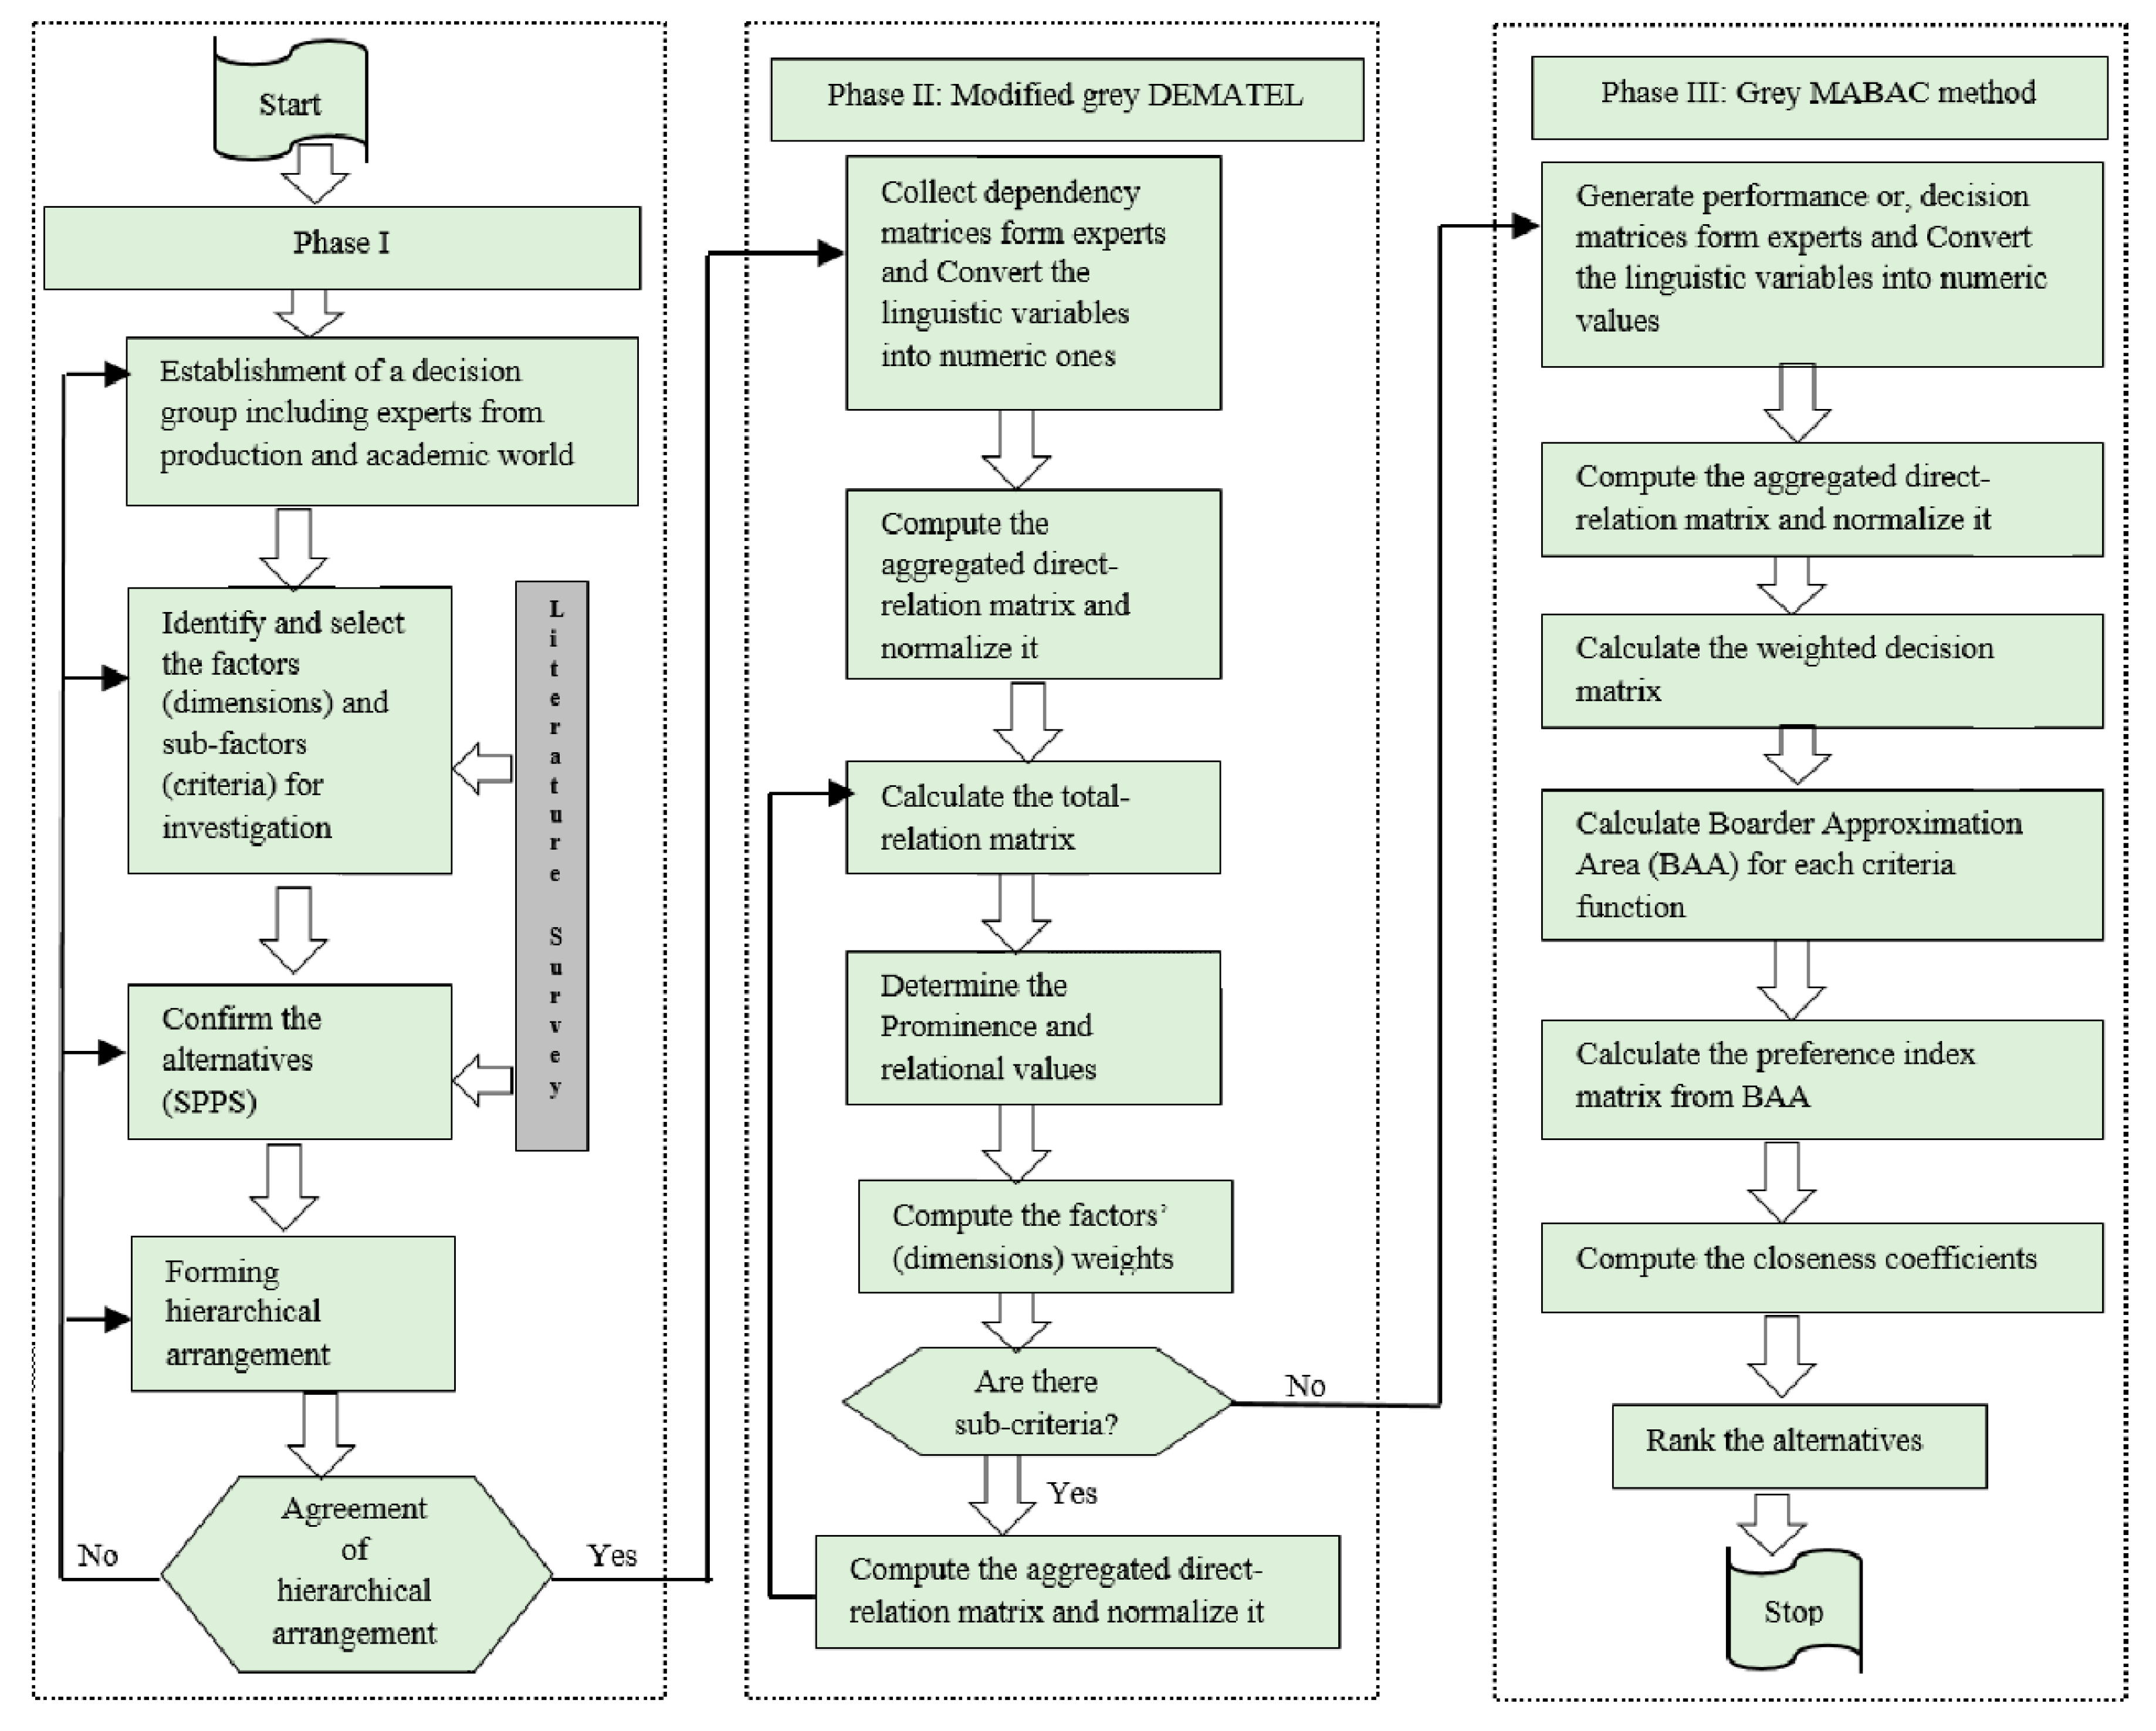
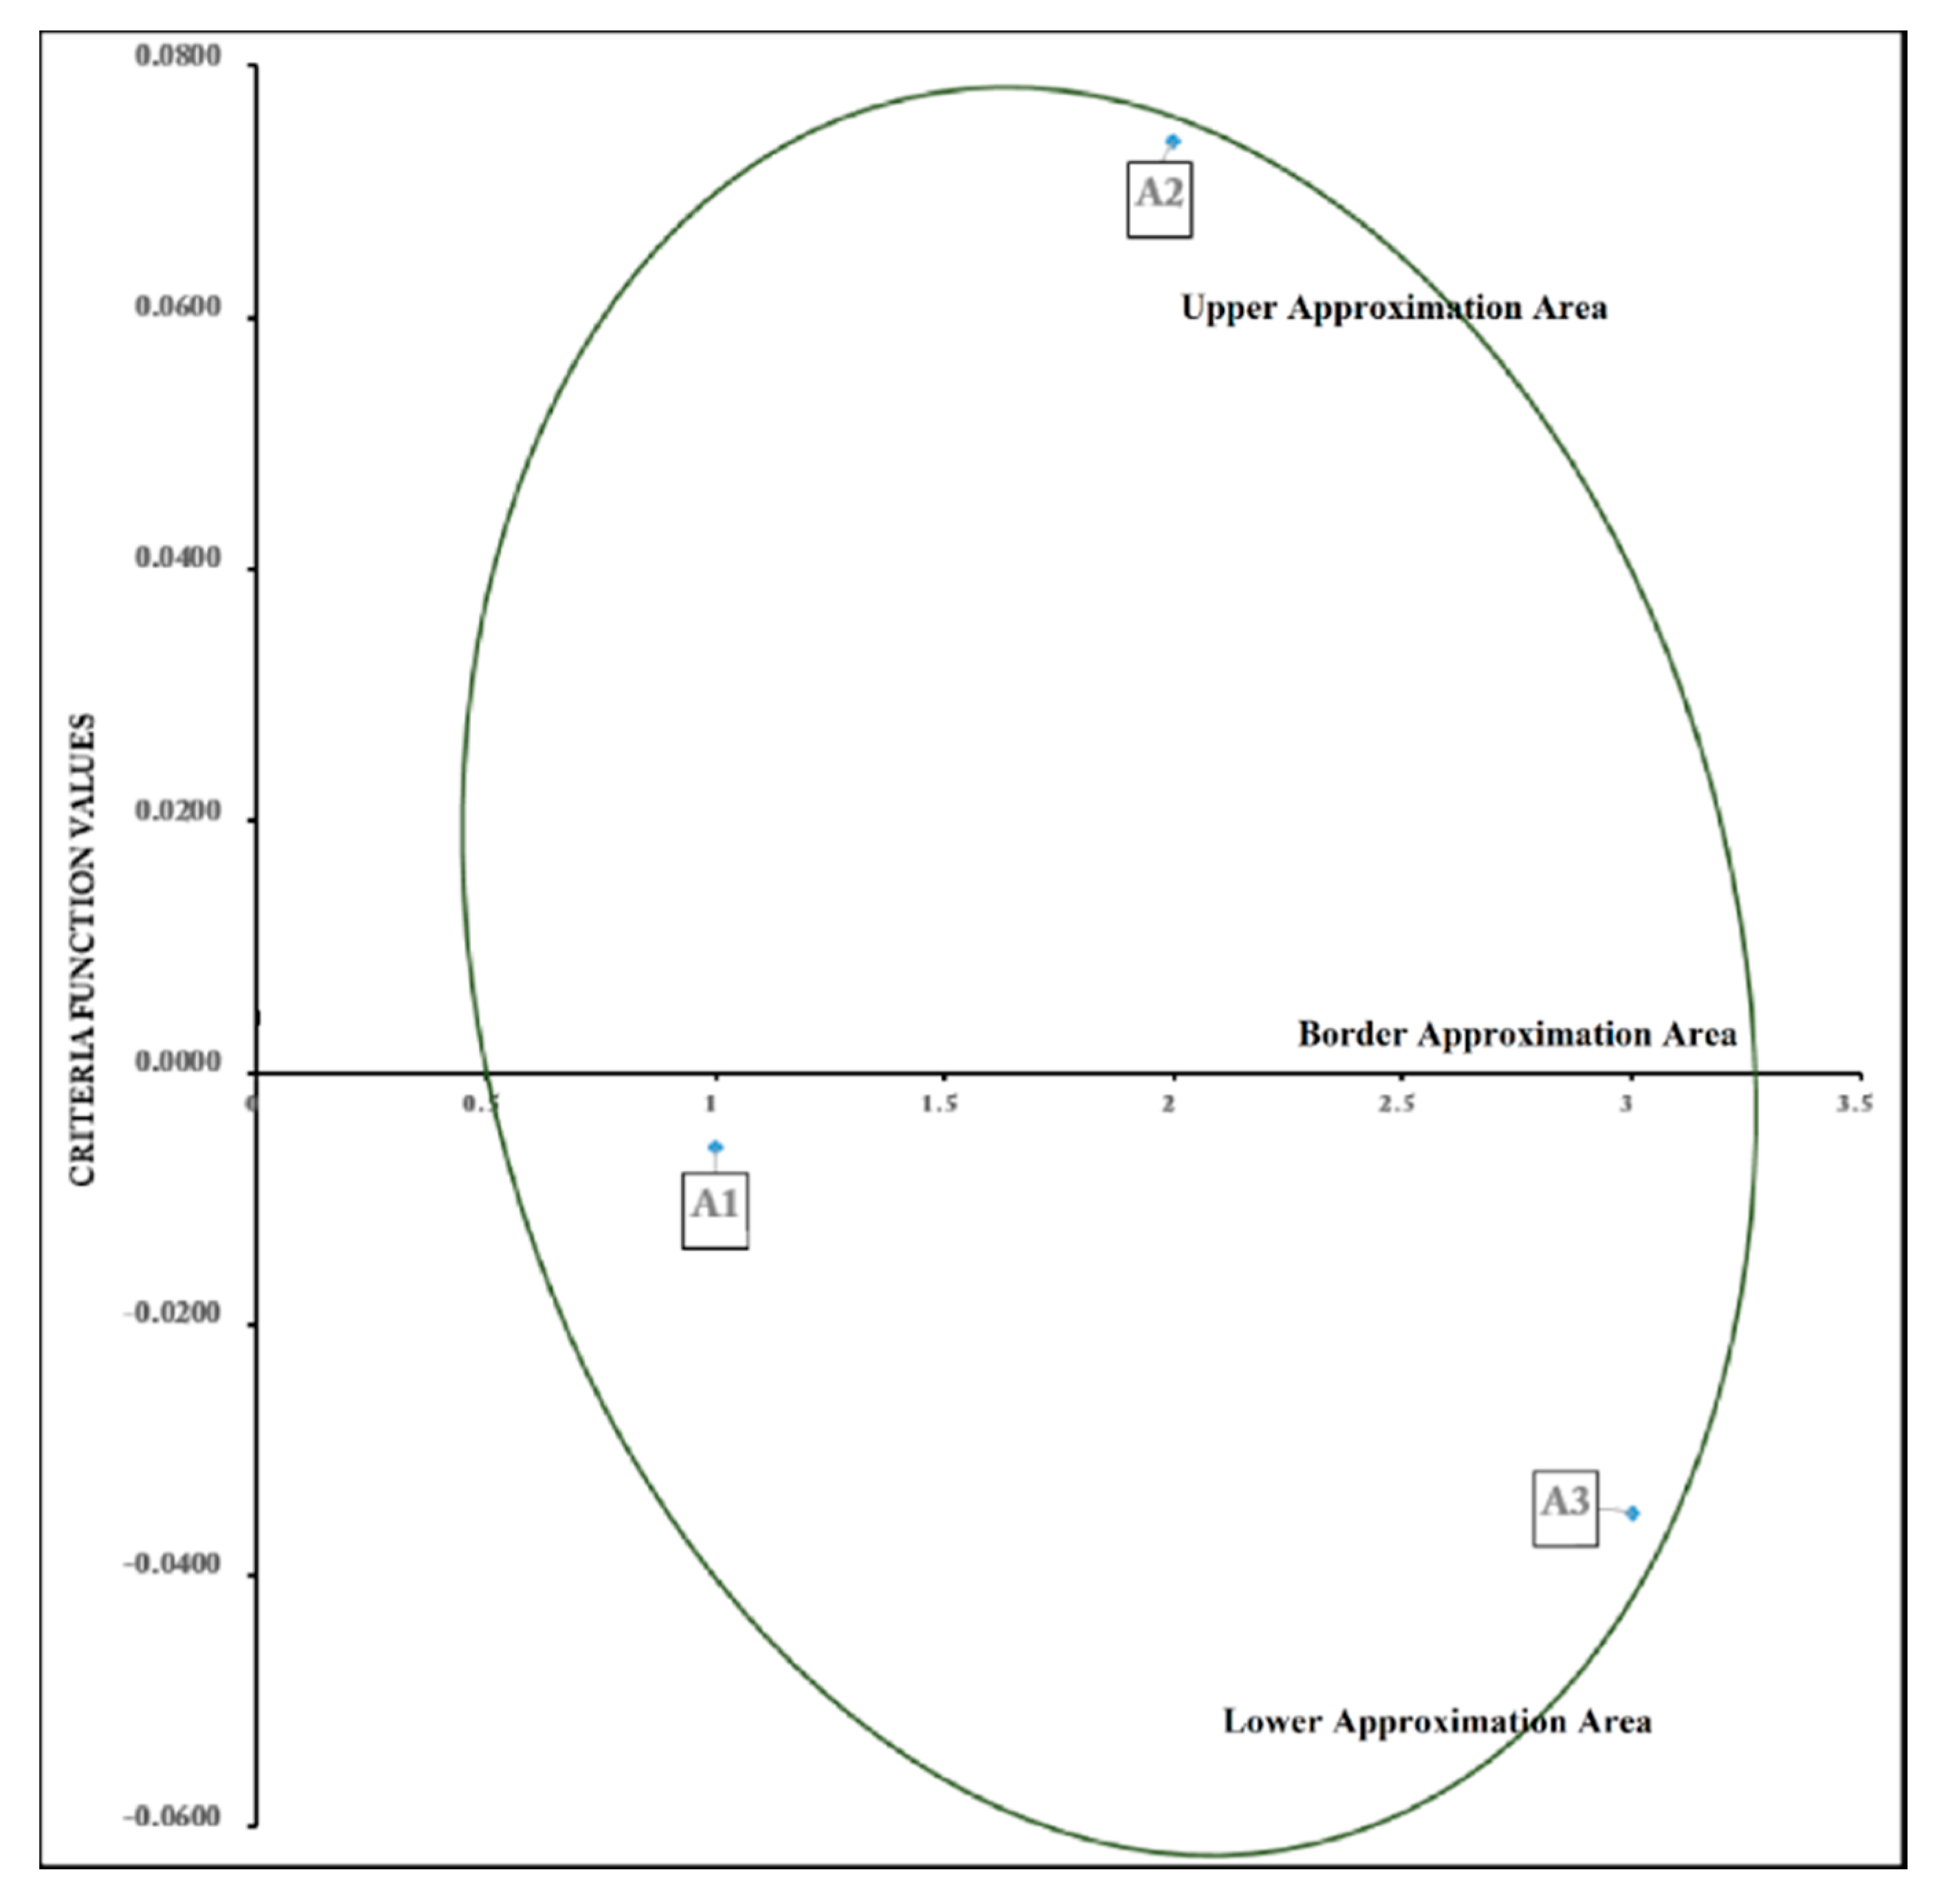
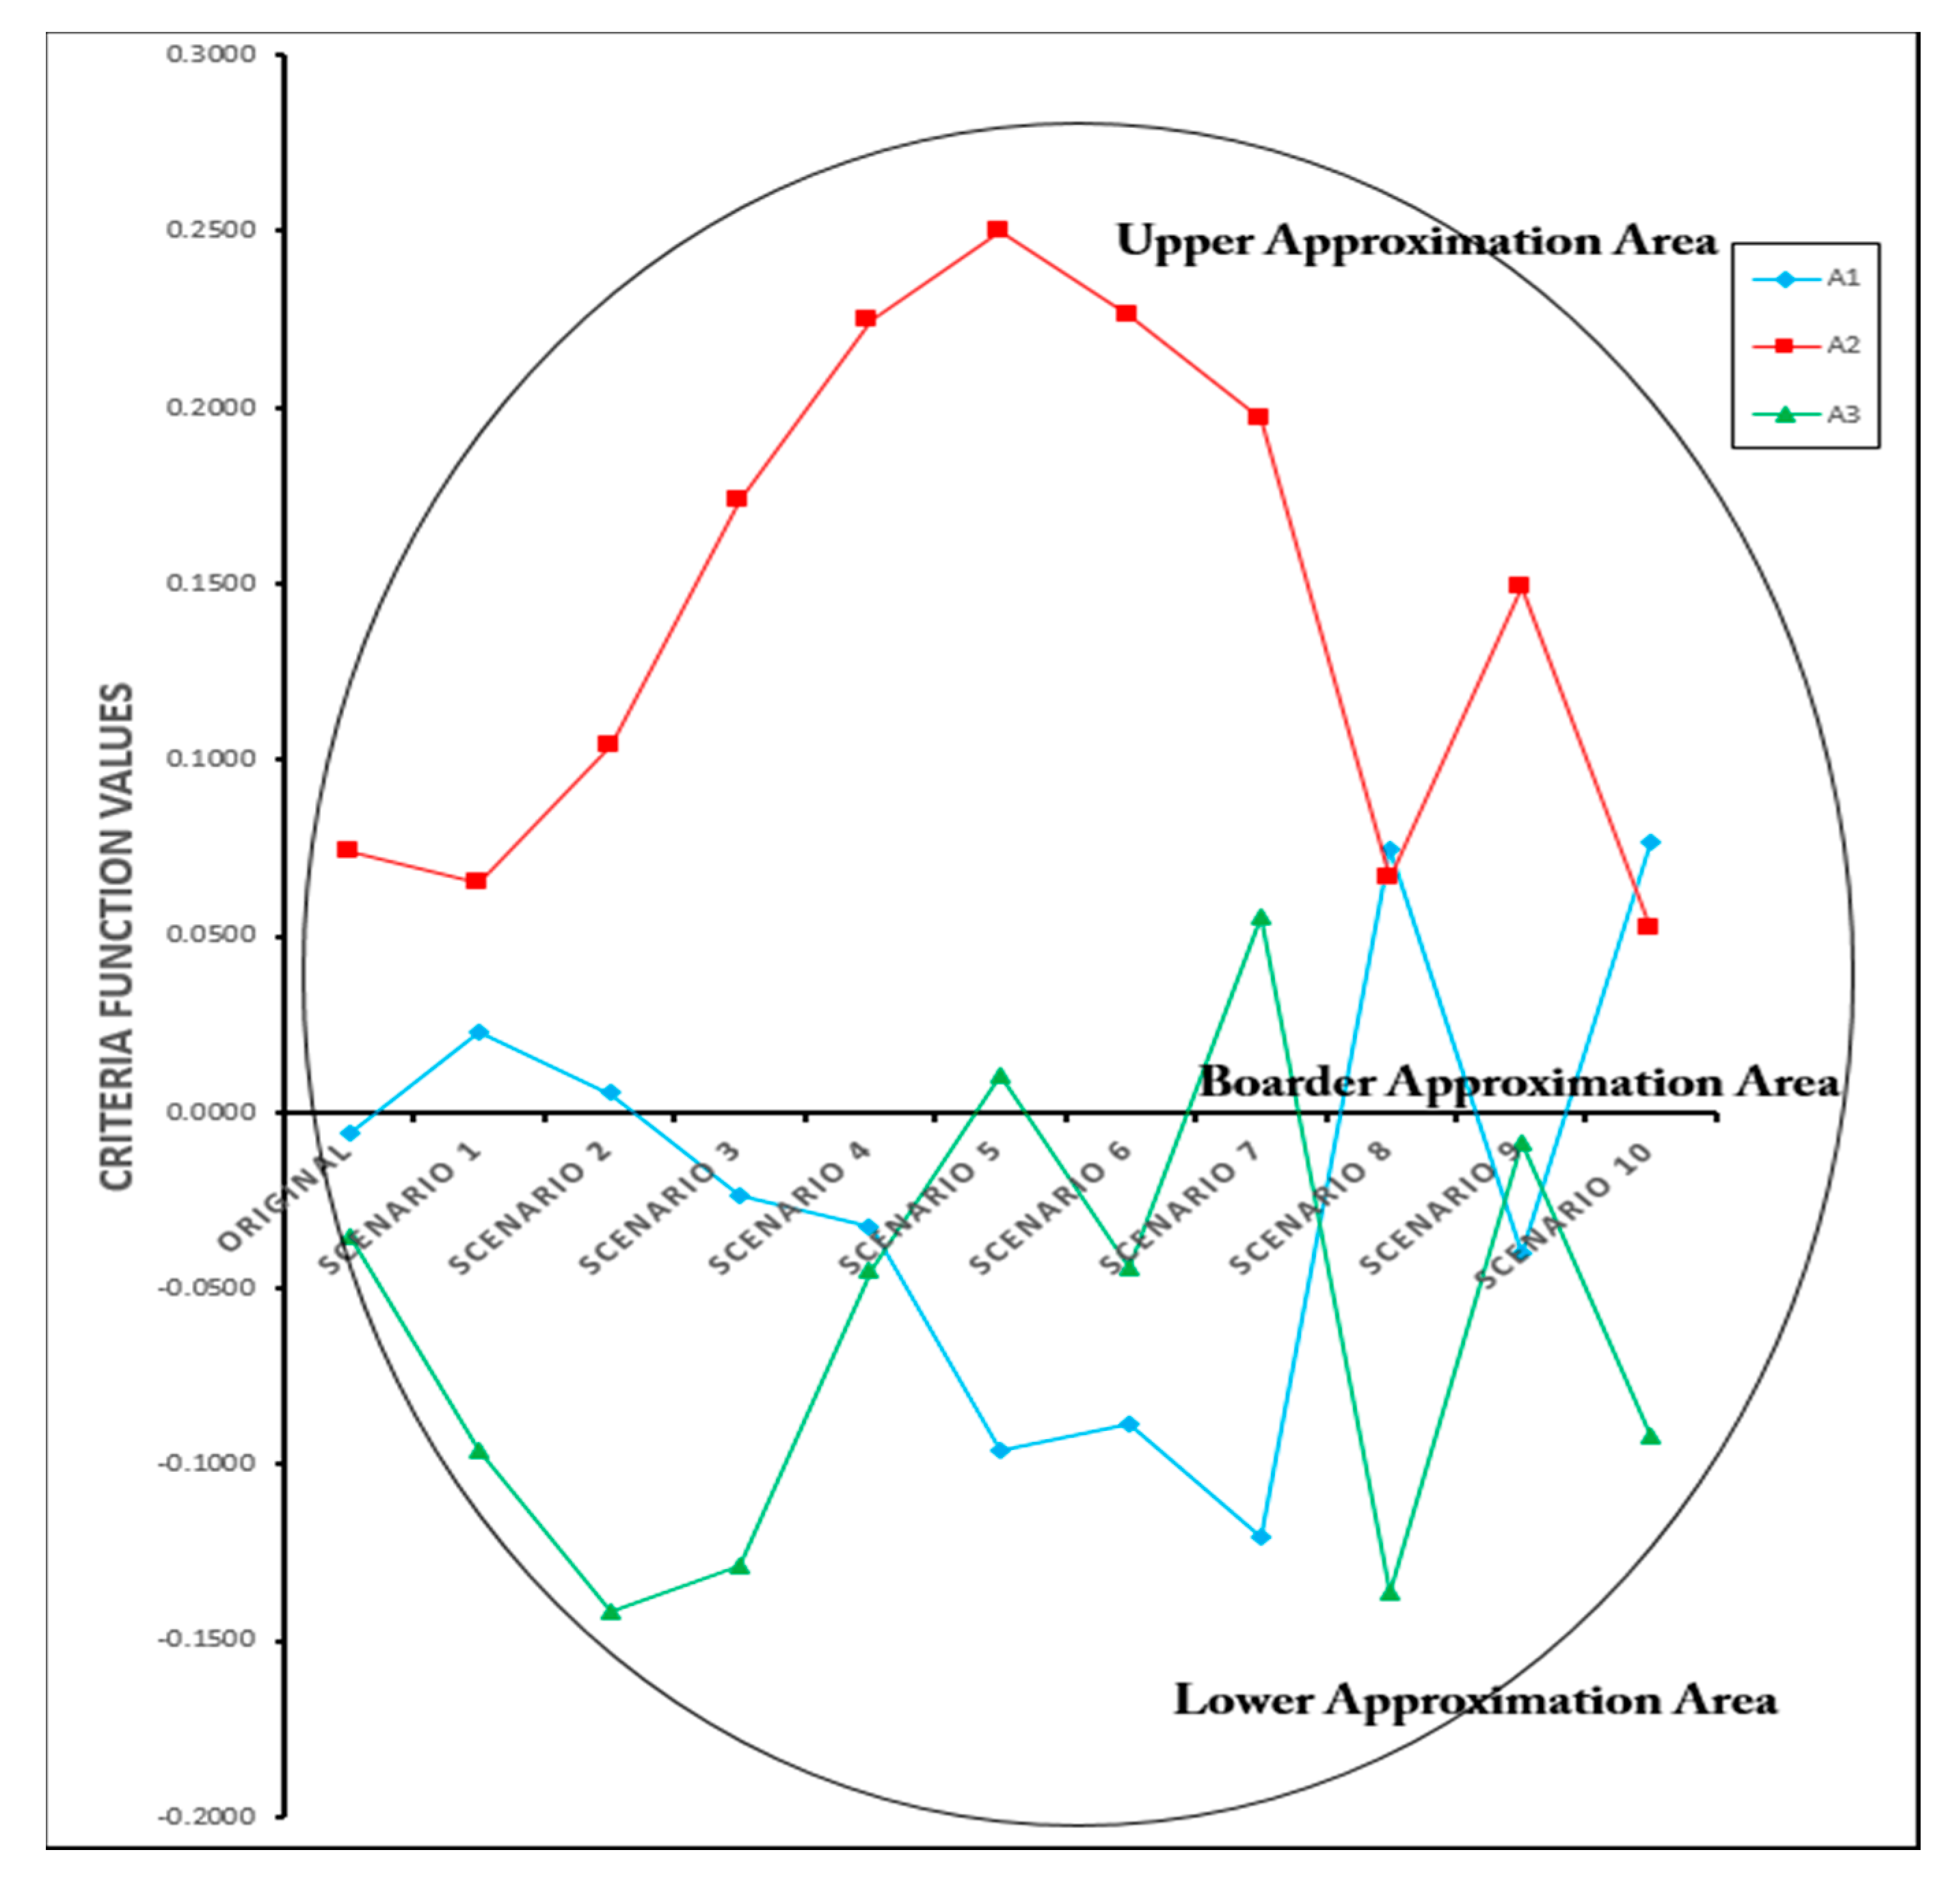
Table 1.
Summary of the methodologies/techniques by various researchers and practitioners in strategic project portfolio selection (SPPS).
Table 1.
Summary of the methodologies/techniques by various researchers and practitioners in strategic project portfolio selection (SPPS).
| Authors | MCDM Methods | Case Study |
|---|---|---|
| Kao et al. [32] | High Level Petri nets; Activity-Based Costing; TOPSIS | Event-driven approach to develop a tradeoff decision framework for project portfolio scheduling and rescheduling. |
| Chiou et al. [33] | Fuzzy AHP | Evaluating sustainable fishing development strategies. |
| Tsai et al. [34] | DEMATEL, ANP, Zero-One Goal Programing | Evaluate sourcing decision strategy in IT projects and ensure that tasks can be assigned appropriately. |
| Fasanghari and Montazer [35] | Fuzzy inference engine, Fuzzy Delphi | Design and implementation of fuzzy expert system for Tehran Stock Exchange portfolio recommendation. |
| Lee et al. [36] | ANP | Evaluation and management of new service concepts |
| Amiri [37] | AHP, Fuzzy TOPSIS | Project selection for oil-fields development. |
| Ho et al. [38] | DEMATEL, VIKOR, CAPM | Establish an investment decision model and provides investors with a reference of portfolio selection most suitable for investing effects to achieve the greatest returns. |
| Jiang et al. [39] | AHP | The model considers remanufacturing technology portfolios. To help enterprises for selecting and implementing remanufacturing technology economically and effectively. |
| Bhattacharyya et al. [40] | Multiple objective GA | Fuzzy R&D portfolio selection of interdependent projects. |
| Özkır and Demirel [41] | Fuzzy AHP Fuzzy LP | Selecting the best transportation investment project (TIP) is often a difficult task, since many social, environmental and economic criteria have to be considered simultaneously. |
| Ghapanchi et al. [42] | Fuzzy DEA | Effective project evaluation and selection strategies can directly impact organizational productivity and profitability |
| Bilbao-Terol et al. [43] | Goal Programming, Fuzzy Set Theory | Selection of Socially Responsible Portfolios (mutual funds). |
| Khalili-Damghani and Sadi-Nezhad [44] | TOPSIS, fuzzy goal Programming, Fuzzy inference systems | Sustainable project selection based historical data of project selection of an Iranian financial and credit institute. |
| Aragonés-Beltrán et al. [45] | AHP, ANP | Selection of solar-thermal power plant investment projects |
| Lim et al. [46] | DEA, Cross-efficiency | Stock portfolio selection in the Korean stock market. |
| An et al. [47] | Interval numbers, AHP, VIKOR | China’s stakeholders to select the most efficacious portfolio for solving the severe problems caused by the informal e-waste recycling and promote the development of China’s WEEE recycling industry in a sustainable approach. |
| Jeng and Huang [48] | DEMATEL, ANP | Strategic project portfolio selection for national research institutes. |
| AliakbariNouri et al. [49] | Fuzzy ANP, Fuzzy TOPSIS | Selecting advanced manufacturing technology in order to compete in the global environment. |
| Turskis et al. [50] | Fuzzy AHP, Fuzzy WASPAS | Selection the best construction site for shopping center project in Vilnius, Lithuania. |
| Pourahmad et al. [51] | Fuzzy-AHP, DEMATEL-ANP | Hybrid approach by using GIS and MCDM for selecting the best space for leisure in urban site. |
| Beheshti et al. [52] | COPRAS G-MODM | Strategy portfolio optimization applying hybrid approach. |
| Valipour et al. [53] | Fuzzy method and Cybernetic Analytic Network Process (CANP) | Identifying shared risks, controlling and reducing risks on Public-Private Partnership (PPP) project in Iran. |
| Turskis and Juodagalviene [54] | Game Theory, AHP, SAW, TOPSIS, EDAS, ARAS, Full Multiplicative form, Laplace Rule, Bayes Rule | Selection among available shapes and construction ways of architectural elements by applying hybrid methods: a case study of stairs shape assessment for two-story individual dwelling houses. |
| Cereska et al. [55] | VIKOR, COPRAS, CILOS | Demonstrating the effectiveness of the multiple attribute decision-making methods in investigating and solving the environmental pollution problems. |
| Yang et al. [56] | Zero-one goal programming | To facilitate an optimal portfolio of sustainable public transport infrastructure projects in Taiwan. |
| Rodríguez et al. [57] | Fuzzy AHP | Selection of a risk management approach to information technology projects. |
| Valipour et al. [58] | SWARA-COPRAS | Assessment of risk in deep foundation excavation project in Iran. |
| Büyükozkan and Karabulut [59] | AHP, VIKOR, Group Decision Making | Sustainable perspective for selecting concretely defined renewable energy projects. |
Table 2.
SPPS selection evaluation criteria along with their source and description.
| Criteria No. | Criteria | Definition |
|---|---|---|
| D11 | Genomics, improved diagnostics and biosystematics [2,3] | Damage of crops. Such collection of strain will ensure preservation of genome of diverse type of organisms like fungi, bacteria, insects and nematodes. |
| D12 | Molecular approaches to multiple stress tolerance [7,8] | Various stress factors often hindered crop production particularly change of temperature, water stress, toxic gas substances etc. often cause stress. Plants have some inherent mechanism to get adjusted with such stress condition. |
| D13 | Use of agrochemicals [9,20] | Uses of manmade chemicals show some adverse effect like deterioration of soil health. |
| D14 | Fragmented crop health management [9,20] | This involves the structure the crop ecosystem in ways, which minimize the “built in” strength along with the naturally occurring biological agents and back up use of preventive measures. |
| D21 | Cultural practices, sanitation, prophylactic measure [1,15] | This multifaceted approach involves management in cultural practices, sanitation, prophylactic measure as well as therapeutic measures replacing chemical pesticides. |
| D22 | Deciphering the mechanism of host and non-host innate immunity [6,19] | Innate immunity is the natural immunity power resent in an organism against infection. |
| D23 | Isolation of stress resistance genes for transgenics/cisgenics [6,7,10] | Stress resistance genes are isolated from a plant (which may not be a crop plant) and then it is transferred to a crop plant to make it stress resistant. Such transgenic (gene from different species) or cisgenic (gene from different strain of same species) plant may be developed having multiple stress resistance characteristics. |
| D24 | Molecules for seed health and vigor [12,62] | Microbial biomolecules are profusely used in controlling bollworm infestation in cotton. Invention of new chemicals of microbial and plant origin will give better result for seed health and vigor. |
| D25 | Integrated crop health solutions [6,14] | This involves restructuring and managing the crop ecosystem in ways, which maximize the “built in” preventive strength along with the naturally occurring biological agents and back up use of therapeutic measures. |
| D31 | Preparedness for exotic pests to ensure crop bio-security and export promotion [7,21] | Genomics will cause more readiness through genetic protection of crop plants against pests and pathogens. As a result there will be more production and thereby export promotions. |
| D32 | Transgenic/Cisgenic crops using RNAi and Genome Editing Based technologies [8,10] | RNA interference (RNAi) is a molecular mechanism of silencing gene expression by using double stranded RNA. RNAi technique is used to check the expression of some deletes ions genes at the time of stress. |
| D33 | Use of bio-chemicals on agro product [8,62] | Use of chemicals shows some adverse effect like deterioration of soil health. Microbial biomolecules are profusely used in controlling bollworm infestation in cotton. Some alkaloids like caffeic acid, phenolic compounds, A3 adirachtin, Meliacin are plant bio pesticides. Invention of new chemicals of microbial and plant origin will give better management against pest and pathogen. |
| D34 | Space technology for mapping and monitoring pest population and development of weather based forewarning in GIS environment [10,63] | The approach for integrated management is the forecasting of weather, and monitoring of pests population through GIS system. Weather forecasting helps to take preventive measures in advance before infection/infestation starts. |
Table 3.
Linguistic variables and their grey numbers.
| Usage | Linguistic Assessment/Scale | Associated Grey Values |
|---|---|---|
| For weighing criteria | No influence (N) | [0.0, 0.1] |
| Very low influence (VL) | [0.1, 0.3] | |
| Medium Low influence (ML) | [0.3, 0.4] | |
| Medium influence (M) | [0.4, 0.6] | |
| Medium high influence (MH) | [0.6, 0.7] | |
| High influence (H) | [0.7, 0.9] | |
| Very high influence (VH) | [0.9, 1.0] | |
| For rating alternatives | Very poor (VP) | [0, 1] |
| Poor (P) | [1, 3] | |
| Medium poor (MP) | [3, 4] | |
| Fair (F) | [4, 5] | |
| Medium good (MG) | [5, 6] | |
| Good (G) | [6, 9] | |
| Very good (VG) | [9, 10] |
Table 4.
Description of experts.
| Decision Makers | Expertise |
|---|---|
| DM1 | Head of establishing standards and techniques with 21 years of work experience |
| DM2 | Health, Safety and Environment (HSE) management employee and the head of operations evaluation with 20 years of work experience |
| DM3 | Expert supervisor of project implementation with 21 years of work experience |
| DM4 | Supervisor of Edible Oil product projects evaluation with 12 years of work experience |
| DM5 | Project manager with 17 years of work experience |
| DM6 | Financial manager with 18 years of work experience |
Table 5.
Dependency degrees among main attributes obtained from DM1.
| D1 | D2 | D3 | |
|---|---|---|---|
| D1 | - | H | VH |
| D2 | H | - | MH |
| D3 | VH | MH | - |
Table 6.
Initial grey direct relation matrix by DM1.
| D1 | D2 | D3 | |
|---|---|---|---|
| D1 | [0.00, 0.10] | [0.60, 0.70] | [0.90, 1.00] |
| D2 | [0.70, 0.90] | [0.00, 0.10] | [0.40, 0.60] |
| D3 | [0.90, 1.00] | [0.40, 0.60] | [0.00, 0.10] |
Table 7.
Initial aggregated grey direct relation matrix.
| D1 | D2 | D3 | |
|---|---|---|---|
| D1 | [0.00, 0.10] | [0.63, 0.76] | [0.90, 1.00] |
| D2 | [0.76, 0.93] | [0.00, 0.10] | [0.46, 0.63] |
| D3 | [0.76, 0.93] | [0.46, 0.63] | [0.00, 0.10] |
Table 8.
Grey total direct relation matrix.
| D1 | D2 | D3 | |
|---|---|---|---|
| D1 | [0.0499, 0.0993] | [0.1450, 0.1943] | [0.1953, 0.2405] |
| D2 | [0.1691, 0.2297] | [0.0313, 0.0762] | [0.1210, 0.1787] |
| D3 | [0.1691, 0.2297] | [0.1129, 0.1690] | [0.0394, 0.0859] |
Table 9.
Whitened (crisp) total relation matrix.
| D1 | D2 | D3 | |
|---|---|---|---|
| D1 | 0.0746 | 0.1697 | 0.2179 |
| D2 | 0.1994 | 0.0538 | 0.1498 |
| D3 | 0.1994 | 0.1409 | 0.0626 |
Note: The bold numbers indicate the relationships that exceed the threshold .
Table 10.
The degree of prominence and net cause/effect groups of SPPS factors.
| Cause/Effect | |||||
|---|---|---|---|---|---|
| D1 | 0.4622 | 0.4734 | 0.9356 | −0.0112 | Effect |
| D11 | 0.3057 | 0.3032 | 0.6089 | 0.0025 | Cause |
| D12 | 0.2128 | 0.3310 | 0.5437 | −0.1182 | Effect |
| D13 | 0.3083 | 0.3355 | 0.6439 | −0.0272 | Effect |
| D14 | 0.2873 | 0.1444 | 0.4317 | 0.1429 | Cause |
| D2 | 0.4030 | 0.3644 | 0.7673 | 0.0386 | Cause |
| D21 | 0.2205 | 0.2304 | 0.4509 | −0.0100 | Effect |
| D22 | 0.2086 | 0.1982 | 0.4068 | 0.0104 | Cause |
| D23 | 0.2431 | 0.2205 | 0.4636 | 0.0226 | Cause |
| D24 | 0.2206 | 0.2322 | 0.4528 | −0.0116 | Effect |
| D25 | 0.1996 | 0.2110 | 0.4106 | −0.0114 | Effect |
| D3 | 0.4030 | 0.4304 | 0.8333 | −0.0274 | Effect |
| D31 | 0.2619 | 0.2830 | 0.5450 | −0.0211 | Effect |
| D32 | 0.2830 | 0.2809 | 0.5639 | 0.0021 | Cause |
| D33 | 0.3002 | 0.2421 | 0.5423 | 0.0581 | Cause |
| D34 | 0.2993 | 0.3385 | 0.6378 | −0.0391 | Effect |
Table 11.
Normalized local and global weights derived by grey Decision-Making Trial and Evaluation Laboratory (DEMATEL).
Table 11.
Normalized local and global weights derived by grey Decision-Making Trial and Evaluation Laboratory (DEMATEL).
| Dimension/Criteria | Local Weights | Local Rank | Global Weights | Global Rank |
|---|---|---|---|---|
| D1 | 0.3687 | 1 | ||
| D11 | 0.2689 | 2 | 0.0991 | 2 |
| D12 | 0.2457 | 3 | 0.0906 | 4 |
| D13 | 0.2846 | 1 | 0.1049 | 1 |
| D14 | 0.2008 | 4 | 0.0740 | 8 |
| D2 | 0.3028 | 3 | ||
| D21 | 0.2063 | 3 | 0.0625 | 11 |
| D22 | 0.1862 | 5 | 0.0564 | 13 |
| D23 | 0.2123 | 1 | 0.0643 | 9 |
| D24 | 0.2072 | 2 | 0.0627 | 10 |
| D25 | 0.1879 | 4 | 0.0569 | 12 |
| D3 | 0.3286 | 2 | ||
| D31 | 0.2378 | 3 | 0.0781 | 6 |
| D32 | 0.2458 | 2 | 0.0808 | 5 |
| D33 | 0.2377 | 4 | 0.0781 | 7 |
| D34 | 0.2786 | 1 | 0.0915 | 3 |
Table 12.
Performance ratings of alternatives according to DM1.
| D11 | D12 | D13 | D14 | D21 | D22 | D23 | D24 | D25 | D31 | D32 | D33 | D34 | |
|---|---|---|---|---|---|---|---|---|---|---|---|---|---|
| A1 | G | P | F | F | MG | MP | G | F | MP | P | MP | MP | P |
| A2 | F | P | G | MG | MG | MG | G | MG | G | G | P | P | MP |
| A3 | P | MG | MG | P | F | G | MG | G | MG | P | P | MP | MP |
Table 13.
Average grey decision matrix ().
| D11 | D12 | D13 | D14 | D21 | D22 | D23 | D24 | D25 | D31 | D32 | D33 | D34 | |
|---|---|---|---|---|---|---|---|---|---|---|---|---|---|
| A1 | [6.6667, | [2.3333, | [4.3333, | [4.3333, | [5.3333, | [2.3333, | [6.0000, | [4.3333, | [1.6667, | [2.3333, | [2.3333, | [3.3333, | [1.0000, |
| 8.3333] | 3.6667] | 5.3333] | 5.3333] | 7.0000] | 3.6667] | 9.0000] | 5.3333] | 3.3333] | 3.6667] | 3.6667] | 4.3333] | 3.0000] | |
| A2 | [4.3333, | [1.6667, | [5.3333, | [5.0000, | [5.6667, | [5.3333, | [5.6667, | [5.6667, | [5.6667, | [5.0000, | [1.6667, | [1.6667, | [3.3333, |
| 5.3333] | 3.3333] | 7.0000] | 6.0000] | 8.0000] | 7.0000] | 8.0000] | 8.0000] | 8.0000] | 6.6667] | 3.3333] | 3.3333] | 4.3333] | |
| A3 | [2.3333, | [4.3333, | [5.6667, | [1.0000, | [3.3333, | [6.6667, | [4.6667, | [5.0000, | [4.3333, | [1.6667, | [1.6667, | [2.6667, | [2.3333, |
| 3.6667] | 5.3333] | 8.0000] | 3.0000] | 4.3333] | 8.3333] | 5.6667] | 6.6667] | 5.3333] | 3.3333] | 3.3333] | 4.0000] | 3.6667] |
Table 14.
Normalized grey decision matrix ().
| D11 | D12 | D13 | D14 | D21 | D22 | D23 | D24 | D25 | D31 | D32 | D33 | D34 | |
|---|---|---|---|---|---|---|---|---|---|---|---|---|---|
| A1 | [0.8000, | [0.4545, | [0.8125, | [0.1875, | [0.6667, | [0.2800, | [0.6667, | [0.5417, | [0.2083, | [0.3500, | [0.6364, | [0.7692, | [0.2308, |
| 1.0000] | 0.7143] | 1.0000] | 0.2308] | 0.8750], | 0.4400] | 1.0000] | 0.6667] | 0.4167] | 0.5500] | 1.0000] | 1.0000] | 0.6923] | |
| A2 | [0.5200, | [0.5000, | [0.6190, | [0.1667, | [0.7083, | [0.6400, | [0.6296, | [0.7083, | [0.7083, | [0.7500, | [0.4545, | [0.3846, | [0.7692, |
| 0.6400] | 1.0000] | 0.8125] | 0.2000] | 1.0000] | 0.8400] | 0.8889] | 1.0000] | 1.0000] | 1.0000] | 0.9091] | 0.7692] | 1.0000] | |
| A3 | [0.2800, | [0.3125, | [0.5417, | [0.3333, | [0.4167, | [0.8000, | [0.5185, | [0.6250, | [0.5417, | [0.2500, | [0.4545, | [0.6154, | [0.5385, |
| 0.4400] | 0.3846] | 0.7647] | 1.0000] | 0.5417] | 1.0000] | 0.6296] | 0.8333] | 0.6667] | 0.5000] | 0.9091] | 0.9231] | 0.8462] |
Table 15.
Weighted grey decision matrix.
| D11 | D12 | D13 | D14 | D21 | D22 | D23 | D24 | D25 | D31 | D32 | D33 | D34 | |
|---|---|---|---|---|---|---|---|---|---|---|---|---|---|
| A1 | [0.0770, | [0.0405, | [0.0843, | [0.0137, | [0.0411, | [0.0158, | [0.0423, | [0.0338, | [0.0118, | [0.0280, | [0.0530, | [0.0623, | [0.0214, |
| 0.0963] | 0.0636] | 0.1038] | 0.0168] | 0.0540] | 0.0249] | 0.0634] | 0.0416] | 0.0237] | 0.0439] | 0.0833] | 0.0810] | 0.0642] | |
| A2 | [0.0501, | [0.0445, | [0.0643, | [0.0122, | [0.0437, | [0.0362, | [0.0399, | [0.0442, | [0.0402, | [0.0599, | [0.0379, | [0.0312, | [0.0713, |
| 0.0616] | 0.0891] | 0.0843] | 0.0146] | 0.0617] | 0.0475] | 0.0564] | 0.0624] | 0.0568] | 0.0799] | 0.0757] | 0.0623] | 0.0927] | |
| A3 | [0.0270, | [0.0278, | [0.0562, | [0.0243, | [0.0257, | [0.0453, | [0.0329, | [0.0390, | [0.0308, | [0.0200, | [0.0379, | [0.0498, | [0.0499, |
| 0.0424] | 0.0343] | 0.0794] | 0.0730] | 0.0334] | 0.0566] | 0.0399] | 0.0520] | 0.0379] | 0.0399] | 0.0757] | 0.0748] | 0.0784] |
Table 16.
Grey BAA matrix.
| D11 | D12 | D13 | D14 | D21 | D22 | D23 | D24 | D25 | D31 | D32 | D33 | D34 | |
|---|---|---|---|---|---|---|---|---|---|---|---|---|---|
| A1 | [0.0484, | [0.0375, | [0.0680, | [0.0162, | [0.0364, | [0.0295, | [0.0387, | [0.0390, | [0.0245, | [0.0315, | [0.0411, | [0.0443, | [0.0418, |
| 0.0650] | 0.0589] | 0.0895] | 0.0265] | 0.0487] | 0.0405] | 0.0530] | 0.0515] | 0.0371] | 0.0508] | 0.0758] | 0.0697] | 0.0766] | |
| A2 | [0.0484, | [0.0375, | [0.0680, | [0.0162, | [0.0364, | [0.0295, | [0.0387, | [0.0390, | [0.0245, | [0.0315, | [0.0411, | [0.0443, | [0.0418, |
| 0.0650] | 0.0589] | 0.0895] | 0.0265] | 0.0487] | 0.0405] | 0.0530] | 0.0515] | 0.0371] | 0.0508] | 0.0758] | 0.0697] | 0.0766] | |
| A3 | [0.0484, | [0.0375, | [0.0680, | [0.0162, | [0.0364, | [0.0295, | [0.0387, | [0.0390, | [0.0245, | [0.0315, | [0.0411, | [0.0443, | [0.0418, |
| 0.0650] | 0.0589] | 0.0895] | 0.0265] | 0.0487] | 0.0405] | 0.0530] | 0.0515] | 0.0371] | 0.0508] | 0.0758] | 0.0697] | 0.0766] |
Table 17.
Preference Matrix.
| D11 | D12 | D13 | D14 | D21 | D22 | D23 | D24 | D25 | D31 | D32 | D33 | D34 | |
|---|---|---|---|---|---|---|---|---|---|---|---|---|---|
| A1 | 0.0326 | −0.0049 | −0.0163 | 0.0069 | 0.0056 | −0.0147 | 0.0085 | −0.0077 | −0.0130 | −0.0063 | 0.0081 | 0.0127 | −0.0174 |
| A2 | 0.0025 | −0.0231 | 0.0037 | 0.0087 | 0.0112 | 0.0067 | 0.0032 | 0.0088 | 0.0179 | 0.0272 | −0.0035 | −0.0121 | 0.0228 |
| A3 | −0.0210 | 0.0182 | 0.0103 | −0.0341 | −0.0128 | 0.0158 | −0.0096 | 0.0005 | 0.0045 | −0.0119 | −0.0035 | 0.0032 | 0.0053 |
Table 18.
Closeness coefficients and rankings of alternatives.
| Alternatives | CCi | Rank |
|---|---|---|
| A1 | −0.0066 | 2 |
| A2 | 0.0743 | 1 |
| A3 | −0.0343 | 3 |
Table 19.
Comparison with other models.
| MCDM Methods | Ranking Order |
|---|---|
| Classical MABAC [71] | A2 > A1 > A3 |
| IVIF-MABAC [74] | A2 > A3 > A1 |
| TOPSIS-Grey [92] | A2 > A1 > A3 |
| Grey VIKOR [93] | A2 > A1 > A3 |
| The proposed grey MABAC | A2 > A1 > A3 |
Table 20.
Different scenarios of criteria weights.
| Original | Scenario 1 | Scenario 2 | Scenario 3 | Scenario 4 | Scenario 5 | Scenario 6 | Scenario 7 | Scenario 8 | Scenario 9 | Scenario 10 | |
|---|---|---|---|---|---|---|---|---|---|---|---|
| D1 | 0.3622 | 0.5599 | 0.4392 | 0.3249 | 0.3300 | 0.1743 | 0.3200 | 0.0944 | 0.4549 | 0.3675 | 0.4684 |
| D2 | 0.3009 | 0.1058 | 0.4142 | 0.3873 | 0.3460 | 0.5365 | 0.3607 | 0.5164 | 0.5188 | 0.3970 | 0.2665 |
| D3 | 0.3369 | 0.3343 | 0.1466 | 0.2878 | 0.3240 | 0.2893 | 0.3193 | 0.3892 | 0.0263 | 0.2355 | 0.2651 |
| D11 | 0.0963 | 0.0487 | 0.0826 | 0.0576 | 0.1418 | 0.0734 | 0.0652 | 0.0212 | 0.2383 | 0.0970 | 0.1366 |
| D12 | 0.0891 | 0.0726 | 0.1291 | 0.0979 | 0.0313 | 0.0147 | 0.0791 | 0.0107 | 0.1405 | 0.1450 | 0.0313 |
| D13 | 0.1038 | 0.0947 | 0.0632 | 0.0181 | 0.1064 | 0.0213 | 0.0429 | 0.0241 | 0.0192 | 0.0677 | 0.0799 |
| D14 | 0.0730 | 0.1646 | 0.2315 | 0.1519 | 0.0354 | 0.0117 | 0.1077 | 0.0271 | 0.1898 | 0.0092 | 0.0408 |
| D21 | 0.0617 | 0.0037 | 0.0504 | 0.1757 | 0.0188 | 0.0338 | 0.0308 | 0.0371 | 0.0851 | 0.1428 | 0.1157 |
| D22 | 0.0566 | 0.0673 | 0.0584 | 0.1634 | 0.0955 | 0.2158 | 0.1120 | 0.1815 | 0.0544 | 0.1040 | 0.0023 |
| D23 | 0.0634 | 0.0705 | 0.0441 | 0.0521 | 0.0708 | 0.1439 | 0.0299 | 0.0696 | 0.0908 | 0.0585 | 0.2285 |
| D24 | 0.0624 | 0.0366 | 0.0589 | 0.1187 | 0.0721 | 0.1365 | 0.0601 | 0.1184 | 0.0648 | 0.1643 | 0.1605 |
| D25 | 0.0568 | 0.0365 | 0.1127 | 0.0045 | 0.1041 | 0.0360 | 0.1020 | 0.1795 | 0.0836 | 0.0369 | 0.0004 |
| D31 | 0.0799 | 0.0796 | 0.0285 | 0.0631 | 0.1134 | 0.1142 | 0.1126 | 0.0584 | 0.0010 | 0.0638 | 0.0076 |
| D32 | 0.0833 | 0.2121 | 0.0845 | 0.0464 | 0.0516 | 0.0833 | 0.0117 | 0.0674 | 0.0143 | 0.0591 | 0.0518 |
| D33 | 0.0810 | 0.0870 | 0.0394 | 0.0240 | 0.0975 | 0.0470 | 0.1341 | 0.1432 | 0.0063 | 0.0379 | 0.1131 |
| D34 | 0.0927 | 0.0262 | 0.0169 | 0.0265 | 0.0613 | 0.0687 | 0.1119 | 0.0616 | 0.0121 | 0.0139 | 0.0316 |
Table 21.
Rank of the alternatives for different scenarios of criteria weights.
| Original | Scenario 1 | Scenario 2 | Scenario 3 | Scenario 4 | Scenario 5 | Scenario 6 | Scenario 7 | Scenario 8 | Scenario 9 | Scenario 10 | |
|---|---|---|---|---|---|---|---|---|---|---|---|
| CCi(Rank) | CCi(Rank) | CCi(Rank) | CCi(Rank) | CCi(Rank) | CCi(Rank) | CCi(Rank) | CCi(Rank) | CCi(Rank) | CCi(Rank) | CCi(Rank) | |
| A1 | −0.0066(2) | 0.0226(2) | 0.0053(2) | −0.0235(2) | −0.0325(2) | −0.0960(3) | −0.0888(3) | −0.1204(3) | 0.0749(1) | −0.0399(3) | 0.0765(1) |
| A2 | 0.0743(1) | 0.0651(1) | 0.1041(1) | 0.1738(1) | 0.2245(1) | 0.2500(1) | 0.2264(1) | 0.1966(1) | 0.0665(2) | 0.1489(1) | 0.0521(2) |
| A3 | −0.0343(3) | −0.0962(3) | −0.1419(3) | −0.1291(3) | −0.0451(3) | 0.0105(2) | −0.0441(2) | 0.0554(2) | −0.1364(3) | −0.0084(2) | −0.0922(3) |
© 2017 by the authors. Licensee MDPI, Basel, Switzerland. This article is an open access article distributed under the terms and conditions of the Creative Commons Attribution (CC BY) license (http://creativecommons.org/licenses/by/4.0/).
Share and Cite
MDPI and ACS Style
Debnath, A.; Roy, J.; Kar, S.; Zavadskas, E.K.; Antucheviciene, J. A Hybrid MCDM Approach for Strategic Project Portfolio Selection of Agro By-Products. Sustainability 2017, 9, 1302. https://doi.org/10.3390/su9081302
AMA Style
Debnath A, Roy J, Kar S, Zavadskas EK, Antucheviciene J. A Hybrid MCDM Approach for Strategic Project Portfolio Selection of Agro By-Products. Sustainability. 2017; 9(8):1302. https://doi.org/10.3390/su9081302
Chicago/Turabian StyleDebnath, Animesh, Jagannath Roy, Samarjit Kar, Edmundas Kazimieras Zavadskas, and Jurgita Antucheviciene. 2017. "A Hybrid MCDM Approach for Strategic Project Portfolio Selection of Agro By-Products" Sustainability 9, no. 8: 1302. https://doi.org/10.3390/su9081302
Note that from the first issue of 2016, this journal uses article numbers instead of page numbers. See further details here.