Remote Sensing Techniques for Urban Heating Analysis: A Case Study of Sustainable Construction at District Level


Department of Engineering, University of Perugia, via G. Duranti 93, 06125 Perugia, Italy
*
Author to whom correspondence should be addressed.
Sustainability 2017, 9(8), 1308; https://doi.org/10.3390/su9081308
Submission received: 20 June 2017
/
Revised: 20 July 2017
/
Accepted: 24 July 2017
/
Published: 26 July 2017
(This article belongs to the Special Issue Sustainable Construction)
Abstract
:In recent years, many new districts in urban centres have been planned and constructed to reshape the structure and functions of specific areas. Urban regeneration strategies, planning and design principles have to take into account both socioeconomic perspectives and environmental sustainability. A district located in the historical city centre of Terni (Italy), Corso del Popolo, was analysed to assess the construction effects in terms of surface urban heat island (SUHI) mitigation. This district is an example of urban texture modification planned in the framework of the regeneration of the ancient part of the town. The changes were realised starting from 2006; the new area was completed on June 2014. The analysis was carried out by processing Landsat 7 ETM+ images before and after the interventions, retrieving land surface temperature (LST) and albedo maps. The map analysis proved the SUHI reduction of the new area after the interventions: as confirmed by the literature, such SUHI mitigation can be ascribed to the presence of green areas, the underground parking, the partial covering of the local roadway and the shadow effect of new multi-storey buildings. Moreover, an analysis of other parameters linked to the impervious surfaces (albedo, heat transfer and air circulation) driving LST variations is provided to better understand SUHI behaviour at the district level. The district regeneration shows that wisely planned and developed projects in the construction sector can improve urban areas not only economically and socially, but can also enhance the environmental impact.
1. Introduction
The urbanization processes and related environmental effects are increasingly steered to the study of the urban heat island (UHI) phenomenon. The UHI is a typical form of anthropogenic climate modification mainly due to the growing urbanization process and accompanied by an increase of air pollution and anthropogenic heat sources [1]. The city expansion generally reduces the presence of green areas, with building structures and materials trapping solar radiation, determining significant temperature differences between urban and rural areas [1,2,3,4]. Urban texture and construction materials can cause an increase of air and surface temperatures of several degrees with respect to the surrounding rural areas. The UHI effect worsen during the hot season: high temperatures may affect human health, the quality of life of urban residents, energy consumption and air pollution. The UHI effect has been a concern for several decades, affecting not only large metropolitan areas, but also smaller cities; therefore, their planning and design represent the main step for the solution to the problem. The UHI typologies may be grouped in three categories [2]: the surface urban heat island (SUHI); the boundary layer heat island, and; the canopy layer heat island. The canopy layer UHI is affected by the air temperature heating in the atmosphere extending up to the top of buildings, while the boundary layer UHI extends up to 1 km [5]. The SUHI concerns the land surface temperature (LST) pattern, having greater variability and higher thermal peaks with respect to the air temperature. In the paradigm of urban sustainable development, the mitigation of the urban heat island is a key point [6]. Different strategies to reduce UHI effects can be adopted, based on properly designing the urban texture in order to obtain energy savings and health benefits [7,8,9], such as the increase of urban surface reflectivity [10,11,12] and urban vegetation (green roofs, street trees, and green spaces) [13,14,15].
Urbanised areas are characterised by an irregular thermal pattern, with the LST variations generally linked to the impervious surfaces reflectivity: albedo describes quite completely the surface behaviour in terms of reflectivity, as it represents its hemispherical reflection in the wavelength range of the solar spectrum. For instance, a simple way to increase the albedo of building roofs, and consequently to mitigate the UHI, is the adoption of cool roof paint.
Earth observation data from space-borne sensors have been widely exploited to examine the SUHI effects. Unlike in situ measurements, providing uneven distributed data, satellite observations have the advantages of covering large areas at the same time, and during different temporal intervals, ensuring a more effective analysis of the intra-urban SUHI spatial variability, closely related to the building distribution, surface materials and vegetation density. Different space-borne platforms, such as AVHRR [16,17,18], MODIS [19,20], ASTER [21,22,23], and Landsat [24,25,26], were used to retrieve the SUHI. Furthermore, satellite sensor measurements of surface reflectivities make it possible to retrieve albedo maps, both at the local and global spatial scale.
In this work, the retrieval from Landsat 7 satellite data of the urban LST and albedo is carried out over the city of Terni (Central Italy), characterized by several urban changes during the last 10–15 years. In particular, a district located in the historical city centre, Corso del Popolo, is analysed, where a clear construction intervention was realized starting from 2006; the intervention ended in June 2014. This district is an example of urban texture modification in the construction sector planned for the regeneration of the ancient part of the town. An analysis of the SUHI maps of this district before and after the interventions using different satellite images is provided. The 60 m pixel size of Landsat 7 ETM+ thermal channel proved to be suitable to monitor SUHI changes at the district level, making it possible to point out if urban construction changes move towards an urban sustainable criteria. Moreover, an analysis of the correspondent albedo maps is proposed, with a study of the parameters affecting the LST variations through an analytical model. The synergy of satellite techniques and analytical studies is aimed at assessing whether the planning and design principles fulfil the sustainability requirements in terms of urban heat island mitigation, and the more evident reasons for the heating variations.
2. Study Area
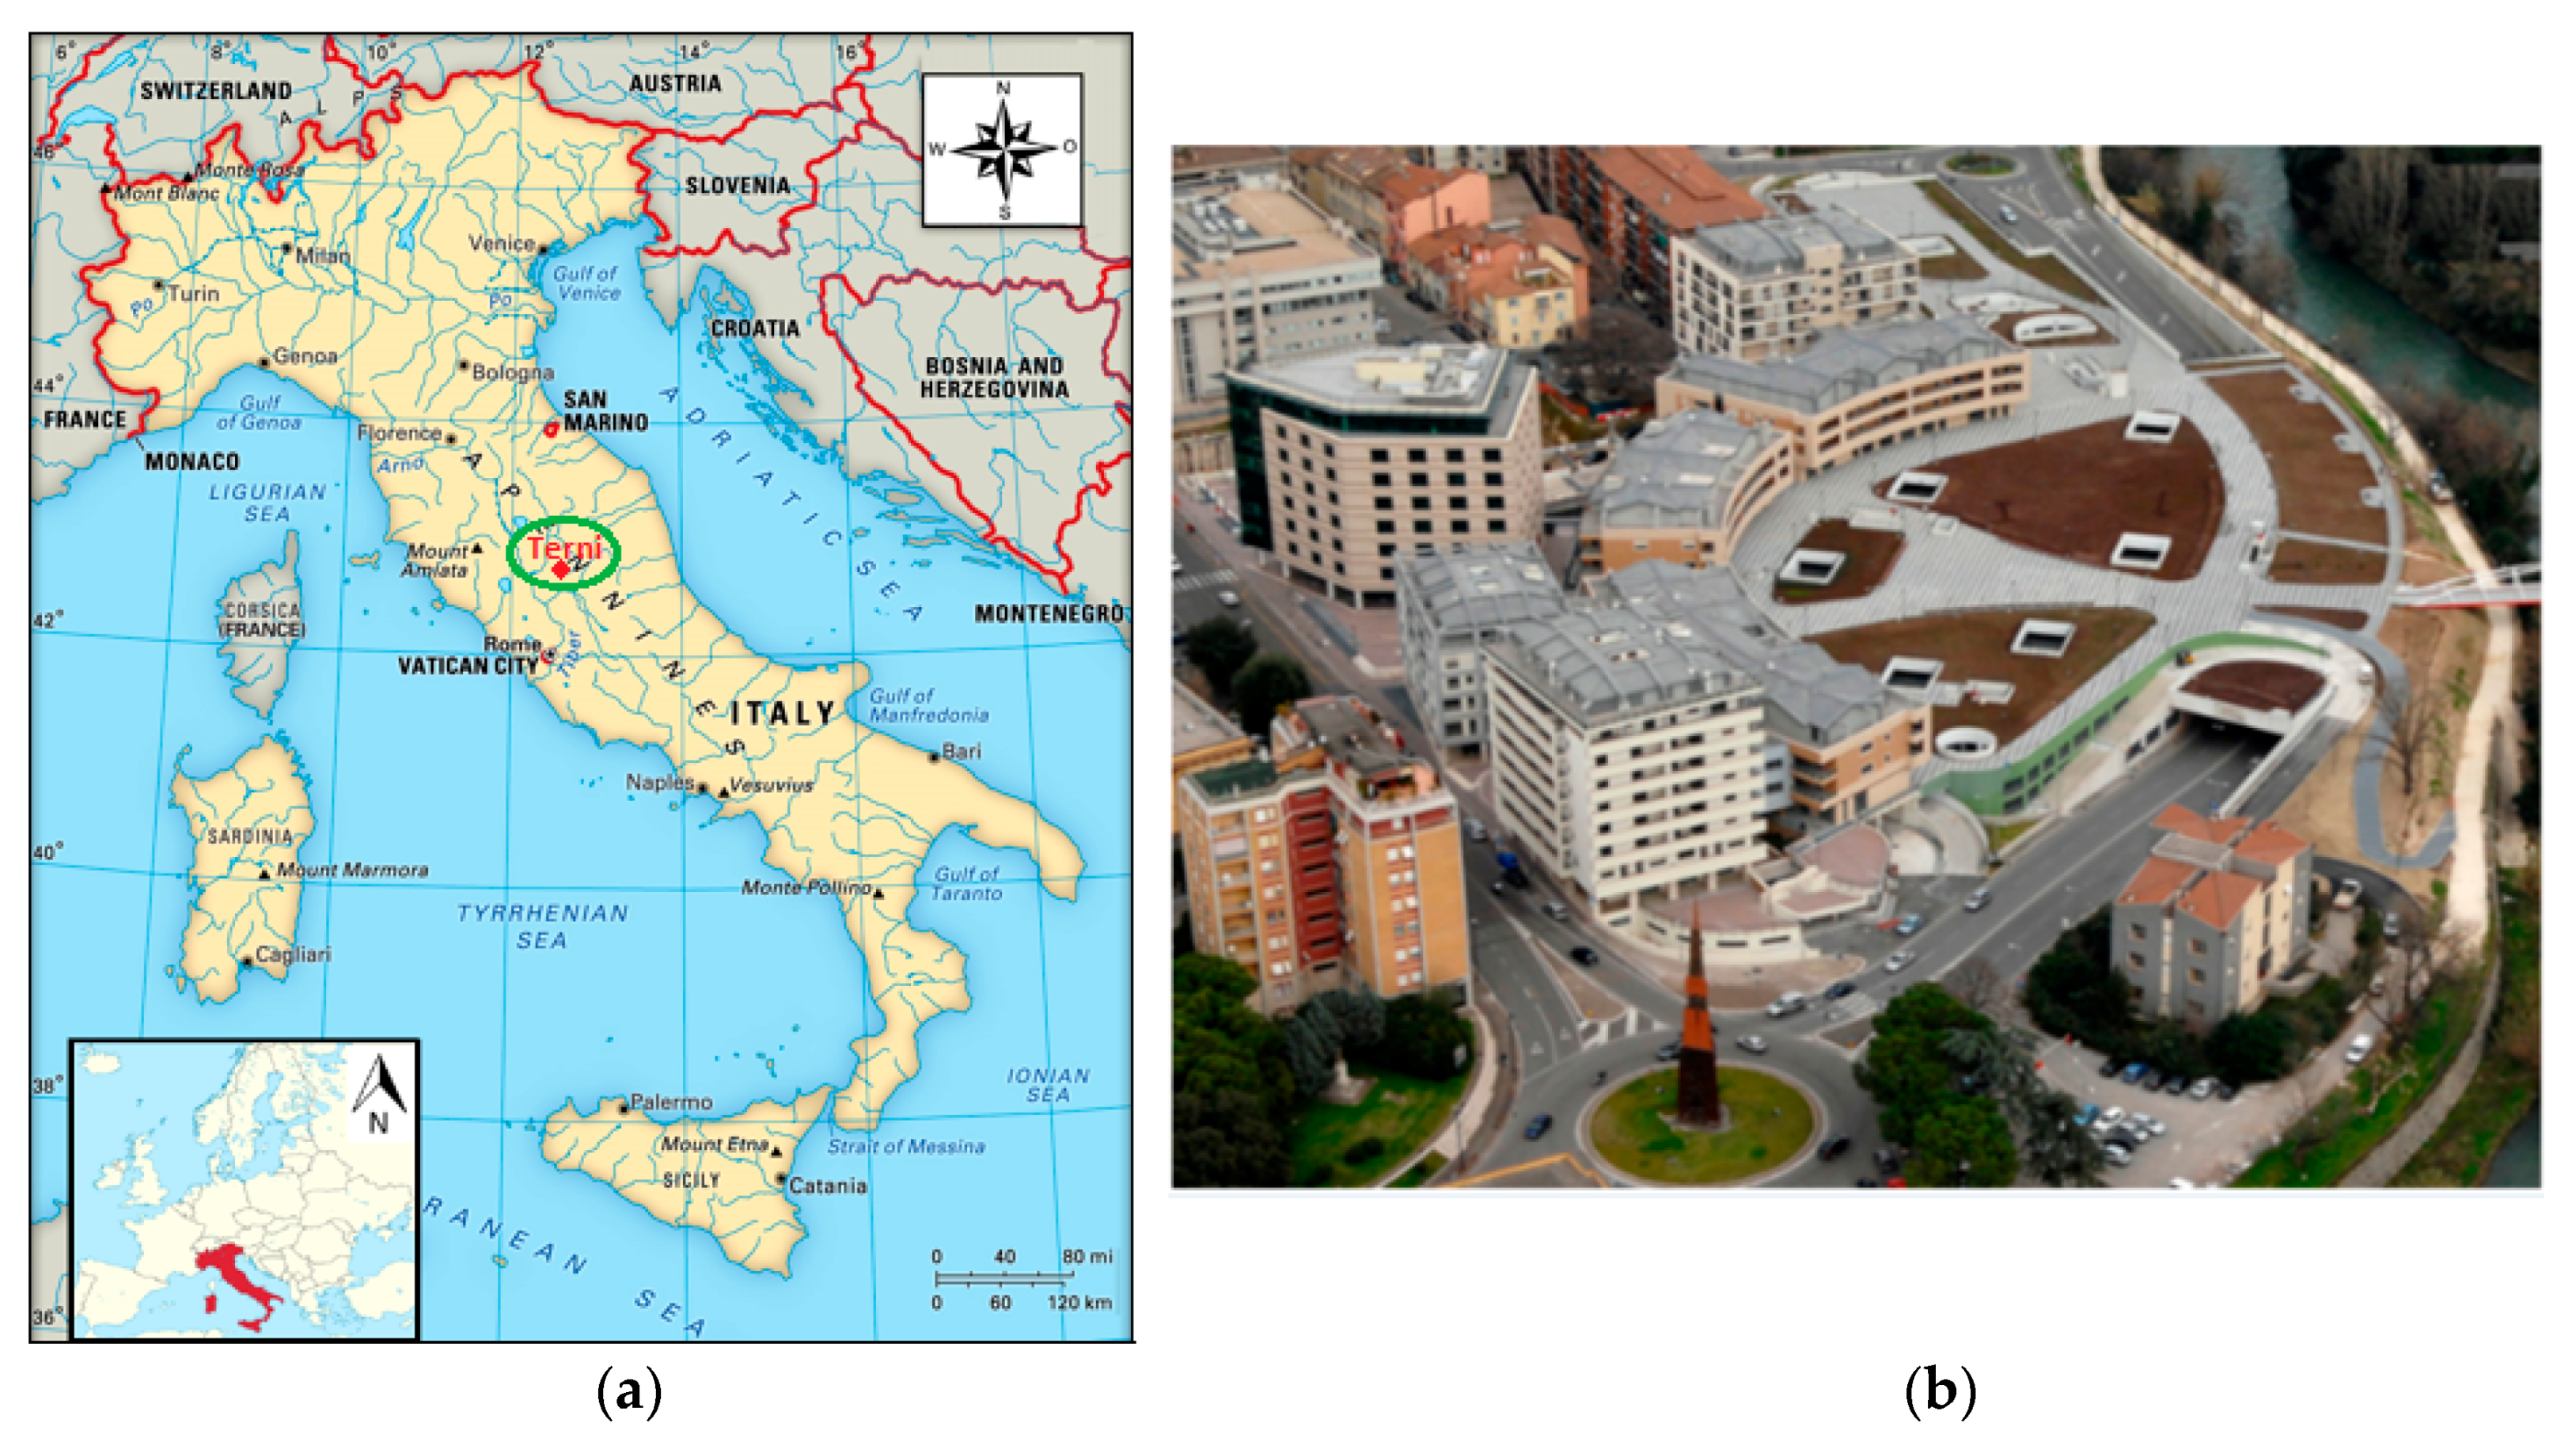
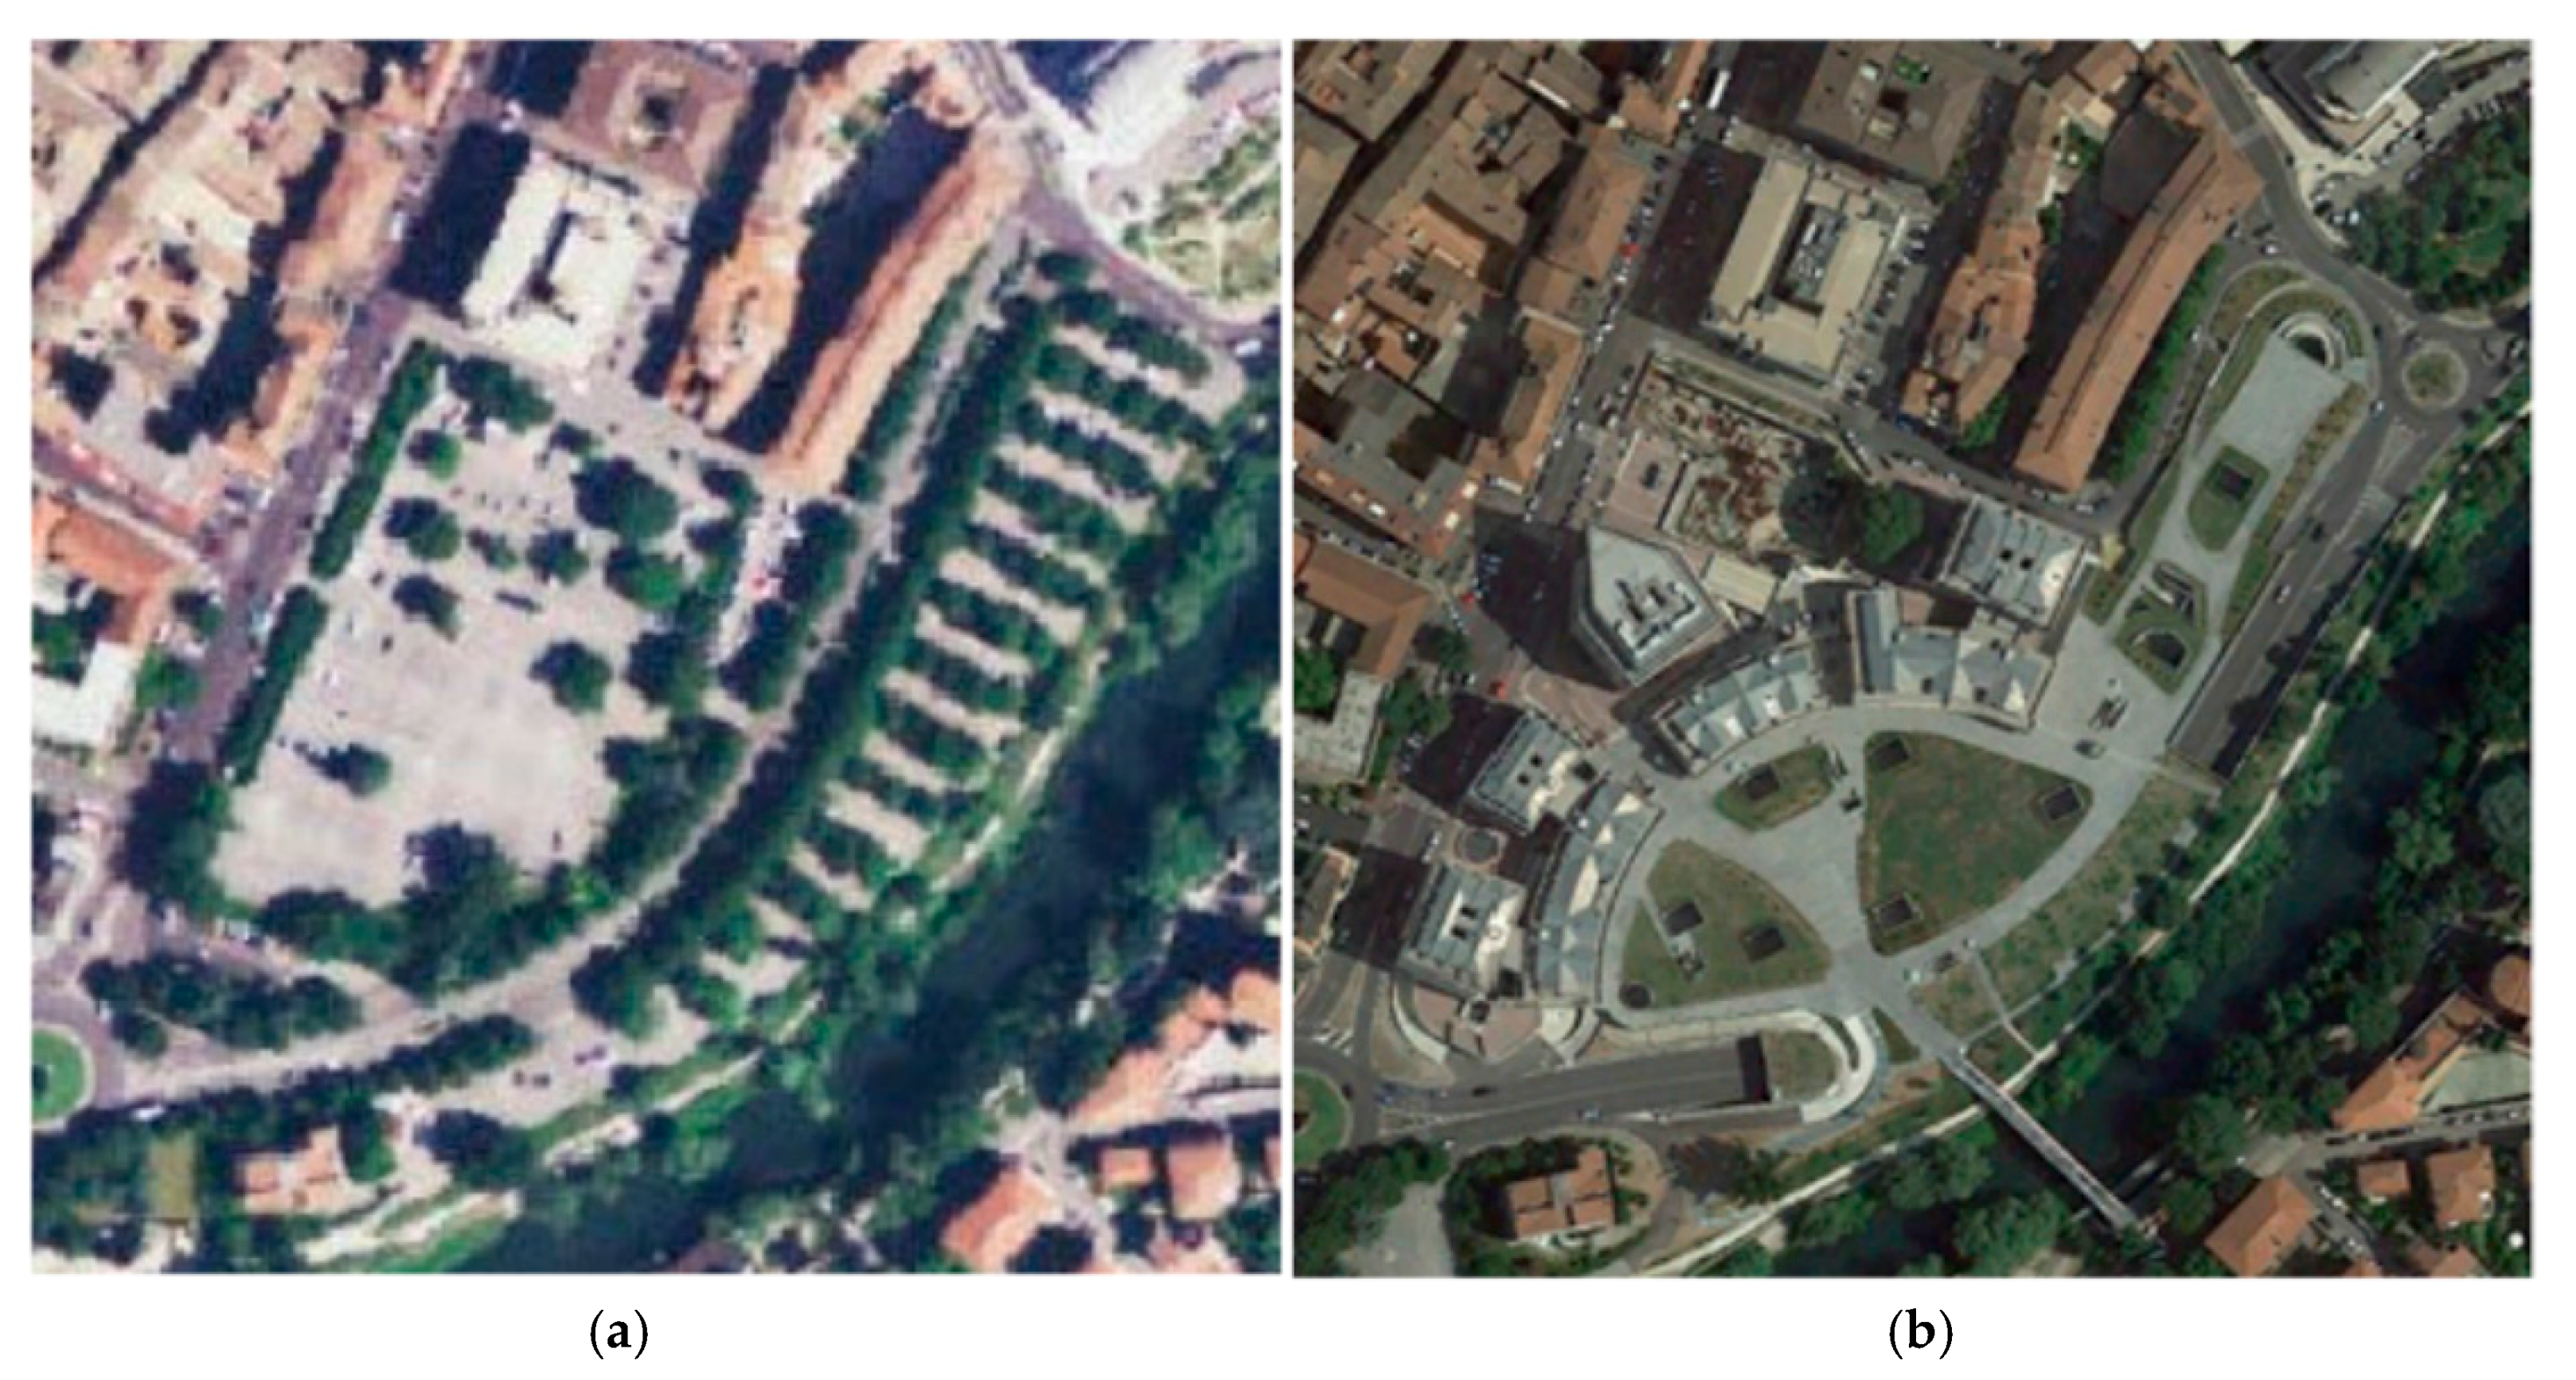
The study area is the Corso del Popolo district, located in the historical city centre of Terni, Central Italy (Figure 1). Terni (city centre coordinates 42.56° N, 12.64° E) has about 112,000 inhabitants, covers an overall area of 212 km2, and its average altitude is 130 m above mean sea level. The city is quite far from the sea, and is located in a flat valley surrounded by mountainous areas; it has a temperate climate typical of mid-latitude regions, with hot, humid and poorly ventilated summers. The selected zone of Corso del Popolo (Figure 2) covers a surface of 300 × 300 m: The Universal Transverse Mercator (UTM) WGS84 coordinates (33T zone) are: longitude range (m E): 306,690–306,990 and latitude range (m N): 4,714,300–4,714,600.
Terni is an average Italian city characterized by an industrial texture at the top of the national table in the manufacturing of iron and steel and the production of electricity. From the second half of the 19th century, Terni underwent a transformation from a historic town, still structured along the lines of the urban layout of the ancient Roman town, into a dynamic industrial city.
The analysed district is an example of urban texture change planned in the framework of the regeneration of the ancient part of Terni following urban sustainable criteria (projected by Mario Ridolfi and Wolfgang Frankl architects) [27]. The construction interventions, between the Nera riverside and Corso del Popolo Street, started in 2006 and were completed in June 2014. Before 2006, a paved car park (with light-coloured asphalt) with perimetral trees was present. The new zone consists of a private area (seven buildings for residential, commercial and managerial end use) and a public area (a three-level underground car park with 1036 parking spaces, a building of 7000 m2 with parking used as municipal offices, subway, green areas, underground roadway and a pedestrian bridge).
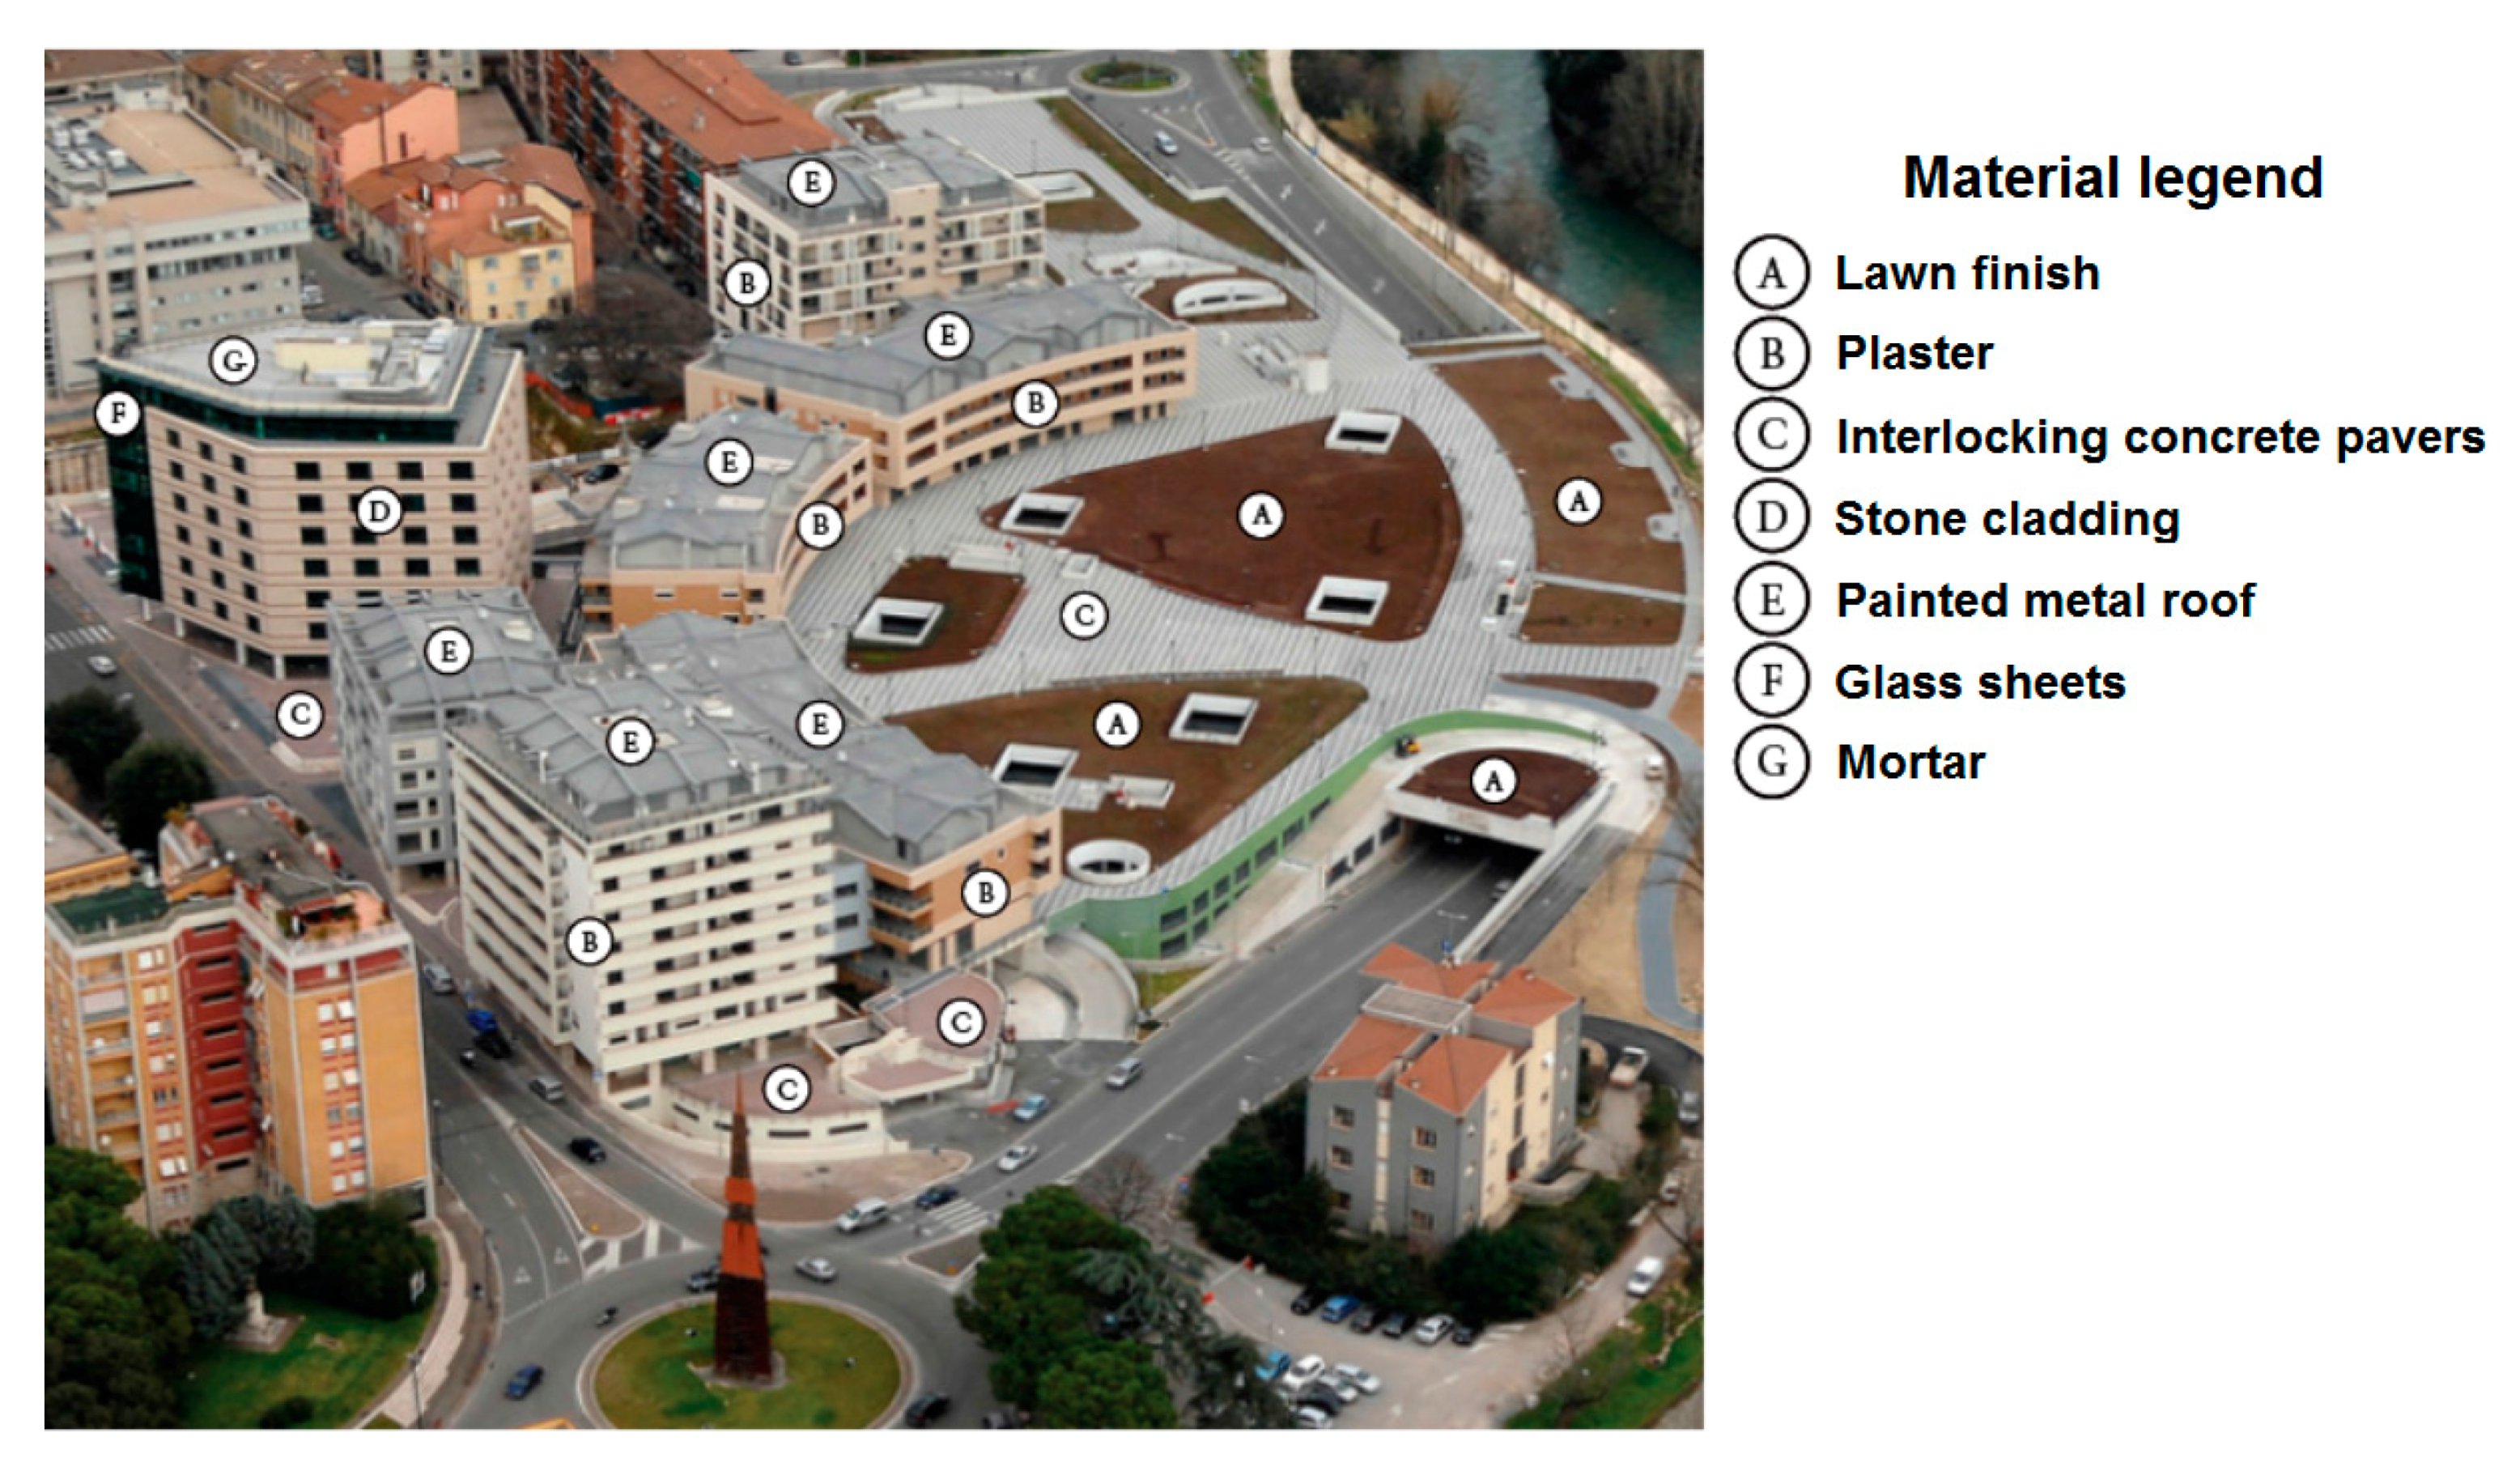
The main idea of this operation, embracing an area approximately 4 acres large, is the regeneration of the historical centre of the town integrating it with the neighbour river zone (named “Città Giardino”) through both the partial covering of the local roadway and the construction of a pedestrian bridge. The Municipality of Terni chose the project financing system as the most appropriate way to realize the interventions, applied for the first time to an urban area (with both private and public buildings) instead of a single public work. Some environmentally friendly materials were used in the building construction [27]. Figure 3 reports the main external materials employed in the new area.
3. Methods
3.1. Landsat 7 ETM+ Data and Processing
The LST maps, from which the SUHI ones are obtained, and the corresponding albedo maps, were retrieved using observations from the Enhanced Thematic Mapper Plus (ETM+) sensor on board the Landsat 7 satellite. ETM+ has six reflective bands in the visible (VIS), near infrared (NIR) and short-wavelength infrared (SWIR), a band in the thermal infrared region (TIR) and a panchromatic band, as reported in Table 1. The six reflective channels have a spatial resolution of 30 m, the thermal channel of 60 m, and the panchromatic one of 15 m. TIR band data are also delivered at 30 m by the U.S. Geological Survey [29], by means of a cubic convolution resampling method.
In this work, nine Landsat 7 scenes over Terni before and after the intervention on Corso del Popolo were considered, as reported in Table 2, downloaded from USGS at 30 m resolution. The native 60 m pixel size of ETM + TIR channel, the highest resolution of current satellite-based TIR channels, allows monitoring SUHI changes at the district level with sufficient details. Summer images in clear-sky condition were selected, since it is the period with the more intense SUHI effects, generally with the maximum intensity during the month of July in Italy, as detailed in [20]. The satellite passages are at around 11:50, Central European Summer Time (CEST).
The images were calibrated according to [30], in order to convert digital number values to at-sensor spectral radiances. The surface reflectances of the ETM+ reflective bands were computed through the scheme reported in [31], where only satellite scenes are needed, without the support of ground measurements.
3.2. LST and Albedo Retrieval from Landsat 7 Data
ETM + channel in the TIR band (Ch_6) was employed to retrieve LST by inverting the following radiative transfer equation [32]:
where is the radiance (W·m−2·sr−1·μm−1) received by the sensor, ελ is the emissivity of the surface, Bλ (Ts) is the spectral radiance (W·m−2·sr−1·μm−1) of a black body at temperature Ts (K) expressed by the Planck’s law, Ts represents the LST, and are, respectively, the downwelling and upwelling atmospheric radiances (W·m−2·sr−1·μm−1), and τλ is the transmissivity of the atmosphere. If the surface emissivity is known, LST is retrieved from Equation (1) by the inversion of the Planck’s law [33]. The terms τλ, and were calculated through the tool available at [34]: it makes use of the atmospheric profiles of the National Centers for Environmental Prediction as input for the code of radiative transfer MODTRAN [35]. The threshold method described in [36,37] and applied to the normalized difference vegetation index (NDVI) was used to estimate the land surface emissivity.
Overall, both thermal and reflective data, selected in cloud-free conditions, were atmospherically corrected.
The total broadband albedo is obtained from the reflective ETM + channels using the following relation [38]:
α = 0.356 × Ch_1 + 0.130 × Ch_3 + 0.373 × Ch_4 + 0.085 × Ch_5 + 0.072 × Ch_7 − 0.0018
Since the albedo is defined as a bi-hemispherical reflectance, whilst the Landsat spectral reflectance is the ratio of the hemispherical incoming radiation to the conical reflected radiation [39], assuming that the surfaces are Lambertian, the broadband albedo can be retrieved from the spectral reflectances of Landsat, regarded as narrowband albedos [38,39,40].
3.3. SUHI Computation and LST Model
The SUHI intensity is the parameter used to assess the heating effects in urban areas: in this case, it is the difference in physical surface temperature between urban (LSTurban) and rural (LSTrural) pixels within a given image:
SUHI = LSTurban − LSTrural
It was chosen to compute the LSTrural as the mean of LST associated with the rural pixels in the Terni area not affected by land cover changes over the years of the study.
In order to understand deeply the LST variations, an analytical model function of construction material behaviour, air temperature and heat transfer is considered. In fact, the LST variation is not simply driven by the albedo values, but further physical parameters have to be taken into account. Therefore, starting from the energy balance of a built-up surface when exposed to solar radiation, the LST is estimated as a function of different parameters beyond the albedo [10]:
where α is the albedo, I the incident solar radiation on the surface (W/m2), ε the emissivity of the surface, σ the Stefan–Boltzmann constant (5.67 × 10⁻⁸ W/m2·K4), Ts is the LST (K), Tsky the radiating temperature of the sky (K), hc the convection (and radiation) coefficient (W/m2·K), and Ta the air temperature (K).
4. Results and Discussion
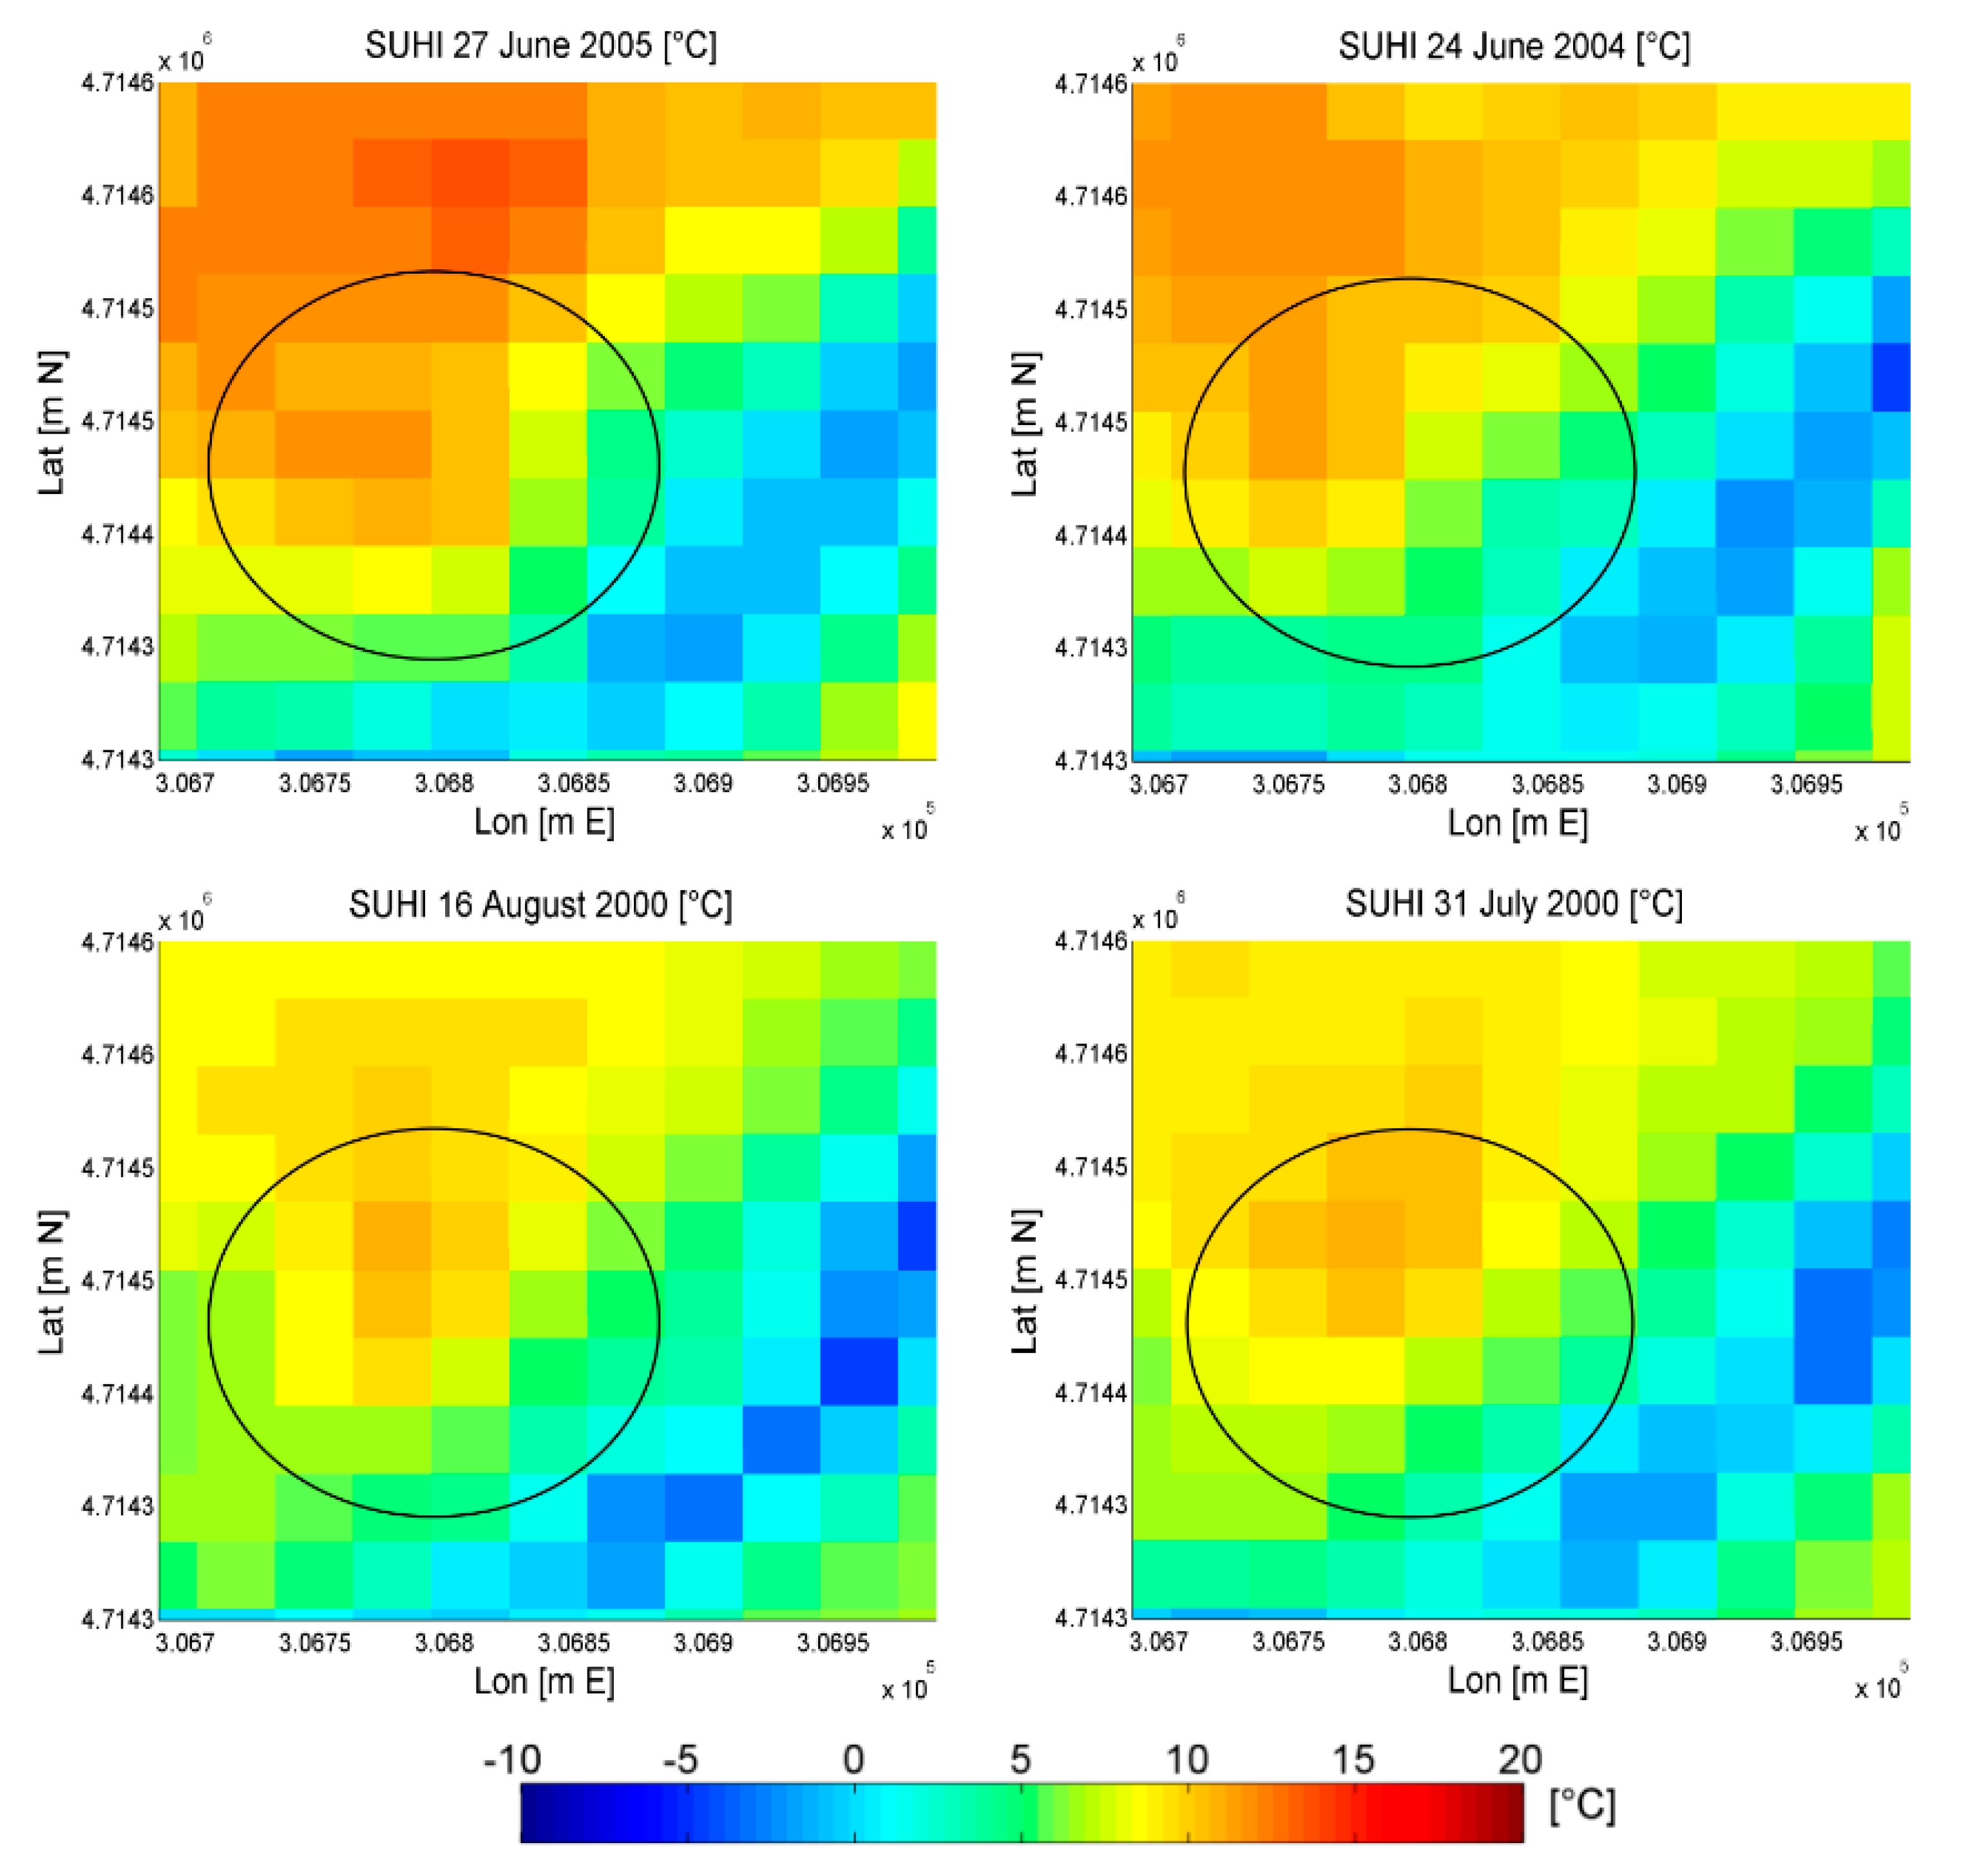
The changes of the area under investigation (Figure 2) is monitored in terms of SUHI intensity maps as shown in Figure 4 (before the intervention) and Figure 5 (after the intervention).
The 60 m pixel size of Landsat 7 TIR channel, resampled at 30 m, allows assessing SUHI pattern variations at district level (the selected area is 300 m × 300 m). The level of detail of data derived from satellite is coarser than that of Figure 3, but looking at Figure 3 itself, it emerges that there are areas with the same characteristics (lawn finish, or painted metal roofs) covering a surface comparable or larger than the satellite pixel size. Even though sharp thermal variations are averaged with the surroundings inside the pixel area, the trend of the SUHI pattern can be delineated, revealing its behaviour inside the district.
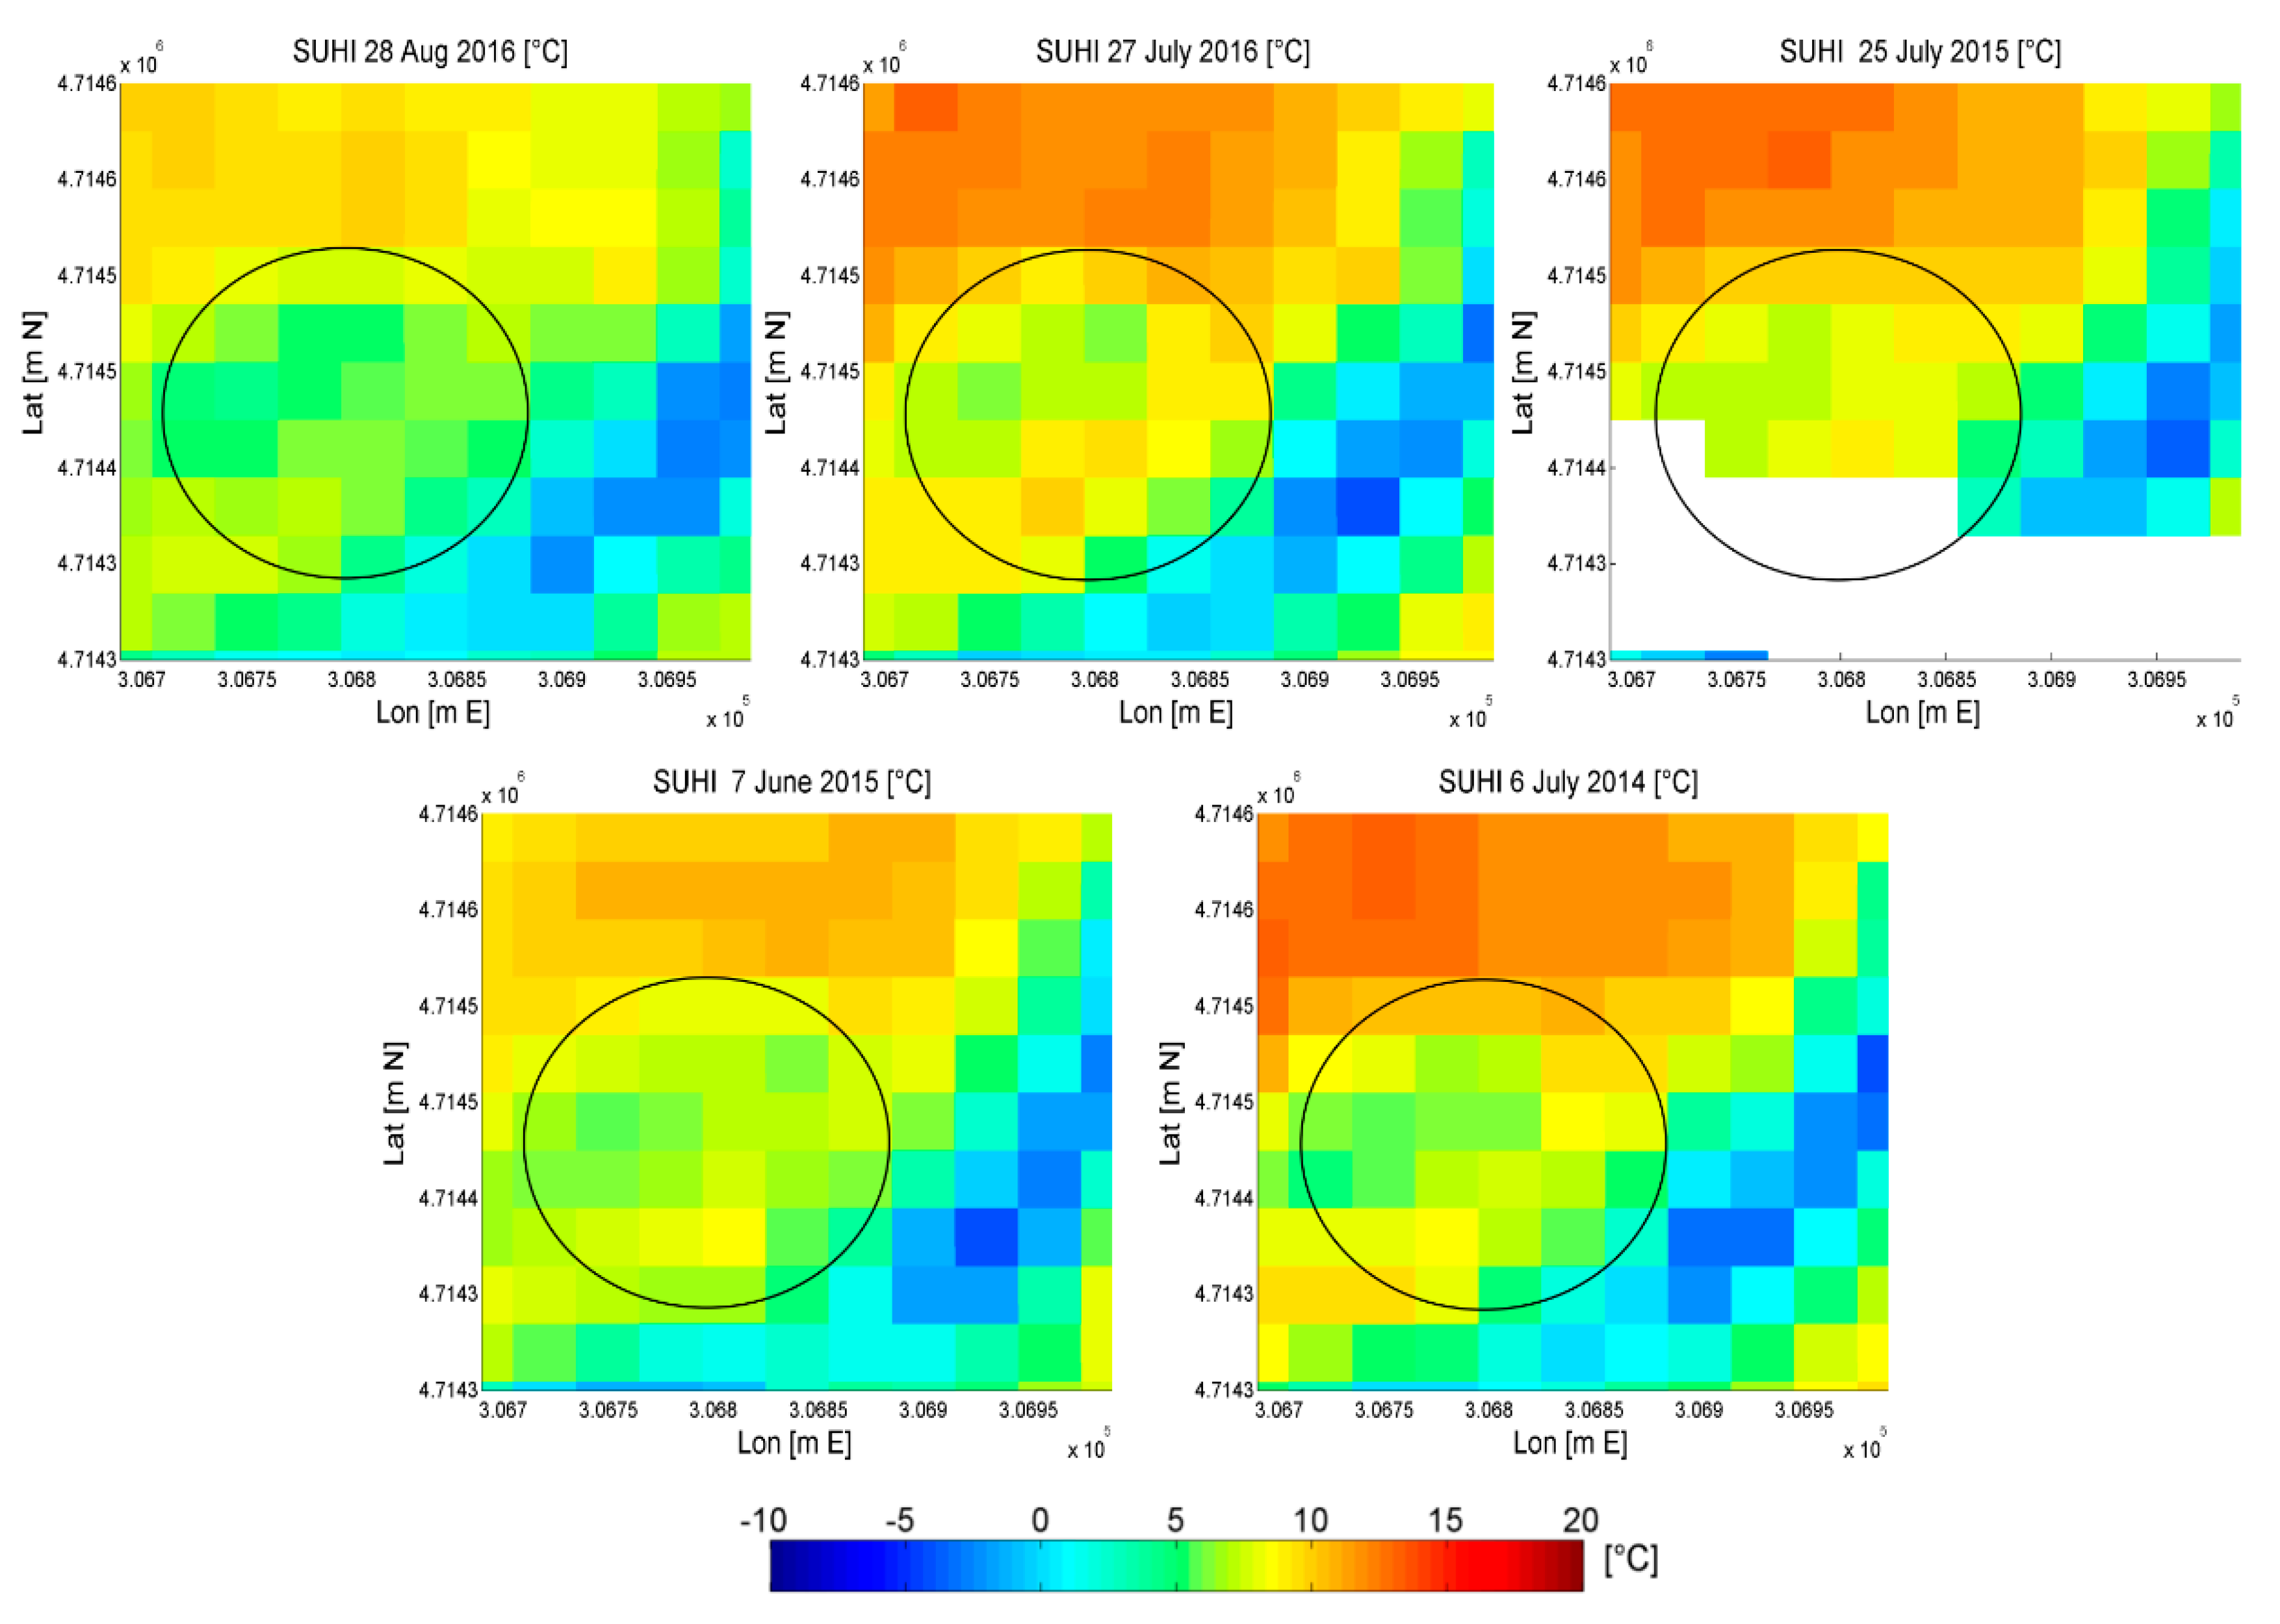
It is clear from Figure 5 how the new construction area (pixels inside the circle) produces a mitigation of the SUHI with respect to the heat island of the built-up area located in the upper part of the reported images (the latter area is present both pre- and post-interventions, as shown in Figure 2). The SUHI reduction is evident also during July, when a strong heating effect is found in the upper built-up area, and a difference of about 10 °C is observed between the two zones. In Figure 4, where the paved car park was not yet replaced by the new area, the heat island is similar or greater than the upper area, and the tree cooling effect is detectable only in the right part of the image, near the Nera River.
The SUHI diminution of the zone under analysis after June 2014 (around 5–6 °C) could be linked to various factors. As widely confirmed from literature [13,14,15,41], urban greenery mitigates SUHI: in the new district, from summer 2000 to summer 2016, the mean NDVI computed from satellite data increased from 0.19 to 0.23. Furthermore, a three-level underground car park was constructed and a significant part of the roadway transferred underground, thereby avoiding the temperature increase linked to the heat generated by the circulating vehicles on the corresponding area. This benefit is confirmed in a simulated study [42] reporting how the underground space development improves the urban microclimate. Finally, the construction of relatively high buildings with respect to the previous flat car park lot produced a shading effect and a probable improvement of the local air circulation. The impact of building design on the shadow effect was assessed in [43], showing how shorter urban buildings cause higher surface and near-surface temperatures during the daytime. Hu and Liao [44] suggest how a suitable space distance of buildings contributes to improve ventilation between them, and the new building position in Corso del Popolo seems to match the favourable conditions in [44].
Albedo Maps and Analytical Analysis
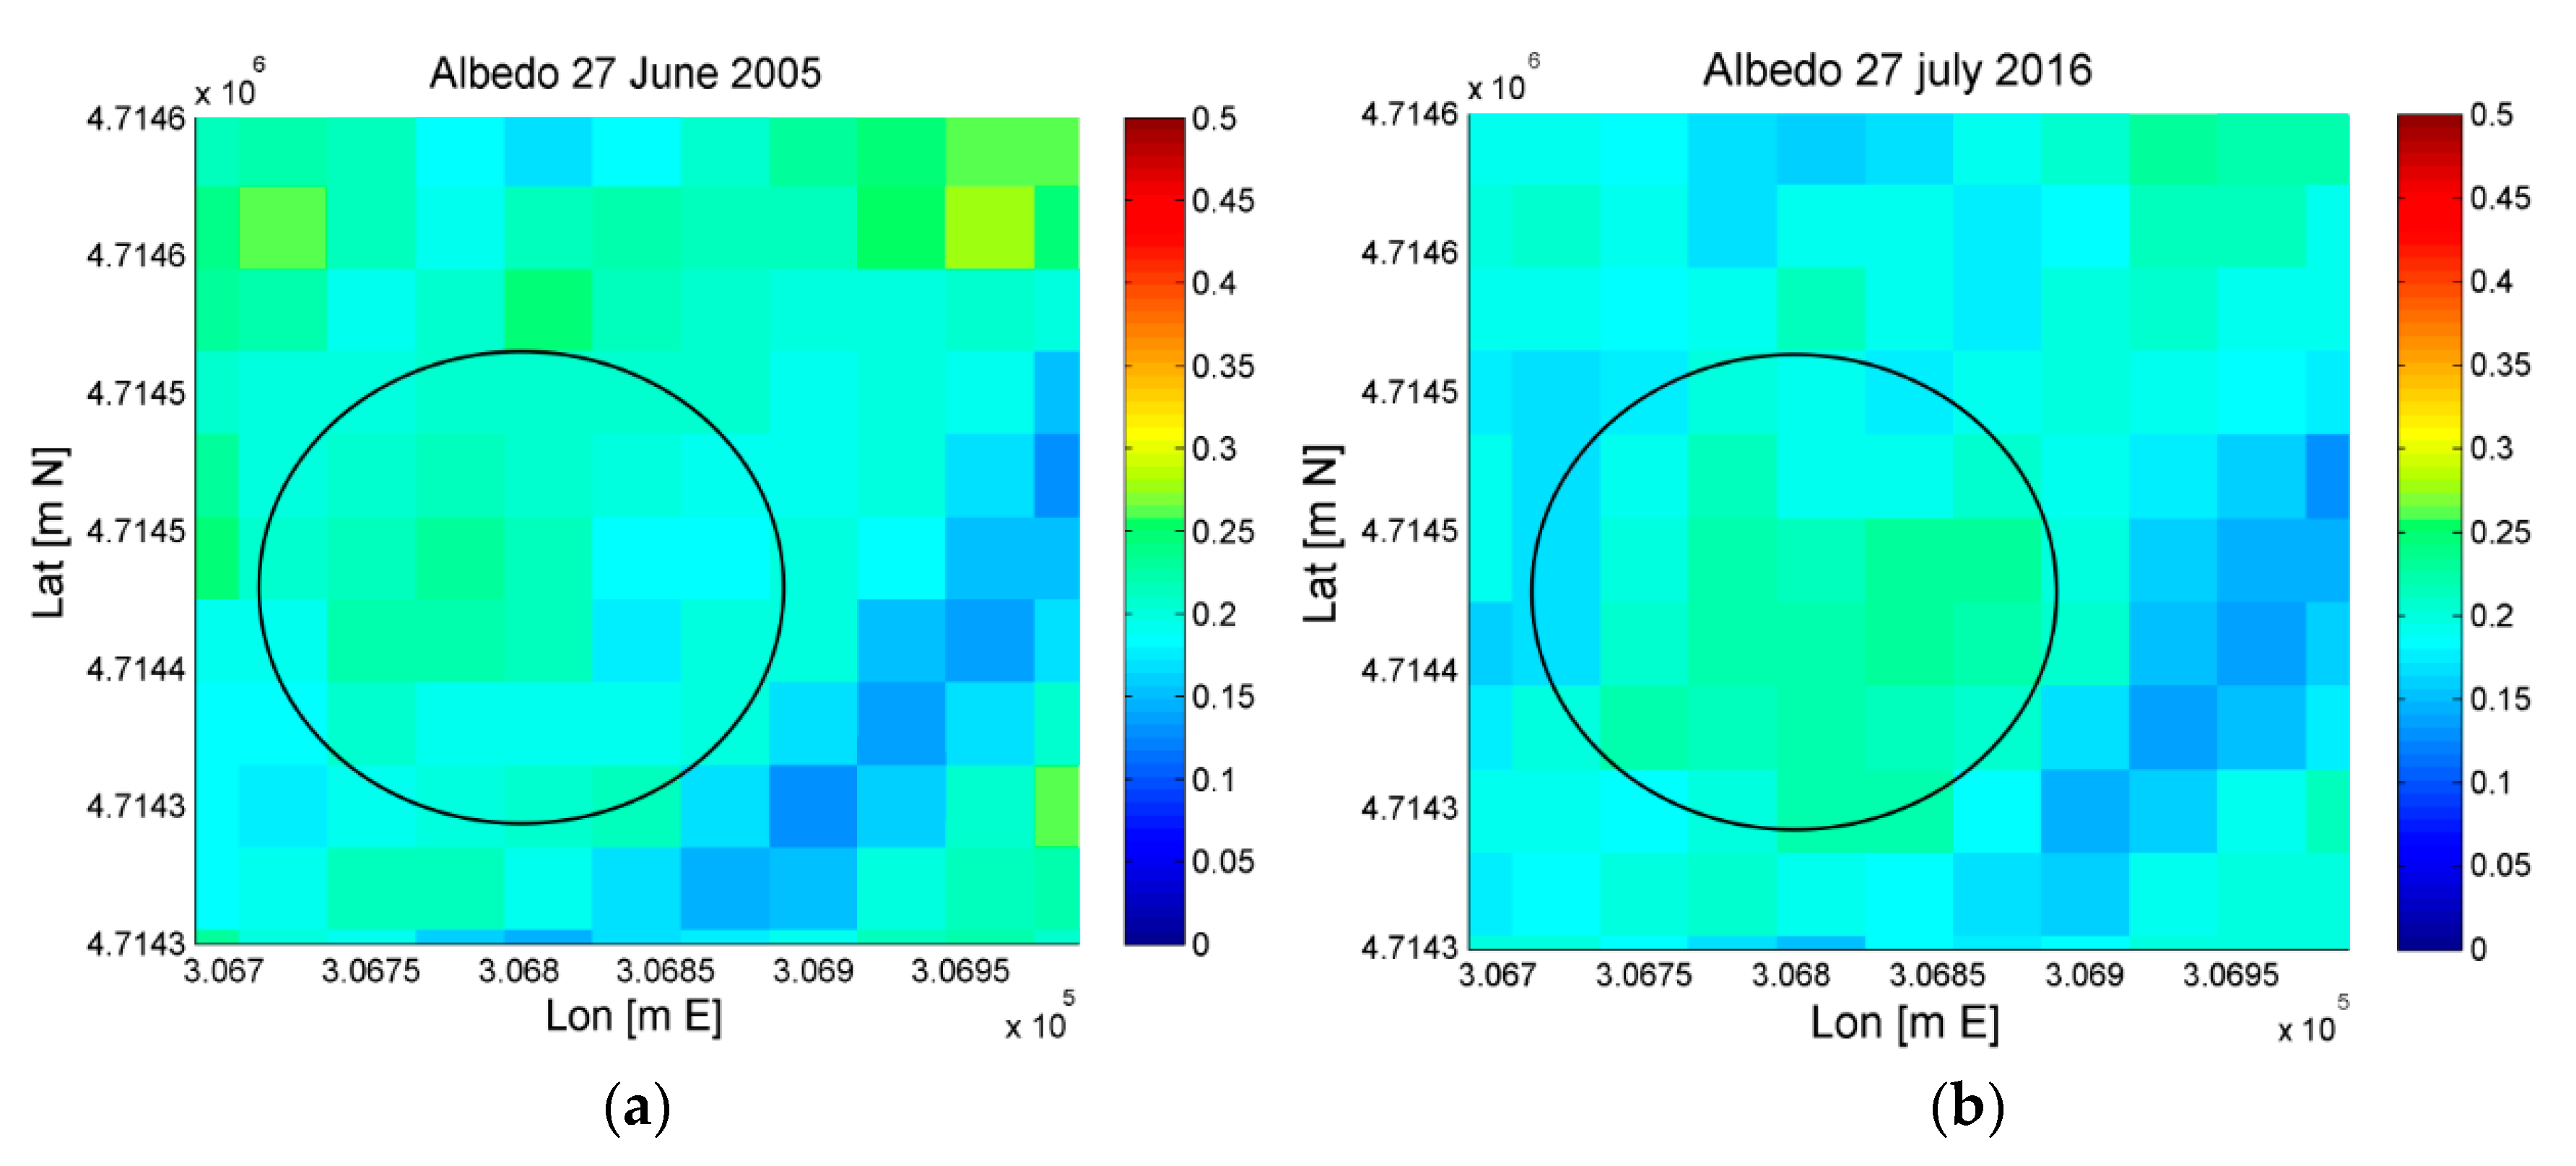
The previous SUHI patterns may be also analysed in conjunction with the albedo pattern variations pre- and post-intervention. The albedo retrieved by Landsat data proved to be a useful tool to detect surfaces with different albedo behaviour in a built environment [40,45], without expensive in situ measurements unevenly distributed in space, and therefore unable to provide a global pattern. A high reflective surface (typically light in colour) absorbs less solar radiation than a conventional low reflective surface (dark in colour). Therefore, it is expected that high albedo surfaces lead to lower LST and that low albedo ones lead to higher LST. It is important to underline that vegetation pixels are characterized by low albedo values, but the effect on local overheating is very different with respect to the low albedo of impervious surfaces. In fact, the solar energy stored by vegetation is mainly used for evapotranspiration and life processes, producing a cooling effect of the green areas. Figure 6 shows an example of two albedo maps pre- and post-intervention.
The purpose of this analysis is the evaluation of the albedo pattern in relation with the heating/cooling of the urban area. Figure 5 points out that the albedo variation in the changed area is not remarkable (pixel values are in the range of 0.18–0.24 for both images in the circled zone, with a slight increase post-intervention). The same pattern is roughly found in all the nine images. The satellite remote sensing using Landsat 7 reflective band observations provides a map of albedo values with a 30 m pixel size, averaging intrinsic reflectance heterogeneities at a finer scale. For instance, the presence of vegetation spots (low albedo) inside a built-up texture having high albedo produces a decreased value in the satellite pixel, even though both surfaces have a cooling effect. The shade generated by the new tall buildings may produce a retrieved albedo lower than its correct value, even if the Landsat 7 passages at around 12:00 reduce this effect, since midday sun position causes a reduction of the buildings shadow extension. Overall, taking into account the impact of the area with vegetation on albedo measurements, the new building system and impervious surfaces present an undiminished albedo pattern [46] with respect to the pre-intervention scene.
Before 2006 the paved parking had also perimetral trees that should have been a potential mitigation effect on summer heating of the area. Since the SUHI trend of Figure 3and Figure 4 shows a clear enhancement post-intervention, the synergy of different urban design solutions, as greenery, parking/roadway covering and building characteristics (dimension and materials) proves to be a more impacting feature. Therefore, to understand deeply the SUHI variations, an overall assessment by means of Equation (4), depending on construction material behaviour, air temperature and heat transfer, is useful.
Equation (4) suggests that the most practical parameter to be changed on a large scale is albedo [10]. At the same time, the emissivity of a surface affects LST. For SUHI mitigation, it is necessary to avoid low-emissivity surfaces since they maintain a higher surface temperature when exposed to the sun than a high-emissivity material. Low-emissivity materials include many unpainted/polished metal surfaces, whereas most not metallic urban surfaces exhibit high emissivity. High albedo roofs and walls can be obtained with white surface coatings, while high albedo pavement includes concrete and conventional asphalt with white aggregate. Considering the thermal storage, the convection coefficient describes the convective heat transfer between the surface and the air flowing over, depending on thermal properties of the medium, characteristics of its flow, surface geometry, thermal boundary conditions and the variability of the surface temperature. Furthermore, Equation (4) is valid in steady-state conditions: since satellite passages are at around midday, the thermal storage phenomenon is nearly terminated, considering that the surface warming by the sun started some hours before in summertime.
An example of the impact of each single parameter variation on the LST is reported in Table 3. The aim of this analysis is the evaluation of the most significant key factors inducing SUHI variation for impervious surfaces. The values for the electromagnetic parameters α and ε are chosen in a typical range for construction materials [47], as well as the hc range follows the characteristic behaviour in a built environment. The parameters Ta and Tsky are chosen in a range following the atmospheric conditions of continental Central Italy summer around midday [48] (Ta in the range 25–35 °C and Tsky in the range 278–288 K, the latter computed considering the relative humidity of air ranging from 30% to 70%). The incident solar radiation on the surface I is settled at 900 W/m2, an average value measured in the Central Italy in July 2016 at around 12:00 CEST.
It is evident that the LST in correspondence to impervious surfaces turns out to be strongly sensitive not only to the surface albedo, but also to the local convection coefficient, and to the surrounding air temperature. The increase of α shows a clear benefit on urban heating mitigation, as well as the hc increase and Ta decrease. The emissivity variation impact, in the typical range of built-up materials (significant unpainted or polished metallic surfaces are not present in the study area), is negligible.
Overall, the analysis confirms how the understanding of the SUHI variation requires the evaluation of both city planning factors (green surface, roadway and building design) and physical parameter behaviour (albedo, heat transfer and air circulation) [49].
5. Conclusions
Corso del Popolo district is an example of urban texture modification planned as regeneration of the ancient part of the town of Terni, and the assessment of the sustainable construction in terms of SUHI mitigation is an important practice. Remote sensing data provided by space-borne sensors confirm their usefulness in the monitoring of SUHI spatial pattern and its temporal evolution, making it possible to understand if the urban changes move towards a sustainable development. The advantage of using satellite observation techniques relies, beyond the wide area covered and multiple passages, on the ability to convey information without the need of ground measurements, the latter being unevenly distributed. Even though sharp thermal variations are averaged inside the pixel area, the trend of the SUHI pattern inside the district can be well delineated.
The adopted solutions for mitigating environmental impacts prove their efficiency in terms of SUHI reduction, as verified by the comparative analysis of space-borne LST summer images before and after the interventions. The positive effect on the district microclimate can be ascribed to the not diminished albedo values of the new impervious surfaces and materials, the green areas, the underground parking, the partial covering of the local roadway and the combined effects of shading and air circulation enhancement connected to the new multi-storey buildings.
Acknowledgments
The work has been supported by “Fondo di Ricerca di Base di Ateneo”, funded by the Department of Engineering of University of Perugia. Authors wish to thank Eng. Roberta Anniballe for the data processing support.
Author Contributions
Bonafoni, S., Baldinelli, G., Verducci, P. and Presciutti, A. conceived and designed the work and analyzed the data; Bonafoni, S. and Baldinelli, G. wrote the paper.
Conflicts of Interest
The authors declare no conflict of interest.
References
- Oke, T.R. The energetic basis of the urban heat island. Q. J. R. Meteorol. Soc. 1982, 108, 1–24. [Google Scholar] [CrossRef]
- Voogt, J.A. Urban Heat Island: Hotter Cities. ActionBioscience.org 2004. Available online: http://www.actionbioscience.org/environment/voogt.html (accessed on 5 October 2016).
- Ogashawara, I.; Bastos, V.S.B. A Quantitative Approach for Analyzing the Relationship between Urban Heat Islands and Land Cover. Remote Sens. 2008, 4, 3596–3618. [Google Scholar] [CrossRef]
- Rizwan, A.M.; Dennis, L.Y.C.; Chunho, L.I.U. A review on the generation, determination and mitigation of Urban Heat Island. J. Environ. Sci. 2008, 20, 120–128. [Google Scholar] [CrossRef]
- Pichierri, M.; Bonafoni, S.; Biondi, R. Satellite air temperature estimation for monitoring the canopy layer heat island of Milan. Remote Sens. Environ. 2012, 127, 130–138. [Google Scholar] [CrossRef]
- Icaza, L.E.; Van Den Dobbelsteen, A.; Van Der Hoeven, F. Integrating urban heat assessment in urban plans. Sustainability 2016, 8, 320. [Google Scholar] [CrossRef]
- Mackey, C.W.; Lee, X.; Smith, R.B. Remotely sensing the cooling effects of city scale efforts to reduce urban heat island. Build. Environ. 2012, 49, 348–358. [Google Scholar] [CrossRef]
- Smith, C.; Levermore, G. Designing urban spaces and buildings to improve sustainability and quality of life in a warmer world. Energy Policy 2008, 36, 4558–4562. [Google Scholar] [CrossRef]
- Shi, Z.; Zhang, X. Analyzing the effect of the longwave emissivity and solar reflectance of building envelopes on energy-saving in various climates. Sol. Energy 2011, 85, 28–37. [Google Scholar] [CrossRef]
- Bretz, S.; Akbari, H.; Rosenfeld, A. Practical issues for using solar-reflective materials to mitigate urban heat islands. Atmos. Environ. 1998, 32, 95–101. [Google Scholar] [CrossRef]
- Taha, H.; Akbari, H.; Rosenfeld, A.; Huang, J. Residential cooling loads and the urban heat island: The effects of albedo. Build. Environ. 1988, 23, 271–283. [Google Scholar] [CrossRef]
- Suehrcke, H.; Peterson, E.L.; Selby, N. Effect of roof solar reflectance on the building heat gain in a hot climate. Energy Build. 2008, 40, 2224–2235. [Google Scholar] [CrossRef]
- Alavipanah, S.; Wegmann, M.; Qureshi, S.; Weng, Q.; Koellner, T. The role of vegetation in mitigating urban land surface temperatures: A case study of Munich, Germany during the warm season. Sustainability 2015, 7, 4689–4706. [Google Scholar] [CrossRef]
- Givoni, B. Impact of planted areas on urban environmental quality: A review. Atmos. Environ. 1991, 25, 289–299. [Google Scholar] [CrossRef]
- Gusso, A.; Cafruni, C.; Bordin, F.; Veronez, M.R.; Lenz, L.; Crija, S. Multi-temporal patterns of urban heat Island as response to economic growth management. Sustainability 2015, 7, 3129–3145. [Google Scholar] [CrossRef]
- Lee, H.Y. An application of NOAA AVHRR thermal data to the study of urban heat islands. Atmos. Environ. 1993, 27, 1–13. [Google Scholar] [CrossRef]
- Gallo, K.P.; McNab, A.L.; Karl, J T.R.; Brown, F.; Hood, J.J.; Tarpley, J.D. The use of NOAA AVHRR data for assessment of the urban heat island effect. J. Appl. Meteorol. 1993, 32, 899–908. [Google Scholar] [CrossRef]
- Streutker, D.R. Satellite-measured growth of the urban heat island of Houston, Texas. Remote Sens. Environ. 2003, 85, 282–289. [Google Scholar] [CrossRef]
- Pu, R.; Gong, P.; Michishita, R.; Sasagawa, T. Assessment of multi-resolution and multi-sensor data for urban surface temperature retrieval. Remote Sens. Environ. 2006, 104, 211–225. [Google Scholar] [CrossRef]
- Anniballe, R.; Bonafoni, S.; Pichierri, M. Spatial and temporal trends of the surface and air heat island over Milan using Modis data. Remote Sens. Environ. 2014, 150, 163–171. [Google Scholar] [CrossRef]
- Lu, D.; Weng, Q. Spectral mixture analysis of ASTER images for examining the relationship between urban thermal features and biophysical descriptors in Indianapolis, Indiana, USA. Remote Sens. Environ. 2006, 104, 157–167. [Google Scholar] [CrossRef]
- Hartz, D.A.; Prashad, L.; Hedquist, B.C.; Golden, J.; Brazel, A.J. Linking satellite images and hand-held infrared thermography to observed neighbourhood climate conditions. Remote Sens. Environ. 2006, 104, 190–200. [Google Scholar] [CrossRef]
- Weng, Q.; Hu, X.; Quattrochi, D.A.; Liu, H. Assessing Intra-Urban Surface Energy Fluxes Using Remotely Sensed ASTER Imagery and Routine Meteorological Data: A Case Study in Indianapolis, U.S.A. IEEE J. Sel. Top. Appl. Earth Obs. Remote Sens. 2014, 7, 4046–4057. [Google Scholar] [CrossRef]
- Xian, G.; Crane, M. An analysis of urban thermal characteristics and associated land cover in Tampa Bay and Las Vegas using Landsat satellite data. Remote Sens. Environ. 2006, 104, 147–156. [Google Scholar] [CrossRef]
- Yuan, F.; Bauer, M.E. Comparison of impervious surface area and normalized difference vegetation index as indicators of surface urban heat island effects in Landsat imagery. Remote Sens. Environ. 2007, 106, 375–386. [Google Scholar] [CrossRef]
- Xu, H.; Ding, F.; Wen, X. Urban Expansion and Heat Island Dynamics in the Quanzhou Region, China. IEEE J. Sel. Top. Appl. Earth Obs. Remote Sens. 2009, 2, 74–79. [Google Scholar] [CrossRef]
- Urbanpromo. Available online: urbanpromo.it/2014-en/progetti/the-project-financing-of-corso-del-popolo-in-terni/ (accessed on 15 November 2016).
- Regione Umbria—Giunta Regionale—SIAT Sistema Informativo Regionale Ambientale e Territoriale. Available online: siat.regione.umbria.it/paesaggineltempo/ (accessed on 1 December 2016).
- U.S. Geological Survey, Earth Explorer. Available online: earthexplorer.usgs.gov (accessed on 15 December 2016).
- Chander, G.; Markham, B.L.; Helder, D.L. Summary of Current Radiometric Calibration Coefficients for Landsat MSS, TM, ETM+, and EO-1 ALI sensors. Remote Sens. Environ. 2009, 113, 893–903. [Google Scholar] [CrossRef]
- Chavez, P.S. Image-based atmospheric corrections—Revisited and improved. Photogramm. Eng. Remote Sens. 1996, 62, 1025–1036. [Google Scholar]
- Jimenez-Munoz, J.C.; Sobrino, J.A. A generalized single-channel method for retrieving land surface temperature from remote sensing data. J. Geophys. Res. 2003, 108, 1–9. [Google Scholar] [CrossRef]
- Bonafoni, S. Downscaling of Landsat and MODIS Land Surface Temperature over the heterogeneous urban area of Milan. IEEE J. Sel. Top. Appl. Earth Obs. Remote Sens. 2016, 9. [Google Scholar] [CrossRef]
- Atmospheric Correction Parameter Calculator. Available online: https://atmcorr.gsfc.nasa.gov/ (accessed on 10 January 2017).
- Barsi, J.A.; Barker, J.L.; Schott, J.R. An atmospheric correction parameter calculator for a single thermal band earth-sensing instrument. In Proceedings of the IEEE International Geoscience and Remote Sensing Symposium, Toulouse, France, 21–25 July 2003; pp. 3014–3016. [Google Scholar]
- Sobrino, J.A.; Jimenez-Munoz, J.C.; Paolini, L. Land surface temperature retrieval from LANDSAT TM 5. Remote Sens. Environ. 2004, 90, 434–440. [Google Scholar] [CrossRef]
- Bonafoni, S. The spectral index utility for summer urban heating analysis. J. Appl. Remote Sens. 2015, 9. [Google Scholar] [CrossRef]
- Liang, S. Narrowband to broadband conversions of land surface albedo—I Algorithms. Remote Sens. Environ. 2001, 76, 213–238. [Google Scholar] [CrossRef]
- Schaepman-Strub, G.; Schaepman, M.E.; Painter, T.H.; Dangel, S.; Martonchik, J.V. Reflectance quantities in optical remote sensing-definitions and case studies. Remote Sens. Environ. 2006, 103, 27–42. [Google Scholar] [CrossRef]
- Baldinelli, G.; Bonafoni, S.; Anniballe, R.; Presciutti, A.; Gioli, B.; Magliulo, V. Spaceborne detection of roof and impervious surface albedo: Potentialities and comparison with airborne thermography measurements. Sol. Energy 2015, 113, 281–294. [Google Scholar] [CrossRef]
- Park, J.-H.; Cho, G.-H. Examining the Association between Physical Characteristics of Green Space and Land Surface Temperature: A Case Study of Ulsan, Korea. Sustainability 2016, 8, 777. [Google Scholar] [CrossRef]
- Yang, X.; Chen, Z.; Cai, H.; Ma, L. A Framework for Assessment of the Influence of China’s Urban Underground Space Developments on the Urban Microclimate. Sustainability 2014, 6, 8536–8566. [Google Scholar] [CrossRef]
- Loughner, C.P.; Allen, D.J.; Zhang, D.; Pickering, K.E.; Dickerson, R.R.; Landry, L. Roles of Urban Tree Canopy and Buildings in Urban Heat Island Effects: Parameterization and Preliminary Results. J. Appl. Meteorol. Climatol. 2012, 51, 1775–1793. [Google Scholar] [CrossRef]
- Hu, W.; Liao, X. Practice on improvement of urban thermal environment with evaporation combined CFD simulation. In Modeling and Computation in Engineering II; Liquan, X., Ed.; Taylor and Francis Group: London, UK, 2013. [Google Scholar]
- Bonafoni, S.; Baldinelli, G.; Verducci, P. Sustainable strategies for smart cities: Analysis of the town development effect on surface urban heat island through remote sensing methodologies. Sustain. Cities Soc. 2017, 29, 211–218. [Google Scholar] [CrossRef]
- Rossi, F.; Castellani, B.; Presciutti, A.; Morini, E.; Anderini, E.; Filipponi, M.; Nicolini, A. Experimental evaluation of urban heat island mitigation potential of retro-reflective pavement in urban canyons. Energy Build. 2016, 126, 340–352. [Google Scholar] [CrossRef]
- Kotthaus, S.; Thomas Smith, E.L.; Wooster, M.J.; Grimmond, C.S.B. Derivation of an urban materials spectral library through emittance and reflectance spectroscopy. SPRS J. Photogramm. Remote Sens. 2014, 94, 194–212. [Google Scholar]
- Weather Underground 2017. Available online: http://www.wunderground.com (accessed on 15 February 2017).
- Echevarría Icaza, L.; van den Dobbelsteen, A.; van der Hoeven, F. Integrating Urban Heat Assessment in Urban Plans. Sustainability 2016, 8, 320. [Google Scholar] [CrossRef]
Figure 1.
(a) Terni location (city centre coordinates 42.56° N, 12.64° E); (b): the new built-up area of Corso del Popolo, picture from [27].
Figure 1.
(a) Terni location (city centre coordinates 42.56° N, 12.64° E); (b): the new built-up area of Corso del Popolo, picture from [27].

Figure 2.
(a) Regione Umbria (RU) image of Corso del Popolo district on 2005 [28] selected area of 300 × 300 m; (b) Google Earth (GE) image on 2015. Universal Transverse Mercator (UTM) WGS84 coordinates (33T zone): longitude range (m E): 306,690–306,990, latitude range (m N): 4,714,300–4,714,600.
Figure 2.
(a) Regione Umbria (RU) image of Corso del Popolo district on 2005 [28] selected area of 300 × 300 m; (b) Google Earth (GE) image on 2015. Universal Transverse Mercator (UTM) WGS84 coordinates (33T zone): longitude range (m E): 306,690–306,990, latitude range (m N): 4,714,300–4,714,600.

Figure 3.
Main external materials used in the new study area.

Figure 4.
Pre-intervention surface urban heat island (SUHI) maps (°C): 27 June 2005; 24 June 2004; 16 August 2000, and; 31 July 2000. Landsat pixels are 30 × 30 m from the USGS. Lat/lon are in UTM WGS84 coordinates, 33T zone.
Figure 4.
Pre-intervention surface urban heat island (SUHI) maps (°C): 27 June 2005; 24 June 2004; 16 August 2000, and; 31 July 2000. Landsat pixels are 30 × 30 m from the USGS. Lat/lon are in UTM WGS84 coordinates, 33T zone.

Figure 5.
Post-intervention SUHI maps [°C]: 28 August 2016; 27 July 2016; 25 July 2015; 7 June 2015, and; 6 July 2014.
Figure 5.
Post-intervention SUHI maps [°C]: 28 August 2016; 27 July 2016; 25 July 2015; 7 June 2015, and; 6 July 2014.

Figure 6.
Albedo maps; (a) 27 June 2005; (b) 27 July 2016.

Table 1.
Landsat 7 ETM+ channels and spectral range. Visible (VIS); near infrared (NIR); short-wavelength infrared (SWIR); thermal infrared region (TIR).
Table 1.
Landsat 7 ETM+ channels and spectral range. Visible (VIS); near infrared (NIR); short-wavelength infrared (SWIR); thermal infrared region (TIR).
| ETM + Channels | Spectral Range (µm) |
|---|---|
| Ch_1—VIS (blue) | 0.45–0.51 |
| Ch_2—VIS (green) | 0.52–0.60 |
| Ch_3—VIS (red) | 0.63–0.69 |
| Ch_4—NIR | 0.77–0.90 |
| Ch_5—SWIR | 1.55–1.75 |
| Ch_6—TIR | 10.31–12.36 |
| Ch_7—SWIR | 2.06–2.35 |
| Ch_8—panchromatic | 0.52–0.90 |
Table 2.
Landsat 7 ETM + scenes analysed.
| Period | Date |
|---|---|
| Pre-Intervention | 27 June 2005, 24 June 2004, 16 August 2000, 31 July 2000 |
| Post-Intervention | 28 August 2016, 27 July 2016, 25 July 2015, 7 June 2015, 6 July 2014 |
Table 3.
Land surface temperature (LST) variation from Equation (4) (I = 900 W/m2).
| Varying Parameter | Fixed Parameters | LST Variation (°C) | LST Variation (%) |
|---|---|---|---|
| α: 0.13 ÷ 0.40 | ε = 0.93 Tsky = 283 K Ta = 30°C hc = 15 W/m2·K | 60.9 ÷ 50.2 | −17% |
| ε: 0.85 ÷ 0.95 | α = 0.25 Tsky = 283 K Ta = 30°C hc = 15 W/m2·K | 57.3 ÷ 55.9 | −2% |
| Tsky: 278 ÷ 288 K | α = 0.25 ε = 0.93 Ta = 30°C hc = 15 W/m2·K | 55.2 ÷ 57.3 | +3% |
| Ta: 25 ÷ 35 °C | α = 0.25 ε = 0.93 Tsky = 283 K hc = 15 W/m2·K | 52.8 ÷ 59.5 | +13% |
| hc: 10 ÷ 20 W/m2·K | α = 0.25 ε = 0.93 Tsky = 283 K Ta = 30 °C | 66.3 ÷ 55.1 | −17% |
© 2017 by the authors. Licensee MDPI, Basel, Switzerland. This article is an open access article distributed under the terms and conditions of the Creative Commons Attribution (CC BY) license (http://creativecommons.org/licenses/by/4.0/).
Share and Cite
MDPI and ACS Style
Bonafoni, S.; Baldinelli, G.; Verducci, P.; Presciutti, A. Remote Sensing Techniques for Urban Heating Analysis: A Case Study of Sustainable Construction at District Level. Sustainability 2017, 9, 1308. https://doi.org/10.3390/su9081308
AMA Style
Bonafoni S, Baldinelli G, Verducci P, Presciutti A. Remote Sensing Techniques for Urban Heating Analysis: A Case Study of Sustainable Construction at District Level. Sustainability. 2017; 9(8):1308. https://doi.org/10.3390/su9081308
Chicago/Turabian StyleBonafoni, Stefania, Giorgio Baldinelli, Paolo Verducci, and Andrea Presciutti. 2017. "Remote Sensing Techniques for Urban Heating Analysis: A Case Study of Sustainable Construction at District Level" Sustainability 9, no. 8: 1308. https://doi.org/10.3390/su9081308
Note that from the first issue of 2016, this journal uses article numbers instead of page numbers. See further details here.