Landscape Services Assessment: A Hybrid Multi-Criteria Spatial Decision Support System (MC-SDSS)


Department of Architecture (DiARC), University of Naples Federico II, 80134 Naples, Italy
*
Author to whom correspondence should be addressed.
Sustainability 2017, 9(8), 1311; https://doi.org/10.3390/su9081311
Submission received: 29 June 2017
/
Revised: 18 July 2017
/
Accepted: 20 July 2017
/
Published: 27 July 2017
(This article belongs to the Section Environmental Sustainability and Applications)
Abstract
:This research aims to test a scalable and transferable Geographic Information System (GIS)-based evaluation methodology for the identification, quantification and assessment of multi-functional landscape features. The evaluation of multi-functional features is one of the key tasks required when it comes to identifying the values that people attribute to landscapes, according to the principles of the European Landscape Convention. Mapping the static distribution of Landscape Services (LS) through data-derived estimates and performing spatial composite indicators are fundamental steps in understanding the current state of the Social–Ecological System (SES) of threatened or resilient landscapes. The methodological process is structured in four phases: intelligence (i), design (ii), choice (iii) and outcome (iv), according to the framework of the Multi-Criteria Spatial Decision Support System (MC-SDSS). This process has been implemented in the case study of the National Park of Cilento, Vallo di Diano and Alburni (Italy). The weighting of the spatial indicators, which simulates the model of LS-functioning for the study area, derives from an entropy-based method. Such a method, by which the weights are estimated without decisional agents, concerns a key-concept of information entropy theory, whereby the amount of information for each criterion determines its relative importance within a defined set of spatial criteria. The output of the model concerns mapping composite indicators of the LS; this involves the macro-categories of Regulating, Provisioning, and Cultural Services.
1. Introduction
Since the time of the Industrial Revolution, substantial environmental pressures have affected the landscape, with many of these pressures resulting from human activities and the deep transformations of the Social–Ecological System (SES). These factors characterise the contemporary epoch and have led some authors to define the period as the “Anthropocene Age”: a new human-dominated geological epoch [1,2].
The Anthropocene Model considers the landscape as a complex system and identifies five transforming phases [3,4,5]. Firstly, technological innovations, anthropological discoveries and strengthened power systems activate the processes of change of the SES by generating gradual but ongoing modifications in the landscape structure. These phenomena characterise the trigger phase of the Anthropocene (i.e., Industrialization). Moreover, the second macro-shift (The Great Acceleration) involves the transformation phase, which is affected by an increasing complexity and great pressures on the social and natural environment. Finally, the Chaos phase involves critical changes in social values, ethics and culture, thus leading to a bifurcation point by which the landscape system follows two likely scenarios: the breakdown or the breakthrough. While the breakdown generates conflicts or an irreversible loss of resources/values, the breakthrough fosters relationships between the human being and the ecosystem of the urban, rural, semi-natural and natural landscapes, according to a total sustainability perspective [6,7].
After examining the above considerations, it is clear that an understanding of the drivers affecting the meaningful changes to the landscape SES is one of the critical challenges which must be managed when tackling sustainability issues [8]. In Europe, the European Landscape Convention (ELC) [9] made a statement about the fundamental rights of citizens; it aimed to recognise their own landscapes and, consequently, to safeguard the primary resources, services and benefits which the landscapes guarantee for human well-being [10,11].
The ELC addresses a new paradigm which aims to increase the amount of knowledge and the number of conservations relating to the landscape SES. As such, the strong relationship between the landscape’s ability to provide goods/services and the human need to preserve the functioning of the ecosystems must be fostered by the citizens and local communities [12,13]. Moreover, the fundamental, and most ambitious, goal of the ELC concerns the improvement of landscape quality as a whole; indeed, this is reflective of citizens’ ambitions regarding the identity-related features of their life environment. According to this perspective, the human being is the core subject; his or her ability to investigate the critical features of a landscape, to stimulate changes, and to evaluate a landscape’s multi-functional features can be considered one of the driving forces behind identifying the values that people attribute to landscapes [14]. Multi-functional landscapes can be considered as those landscapes which are able to provide multiple functions and values and which focus on the degree of multi-functionality that is affected by the spatial distribution and scale of the geographical features that supply services and benefits for human well-being [15,16]. The consideration of multi-functional landscapes is vital when it comes to developing sustainable landscapes; this allows for the co-existence of compatible and competing uses, and also makes efficient use of limited space and time, produces advantages of synergy, and contributes to the economic vitality and environmental quality of cities, while also developing a wide and lasting support from the different users of their functions [15]. Indeed, multi-functional landscapes should be perceived as tangible mixed natural and cultural interacting systems; the design of sustainable multifunctional landscapes requires transdisciplinary approaches that make full use of the available science and technology, based on a true engagement between scientists, practitioners and professionals involved in land use decision-making [17,18,19]. While multi-functionality has become a keyword in terms of understanding the sustainability of different landscape types [20,21,22,23], considering the SES theory within the evaluation methods of multi-functional landscapes is useful in improving the knowledge of services and their demand on both a local and regional scale [24]. Indeed, Termorshuizen and Opdam (2009) recommended the landscape services (LS) concept as a common ground for a trans-disciplinary study which would be able to link together the main topics of landscape ecology and sustainability. According to the authors, the LS can be seen as a specification of the Ecosystem Services (ES) concept, and landscape multi-functionality can be understood by investigating the spatial configuration of the benefits and services for humans on the scale of the landscape. Moreover, the LS concept, as a multi-dimensional approach in ecological economics which includes ES, enables an evaluation of the structure/function/value chains of the landscapes [3,22].
Moreover, according to [25], the concept of the LS involves the social dimensions of the landscape and the spatial patterns resulting from both natural and human processes in the provision of benefits for human well-being [25]. Thus, knowledge of the dynamics of the landscape must interact with the values linked to the planning of new landscape patterns and functional changes. The inclusion of landscape and ecosystem services in the decision-making process makes it possible to reduce the loss of the natural capital by considering the public and private benefits which the ecosystems produce for human well-being [26,27].
The application field of the principles of the ELC is very wide, as it encompasses many landscape types (i.e., natural, semi-natural, urban and peri-urban landscapes), and, likewise, many categories of landscapes, according to their outstanding features, ordinary nature or weaknesses. Thus, the ELC’s principles address a new way of understanding and safeguarding the landscape SES. Nevertheless, it is essential to explore a common framework involving a set of consistent variables to be considered in data gathering, landscape modelling, and the evaluation and analysis of findings related to SES sustainability [8].
Landscape Sustainability Science (LSS) is an interesting attempt to outline a pathway whereby the varied and sometimes conflicting thinking about landscape sustainability can converge and cooperate. The LSS aims to depict a time-history of the sustainability concept and models, by offering a new trans-disciplinary and multi-dimensional framework which includes landscape ecology [3]. When faced with landscapes as complex systems which change and evolve dynamically, the problem-solving process must be as broad and exploratory as possible [13]. According to [28], the target of sustainability refers to the types, values and practices that affect divergent landscapes; e.g., natural or cultural, traditional or contemporary, spectacular or ordinary landscapes [28]. A holistic approach which considers multi-functional landscapes from the perspective of the total human ecosystem, with both material–physical and immaterial–symbolic realities and culture-nature interactions, is the basis of the landscape definition put forth by the ELC [29,30]. For this reason, an integrated and cross-scale approach to the LSS must be investigated in order to address the multi-dimensional issues related to a more specific framework by operationalising the ELC’s recommendations.
According to the ELC, there remains a need for an “objective evaluation” of landscape values, using quantitative methods; indeed, this is an open field of research, since it encompasses many variables which must be considered; i.e., temporal dynamics, the scale dependence of the data, the 3-D differences and the different perceptions of landscape observers [31].
As one of the most recent theories, the LSS has the advantage of integrating the concepts of sustainability, resilience and well-being into a wider framework, which makes it possible to produce a place-based and trans-disciplinary study about the landscape, on both a broader and finer scale, through spatially explicit methods [3]. Conversely, the downside of this holistic theory likely relates to the extreme complexity of a practical application in the decision-making processes, due to the different languages of the disciplines involved and, most importantly, the multi-sectorial issues which exponentially increase the number of variables to be considered. Concurrently, the LSS is a very general concept which is not easily implemented in practice [28]. In order to avoid these drawbacks, a defined area of interest within landscape research must be highlighted by tailoring it according to the main objectives of environmental analysis and planning.
Definitively, the gradual integration of landscape ecology into a new scientific paradigm, based on ecosystem goods/services and characterised by an anthropocentric focus, is one way of connecting disciplines when facing the sustainability debate [32,33].
Lastly, the increasing complexity of contemporary landscapes and, concurrently, the multiple parameters and indicators to be considered in the decisional processes lead to the rising need for consistent and reliable estimates. Indeed, some authors have stated that robustness is one of the most important qualities to be guaranteed when making estimates [34]. Moreover, an enhancement of spatially explicit and multi-criteria methods should be prioritised within multi-functional landscape (ML) evaluations [24,35].
According to the above-mentioned considerations, the main topic of this paper focuses on a GIS-based evaluation methodology for the incorporation of the LS approach into landscape planning and environmental management. The purpose of the research is to formulate a scalable and transferable GIS-based method for the quantification and evaluation of the LS. The following open questions motivate the research:
- How can the landscapes’ intangible/non-monetary values be evaluated?
- How many levels of the LS must be considered, and which are the effective methods for their classification?
- Which are the opportunities and weaknesses related to using a GIS-based methodology for the LS evaluation?
- How does the multi-criteria hybrid approach facilitate the assessment of the LS?
- How does the LS approach aid the decision-making process in landscape management and planning?
These questions constitute the general drivers of the proposed approach. Nevertheless, it is not the authors’ intention to answer them systematically, because each question opens up fields of research which have been widely reviewed in the literature. Instead, this paper will attempt to formulate a methodology with which to map the “static distributions” of the LS with data-derived estimates [36]. The Landscape Services Indicators (LSI) will be treated as the proxy-criteria, which simulate the current state of the services, while the spatial composite indicators will be created by aggregating the LSI using multi-criteria combinatorial rules [37,38]. The research will aim to explore the main theories and mapping approaches linked to the concept of the LS/ES and will provide a general framework for the visualisation of the relationships between the LS classes and well-being dimensions, according to the Millennium Ecosystem Assessment [11].
The paper highlights a spatially explicit methodology for LS evaluation through the integration of multi-criteria techniques and the landscape metrics (LM) approach; this involves experimenting with a hybrid multi-criteria approach [39] which is able to provide cthe omposite indicator mapping of the LS, in order to support the decision-making process, and address sustainable strategies for the selected focus area. The expected results will provide the composite indicator mapping of the LS for the categories of regulating services (RS), provisioning services (PS) and cultural services (CS). The second section outlines the tools and methods utilised within the evaluation process, while the third section introduces a case study. The fourth section summarises the application of the methodology for the case study by highlighting the results. The fifth section discusses the conclusions, limitations and future directions of the research.
2. Materials and Methods
According to [24], the three main approaches to the evaluation of the LS are the following: spatially explicit assessment (i), landscape approach (ii) and (iii) spatial multi-criteria analysis [24]. The first method (i) implies data-gathering and modelling in order to generate a landscape representation model through spatial indicators and indices. Moreover, mapping the LS highlights spatial patterns and relationships among services at a cross-scale level, and makes it possible to identify benefiting populations and to improve the evaluation process by addressing planning and decision-making [24,40].
The landscape approach (ii) investigates the relationships between landscape features, structures, functions, and the capacity to produce LS/ES. The method utilises land use/land cover (LULC) as representatives of the physical and social processes across the landscape; indeed, this requires spatially explicit indicators of the LS. The weighting phase of landscape values can be achieved through expert-led evaluation, deliberative approaches, or by modelling the relationships between the ecological process and the LULC pattern. Since the landscape approach focuses on individual indicators, the Spatial Multi-Criteria Analysis (SMCA) approach (iii) allows for the combining of indicators, in order to produce a multi-dimensional mapping of the LS. In this study, a value-based method, by which the suitable scenarios originated from the values assigned to spatially explicit criteria, was implemented [41,42,43].
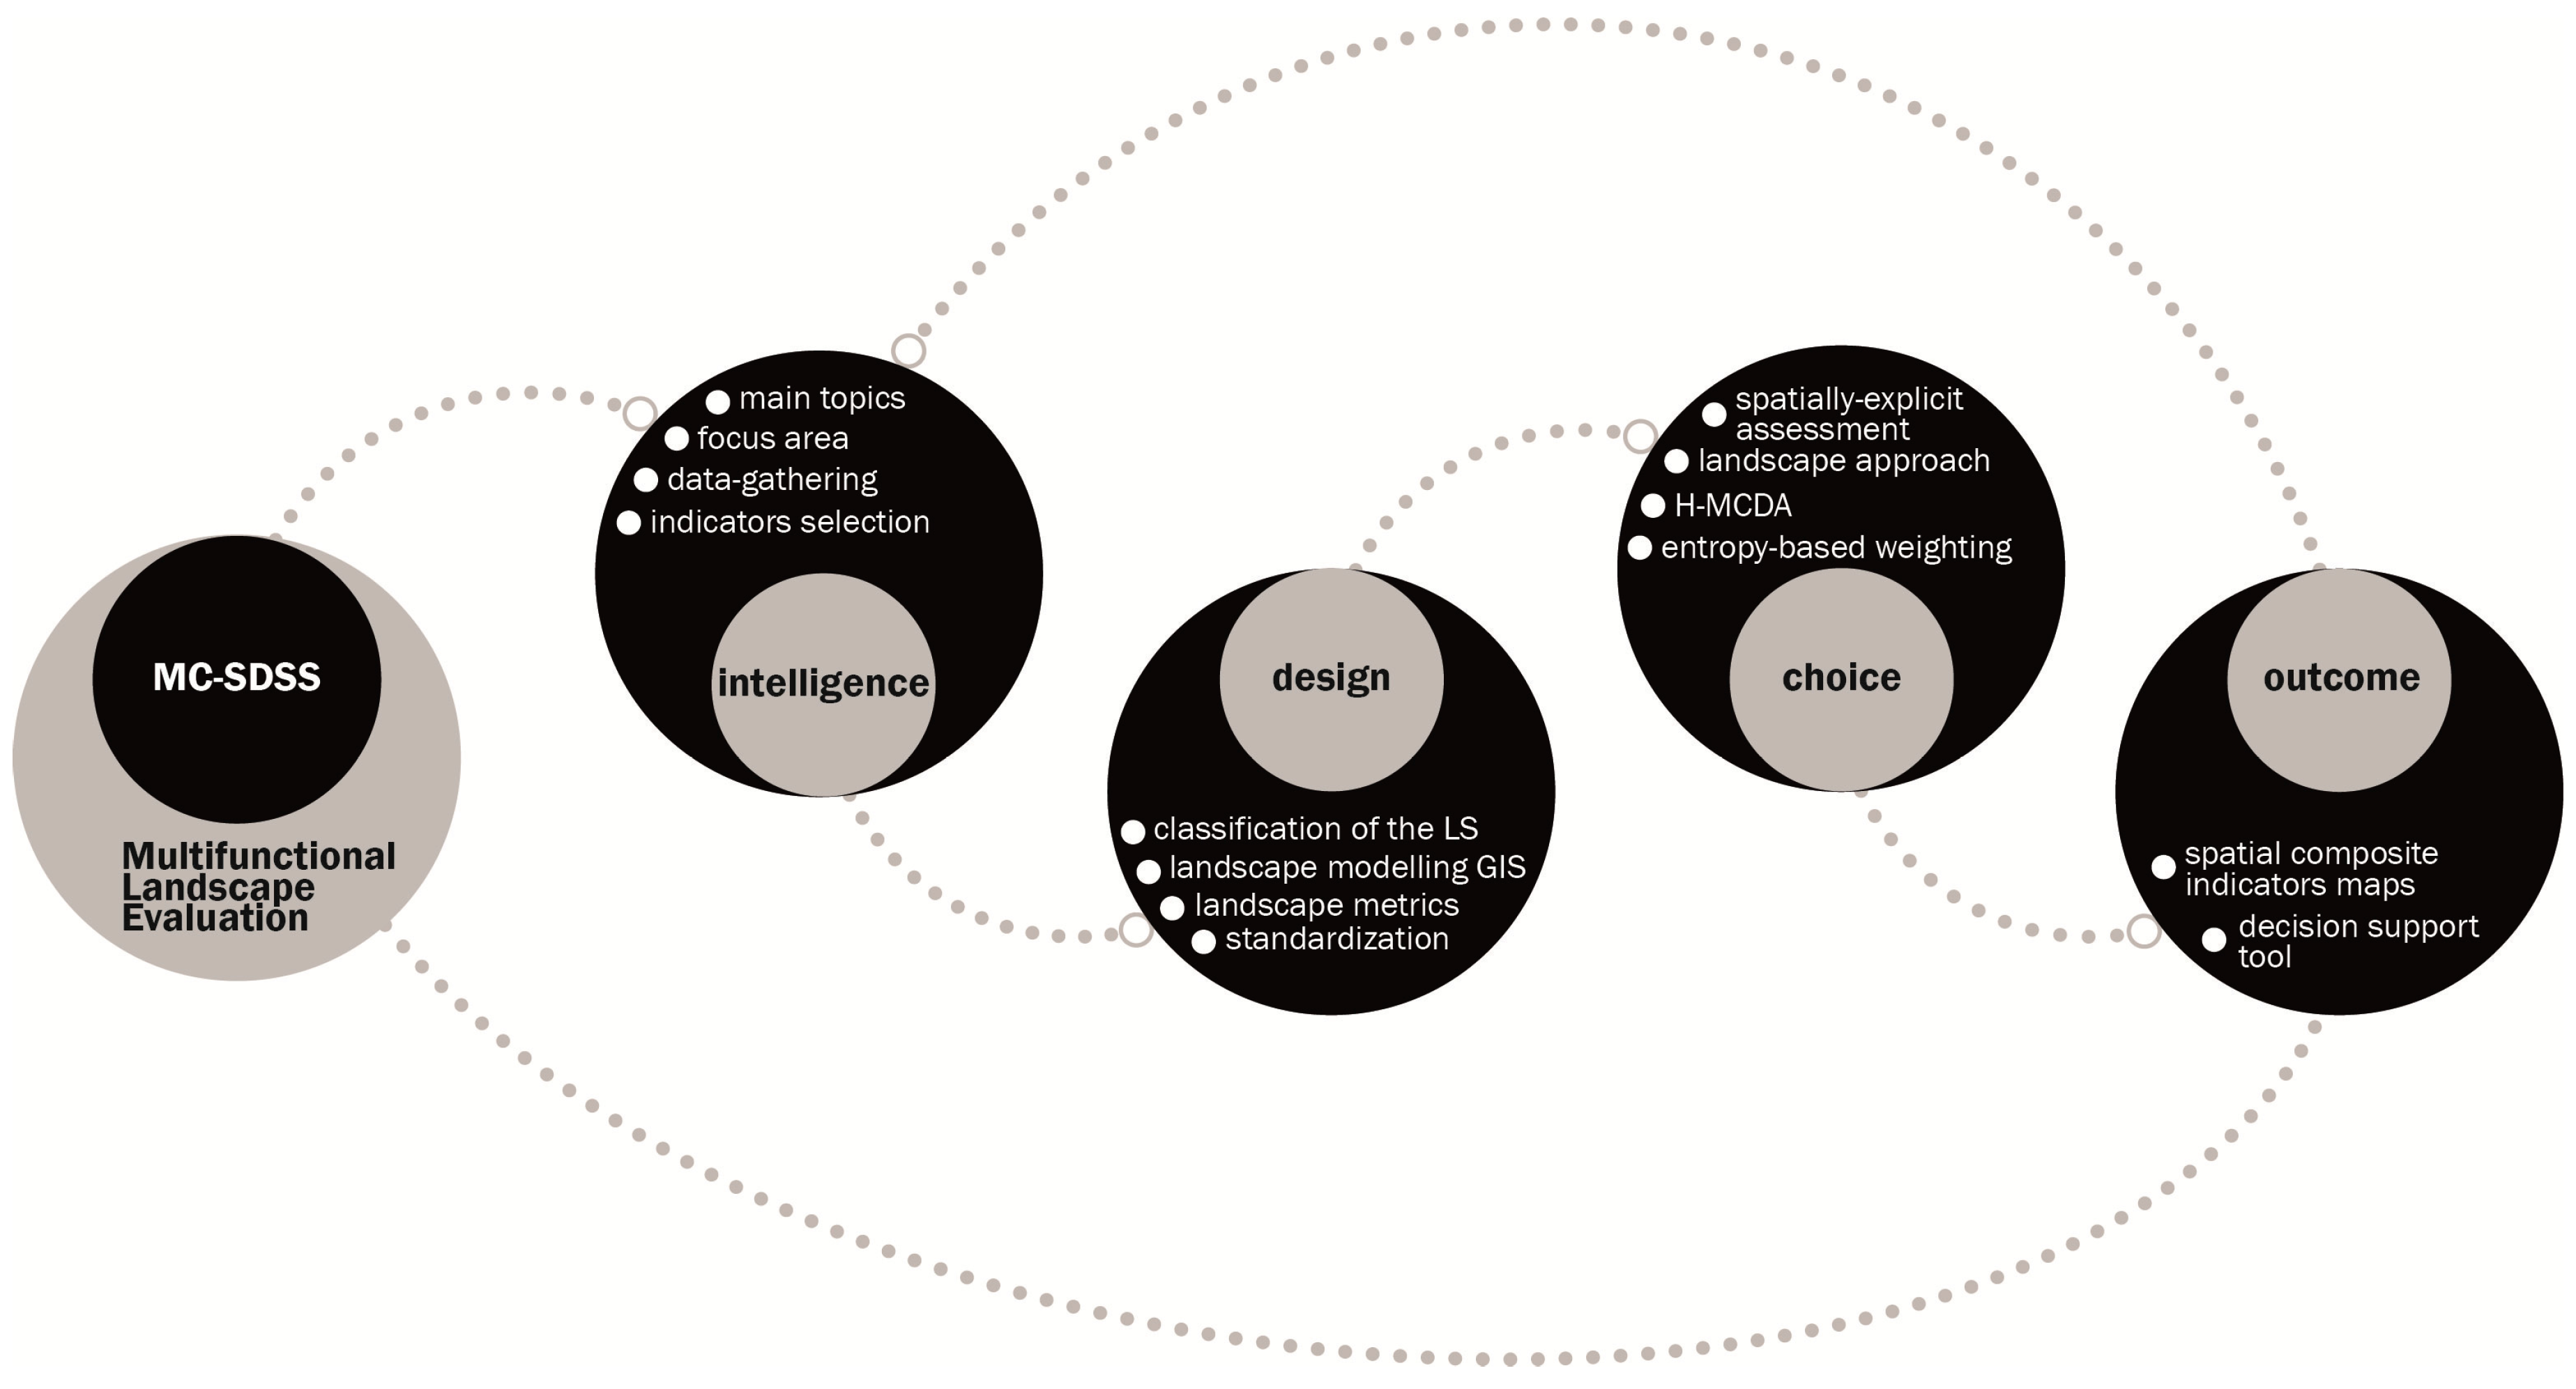
The proposed methodology integrates the above-mentioned approaches by enhancing the third (iii) with hybrid multi-criteria methods during the weighting of the indicators and the overall mapping phases. Since the LS/ES are sensitive to different scale and evaluation methods, the operative steps involve multi-criteria procedures and landscape modelling techniques in order to provide multi-level composite indicators. The Landscape Services Indicators (LSI) simulate the landscape model for the focus area in the GIS environment by representing the multi-dimensional issues of the analysed landscape. According to the framework of the Multi-Criteria Spatial Decision Support System (MC-SDSS), the proposed methodology for the multi-functional landscape evaluation follows four main steps [44,45]: intelligence (i), design (ii), choice (iii) and outcome (iv) (Figure 1).
The intelligence phase (i) involves problem-structuring through the identification of the main topics affecting the landscape dynamics and the selection of the spatial criteria representing multi-dimensional issues. During this phase, the boundaries and the scale of the focus area are chosen according to certain pre-defined criteria. The data-gathering aids in improving knowledge of the territory, while data-availability and affordability will affect the decisional process and the analysis outcomes.
The design phase (ii) relates to data processing and classification, according to the categories of the landscape services that are relevant to the focus area. The landscape representation model is provided by way of the landscape metrics approach, and a statistical surface of analysis is chosen in order to make the results obtained through the spatial multi-criteria procedure coherent and more homogeneous. Moreover, the analysis distances are relevant parameters affecting the results, and choosing them accurately is a priority for the operative steps in GIS.
The choice phase (iii) represents the core process, as it involves the choice of the multi-criteria method and weighting procedures in order to evaluate the spatial criteria. This crucial step involves the normalisation of the indicators according to the preference directions for each spatial criterion. In this research, an entropy-based weighting method is implemented in order to provide objective weights for the indicators. Thus, the values of the LS indicators are combined on the statistical surface of analysis with the Weighted Linear Combination (WLC), according to [41].
The outcome phase (iv) provides the results of the evaluation process. The composite indicators of the LS are the normalised indices that represent the effective quantification of the services for the focus area. LS-mapping is a useful tool for the Decision-Makers (DM) operating on the regional scale, as it is able to visualise the multi-dimensional landscape features in order to generate a spatial reference for strategic sustainability.
Specifically, the design phase provided a landscape description/evaluation model by choosing a regular grid-based sampling method and by setting a homogeneous statistical surface with a Minimum Mapping Unit (MMU) specific to the focus area [46,47]. A regular grid-square of 1 Km2 per cell was chosen as the homogeneous surface of the analysis for three main reasons:
- -
- The dimension of the cells matches better with the geographical structure of the landscape, as it intercepts 5/21 LULC classes as the maximum of diversity per cell;
- -
- The size of the study area involves a regional scale, and the reference for LULC mapping is the Corine land cover project at scale 1:100.000, with a Minimum Mapping Unit (MMU) of 25 Hectares. This dimension can easily be nested into the chosen cell dimension;
- -
- The MMU is consistent with other environmental studies using grid-based analysis [46].
Since the indicators’ values have a different unit of measurement, data normalisation is essential. Hence, the normalisation made it possible to range data into a 0–100 interval and to set the preference directions of the indicators according to the linear Formulas (1) and (2):
For the criterion to be minimised.
For the criterion to be maximised. Where is the indicator value per cell and is the normalised indicator.
The choice phase involved a hybrid multi-criteria approach that produced a ranking order of the spatial indicators depending on the importance of each criterion. The hybridisation is aimed at solving two tasks concurrently; namely, determining spatial criteria weights/values and combining them with the multi-attribute value function per grid-square cell [48]. The output of the evaluation process produced the normalised index of the LS using a WLC, according to the formula below (3):
where is the global weight of each indicator and are the normalised indicator values.
The indicators’ weightings were estimated without decisional agents by applying a key concept of information entropy theory [49], whereby the amount of information per each criterion determines its relative importance within a defined set of spatial criteria.
These weights can be implemented using the experts’ preferences according to a two-fold weighting system. The entropy-based weighting provides the outcomes using the Formulas (4)–(6) [41,50]:
where:
- is the entropy, expressed as the amount of information for each indicator;
- is the ratio of the normalised value to the sum of them for the indicator k;
- is the entropy-based criterion weight.
The operative steps of the design and choice phase were performed using spatial analysis tools and Python 4.0 for ArcGIS Desktop 10.3 respectively.
The amount of information and the spatial distribution of the data affect the entropy-weights as long as the unbalanced results make it possible to objectively review the effectiveness of the indicators.
During the outcome phase, the application of the method provided objective weights that could be combined with the stakeholders’ preferences according to a two-fold weighting system within the WLC. The normalised composite maps of the LS are the outcomes of the evaluation process.
3. The Case Study: The National Park of Cilento, Vallo di Diano and Alburni Multi-Functional Landscape
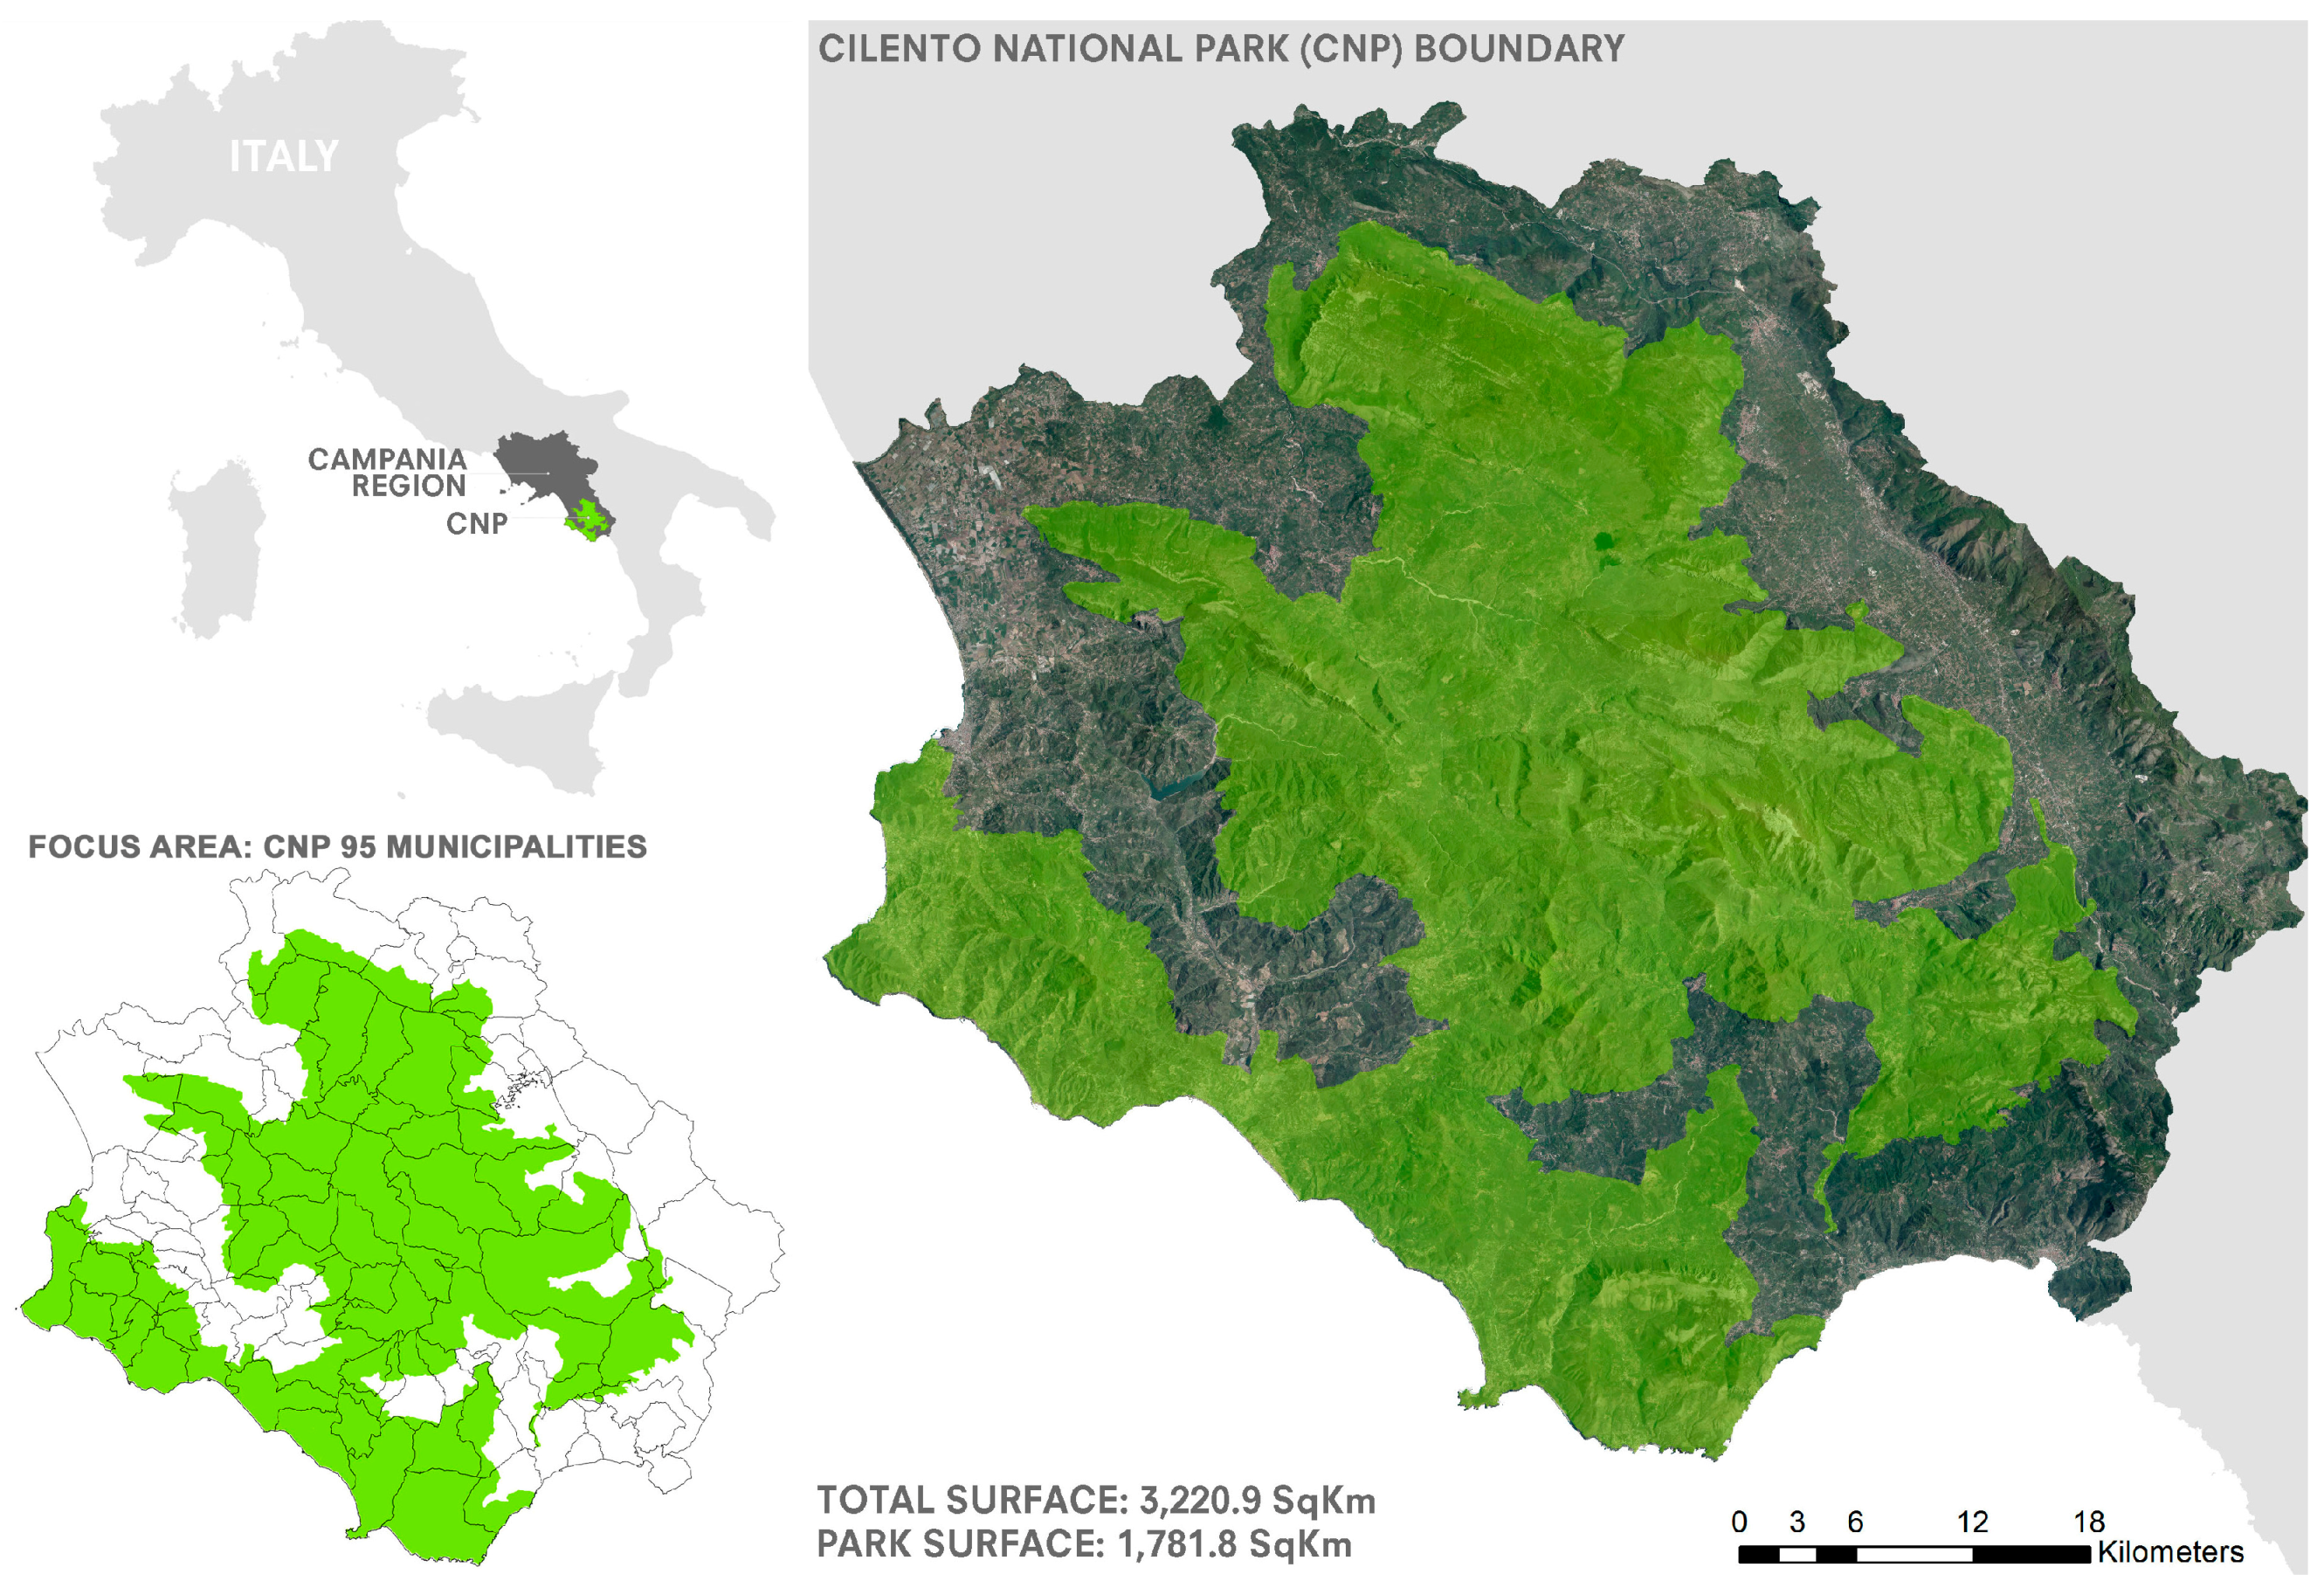
According to the European Union, the Commission Regulation No.1319/2013 establishes a common classification of territorial units for statistics (Nomenclature d’Unités Territoriales Statistiques or Nomenclature of Territorial Statistical Units–NUTS) with the aim of collecting, compiling and disseminating harmonised regional statistics in the Union [51]. The Italian regulation sets three levels of territorial units for governance, which correspond to the States (NUTS1), the Region (NUTS2) and the Municipalities (NUTS3). The focus area of the case study is located in the Campania Region (Italy) (NUTS 2) and includes 95 municipalities around the National Park of Cilento, Vallo di Diano and Alburni (CNP) in Salerno Province (NUTS 3). The focus area covers approximately 3220.9 Km2, and 267.379 inhabitants live within the overall area, with a coastal zone population density higher than that of the internal zones. The CNP extends for 1781.8 Km and includes 1930.3 Km2 of Natura 2000 sites (Figure 2).
The 95 municipalities of the focus area were classified and selected by considering the following criteria:
- -
- The relative closeness to the Park boundaries or the inclusion within these boundaries;
- -
- The presence of a site of community importance (SCI) or an important bird area (IBA), according to the Natura 2000 network;
- -
- The relationships between stakeholders, socio-cultural organisations and citizens living around the Park.
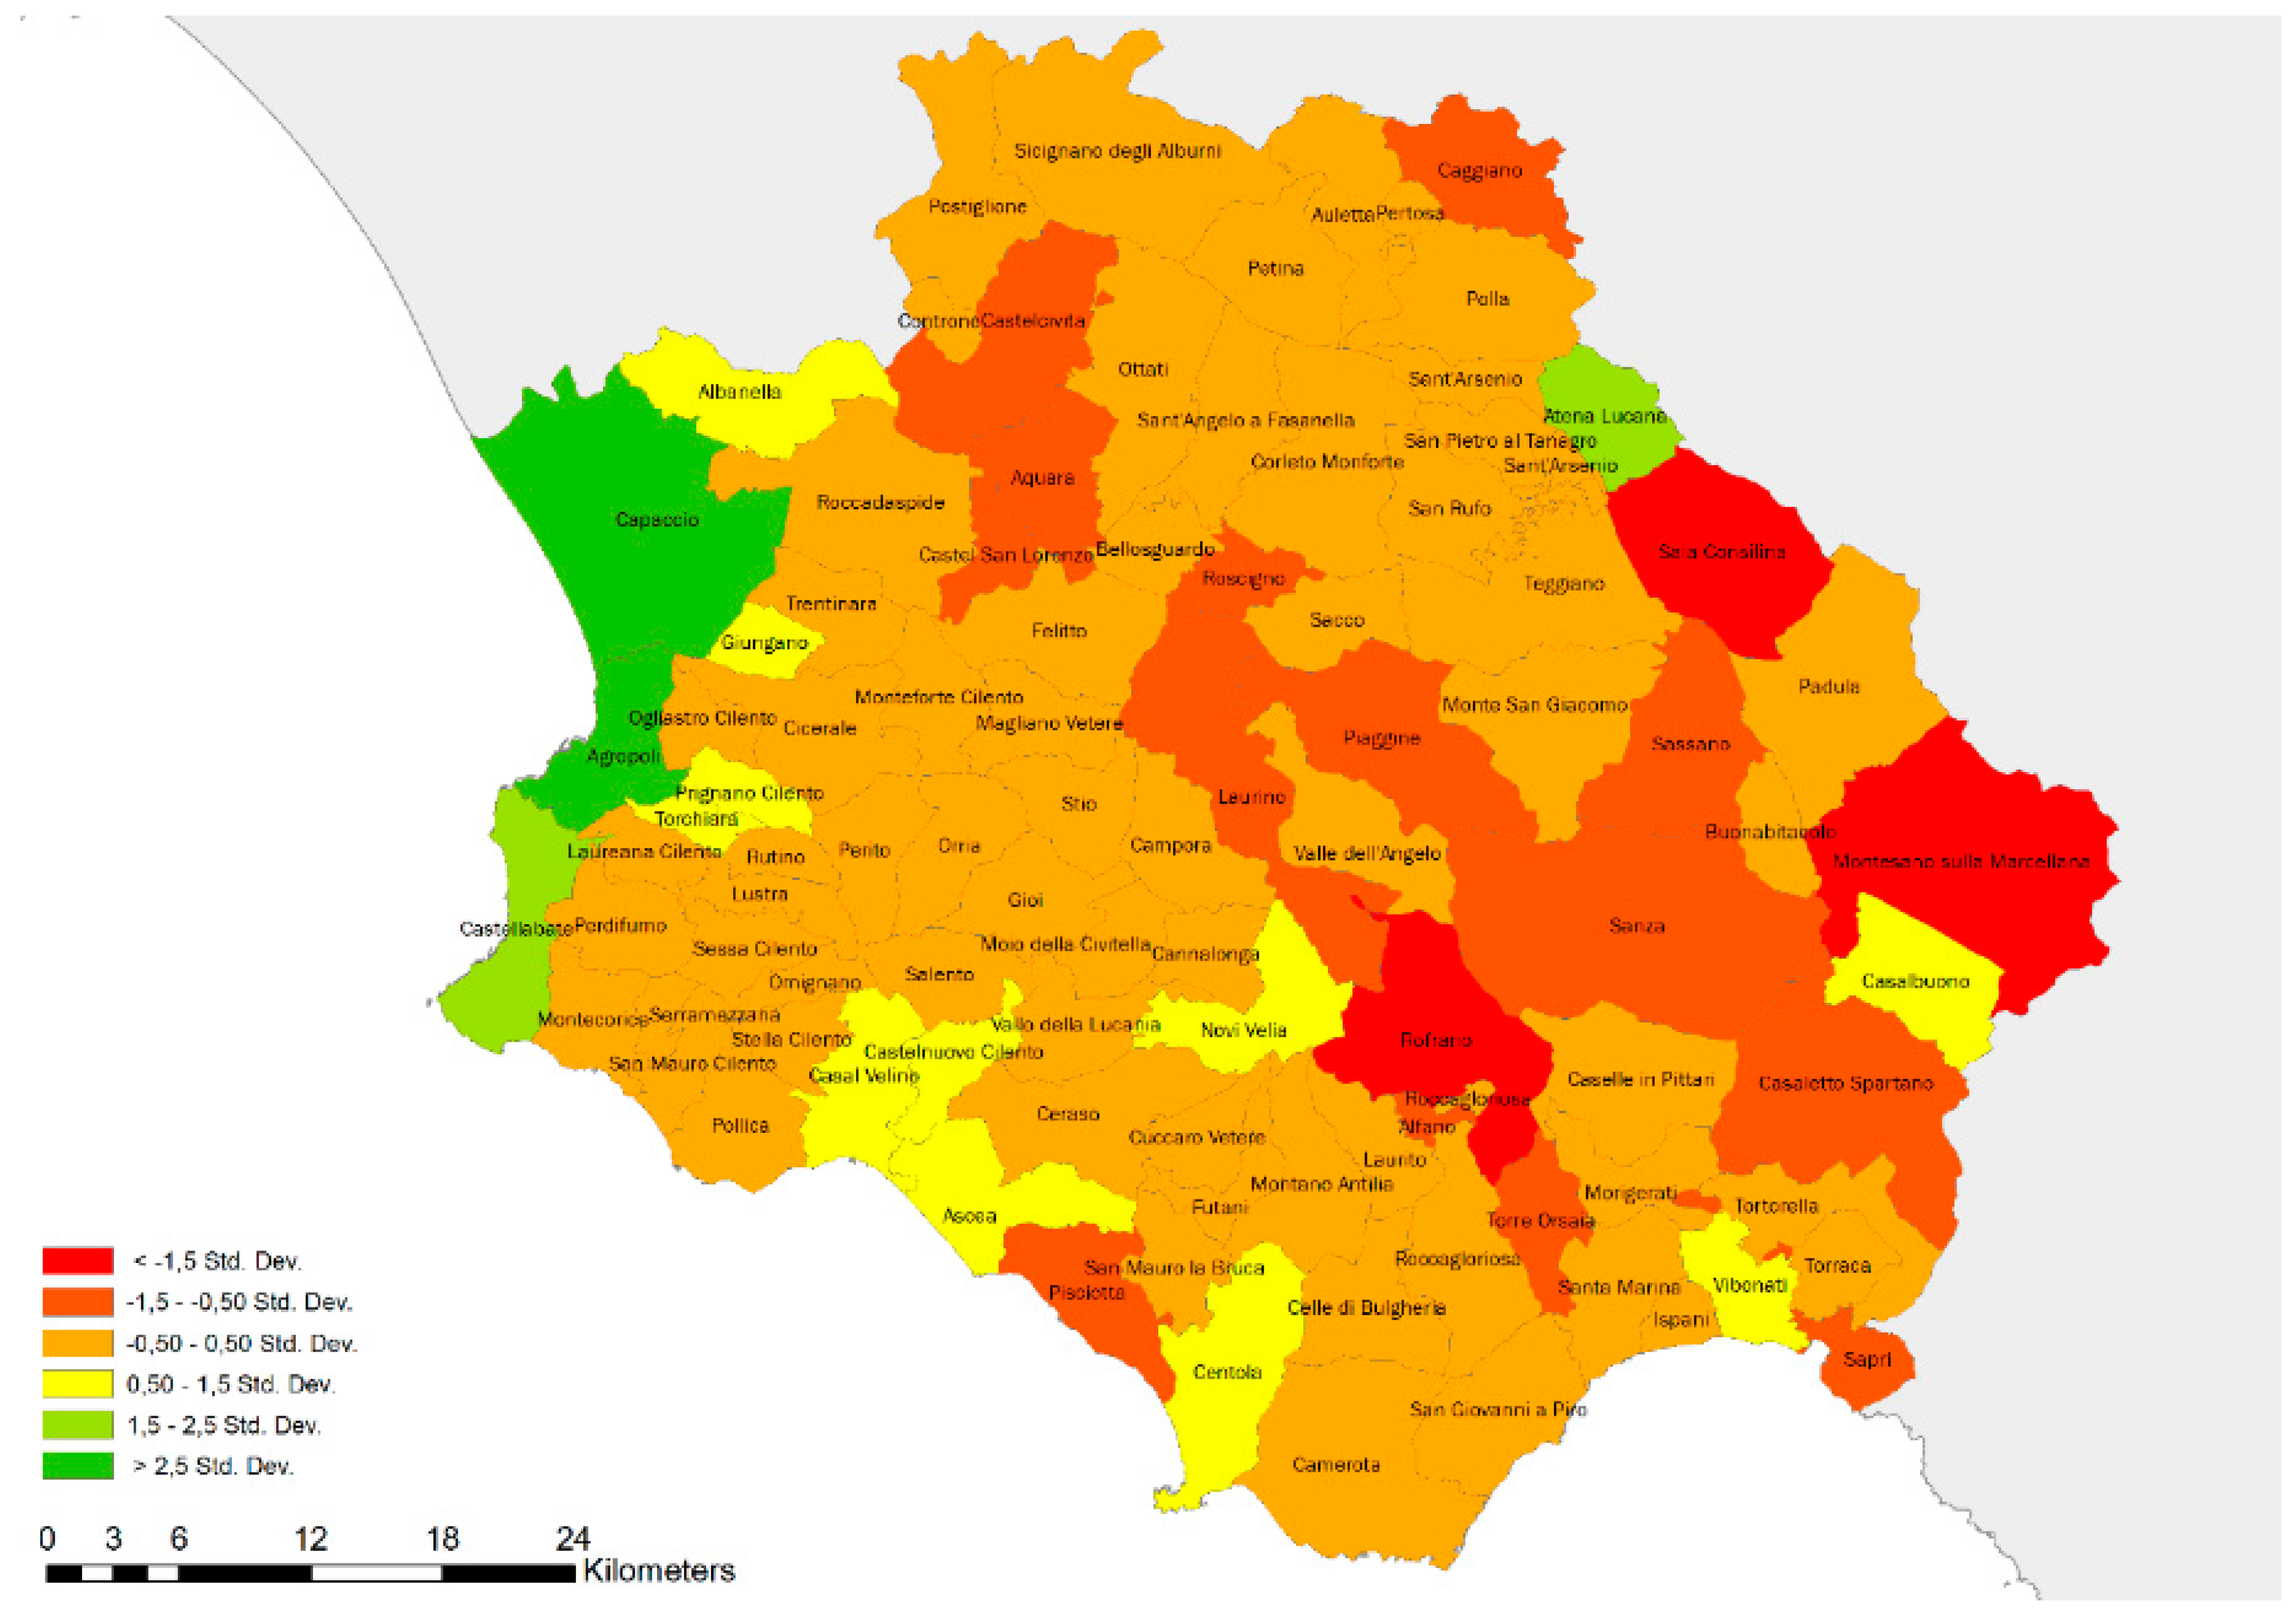
Although there are multi-dimensional issues concerning the focus area, nevertheless, the most critical issue is related to the decrease in inhabitants, which is a phenomenon mostly affecting the internal municipalities (Figure 3).
On the one hand, the unbalanced distribution of the population generates an economic and environmental trade-off by reducing job opportunities and the ability for households to self-support in the internal area. However, on the other hand, the carrying capacity of the seaside exceeds in the summer season. From this perspective, the landscape services approach could be the correct way in which to preserve the natural area and to enhance development through the identification of the cultural ecosystem services in order to define a sustainability strategy. Moreover, the inclusion of LS/ES approach within the spatial planning aids in making explicit the services and, consequently, in fostering the dialogue about the trade-offs between the socio-economic and ecological dimensions of the plans at the landscape scale [52]. A spatial dataset of 14 indicators which identified three macro-categories of landscape services—including Provisioning, Regulating and Cultural Services—was categorised into five classes related to nutrition, entrepreneurship, regulation of the physical environment, enjoyment and personal fulfilment. This was carried out according to a selection of place-based data and indicators (Table 1). Table 1 presents functions (first level), classes (second level), indicators and related entropy weight, as well as an identification code for each indicator.
The main classification follows the common international classification of ecosystem services (CICES) [53] by adopting the concept of landscape services in order to consider a wider framework, which includes landscape social dimensions and spatial patterns transformed by both natural and anthropic processes [25,28,54]. Nevertheless, the proposed classification aims to include new classes of services not previously considered in the main ES classification framework (e.g., entrepreneurship class). Indeed, according to Bastian et al. (2014), both concepts, ES and LS, are useful, depending on the specific situation [55].
The selection of the indicators was performed according to the literature review, data availability and knowledge of the most relevant topics defined during the intelligence phase of the model. Moreover, the critical issue in the classification was that ES refered to ecosystems, while LS denoted landscape elements or types [56]. The indicators of the spatial dataset belong to the LS category, except for the four indices of the general framework put forth by [57] (P1, R1, R2 and C7 indicators) and the classes of the regulating services category, which refer to ES functions.
The Provisioning Services (PS) supply the fundamentals to satisfy material human needs; i.e., food, energy and water. They are linked both to natural resources fostering local productive activities and spaces where these activities subsist. The PS was divided into two classes:
- -
- The nutrition class, which encompasses all the minimum resources, generalised by the LULC mapping, for human survival;
- -
- The entrepreneurship class, which includes the local firms using the natural resource to produce economic and job opportunities. The study provides three indicators that simulate the above-mentioned classes.
The Regulating Services (RS) convey the adaptive capacity of the landscapes and the preservation of their special features in order to ensure the existence of these resources for future generations. The regulation of the spatial structures, which guarantees these types of services, is strictly linked with several services affecting the cultural and informative dimensions of the landscape. The RS are generalised in the class of the “regulation of the physical structures”, which depicts the network of the protected areas.
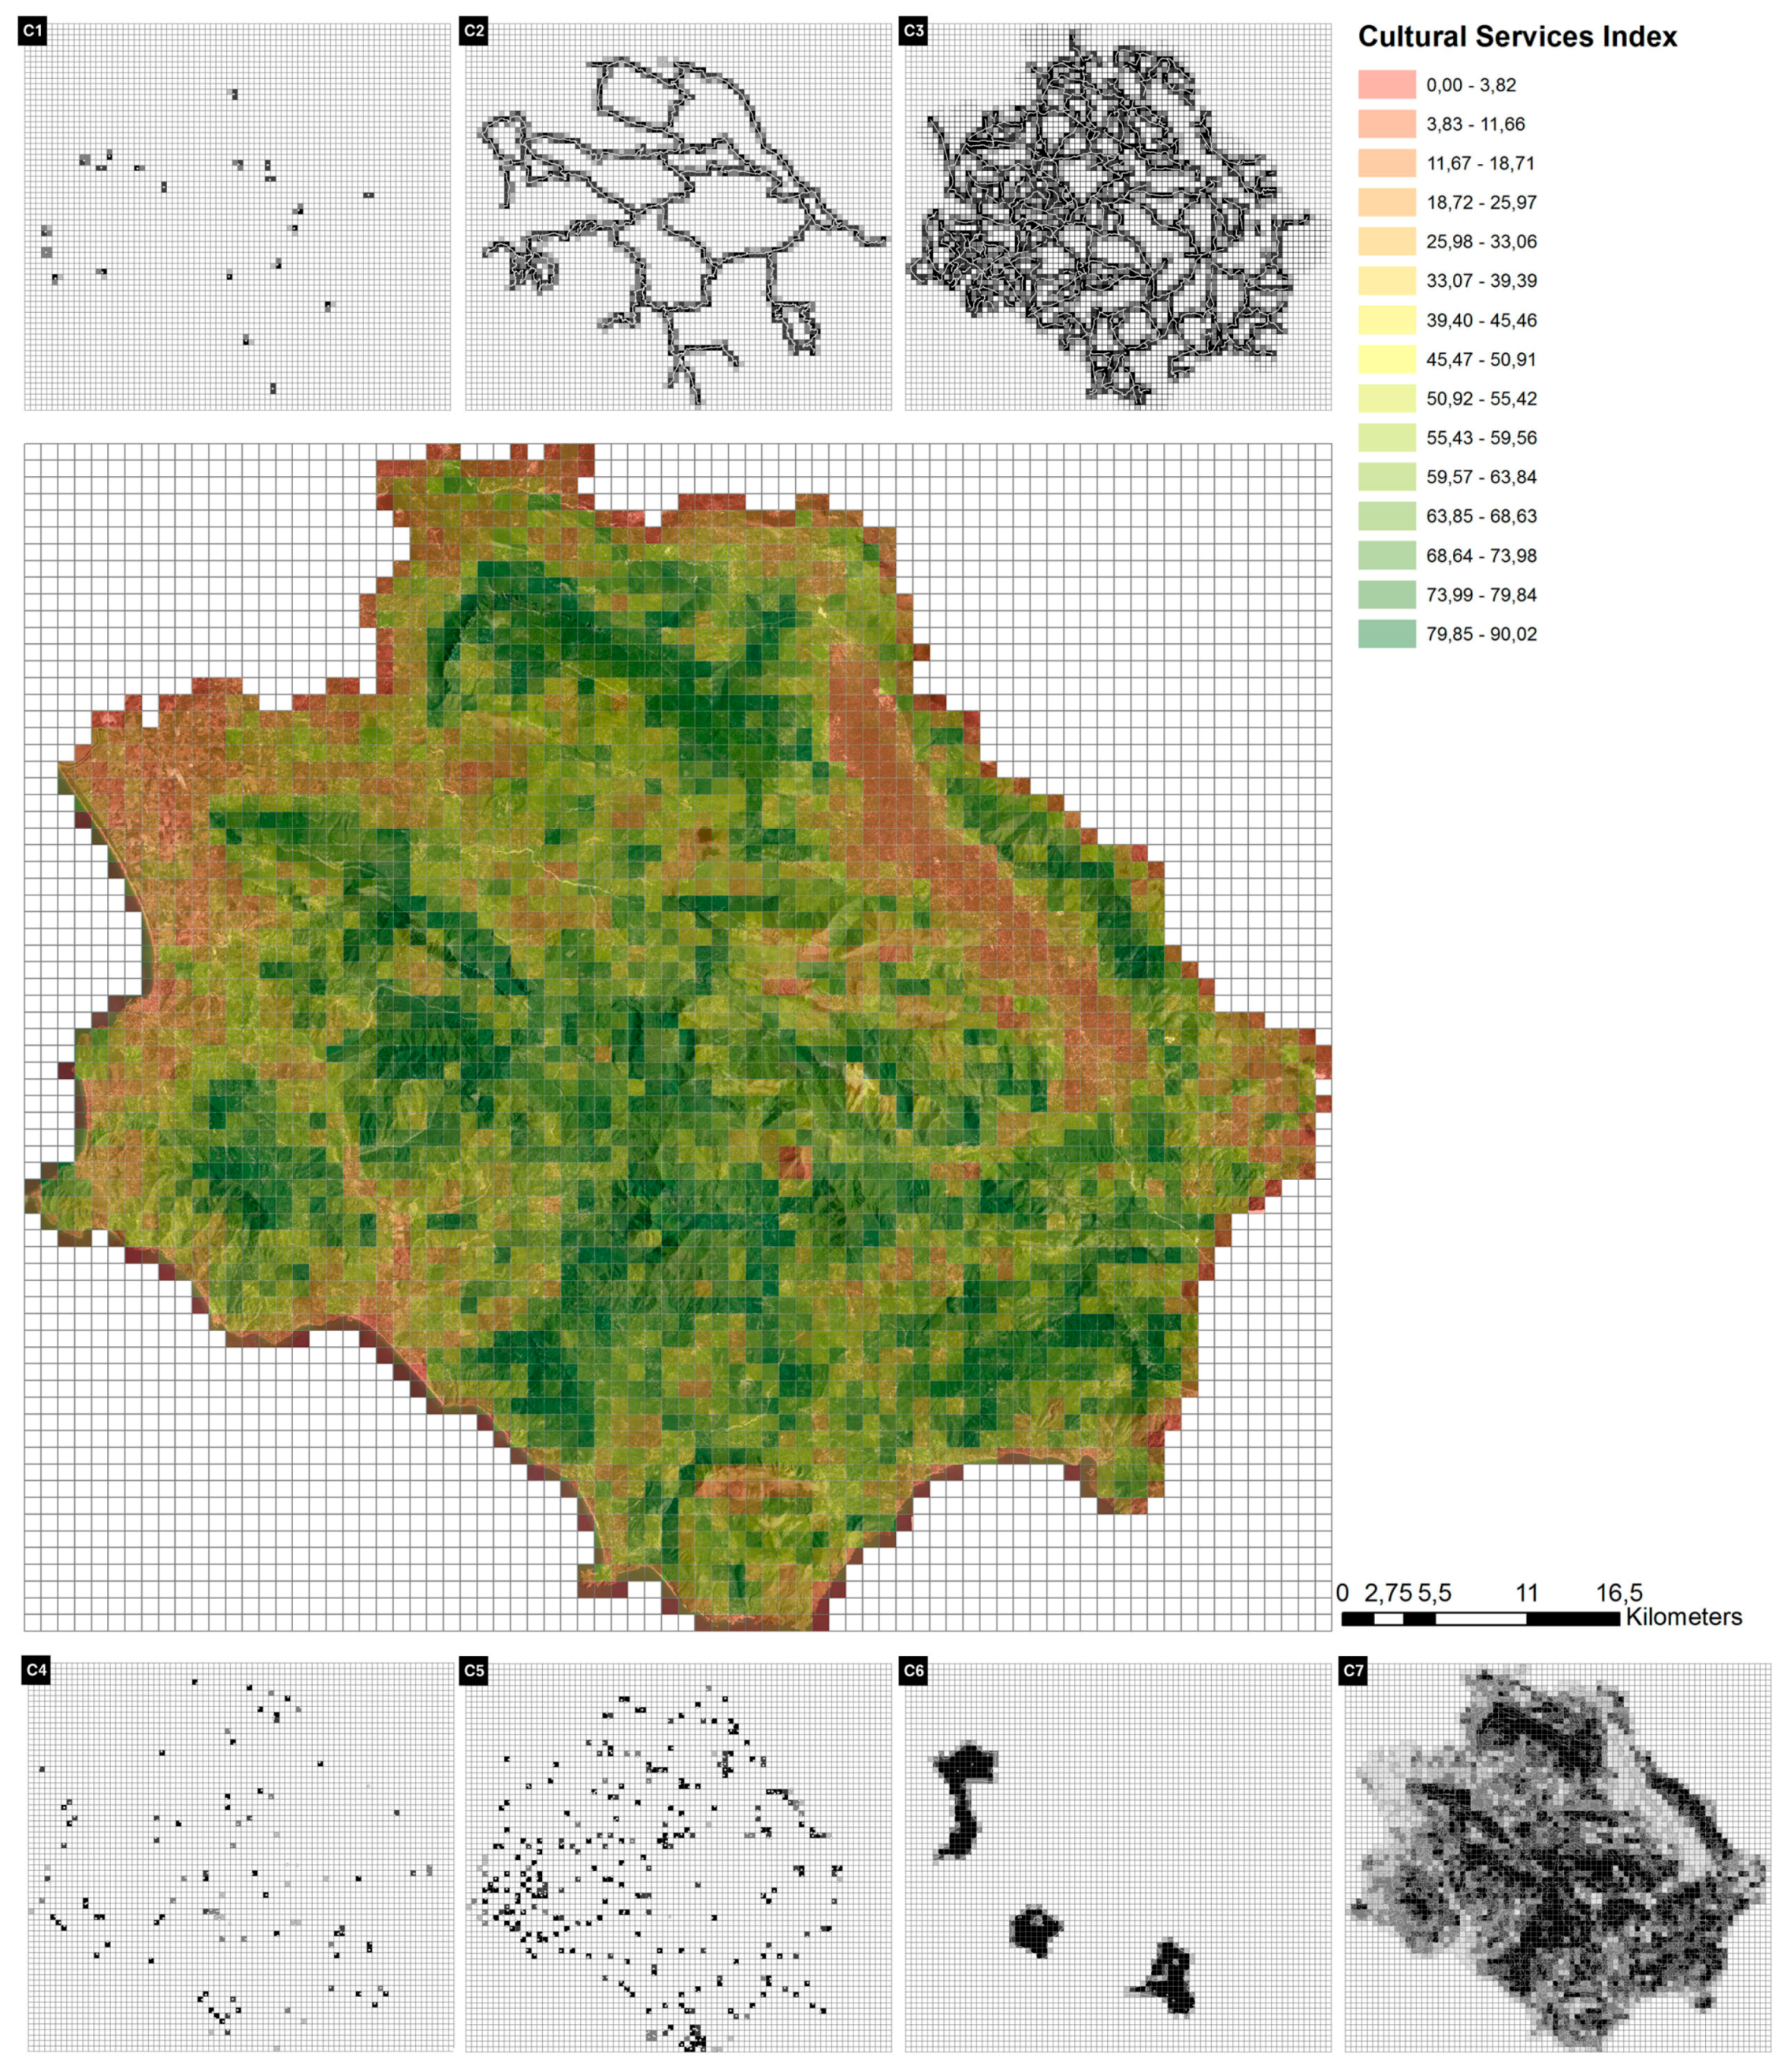
The Cultural Services (CS) focus on the intangible values that people obtain from the landscape. The problem of evaluating this class of values was generalised by using proxy-criteria that represent physical landscape elements expressing aesthetic, recreational, spiritual, social and informative values linked to the human–natural ecosystems. The landscape metric (LM) depicting the CS is the density metric, as it offers the opportunity to detect clusters of services in the territory.
According to the information gathered to form the spatial dataset, the CNP could be conceived as multi-functional green infrastructure (MGI), as it is able to generate economic productivity through ecotourism and the local firms, and social cohesion as a place-marker for a sustainable community; in addition to this, it also fosters the provisioning of ecological services; e.g., climate change regulation and adaptation. Nevertheless, the landscape must be managed according to a sustainable strategy that is able to preserve primary resources and services by improving the economic development of the territories simultaneously.
It is clear that the consideration of the landscape and ecosystem services by way of their functions and goods is a useful approach in identifying and quantifying benefits for human beings, as well as the full cost of their loss; indeed, this makes it possible to engage the stakeholders and local communities in a constructive and educational dialogue [54,58].
4. Results
The selected spatial indicators (Table 1) were processed using the theory-driven approach and spatial analysis tools. Specifically, the indicators P1, R1, R2 and C7 were implemented through the transferable methodology applied in [57]; this consisted of an expert-led rating of the LULC classes of the Corine land cover according to their capacity to provide ecosystem services [57,59,60].
According to [57], it is useful to employ experimental tools for the quantification of multiple ecosystem services and landscape modelling. Hence, the methodology was improved by allocating the weights for each percentage of the LULC classes per cell, in order to experiment with “an additional spatial subdivision in services providing units” [57].
Moreover, the subdivision of the cells is aimed at reducing the modifiable areal unit problem (MAUP) for certain kinds of data [61]; this also makes it possible to more accurately represent the proportion of the LULC per cell with its relative services/benefits.
Table 2 shows the statistical parameters of the raw data by visualising the max-min value range, the mean and the standard deviation. The standard deviation makes it possible to understand the dispersion range of the data population, in order to identify the clustering of events.
Moreover, Table 2 displays the different units of measurement of the indicators and their preference directions. There are relevant differences between the data of each indicator, with a maximum spread of values for the indicators C2–C5; in contrast, there is a more concentrated pattern for indicator P3, representing the minimum value of standard deviation. The standardisation procedure makes it possible to place the intermediate values in the range 5.10–38.07 (Table 2).
Each service-class is linked to the well-being dimensions theorised by the Millennium Ecosystem Assessment (MEA, 2005), as shown in Table 3.
Specifically, the PS category includes the material resources the people need to sustain and gain productivity. Such resources are vital when it comes to earning household income, as the percentage of farmland (P2) and the firms of local products (P3) constitute a relevant form of income to be enhanced. The RS category affects the security of the life environment, as it is able to protect the landscape against climate change acceleration and air pollution. Hence, the regulation of the protected areas ensures the safeguarding of the environmental functions of the natural areas, which in turn fulfils the goal of vulnerability reduction. Lastly, the CS category affects the enjoyment and the personal fulfilment of the people by fostering the opportunity to benefit from aesthetic, recreational, spiritual and cultural values, and to improve the scientific learning and knowledge of the landscape. The accessibility of recreational activities and cultural heritage is a relevant measure by which to understand the spatial distribution of cultural values in the examined landscape.
The achieved results provide a selection of the LS indicators, according to three identified functions (Table 1).
The Provisioning Services Index reaches its highest values for the protected areas of the Park, as these zones provide regulation of ecosystem functions through their positive contribution to climate change and air pollution (Figure 4).
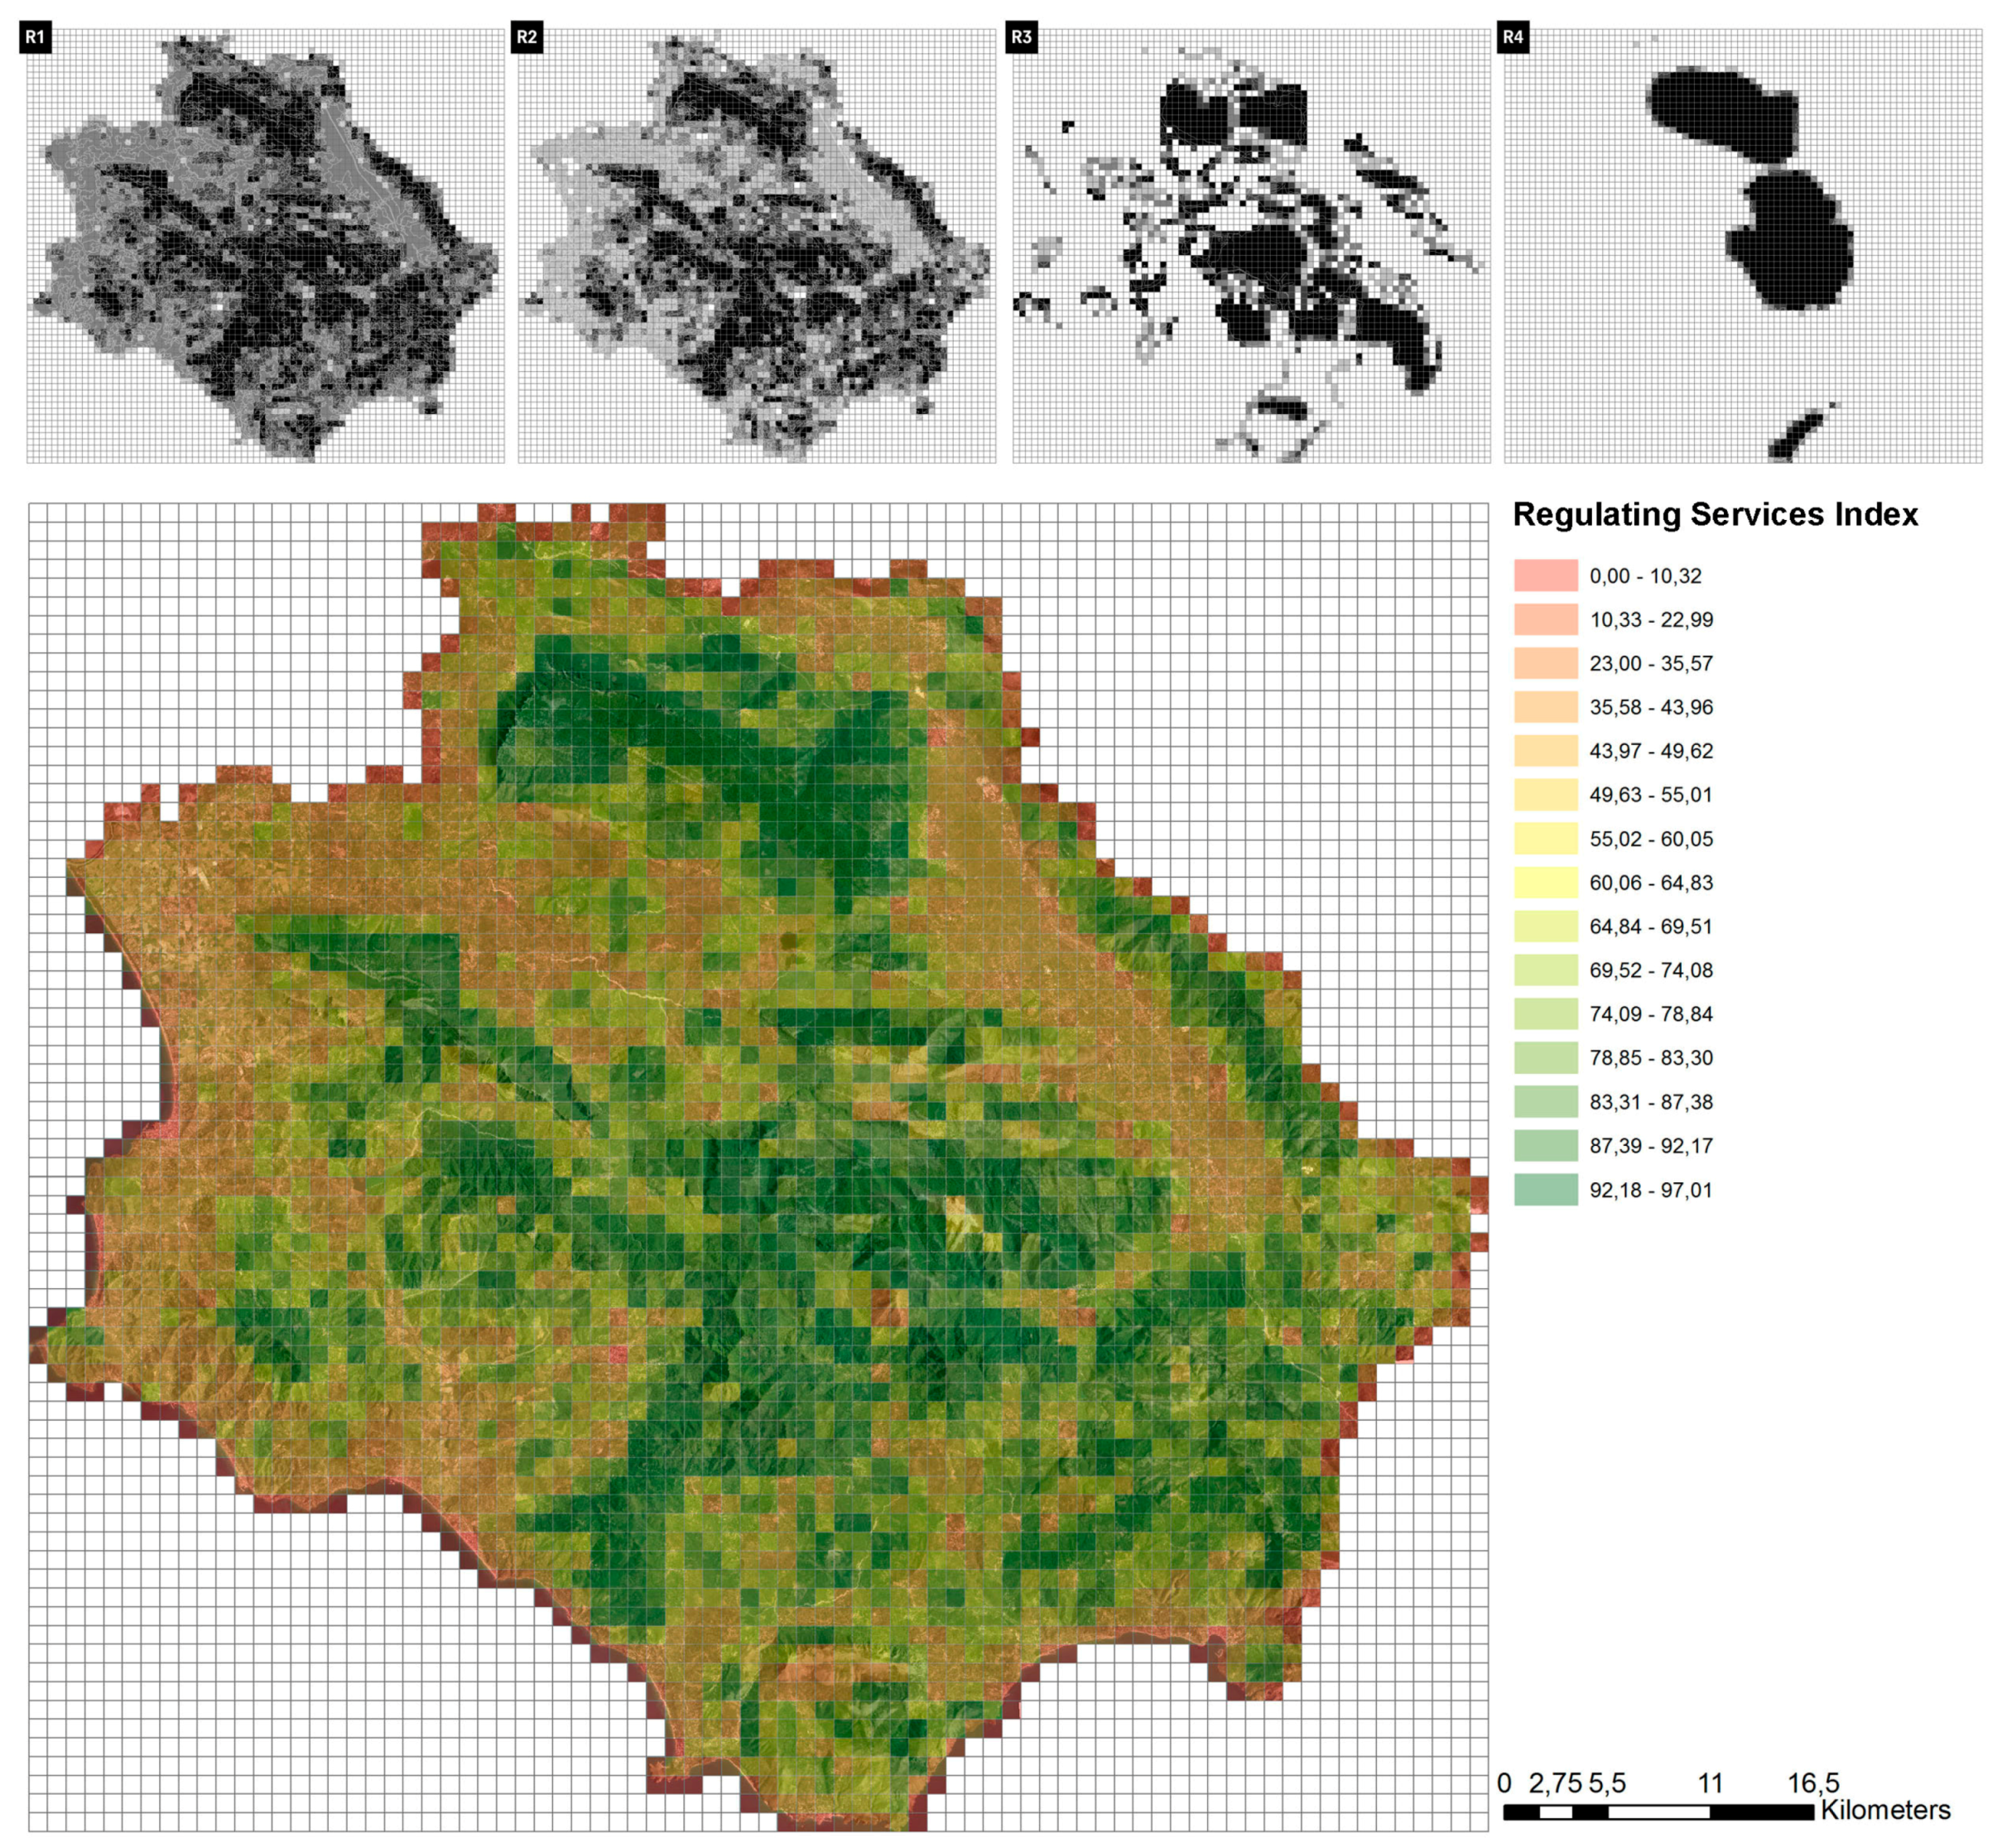
In contrast, the Regulating Services Index highlights the spatial distribution of the RS that aggregate the LULC rating of the expert-led methodology [57], the percentage of farmland, and the density of the local products firms. The map shows a scattered distribution of these services, with high values for the west coastal zones and internal areas, within which agriculture and production are most developed (Figure 5).
The Cultural Services Index is scattered, with high values per cell in the internal areas and in the archaeological zones located on the west coast (Figure 6). The results confirm the importance of the informative and scientific value of the nature, related to the accessibility of the physical resources. These data should be validated through finer spatial information by including the landscape perceptions of the citizens and immaterial cultural values.
The expert-led rating performed for indicators P1, R1, R2 and C7 most affected the analysis results, as a rich pattern variability and an overall coverage for the focus area increased the amount of information. Nevertheless, such indicators are useful as they can fill the gap of data scarcity for the focus area. Further weightings will make it possible to balance the objective weights of these indicators with the decision-makers’ preferences, or a new calibration will lead to their exclusion from the dataset.
5. Discussion and Conclusions
The categorization of services makes it possible to understand the spatial distribution of the benefits, in order to set tailored strategies by considering the landscape features and the composite index value per cell. The LS mapping, as a spatially explicit information source, aids the decision-makers’ attempts to understand and analyse the landscape’s complex systems and their relationships.
Although the generalisation process can lead to a mismatch between the MMUs and the real world, it is useful to provide a wider framework for planning and environmental evaluations. Refining the results implies finding information on a deeper scale by shifting from the regional to the urban scale. Since the spatial data and indicators are scale-dependent, it must be noted that different analysis distances and data resolution lead to completely different outcomes. Hence, the choice of the statistical surface and the scale of the model must be fixed ahead of time, so as to set a precedent. Nevertheless, the choice of the regular shape-grid fosters the opportunity to perform the analysis on a smaller scale, by decomposing the mapping unit into nested cells without losing the spatial reference. Indeed, this is useful for comparing the results both on coarser and finer scales. The main purpose of the present paper is to test a methodology for multi-functional landscape evaluation.
There are clear limitations involving spatial analysis issues, the choice of indicators and the features of the considered LS. It is crucial to point out these issues in order to further develop the research. First, it must be noted that the computational errors due to the edge effects at the boundaries of the focus area [61] negatively affect the analysis results at the border cells; indeed, the values of the composite indicators at the borders must be considered false for the case study. This problem can be solved by extending the analysis boundaries beyond the interest area. Another limitation of the proposed model concerns the exclusion of the LS dynamics in time and space. Such a static model should evolve into a dynamic model, including time-series data; this would make it possible to understand the land cover changes that affect the LS provisioning. As the model does not consider the stakeholders’ preferences, it must be improved by combining the entropy-based weights with the subjective weights expressed by the stakeholders in order to produce different scenarios for the LS assessment. Lastly, it is necessary to integrate information about the beneficiaries of the services into the spatial evaluation process; this can be achieved by applying new landscape metrics to the model.
The benefits of the proposed methodology relate to the objective analytical procedure, which aims to highlight the richness and the relevance of the information provided by the indicators; it also presents a chance to exclude the non-relevant indicators with low weights. Moreover, the evaluation process with spatially explicit data and mapping offers a high potential in terms of the communication and visualisation of the results during the decision-making process; it does this by generating a comprehensive picture of the landscape spatial pattern and its multi-functional features.
Lastly, the entropy-based weighting is a multi-criteria ranking method that provides "objective weights" to the spatial criteria. Combining the entropy weights with the expert preferences through a two-fold weighting system makes it possible to balance the objective and subjective dimensions of the selected indicators, thus increasing the number of opportunities to model the dynamical relationships between the social and environmental components, representing human–environment interactions and the cross-scale dynamics of the landscape, which are increasingly demanded as part of the evidence base for making appropriate management decisions [62,63], addressing some of the different questions and challenges posed by the Anthropocene approach.
In conclusion, the choice of the service categories to be measured is bound by the information availability for the examined landscape. Some methods and tools try to solve the issue of missing data; e.g., on-field sampling, which is generally time consuming and expensive, or volunteered geographic information (VGI) systems. The proposed framework attempts to categorise data and produce spatial indicators according to their capacity, so as to simulate the performance of the landscape in supplying services. Indeed, the intelligence phase of the model is crucial, as it includes data gathering, which will affect the following phases and outcomes of the evaluation. Nevertheless, the holistic nature of the framework makes it possible to generate feedback loops and improve the amount and quality of information and indicators by applying the above-mentioned or new methods. Obviously, the framework does not overestimate its capacity to produce cross-scale indicators, but instead suggests a way to build knowledge according to the available spatial information. Thus, different locations and analysis scales will affect, inevitably, the classification of services and the outputs of the model, but they do not alter the main steps of the methodology.
The three main obtained indexes (provisioning services composite index, regulating services composite index, and the cultural services composite index) describe an interesting interpretation of the CNP landscape and identify the common areas where the enhancement process could be activated, combining sustainable use and development. The framework of the multi-functional landscape enables the comprehension and evaluation of the different and mutual interrelations that influence land use and landscape functions, while a hybrid multi-criteria spatial decision support system (MC-SDSS) attempts to operationalise different needs: the development of adaptive approaches in landscape research, which is able to consider the interactions among landscape modifications, landscape patterns and landscape functions; and the implementation of interdisciplinary methodologies to identify and assess the processes which are able to select spatial indicators and combine objective and subjective weights. The multi-functional landscape perspective becomes a suitable context in which to test how to select landscape enhancement strategies and to cooperate for the “Anthropocene breakthrough”, thus improving the relationships between the human being and the landscape ecosystem according to a total sustainability approach.
Acknowledgments
The study has been developed starting with the results of the research project “Cilento Labscape: An integrated model for the Living Lab activation in the National Park of Cilento, Vallo di Diano and Alburni”, F.A.R.O. (Finanziamento per l’Avvio di Ricerche Originali) Programme. The sudy is part of the PhD thesis of Giuliano Poli. The authors thank prof. Cristian Ioja, Department of Regional Geography, University of Bucharest, and its research team for their interesting suggestions.
Author Contributions
The authors jointly conceived and developed the approach and decided on the overall objective and structure of the paper; Giuliano Poli elaborated on and performed the analysis and the evaluations; both authors contributed to the writing of the paper and have read and approved the final version.
Conflicts of Interest
The authors declare no conflict of interest.
References
- Lewis, S.L.; Maslin, M.A. Defining the anthropocene. Nature 2015, 519, 171–180. [Google Scholar] [CrossRef] [PubMed]
- Waters, C.N.; Zalasiewicz, J.A.; Williams, M.; Ellis, M.A.; Snelling, A.M. Stratigraphical Basis for the Anthropocene; GSL: London, UK, 2014. [Google Scholar]
- Wu, J. Landscape sustainability science: Ecosystem services and human well-being in changing landscapes. Landsc. Ecol. 2013, 28, 999–1023. [Google Scholar] [CrossRef]
- Vince, G. An epoch debate. Science 2011, 334, 32–37. [Google Scholar] [CrossRef] [PubMed]
- Steffen, W.; Persson, Å.; Deutsch, L.; Zalasiewicz, J.; Williams, M.; Richardson, K.; Crumley, C.; Crutzen, P.; Folke, C.; Gordon, L. The Anthropocene: From global change to planetary stewardship. AMBIO: J. Hum. Environ. 2011, 40, 739–761. [Google Scholar] [CrossRef]
- Naveh, Z. Transdisciplinary challenges for sustainable management of Mediterranean landscapes in the global information society. Landsc. Online 2009, 14, 1–14. [Google Scholar] [CrossRef]
- Laszlo, E. Quantum Shift in the Global Brain: How the New Scientific Reality Can Change Us and Our World; Inner Traditions/Bear & Co.: Rochester, VT, USA, 2008. [Google Scholar]
- Ostrom, E. A general framework for analyzing sustainability of social-ecological systems. Science 2009, 325, 419–422. [Google Scholar] [CrossRef] [PubMed]
- Council of Europe (CdE). Eur. Landsc. Conv. Florence, 20.X.2000. European Treaty Series—No. 176. Available online: http://www.coe.int/en/web/conventions/full-list/-/conventions/treaty/176 (accessed on 20 June 2017).
- Bernetti, I. Strumenti Metodologici Per La Gestione Del Paesaggio neLla Pianificazione Territoriale. XXXVI Incontro di Studio Ce.S.E.T.; Firenze University Press: Florence, Italy, 2007. [Google Scholar]
- Millennium Ecosystem Assessment (MEA). Ecosystems and Human Well-Being; Island Press: Washington, DC, USA, 2005. [Google Scholar]
- Antrop, M. The language of landscape ecologists and planners: A comparative content analysis of concepts used in landscape ecology. Landsc. Urban Plan. 2001, 55, 163–173. [Google Scholar] [CrossRef]
- Gallopín, G.C.; Funtowicz, S.; O’Connor, M.; Ravetz, J. Science for the twenty-first century: From social contract to the scientific core. Int. Soc. Sci. J. 2001, 53, 219–229. [Google Scholar] [CrossRef]
- Cerreta, M.; Panaro, S. From perceived values to shared values: A multi-stakeholder spatial decision analysis (M-SSDA) for resilient landscapes. Sustainability 2017, 9, 1113. [Google Scholar] [CrossRef]
- Kato, S.; Ahern, J. Multifunctional landscapes as a basis for sustainable landscape development. J. Jap. Inst. Landsc. Archit. 2009, 72, 799–804. [Google Scholar] [CrossRef]
- Rodenburg, C.A.; Nijkamp, P. Multifunctional land use in the city: A typological overview. Built. Environ. 2004, 30, 274–288. [Google Scholar] [CrossRef]
- Helming, K.; Wiggering, H. Sustainable Development of Multifunctional Landcsapes; Springer: Berlin, Germany, 2010. [Google Scholar]
- Mander, Ü.; Wiggering, H.; Helming, K. Multifunctional Land Use. Meeting Future Demands for Landscape Goods and Services; Springer: Berlin, Germany, 2007. [Google Scholar]
- Naveh, Z. Landscape ecology and sustainability. Landsc. Ecol. 2007, 22, 1437–1440. [Google Scholar] [CrossRef]
- O’Farrell, P.J.; Anderson, P.M. Sustainable multifunctional landscapes: A review to implementation. Curr. Opin. Environ. Sustain. 2010, 2, 59–65. [Google Scholar] [CrossRef]
- Lovell, S.T.; Johnston, D.M. Creating multifunctional landscapes: How can the field of ecology inform the design of the landscape? Front. Ecol. Environ. 2009, 7, 212–220. [Google Scholar] [CrossRef]
- Termorshuizen, J.W.; Opdam, P. Landscape services as a bridge between landscape ecology and sustainable development. Landsc. Ecol. 2009, 24, 1037–1052. [Google Scholar] [CrossRef]
- D’Auria, A. City networks and sustainability—The role of knowledge and of cultural heritage in globalization. Int. J. Sustain. High. Educ. 2001, 2, 38–47. [Google Scholar] [CrossRef]
- Haase, D.; Larondelle, N.; Andersson, E.; Artmann, M.; Borgström, S.; Breuste, J.; Gomez-Baggethun, E.; Gren, Å.; Hamstead, Z.; Hansen, R. A quantitative review of urban ecosystem service assessments: Concepts, models, and implementation. Ambio 2014, 43, 413–433. [Google Scholar] [CrossRef] [PubMed]
- Vallés-Planells, M.; Galiana, F.; Van Eetvelde, V. A classification of landscape services to support local landscape planning. Ecol. Soc. 2014, 19, 44–56. [Google Scholar] [CrossRef]
- Daily, G.C.; Polasky, S.; Goldstein, J.; Kareiva, P.M.; Mooney, H.A.; Pejchar, L.; Ricketts, T.H.; Salzman, J.; Shallenberger, R. Ecosystem services in decision making: Time to deliver. Front. Ecol. Environ. 2009, 7, 21–28. [Google Scholar] [CrossRef]
- Costanza, R.; d’Arge, R.; De Groot, R.; Farber, S.; Grasso, M.; Hannon, B.; Limburg, K.; Naeem, S.; O’neill, R.V.; Paruelo, J. The value of the world’s ecosystem services and natural capital. Nature 1997, 387, 253–260. [Google Scholar] [CrossRef]
- Antrop, M. Sustainable landscapes: Contradiction, fiction or utopia? Landsc. Urban Plan. 2006, 75, 187–197. [Google Scholar] [CrossRef]
- Naveh, Z. Ten major premises for a holistic conception of multifunctional landscapes. Landsc. Urban Plan. 2001, 57, 269–284. [Google Scholar] [CrossRef]
- Naveh, Z. Interactions of landscapes and cultures. Landsc. Urban Plan. 1995, 32, 43–54. [Google Scholar] [CrossRef]
- Li, X.; Mander, Ü. Future options in landscape ecology: Development and research. Prog. Phys. Geogr. 2009, 33, 31–48. [Google Scholar]
- Bocanet, A.; Ponsiglione, C. Balancing exploration and exploitation in complex environments. Vine 2012, 42, 15–35. [Google Scholar] [CrossRef]
- Potschin, M.; Haines-Young, R. “Rio+ 10”, sustainability science and Landscape Ecology. Landsc. Urban Plan. 2006, 75, 162–174. [Google Scholar] [CrossRef]
- Alberini, A.; Kahn, J. Handbook on Contingent Valuation; Springer: Berlin, Germany, 2006. [Google Scholar]
- Kremer, P.; Hamstead, Z.A.; McPhearson, T. The value of urban ecosystem services in New York City: A spatially explicit multicriteria analysis of landscape scale valuation scenarios. Environ. Sci. Policy 2016, 62, 57–68. [Google Scholar] [CrossRef]
- Nemec, K.T.; Raudsepp-Hearne, C. The use of geographic information systems to map and assess ecosystem services. Biodivers. Conserve. 2013, 22, 1–15. [Google Scholar] [CrossRef]
- Bonifazi, A.; Sannicandro, V.; Attardi, R.; Di Cugno, G.; Torre, M.C. Countryside Vs. City: A User-Centered Approach to Open Spatial Indicators of Urban Sprawl. In Proceedings of the International Conference on Computational Science and Its Applications, Beijing, China, 4–7 July 2016. [Google Scholar]
- Murgante, B.; Danese, M. Urban versus rural: The decrease of agricultural areas and the development of urban zones analyzed with spatial statistics. Int. J. Agric. Environ. Inf. Syst. 2011, 2, 16–28. [Google Scholar] [CrossRef]
- Ishizaka, A.; Labib, A. A hybrid and integrated approach to evaluate and prevent disasters. J. Oper. Res. Soc. 2014, 65, 1475–1489. [Google Scholar] [CrossRef] [Green Version]
- Fregonara, E.; Curto, R.; Grosso, M.; Mellano, P.; Rolando, D.; Tulliani, J.M. Environmental technology, materials science, architectural design, and real estate market evaluation: A multidisciplinary approach for energy-efficient building. J. Urban Technol. 2013, 20, 57–80. [Google Scholar] [CrossRef]
- Malczewski, J.; Rinner, C. Multicriteria Decision Analysis in Geographic Information Science; Springer: Berlin, Germany, 2015. [Google Scholar]
- Fusco Girard, L.; Cerreta, M.; De Toro, P. Integrated assessment for sustainable choices. Sci. Reg. Ital. J. Reg. Sci. 2014, 13, 111–141. [Google Scholar]
- Cerreta, M.; Poli, G. A complex values map of marginal urban landscapes: An experiment in Naples (Italy). Int. J. Agric. Environ. Inf. Syst. 2013, 4, 41–62. [Google Scholar] [CrossRef]
- Malczewski, J. GIS and Multicriteria Decision Analysis; John Wiley & Sons: Hoboken, NJ, USA, 1999. [Google Scholar]
- Simon, H.A. The New Science of Management Decision; Harper & Brothers: New York, NY, USA, 1960. [Google Scholar]
- Barreto, L.; Ribeiro, M.; Veldkamp, A.; Van Eupen, M.; Kok, K.; Pontes, E. Exploring effective conservation networks based on multi-scale planning unit analysis: A case study of the Balsas sub-basin, Maranhão State, Brazil. Ecol. Indic. 2010, 10, 1055–1063. [Google Scholar] [CrossRef]
- Birch, C.P.; Oom, S.P.; Beecham, J.A. Rectangular and hexagonal grids used for observation, experiment and simulation in ecology. Ecol. Model. 2007, 206, 347–359. [Google Scholar] [CrossRef]
- Zavadskas, E.K.; Govindan, K.; Antucheviciene, J.; Turskis, Z. Hybrid multiple criteria decision-making methods: A review of applications for sustainability issues. Ekon. Istraž. 2016, 29, 857–887. [Google Scholar] [CrossRef]
- Georgescu-Roegen, N. The Entropy Law and the Economic Process; Harvard University Press: Cambridge, MA, US, 1974. [Google Scholar]
- Zheng, N.; Takara, K.; Yamashiki, Y.; Tachikawa, Y. Assessing vulnerability to regional flood hazard through spatial multi-criteria analysis in the Huaihe River Basin, China. Ann. J. Hydraul. Eng. 2009, 53, 127–132. [Google Scholar]
- European Union (EU). L342. Commission Regulation (EU) No 1319/2013 of 9 December 2013 amending annexes to Regulation (EC) No 1059/2003 of the European Parliament and of the Council on the establishment of a common classification of territorial units for statistics (NUTS). Off. J. Eur. Union 2013, 56, 1–57. Available online: http://eur-lex.europa.eu/legal-content/EN/TXT/PDF/?uri=OJ:L:2013:342:FULL&from=IT (accessed on 20 June 2017).
- Grêt-Regamey, A.; Altwegg, J.; Sirén, E.A.; van Strien, M.J.; Weibel, B. Integrating ecosystem services into spatial planning—A spatial decision support tool. Landsc. Urban Plan. 2017, 165, 206–219. [Google Scholar] [CrossRef]
- Haines-Yong, R.; Potschin, M. Response to Consultation. Centre for Environmental Management; CICES Version 4; University of Nottingham: Nottingham, UK, 2012. [Google Scholar]
- De Groot, R.S.; Alkemade, R.; Braat, L.; Hein, L.; Willemen, L. Challenges in integrating the concept of ecosystem services and values in landscape planning, management and decision making. Ecol. Complex. 2010, 7, 260–272. [Google Scholar] [CrossRef]
- Bastian, O.; Grunewald, K.; Syrbe, R.U.; Walz, U.; Wende, W. Landscape services: The concept and its practical relevance. Landsc. Ecol. 2014, 29, 1463–1479. [Google Scholar] [CrossRef]
- Englund, O.; Berndes, G.; Cederberg, C. How to analyse ecosystem services in landscapes–A systematic review. Ecol. Indic. 2017, 73, 492–504. [Google Scholar] [CrossRef]
- Burkhard, B.; Kroll, F.; Müller, F.; Windhorst, W. Landscapes’ capacities to provide ecosystem services—A concept for land-cover based assessments. Landsc. Online 2009, 15, 1–22. [Google Scholar] [CrossRef]
- Müller, F.; de Groot, R.; Willemen, L. Ecosystem services at the landscape scale: The need for integrative approches. Landsc. Online 2010, 23, 1–11. [Google Scholar]
- Burkhard, B.; Kroll, F.; Nedkov, S.; Müller, F. Mapping ecosystem service supply, demand and budgets. Ecol. Indic. 2012, 21, 17–29. [Google Scholar] [CrossRef]
- Sohel, M.S.I.; Mukul, S.A.; Burkhard, B. Landscape’s capacities to supply ecosystem services in Bangladesh: A mapping assessment for Lawachara National Park. Ecosyst. Serv. 2015, 12, 128–135. [Google Scholar] [CrossRef]
- O’Sullivan, D.; Unwin, D. Geographic Information Analysis; John Wiley & Sons: Hoboken, NJ, USA, 2014. [Google Scholar]
- Micelli, E.; Mangialardo, A. Recycling the city. New perspective on the real-estate market and construction industry. In Smart and Sustainable Planning for Cities and Regions; Bisello, A., Vettorato, D., Stephens, R., Elisei, P., Eds.; Springer: Berlin, Germany, 2017. [Google Scholar]
- Verburg, P.H.; Dearing, J.A.; Dyke, J.G.; van der Leeuw, S.; Seitzingerd, S.; Steffene, W.; Syvitskig, J. Methods and approaches to modelling the Anthropocene. Glob. Environ. Chang. 2016, 39, 328–340. [Google Scholar] [CrossRef]
Figure 1.
The methodological framework of the Multi-Criteria Spatial Decision Support System (MC-SDSS) for the multi-functional landscape evaluation.
Figure 1.
The methodological framework of the Multi-Criteria Spatial Decision Support System (MC-SDSS) for the multi-functional landscape evaluation.

Figure 2.
The focus area: The National Park of Cilento, Vallo di Diano and Alburni.

Figure 3.
Population growth rate in the years 2001–2011.

Figure 4.
The spatial indicators of the Provisioning Services and the Provisioning Services Composite Index.
Figure 4.
The spatial indicators of the Provisioning Services and the Provisioning Services Composite Index.
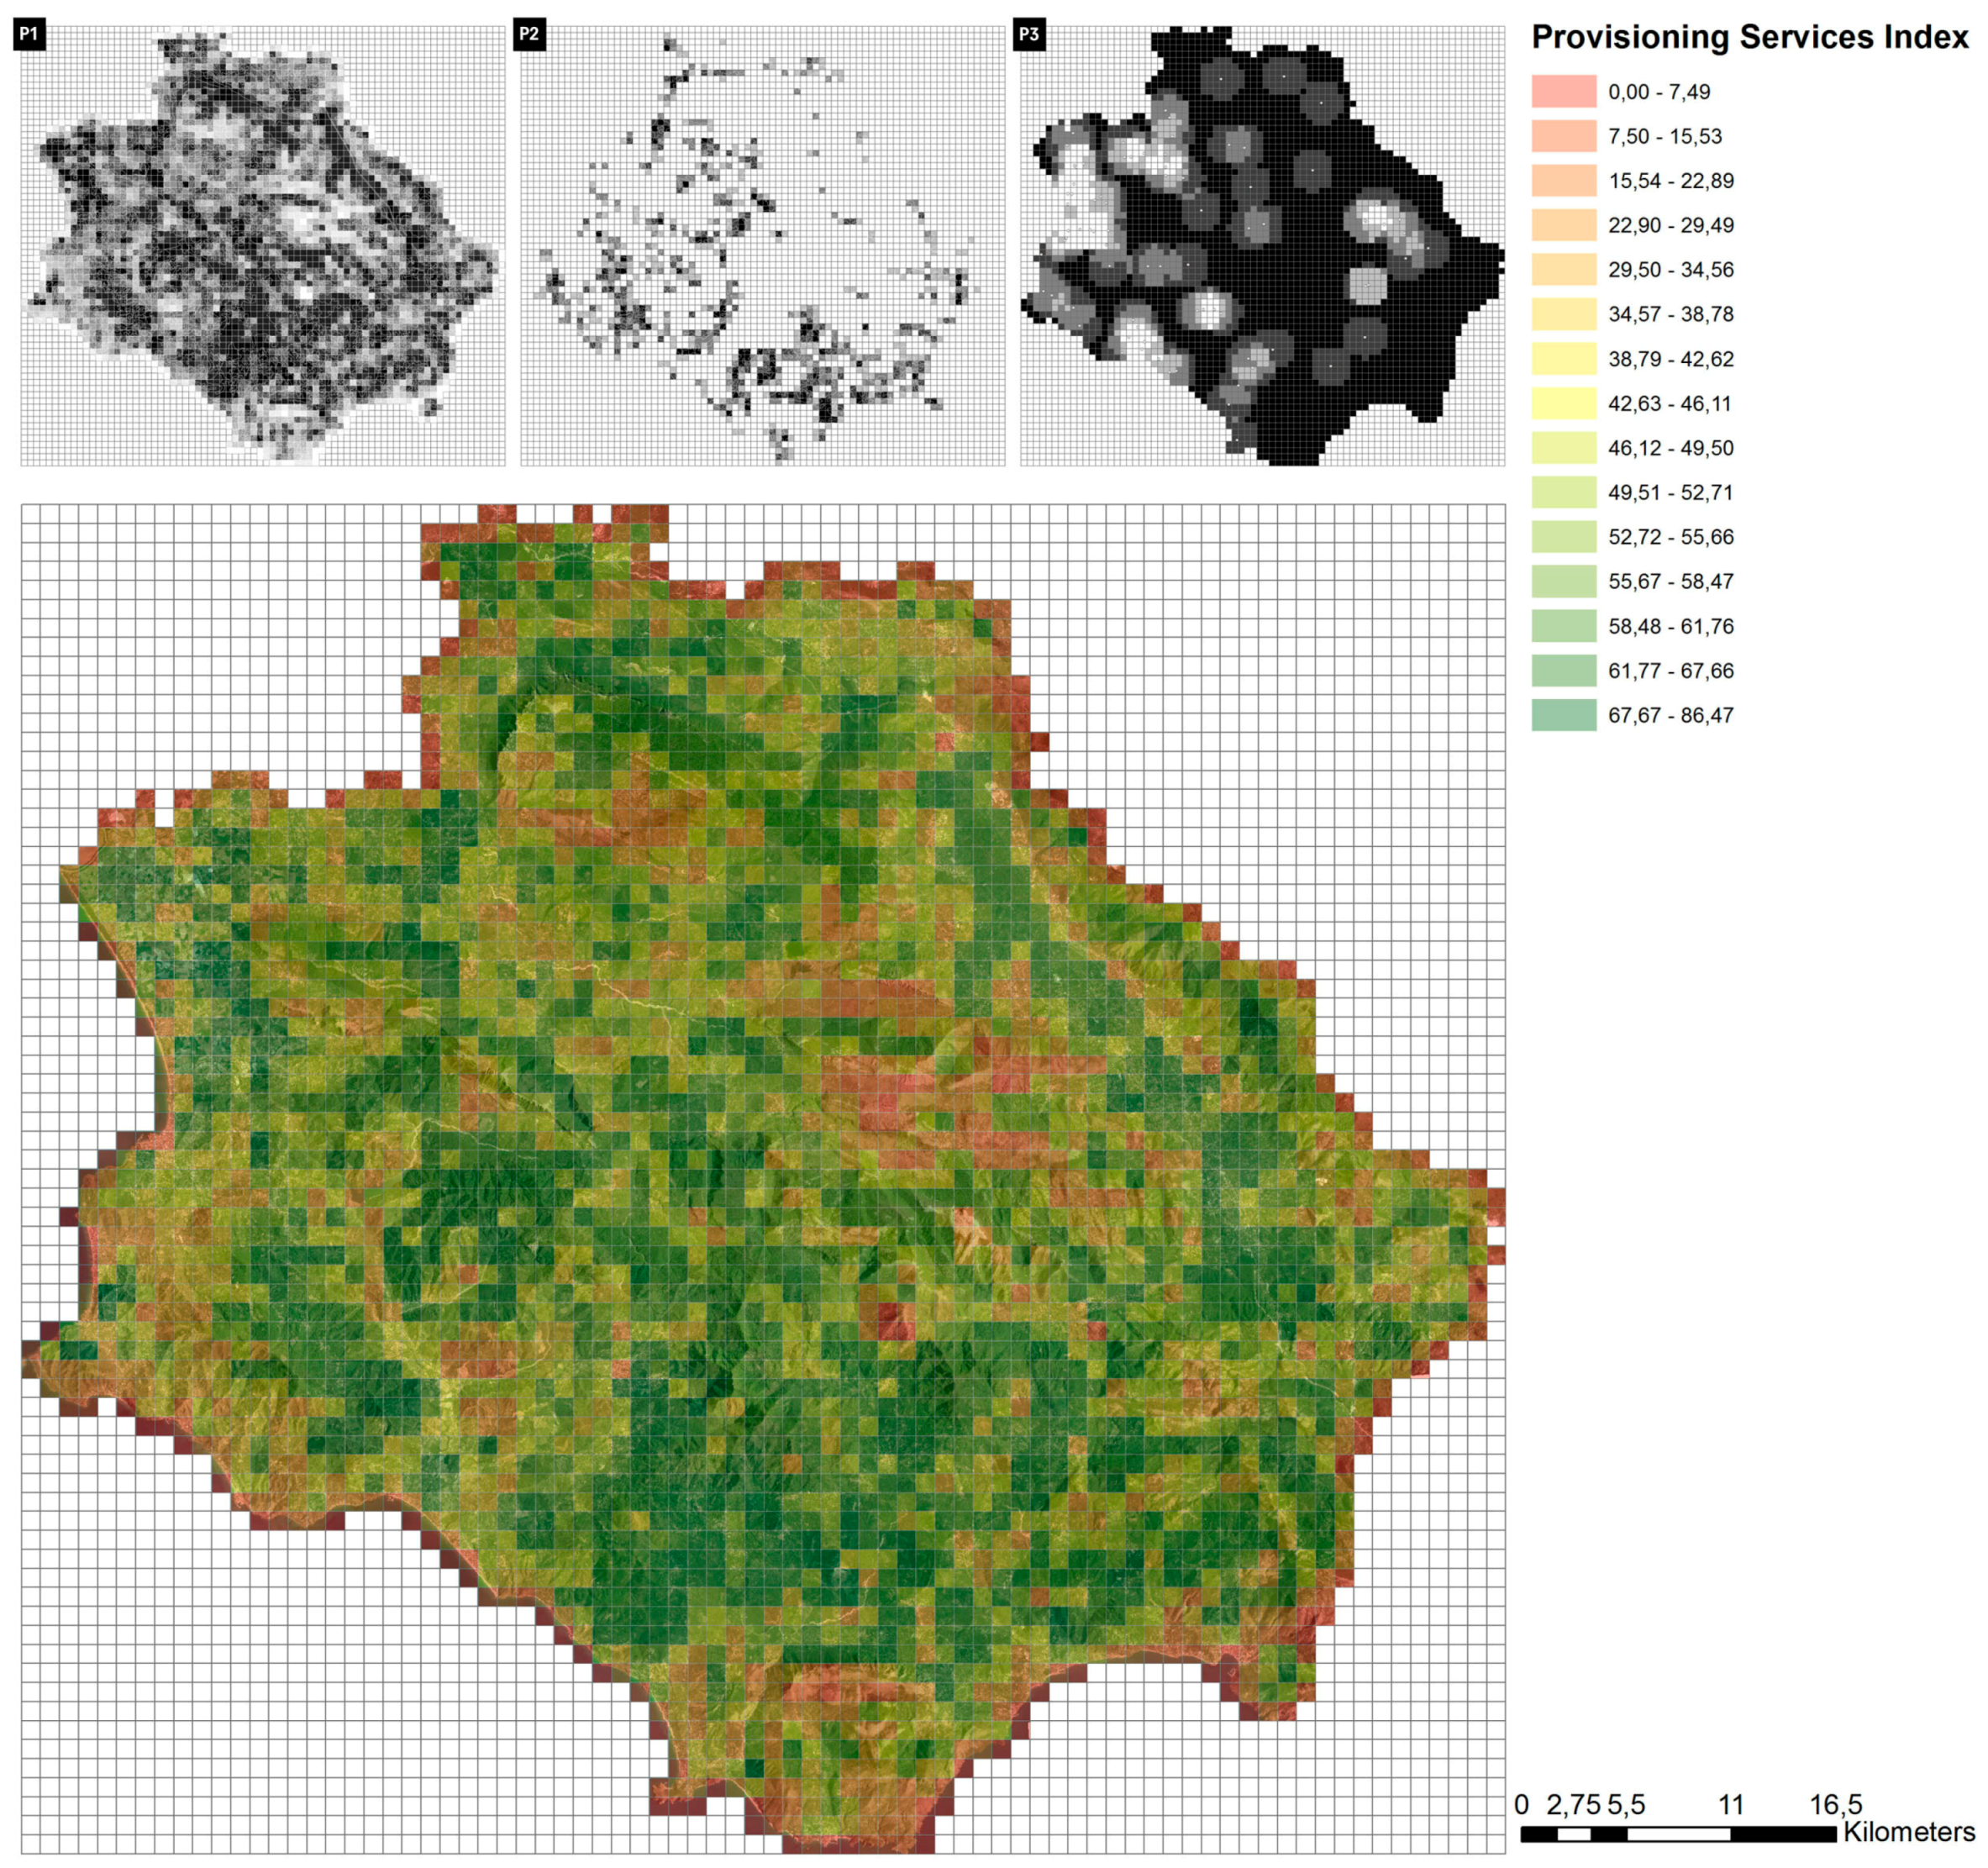
Figure 5.
The spatial indicators of the Regulating Services and the Regulating Services Composite Index.
Figure 5.
The spatial indicators of the Regulating Services and the Regulating Services Composite Index.

Figure 6.
The spatial indicators of the Cultural Services and the Cultural Services Composite Index.
Figure 6.
The spatial indicators of the Cultural Services and the Cultural Services Composite Index.


Table 1.
The structure of the spatial indicators of the landscape services (LS) and their entropy-based weights.
Table 1.
The structure of the spatial indicators of the landscape services (LS) and their entropy-based weights.
| Function I Level | Class II Level | Indicator | Entropy Weight | Code |
|---|---|---|---|---|
| Provisioning | General framework | Provisioning services index | 0.8280 | P1 |
| Nutrition | Percentage of farmland | 0.0373 | P2 | |
| Entrepreneurship | Density index of the local products firms in 1 km | 0.1345 | P3 | |
| Regulating | General framework | Ecological integrity index | 0.6505 | R1 |
| Regulating services index | 0.2596 | R2 | ||
| Regulation of physical environment | Surface of natural reservoir (ZPS and SIC) | 0.0217 | R3 | |
| Surface of Important Bird Areas (IBA) | 0.0680 | R4 | ||
| Cultural | Enjoyment | Density index of accessibility to panoramic points in 1 km | 0.0002 | C1 |
| Density index of accessibility to scenic road in 1 km | 0.0743 | C2 | ||
| Density index of accessibility to naturalistic pathways in 1 km | 0.1893 | C3 | ||
| Personal fulfilment | Density index of accessibility to geosites in 5 km | 0.0066 | C4 | |
| Density index of accessibility to historical built assets in 5 Km | 0.0222 | C5 | ||
| Percentage of archaeological sites | 0.0402 | C6 | ||
| General framework | Cultural services index | 0.6674 | C7 |
Table 2.
The statistical parameters of the raw data and the standardised values.
| Code | Mean | Max | Min | St.Dev. | Unit of Measure | Preference Direction | Standardised Values | |
|---|---|---|---|---|---|---|---|---|
| Mean | St. Dev. | |||||||
| P1 | 3.77 | 11.69 | 0.00 | 3.43 | Number | + | 50.99 | 20.18 |
| P2 | 5.08 | 99.97 | 0.00 | 14.02 | Percentage | + | 8.01 | 16.94 |
| P3 | 0.54 | 6.00 | 0.00 | 1.06 | Number | + | 14.38 | 20.42 |
| R1 | 3.26 | 7.26 | 0.00 | 2.84 | Number | + | 73.05 | 21.13 |
| R2 | 4.76 | 15.06 | 0.00 | 5.24 | Number | + | 51.41 | 30.86 |
| R3 | 27.11 | 281.04 | 0.01 | 60.33 | Km2 | + | 7.13 | 9.93 |
| R4 | 130.04 | 343.39 | 0.87 | 147.40 | Km2 | + | 19.08 | 38.07 |
| C1 | 7.42 | 997.13 | 0.00 | 73.50 | Meters | − | 0.45 | 5.10 |
| C2 | 91.74 | 999.11 | 0.00 | 225.88 | Meters | − | 10.70 | 25.00 |
| C3 | 174.84 | 997.62 | 0.00 | 279.67 | Meters | − | 22.62 | 32.94 |
| C4 | 14.55 | 4594.7 | 0.00 | 173.69 | Meters | − | 1.43 | 11.14 |
| C5 | 25.51 | 4652.95 | 0.00 | 192.42 | Meters | − | 4.43 | 19.66 |
| C6 | 4.53 | 100.00 | 0.00 | 19.48 | Percentage | + | 4.53 | 19.48 |
| C7 | 3.32 | 9.17 | 0.00 | 3.34 | Number | + | 36.24 | 36.42 |
Table 3.
Relationships among classes of services and well-being dimensions on the landscape scale.
| Function | Services Class | Code | Well-Being Dimensions | Description (MEA 2005) |
|---|---|---|---|---|
| Provisioning | Nutrition | P2 | Material minimum for a good life | Ability to access resources to earn income and gain a livelihood |
| Entrepreneurship | P3 | |||
| Regulating | Regulation of physical environment | R3 | Security | Ability to live in an environmentally clean and safe shelter |
| R4 | Ability to reduce vulnerability to ecological shock and stress | |||
| Cultural | Enjoyment | C1 | Good social relations | Opportunity to express aesthetic and recreational values associated with ecosystems |
| C2 | ||||
| C3 | Opportunity to express spiritual and cultural values associated with ecosystems | |||
| Personal fulfilment | C4 | |||
| C5 | Opportunity to observe, study and learn about the ecosystem | |||
| C6 |
© 2017 by the authors. Licensee MDPI, Basel, Switzerland. This article is an open access article distributed under the terms and conditions of the Creative Commons Attribution (CC BY) license (http://creativecommons.org/licenses/by/4.0/).
Share and Cite
MDPI and ACS Style
Cerreta, M.; Poli, G. Landscape Services Assessment: A Hybrid Multi-Criteria Spatial Decision Support System (MC-SDSS). Sustainability 2017, 9, 1311. https://doi.org/10.3390/su9081311
AMA Style
Cerreta M, Poli G. Landscape Services Assessment: A Hybrid Multi-Criteria Spatial Decision Support System (MC-SDSS). Sustainability. 2017; 9(8):1311. https://doi.org/10.3390/su9081311
Chicago/Turabian StyleCerreta, Maria, and Giuliano Poli. 2017. "Landscape Services Assessment: A Hybrid Multi-Criteria Spatial Decision Support System (MC-SDSS)" Sustainability 9, no. 8: 1311. https://doi.org/10.3390/su9081311
Note that from the first issue of 2016, this journal uses article numbers instead of page numbers. See further details here.