Ecological Footprint Analysis Based on Changing Food Consumption in a Poorly Developed Area of China

1
Institute of Geographic Sciences and Natural Resources Research, Chinese Academy of Sciences, 11A, Datun Road, Chaoyang District, Beijing 100101, China
2
School of Resource and Environment, University of Chinese Academy of Sciences, Yuquan Road, Chaoyang District, Beijing 100109, China
*
Author to whom correspondence should be addressed.
Sustainability 2017, 9(8), 1323; https://doi.org/10.3390/su9081323
Submission received: 14 June 2017
/
Revised: 17 July 2017
/
Accepted: 24 July 2017
/
Published: 22 August 2017
(This article belongs to the Special Issue Sustainability in an Urbanizing World: The Role of People)
Abstract
:The per capita ecological footprint (EF) is a useful tool to compare consumption with nature's ability to support this consumption. Guyuan is an economically impoverished region in China, where EF provides important insights into whether human consumption can be sustained by the local per capita biological capacity (BC), which represents the environment’s ability to support resource use. We estimated the EF of food consumption using local equivalence and yield factors, and compared EF in 1998 and 2013 with BC, which represented the existing biologically productive area (including cultivated land, grassland, forest, and water bodies) that supports this consumption. Data were collected from household surveys, government statistics, and land use maps. We found that food consumption changed, with decreasing consumption of staple foods and increasing consumption of meat, eggs, milk, edible oils, fruit, and vegetables. Decreased staple food consumption decreased the EF for this food group, but the large increase in meat consumption greatly increased EF from meat production (to more than 41 times the 1998 value). Cultivated land contributed greatly to both EF and BC, and staple foods and vegetables were the main EF components for this land. Overall, EF from food consumption decreased from 1998 to 2013, but local BC remained 188,356 ha below EF (i.e., current consumption is not sustainable based on local resources). The Grain for Green program, which focuses on increasing the BC of forest and grassland by replacing degraded cultivated land with these land use types, decreased the BC of cultivated land, leading to wide spatial variation in both EF and BC. These results will inform policy development by revealing the condition of each region’s use of the locally available production resources.
1. Introduction
Human well-being depends on the goods and services provided by Earth’s ecosystems [1,2,3,4]. Although there are many complex components of human well-being, increasing demand for food consumption to meet basic needs is the most important consideration in many poor communities. In recent years, rapid urbanization and economic development have increasingly changed food consumption patterns in developing regions such as rural China. In China, these changes have been accelerated by a national land use conversion program called “Grain for Green”, which is a form of payment for ecological services. The program’s goal is to convert degraded grassland and cultivated land into improved grassland and forest, with the long-term goal of preventing ecosystem degradation, including soil erosion. As a result of this focus, the program is biased in favor of grassland and forest at the expense of cultivated land. As a result, implementation of this program has been decreasing the area of land for primary productions to meet local food demand [5], potentially decreasing food security and creating potentially serious risks of ecosystem degradation [6].
For example, in poverty-stricken Guyuan, a large administrative region in the Ningxia Hui Autonomous Region of northwestern China, the food consumption pattern has been shifting from a basic level that only provides sufficient energy intake to a higher level that provides a healthier level of nutrition. In the future, such changes will be the most important variables to determine the total land requirement for food production [7]. The result of changing consumption patterns will be increasing pressure on land to produce sufficient food, particularly since the changed diets to include higher proportions of animal products [5,8]. However, limited land resources and a harsh natural environment affect the ecosystem’s provision of the required services. For example, the per capita area of cultivated land in Guyuan has decreased by 11.2% from 1998 to 2013 under the implementation of Grain for Green program. This large decrease has resulted from the nature of the terrain. Guyuan is a hilly region with slopes ranging up to 67°. About 58.6% of the cultivated land is on slopes <5°, 32.3% is on slopes of 5° to 15°, and 9.1% is on slopes >15°, making cultivation difficult.
In addition, the limited mean annual rainfall (260 to 625 mm), high annual potential evaporation (1250 to 2000 mm), and insufficient irrigation facilities make the local agriculture rain-fed in most places [6]. Agricultural production, including irrigational cultivation and animal husbandry, consumed about 8.35×10⁹ m3 of water, equivalent to 16.8% of Guyuan’s total water resources [9]. Soil erosion is a severe problem in Guyuan, with about 76% of the land suffering from soil erosion. These problems affect, to a large degree, the production and provision of food items. They may even be causing irreversible damage to local ecosystems [5]. In order to enhance the production of goods and services to meet local consumption, some technologies and external inputs have been used, which include the construction of terraces to reduce losses of soil, water, and soil nutrients. As of 2014, the terrace area occupied about half of the total cultivated land [10].
The ecological footprint (EF) represents the area required for resource production and waste assimilation [11,12,13]. When the calculation is not based on site-specific or local data, as is often the case in large-scale or global studies, it may instead be based on the overall average productivity around the world, in which case the area unit is defined as a “global hectare” (gha). EF is a consumption-based indicator, and it includes all the natural capital that is directly or indirectly used or consumed by the local population. In this accounting approach, an important element is represented by the calculation of biological capacity (BC), which is sometimes referred to as biocapacity [14]. BC is used to measure the existing biologically productive area capable of regenerating in the form of fiber, food, and timber, and also providing carbon dioxide sequestration. BC is measured in relation to five categories of use: grazing land, cultivated land, forest, fishing areas, and built-up land [15,16]. To do so, it is necessary to calculate a region’s total area of ecologically productive land. The combination of EF (equivalent to demand) and BC (equivalent to supply) allows researchers to estimate whether or not humans overuse the biosphere’s resources by subtracting the EF from BC for a given period of time to identify a deficit or surplus.
EF analysis is now widely used as an indicator of ecological overshoot and human demand on natural systems [17,18,19,20]. It is used at different scales, such as countries [8,21,22], regions [23], and cities [24,25,26,27,28]. For example, Goldstein et al. [29] explored the EF of urban food consumption in 100 cities from non-OECD countries. The report released by WWF [20] indicates that the total global population needs the regenerative capacity of 1.6 Earths to provide the natural resources we use each year, based on calculations from the five land use categories and the carbon EF. This indicates that humanity has already overshot the global BC and lives unsustainably by depleting stocks of natural capital. EF accounting has been used to support decision making in recent years, since some scholars have pointed out that EF analysis can provide useful information or ecological implications for policy makers who must integrate food security with ecological implications [30,31]. However, Van den Bergh and Grazi noted that EF studies have often delivered ambiguous and surprising insights that suggest there are limitations to which policy questions the EF method can answer [32].
In China, the difference between EF and BC has been used as an indicator of the ecological performance of local governments, and this difference has played a significant role in regional development [33]. WWF found that per capita Chinese EF was 2.2 ha in 2010, which was lower than the world average of 2.6 ha in the same year; at the same time, BC increased from 2010 to 2012 due to the implementation of national ecosystem restoration programs since 2000 [22]. Song et al. found that food, water, waste, embodied carbon, and EF of households in China have steadily increased as income increased [34]. They also found that the proportions of EF accounted for by plant and animal foods differed [35].
Galli et al. pointed out that the dramatic increase in China’s carbon footprint in recent years has resulted from an equally remarkable increase in per capita energy consumption [12]. At a sub-national level, Hu et al. [36] calculated the EF at the level of a Chinese county, and used their approach to compare different counties. However, existing studies have mostly focused on EF at national or sub-national levels by trying to account for all of the economic sectors; fewer have studied that the EF of biological resources to clarify the structure of EF for consumption driven by socioeconomic development, particularly in less-developed rural areas in China [37,38]. This is an important omission because socioeconomic development will change the relationship among various forms of resource exploitation (e.g., energy use, land use, industrial use) and the BC that supports each resource [8,39]. For example, in rural China, where the area of agricultural land has steadily decreased since implementation of the Grain for Green program, this has led to increased pressure on the remaining productive land. Moreover, as has been found in other countries [40,41], as well as at a household level [42], socioeconomic and natural factors affect the implementation of a conservation program. However, EF at a household level has seldom been studied due to lack of data and information [36]. Thus, it has become increasingly necessary to examine the changes in the relationship between the EF of food consumption and the BC that provides this food in response to changes in food consumption patterns at a household level.
In the present study, our goals were to (1) analyze the changes in food consumption patterns from 1998 to 2013 in an impoverished rural region of China; (2) estimate, the EF of food created by current consumption of local food, which based on local equivalence and yield factors; and (3) compare the EF and BC of the study area to detect ecological deficits or surpluses that have occurred since implementation of the Grain for Green program for different biologically productive lands. The results of this research will guide management planning by providing evidence of unsustainable practices and improve land use decision making and socioeconomic development.
2. Study Area and Research Methods
2.1. The Study Area
We selected Guyuan for our case study. The Grain for Green program has been implemented in this area since 2000. The study area is located in a remote mountainous region of northwestern China (Figure 1), and consists of five counties: Yuanzhou, Pengyang, Xiji, Jingyuan, and Longde. The elevation ranges from 1248 to 2942 m above sea level, with mountainous terrain. The study area has a continental monsoon climate that is characterized by an annual average temperature of 5.7°C, with extreme monthly mean values ranging between −22 °C in January and 28 °C in August. The mean annual rainfall ranges from 260 to 625 mm between different parts of the region and the evaporation (measured pan evaporation) ranges from 1250 to 2000 mm. As a result, there are few large bodies of surface water, and only rain-fed agriculture for most of the area. The major crops grown in Guyuan are winter wheat (Triticum aestivum), summer maize (Zea mays), and potato (Solanum tuberosum), which occupy 48% of the total cultivated area. The remaining crops are millet (Panic um miliaceum), oats (Avena sativa), buckwheat (Fagopyrum esculentum), oilseed rape (Brassica napus), and legumes (including common beans, Phaseolus vulgaris; field beans, Vicia faba; and peas, Pisum sativum). A small scale of fruit trees, vegetables, and fodder crops is planted for their livelihood. Moreover, reeding of pigs, cattle, sheep, and poultry is practiced in the backyard of most households.
In 2013, the area had a population of 1.54 × 10⁶, of which 1.24 × 10⁶ were permanent residents. In all subsequent per capita calculations, we used the permanent population of the area, excluding migratory workers. The rural population is 0.89 × 10⁶ (71.8% of the permanent population). From 1998 to 2013, the total population increased by 0.3% and the population density increased by 0.4%, from about 144.9 persons/km2 to 145.5 persons/km2. The total land area is 1.13 × 10⁶ ha, and in 2013, it was dominated by cultivated land (355,000 ha, 31.4% of the total land area), forest (311,000 ha, 27.5% of the total land area), and grassland (221,400 ha, 19.6% of the total land area); the remainder of the land includes built-up areas, bodies of water, and unused land. After implementation of the Grain for Green program in 2000, land use patterns have changed dramatically, with cultivated land and grassland decreasing by 45.3% and 57.0%, respectively, from 1998 to 2013 and forest increasing by 83.8%. The main land-use activities are smallholder subsistence agriculture and livestock husbandry, with an average cultivated land size of 0.37 ha per household. This agriculture is one of the key sources of employment in Guyuan; 81.4% of the population worked in agriculture in 2013, which is much higher than the national average of 64.4% [43].
The major crops grown in the study area are cereals, including winter wheat (Triticum aestivum) and summer maize (Zea mays), but potato (Solanum tuberosum) is also widely planted as a source of carbohydrates, and is categorized as a staple crop by the local people. These three crops occupy 48% of the total cultivated area. The remaining cultivated land is used mainly for cultivation of millet (Panicum miliaceum), buckwheat (Fagopyrum esculentum), oil-producing plants such as oilseed rape (Brassica napus), oats (Avena sativa), legumes (including field beans, Vicia faba; common beans, Phaseolus vulgaris; and peas, Pisum sativum), sweet potato (Ipomoea batatas), and a range of vegetables, fruit trees, and fodder crops. Breeding of pigs, cattle, sheep, and poultry is practiced on a small scale in the backyard of most households.
In 2013, the agricultural economic output value of Guyuan was 5.85 × 10⁹ Chinese Yuan (CNY), the forest output value was 0.45 × 10⁹ CNY, and the animal husbandry output value was 2.53 × 10⁹ CNY. Subsistence agriculture accounted for the largest part of the rural economic structure of Guyuan. However, due to limited land resources and a harsh natural environment, per capita net income of rural Guyuan was only 4690 CNY in 2013; although this represents an increase to nearly 5 times the 1998 value, this is still only 53% of the national average of 8896 CNY, although this income gap has decreased (from 44% of the national average in 1998). In 2013, about 38.3% of the rural population had an income below the poverty line (2300 CNY per capita per year) defined by the central government.
Given the level of poverty of the study area and the limited land resources, the daily food consumption of the local population is relatively low, and consists mostly of carbohydrates (e.g., noodles, steamed bread) and vegetables (mostly produced in the backyard of each home), with less consumption of meat than in most other regions in western China. Meat consumption, which is considered to be an indicator for improved living standards in rural China, is mostly associated with festivals and special events such as wedding ceremonies [5].
2.2. Research Methods
2.2.1. Calculation of Ecological Footprint and Biological Capacity
In this paper, we converted food consumption data from Guyuan into the area that was required to support this consumption using the average local agricultural productivity [36,44]. We focus on the EF of food consumption using the same approach for four major biologically productive land types respectively, which are cultivated land, grassland, forest, and body of water. We did not include EF from fuels and CO2 emission from the harvesting, extraction, manufacturing, and trade of food commodities due to a lack of reliable data. This omission seems unlikely to have greatly affected our results, at least in relative terms, because local agricultural production is mostly small-scale subsistence agriculture, and most of the work is done manually or with help from cattle and donkeys.
We used the areas of each type of land in Guyuan and the associated biological productivity in the EF calculation to reveal changes in EF resulting from the changing food consumption patterns. The calculation formula is as follows:
where EF is the total EF of Guyuan (ha); N is the population; ef is the per capita EF (ha); rj is an equivalence factor for biologically productive land type j (j = 1 to 4), for cultivated land, grassland, forest, or body of water); ci is the per capita consumption of food item i (kg); Yi is the average yield of food items i (kg/ha); Pi is the annual production of food item i (kg); Ii is the annual inflow (imports) of food item i (kg); and Ei is the annual outflow (exports) of food item i (kg).
In EF analysis, each product is assigned an equivalence factor for the land type from which it is extracted [45,46,47,48]. In our study, the equivalence factor is calculated as the ratio of the average ecological productivity of biologically productive land of type j in Guyuan to the average ecological productivity of all types of biologically productive land in Guyuan. This approach was previously used to determine the equivalence factor at a provincial scale [49] and at a city scale [36] in China. In addition, because the average productivities of the different food items differ among the types of biologically productive land and therefore cannot be directly summed up, we transformed each food item into a unified energy value (kJ) that can be summed to produce a total value [36,47,49,50].
In this study, the equivalence factor for biologically productive land type j in Guyuan (rj) is calculated based on local ecological productivity, and is calculated as follows:
where kj is the average ecological productivity of biologically productive land of type j (kJ/ha); k is the average ecological productivity of all biologically productive land types (kJ/ha); Qj is the total biomass of biologically productive land of type j (kJ); Sj is the area of biologically productive land of type j (ha); is the annual production of food item i on biologically productive land of type j (kg); and is the calorific value of food item i on biologically productive land of type j (kJ/kg).
Because not all of the land is available for human use, some part of the study area should be subtracted from the total to provide habitat with which humanity shares this planet. To account for this area, we set aside 13.4% of the BC to represent the net effect for all ecosystem types combined. This value accounts for biodiversity protection based on the recommended value in the Footprint 2.0 at “Redefining Progress”, which was developed by Venetoulis and Talberth [51]. The specific calculation formula is as follows [44,52]:
where BC is the BC for Guyuan (ha); bc is the per capita BC (ha); aj is the per capita area of biologically productive land of type j (ha); rj is the same equivalence factor as in “Formula (2)”; and yj is the yield factor for biologically productive land of type j, which equals the ratio of the average for each county to the overall average value for the study area. A scaling factor is used to convert from local to average biologically productive land requirements, aims to reflect differences in the average productivity of certain types of land in different parts of the study area.
BC = N (bc) = Najrjyj
2.2.2. Data Sources
Primary information on food consumption was collected through a survey of farm households. In the survey, three main categories of food items were identified and recorded, including (1) annual staple agricultural products: cereals, potatoes, and beans, vegetables and fruits; (2) annual secondary agricultural products: pork, mutton, beef, domestic poultry, fresh milk, eggs, and aquaculture products (e.g., fish and shrimp); (3) annual manufactured and processed agricultural products, mostly edible plant oils.
To increase the randomness of the sampling and reduce the bias of selection [53,54], we interviewed five key informants who were familiar with the situation in each village and who had conducted annual socioeconomic surveys (these individuals were employed by the Rural Socio-economic Survey Team of SBGY or by the Agricultural Bureau and Forestry Bureau of Guyuan) to identify the criteria for village selection within each county. The defined criteria for village selection is (1) food consumption representative of local patterns (i.e., dominated by carbohydrates such as noodles and steamed bread); (2) exhibiting a range of production and income activities; (3) land use change had occurred under the Grain for Green program; and (4) the sample was chosen to represent a range of mean distances from the village center to the town or county center, which affects access to markets. This approach represents stratified random sampling [55], which reduces the magnitude of coverage bias by increasing the likelihood that all key statistical strata will be included in the survey. Thus, stratified random sampling method has used to select the villages, leading to selection of 19 survey sites in 15 villages distributed in all five counties (Figure 1).
We then used simple random sampling (flipping a coin) to select farmer households in each village to answer our questionnaire. That is, we used the common approach of flipping a coin to represent a binary choice: include or exclude the household from the survey. As we walked through the village, we flipped a coin when we came to each new house to determine whether to include the house in the survey; we continued until we had reached our desired sample size. This is a common approach for random sample selection in the field [55,56,57] and has been widely used [58,59,60,61]. We prepared a questionnaire that listed the main food items included in a dietary survey based on household socioeconomic data [43] and consultation with local experts. We asked each household to report their annual food consumption as kg per household, and then converted these values into average annual kg per capita. The survey was conducted in August 2009 (236 local farmer households surveyed) and September 2014 (221 local farmer households surveyed). We collected data for 1998 and 2013 because consumption changed greatly during this period due to the implementation of the Grain for Green program in 2000 and rapid socioeconomic development (e.g., urbanization, increasing income, market reforms). Data for 1998 was obtained during a survey in 2009, when the households were asked to recall their consumption in 1998. Despite the gap between 2009 and 1998, the data is likely to be reliable because the consumption patterns changed dramatically after 2000 due to the combined effects of land use changes, socioeconomic development, and increased awareness of local people about the importance of a balanced diet. We cross-checked this data with data from a 1998 survey by the Statistic Bureau of Guyuan to validate our data, and if there was an inconsistency, we talked with members of the household to confirm the data. Data on consumption in 2013 was obtained during our 2014 survey, in which we re-visited the same households that we visited in 2009; however, because some of the households no longer lived in the villages or could not answer our questions due to hearing difficulties and other problems, we interviewed fewer households in total (221 families) than in 2009. By visiting the same households in both surveys, this provided a before and after comparison of the changes in consumption.
During the survey, we asked the head of each household or a family member who was familiar with the household to answer the questions. Table 1 summarizes the results. The average age of the farmers we interviewed increased by 6 years during the research period. Per capita net income increased by 3600 CNY, reaching 4.7 times the 1998 level, but this was only 44.4% and 32.9% of the provincial and national averages, respectively. The proportion of income from off-farm sources such as working in cities as a migrant worker increased by 29%, reaching nearly half of total income, and government subsidies and other income increased to nearly 10% of the total. Educational attainment did not change greatly, averaging slightly more than 8 years. Data from the Guyuan Household Socio-Economic Survey [43]were used to validate the household survey data and provide any missing data.
The average productivity for food items consumed in Guyuan was calculated by using statistical data from the Ningxia Agricultural Statistics 1998-2000 [62] and The Handbook of Economy in Guyuan in 2013 [63]. Other data were obtained mainly from the Ningxia Statistical Yearbook 2013 [64], which represents China’s first agricultural census in the Ningxia Hui Autonomous Region. Energy values for the biological products were obtained from Chen [65].
The raw data were used to calculate the equivalence factors, which provided in Supplemental Tables S1–S14.
3. Results
3.1. Changing Food Consumption Patterns in Guyuan
We grouped the major foods required to sustain health in the household surveys into six categories according to the local classification: staple foods (cereals, potatoes, and beans); vegetables and melons; meat, eggs, and milk; edible plant oils; fruits; and aquaculture products. Table 2 summarizes the per capita consumption of these food items. The food consumption pattern of Guyuan in 1998 depended most strongly on staple foods (84.6% of the total foods), followed by vegetables and melons (9.6% of the total foods). Although staple foods decreased to 58.1% of the total in 2013, they remained the dominant component of food consumption. Potatoes were the second-most important food item in 1998 (33.2% of the total staple food and 28.1% of the total food). In 2013, vegetables and melons (24.0% of the total food) replaced potatoes in second place, with meat, eggs, and milk (8.4% of the total food) in third place. Plant oils are primarily edible oils used for cooking, and thus accounted for only a small amount of the total (<3.0% of the total food) in both years. Aquaculture products are consumed only during special occasions such as festivals, so their consumption was very low (<0.2% of the total food) in both years. However, consumption of both plant oils and aquaculture products increased between 1998 and 2013. The consumption of meat, eggs, and milk increased to more than 2 times the 1998 value, versus about 1.3 times the 1998 value for fruits and 4 times the 1998 value for aquaculture products. This food structure reflects the fact that a standard meal in northwestern China is dominated by carbohydrates (e.g., steamed bread, noodles, or rice), but with at least some vegetables or vegetables and meat [5].
There are several factors that contributed to these changes. First, the Grain for Green program decreased the area of unproductive farmland and of farmland on slopes. All of the farmers have been involved in the conversion of farmland into forest and grassland under this program since 2000, so the per capita area of cultivated land decreased by 11.2% from 1998 to 2013, whereas the grassland and forest areas increased by 23.7% and 15.9%, respectively, according to data from the Resource and Environment Data Center of the Chinese Academy of Sciences [66]. This has greatly decreased total staple food production, especially for potatoes, which were cultivated mostly on steep slopes that were converted into grassland or forest under Grain for Green. Second, socioeconomic development during the same period increased the mean income to 4.7 times the 1998 value in Guyuan. One component of Grain for Green emphasized the conversion of sloping cropland into forests or grassland with the primary objective of reducing soil erosion and the resulting sedimentation of bodies of water. A study of this component found that the program also improved farmer income, especially for low- and medium-income households [67]. This component of Grain for Green also mitigated liquidity constraints in the implementation region by providing subsidies that made it easier for farmers to switch to non-farm activities [6], and most households therefore earned a larger portion of the total household income (47%) from off-farm jobs in Guyuan, as was the case in the rest of China [68,69]. In addition, the subsidies provided by the government for the increased area of forest converted from cultivated land have been a significant source of income for participants in this program; for forest area converted from cultivated land, the household receives an annual subsidy of about 300 CNY/ha of eligible land to pay for tending and miscellaneous expenses related to the newly converted land. Moreover, the households can earn income from selling renewable forest products such as fruits and nuts; thus, out of the total income increase in Guyuan, about 44% was from forest. Third, since China’s economic reforms and opening up to the West in 1978, accompanied by the gradual development of a market economy, a market for consumer goods has developed quickly, which enables farmers to purchase these items more easily. In addition, improved awareness of the importance of a balanced diet has encouraged farmers to purchase more diverse food from local markets.
Data source: Household surveys conducted in 2009 and 2014. Data from the Guyuan Household Socio-Economic Survey [43] was used to determine the basic consumption categories and validate the results from our surveys. Values in parentheses are the percentages of the total for the respective food categories. Meat includes pork, lamb, and poultry. Melons include mainly watermelon and sweet melon. Values with ± represent means ± standard deviations.
Table 2 shows the per capita EF of biological resources in Guyuan decreased from 0.9423 ha in 1998 to 0.7711 ha in 2013, which suggests a decrease in the pressure on the ecosystem. Changes in the food consumption pattern have created parallel changes in EF values both for the study period as a whole and for the specific food items (Table 2). EF decreased by 18.2% from 1998 to 2013. EF decreased by 94.4% for potatoes and 86.5% for vegetables and melons, versus increases of 266.7% for beans and more than 4100% for meat. The changes for potatoes resulted from several factors, including a decrease in their area of cultivation; they were also replaced with other foods such as meat, vegetables, and eggs due to increasing wealth and thus, increased ability to purchase these foods. People also became aware of the need to reduce their intake of starch-rich food and replace it with more diversified items. In contrast, the EF decrease for vegetables and melons resulted from increases in their yield and their total production due to increased inputs of fertilizer, pesticides, irrigation, and labor [70,71]. The increase in beans resulted from increasing recognition of the high nutritional value of this food group, whereas the increase for meat resulted from increasing incomes, which allowed residents to afford more meat in their diet [5,72]. Per capita meat consumption increased by 131.5% on a mass basis, but its EF increased by 4149%; this is because meat production requires a large amount of land per unit production.
Changes in the food consumption pattern also led to changes in the EF for each land use types (Table 3). Cultivated land accounted for almost all of the agricultural EF (98.0% in 1998 and 94.6% in 2013), but the EF of forest and grassland increased to roughly 3 and 2 times the 1998 value, respectively, mainly due to the increase in fruit and meat consumption. The production of staple foods and oil plants (e.g., sunflower seeds, rapeseed, and flaxseed) and of vegetables and melons accounted for the majority of the EF of cultivated land, with proportions of 61.8 and 18.8% of the total, respectively. Meat production also requires large amounts of cultivated land because pigs and poultry rely on food crops. As a result, the consumption of cultivated land increased to 19.4%. The EF of grassland was accounted for by the raising of grazing animals to produce meat (beef, mutton) and milk. And fruit accounted for most of the EF from forest (since fruit trees are classified as “economic forest” in the Chinese land classification), with fruit accounting for 34.5% of the forest EF, including apples, pears, peaches, apricots, and dates. The consumption of aquaculture products accounted for 0.2% of the EF for bodies of water.
3.2. Comparison of Ecological Footprint and Biological Capacity in Guyuan
Table 3 shows that per capita BC increased from 0.6101 ha in 1998 to 0.6197 ha in 2013, possibly because the increase to nearly 4 times the 1998 level for the BC of forest was offset by a decrease of roughly 24.1% in cultivated land. The net result of the changes in EF and BC is that the per capita ecological deficit (BC – EF) decreased from 0.3878 ha in 1998 to 0.1514 ha in 2013. These results confirm that the Grain for Green program has increased the study area’s BC, as has been the case elsewhere in China [22], but reveals that there is still a significant ecological deficit. When the per capita deficit is multiplied by the total population of Guyuan, the total EF of biological resources in 2013 equaled 956,164 ha, versus a total BC of 768,428 ha; thus, the total deficit of biological resources is 188,356 ha, which is equivalent to 16.6% of the total area of 1.13 × 10⁶ ha. However, this deficit is only for the biological resources of Guyuan, and further work will be required to quantify the effects of all consumer goods, fuels, and greenhouse effect gases.
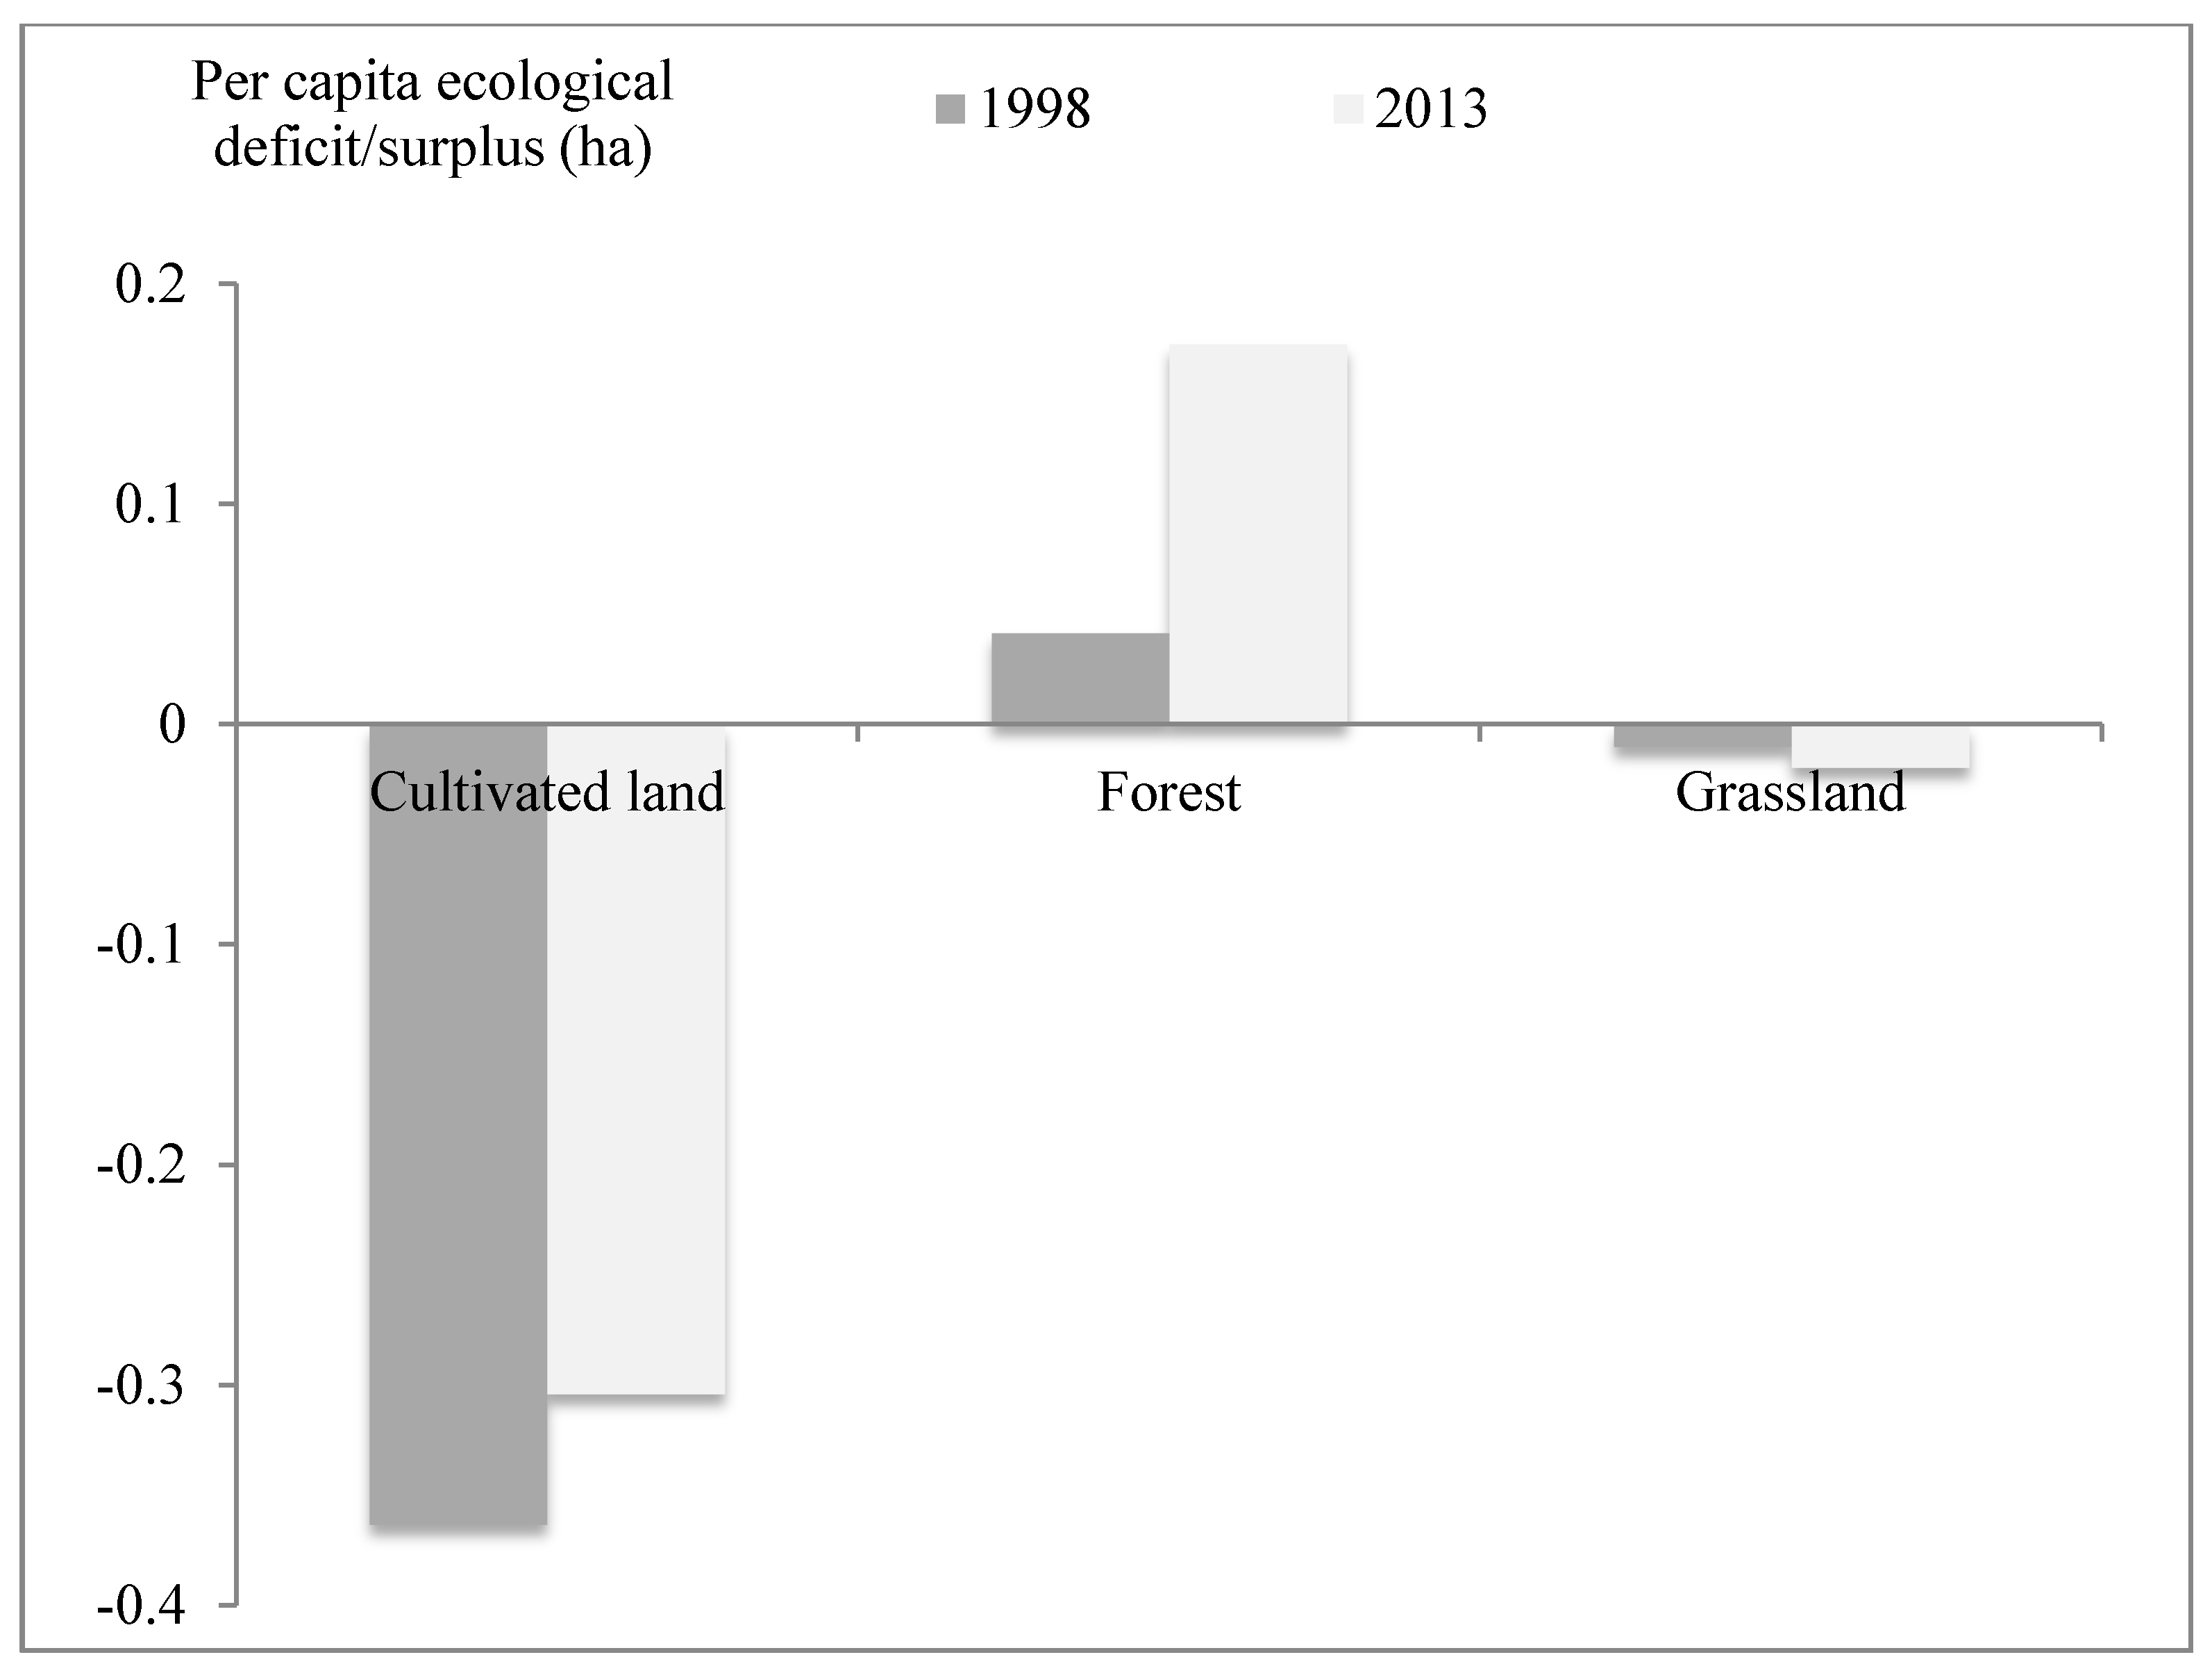
There are many possible reasons for these results. First, implementation of the Grain for Green program since 2000 has greatly decreased the area of cultivated land while increasing forest and grassland areas. This has reduced the BC of cultivated land by 24.1%, while improving the quantity and quality of grassland and forest, which increased their BC by 142.9% and 310.9%, respectively. Second, food consumption patterns have changed, with reduced consumption of staple foods leading to reduced EF for cultivated land, and thus a slight decrease of the per capita ecological deficit for cultivated land (by 0.0591 ha). In contrast, increasing meat consumption has increased the EF for grassland, so although the BC of grassland increased by 142.9%, the total ecological deficit for grassland increased by 0.0095 ha (by 92.2%) (Table 3). On the other hand, decreased consumption of forest products and improved forest conditions created an ecological surplus for the forest area (Figure 2).
3.3. Spatial Variation of the EF and BC among the Five Counties in Guyuan
The gap between EF and BC in 2013 differed among the five counties in Guyuan (Table 4). Pengyang County is the only one with a per capita ecological surplus (0.3626 ha), because it was chosen as a demonstration county for implementation of the Grain for Green program and implementation began earlier here than elsewhere in Guyuan. Thus, forest cover increased by 24%, and the area treated to reduce soil erosion increased by 73%, leading to greatly improved BC. Longde County had the highest per capita ecological deficit (0.3295 ha) due to its relatively high per capita EF, which resulted from high per capita vegetable consumption (148.45 kg; Table 5), and its relatively low per capita BC (0.3552 ha). The low BC resulted from its relatively small per capita land area, leading to the highest ecological pressure (EF/BC = 1.93) among the five counties. In Jingyuan County, the low per capita meat consumption (14.4 kg; Table 5) permitted the lowest EF value (0.4876 ha) among the five counties. This can be explained by the high proportion of Muslims in the population (79%); as a result, pork consumption was only about 5% of total meat consumption, which is much lower than the average of 34% for Guyuan. Therefore, when the consumption of staple foods was similar in two areas, the consumptions of vegetables and meat were the primary determinants of EF, since the standard meal in this region consists of staple foods, vegetables, and meat.
4. Discussion
4.1. Limitations of the Methodology
In this study, we calculated the EF of food consumption based on four major land types, using local average productivities, without taking into consideration the total area required to absorb the wastes and greenhouse gases generated by production and consumption activities, technology inputs, and consumption of raw materials to produce clothing, support cooking, and construct houses and infrastructure. Thus, EF values are likely to have been underestimated. As a result, the ecological deficit revealed in our study only considers the impact of biological resources, and further work will be required to fully quantify the other impacts. These impacts may be considerable. For instance, Song et al. found that consumption of animal-derived foods was only 15% of total consumption by weight, but accounted for 13% of wastes; consumption and wastes accounted for (respectively) 34% and 30% of the total embodied carbon footprint, 37% and 44% of the water footprint, and 44% and 27% of EF [34].
We also did not consider imported and exported products, since these flows are currently relatively small in our study area, but with increasing income, this situation may change. In addition, we did not account for changes in the population structure and the “floating” population of migrant workers that moves among regions in China. For instance, about 2% of the total population in Guyuan (not including permanent residents of Guyuan who worked for part of the year in nearby urban areas) was migrants from other regions in 2009, and this will affect local consumption patterns [73]. All of these aspects will affect the accuracy of our results, but it was not possible to solve these problems in the current study due to a lack of the required data. In future research, it will be necessary to identify ways to mitigate the problems with the present method by obtaining more and better data.
The calculation of EF requires a large amount of data, which limits its application [35], especially at smaller local scales, where much of the data is sometimes missing or inadequate. An EF study of dietary changes, such as the present study, also faces the problem of data accuracy, since dietary surveys are notoriously problematic; respondents often misreport or forget their true eating patterns, especially for meals eaten “away from home” [74]. In our current study, which is now underway, we asked the households to record their daily consumption and the sources of food using data sheets that we distributed, and we are also training both respondents and interviewers to improve quality control. In addition, we are seeking ways to validate the collected data.
4.2. Discussion of the Results
Our study revealed that food production and consumption at a village level are affected by land uses, production activities, income, and accessibility to markets; they are also affected by compensation policies and programs that have been implemented in their specific area, such as the Grain for Green program, comprehensive management of low-productivity farmland, and funds for poverty alleviation. In addition, based on this changed local productivity data, the per capita EF from food consumption was 0.7711 ha in 2013, which is much higher than the average value of 0.4956 gha for food consumption in China [34]. EF was mainly contributed by cultivated land (94.6%), and its contribution to the total was much higher than the national average of 25% [22], largely because our study area is a rural area dominated by crop cultivation. For China as a whole, the largest contributor to EF was vegetables [34], for which production tends to require less land because of the increased productivity permitted by using greenhouses and high inputs. However, caution must be taken when comparing these results with the present results, since the datasets differed in terms of the number of food items that were studied and the use of a local productivity rather than a global average productivity. In general, the per capita EF from food consumption was lower than the national average of 2.2 ha and the global average of 2.6 ha in 2010, but the latter figures included EF both from different land categories and from carbon emission and sequestration [22].
In addition, although EF from meat, milk, edible oils, beans, and fruit increased from 1998 to 2013, the average EF in Guyuan decreased. This result is inconsistent with those of previous studies [31,34,75], which concluded that a shift towards a higher consumption of protein-rich food is likely to cause an increase in EF. This difference is likely to be because we did not include carbon, wastes, and other factors in the EF calculation, leading to underestimation of EF. In addition, our study region is one of the first places where ecological restoration programs were implemented in China. Thus, the local BC has had a longer period in which to increase than is the case in many other regions of China [22]. Third, an increase in productive land resources led to increases in productivity. For example, the productivity of grains increased by 3.3% during our study period, from 3682 kg/ha in 1998 to 3804 kg/ha in 2013, and average meat productivity per unit area increased by 550.6%, from 26.16 kg/ha in 1998 to 170.2 kg/ha in 2013 [43]. Fourth, the population structure and their dietary behavior changed. For instance, from 2003 to 2013, the number of farmers working as migrant workers in the big cities increased by 69.8%, from 180 000 to 305 700 persons, and nearly 80% of this population was between 35 and 45 years old. According to our surveys, the average age of the respondents who have remained in the villages was 51 years in 2013 (and nearly half were 51 to 70 years old). This older population had a lower intake of staple foods than in 1998, when their average age was about 45 years (and nearly half were 31 to 50 years old). These factors may offset the impact of increasing consumption of high-protein food on EF to a certain extent.
The quantity of eggs and vegetables consumed has also increased greatly, from 2.45 and 51.74 kg per person, respectively, in 1998 to 4.02 and 75.18 kg per person, respectively, in 2013, but the corresponding EF values decreased by 75 and 86%, respectively. In addition to the improved BC, this counterintuitive result may have two explanations. First, we used EF to account for the appropriation of land resources, but excluded the impacts on carbon, water, materials, nitrogen, and other resources, which were addressed by Galli et al. [12] and Galli [13]. Second, the EF of egg and vegetable production decreased greatly due to increased productivity per unit area. For example, individual households changed from raising 10 to 20 chickens to large chicken farms with up to 38 000 birds, and the number of large chicken farms increased from 5 in 1998 to 105 in 2013. As a result, the productivity increased from 6.9 kg/ha to 42.9 kg/ha. Greenhouse vegetable cultivation also increased to nearly 32 times its 1998 level (567 ha), reaching 18 000 ha in 2015, and the annual average yield increased by 804.6%, from 4715 kg/ha in 1998 to 42 652 kg/ha in 2013.
5. Implications of the Results for Decision Making and Land Management
Our results show that the ecological balance in Guyuan is an important issue because the local productive land resources cannot produce enough of the currently consumed products to meet current demand for consumption. This finding will improve the understanding of the local government about the severity of the problem created by pressure on the ecosystem so that they can adapt regional and sectoral development plans to mitigate this pressure.
Our analysis of the spatial variation of EF and BC among the counties indicated that the implementation of ecological restoration programs such as Grain for Green has enhanced BC, and particularly the BC of forest and grassland. This success suggests that the local government should consolidate the achievements of the ecological restoration program by continuing to pay attention to the management of forest and grassland ecosystems [22]. For example, based on the success of pilot projects under the Grain for Green program in Pengyang County (the only county in Guyuan with an ecological surplus), this program should be applied more aggressively in regions such as Longde and Xiji counties, which had the largest ecological deficits in the study area. However, because cultivated land continues to have an ecological deficit so high that it negates the surpluses for forest and is much larger than the relatively small deficit for grassland, more effort will need to be devoted to reducing that deficit. Possible solutions include expanding solutions such as water-conserving agricultural techniques (e.g., no-till planting, expanded use of gravel and plastic mulches), interplanting of crops (e.g., growing potatoes or legumes under fruit trees) to maximize the production from a given area of land, and using fertilizers and pesticides more efficiently.
Our results indicate that in Guyuan, EF based on food consumption decreased during the study period. However, this result excluded EF from carbon and wastes, so the actual EF was underestimated. Also, Guyuan continues to develop, and if income increases by the target of 11% by 2020, which is specified in the 13th Five-Year Development Plan of Guyuan, intake of animal-derived food will continue to grow, as it has done elsewhere in China [34]. If Guyuan’s per capita meat consumption increases to the national annual average of 64.10 kg in China [76], EF would also increase; this is likely to occur because income growth tends to increase the intake of animal-derived food, and the production of this food has a higher EF than production of plant-derived food [8]. However, in the long run, dietary EF may also decrease in response to increased productivity, changing consumption behavior, stabilization of diets once income reaches a certain level, and increased nutritional awareness. For example, in Chinese mega-cities such as Beijing and Shanghai, which have the two highest per capita annual incomes in China, people are reducing meat consumption and increasing their consumption of vegetables and dairy products in an effort to improve their diet. Understanding such trends will be useful for Guyuan’s decision makers, since this will let them examine the multiple factors that affect EF in an integrated way, thereby improving future management of the region’s natural resources.
6. Conclusions
Food consumption in Guyuan, an impoverished region in northwestern China, changed from initially meeting only the basic requirements for sustenance into a diversified structure, with decreasing consumption of staple foods and increasing consumption of vegetables, meat, eggs, milk, edible oils, fruit, and aquaculture products. The main reasons for these changes were socioeconomic development and an associated income increase, which enabled the farmers to shift to a more affluent consumption pattern, but awareness of the need for a balanced diet improved and the influence of an urban lifestyle that resulted from increased income earned as a migrant worker in nearby cities also changed consumption behavior, and the implementation of the Grain for Green program for ecosystem restoration changed both land use patterns and the pattern of food production and consumption in the study area.
The calculated EF for the four types of productive land (cultivated land, grassland, forest, and bodies of water) was based on the average local productivity, varied among the different food items. Decreased consumption of staple foods caused a decrease in their EF, but increased consumption of vegetables and eggs increased their EF. The large increase in meat consumption caused a large increase in the EF due to meat production, with smaller increases for the EF from consumption of milk, edible oils, and fruits. However, the overall average EF decreased from 1998 to 2013 in Guyuan.
Cultivated land is a major contributor to local EF and BC. From 1998 to 2013, local BC remained below EF, indicating a persistent ecological deficit, but the magnitude of this deficit decreased during the study period, partly because of implementation of the Grain for Green program. The Grain for Green program has greatly enhanced the BC of forest and grassland. However, the results also indicate that four of the five counties in the study area (e.g., Jingyuan, Yuanzhou, Xiji, and Longde), and some land uses (e.g., cultivated land and grassland), continue to have a high ecological deficit that must be addressed by regional planners.
Supplementary Materials
The following are available online at www.mdpi.com/2071-1050/9/8/1323/s1.
Acknowledgments
We are grateful for the reviewers’ constructive comments, and the financial support provided by the National Science Foundation of China (No. 41671517) and by the National Development and Research Program of China (No. 2016YFC0503701). Jie Hu and Chao Wang conducted part of the data analysis. We thank Geoffrey Hart of Montreal (Canada) for his assistance revising the English in the manuscript.
Author Contributions
Lin Zhen contributed to conception of the research, manuscript preparation (e.g., data analyses, literature review) and wrote the manuscript; Lin Zhen and Bingzhen Du together performed manuscript revision and approved the final version.
Conflicts of Interest
The authors declare no conflict of interest.
References
- Braat, L.C.; De Groot, R. The ecosystem services agenda: Bridging the worlds of natural science and economics, conservation and development, and public and private policy. Ecosyst. Serv. 2012, 1, 4–15. [Google Scholar] [CrossRef]
- De Groot, R.; Brander, L.; Van Der Ploeg, S.; Costanza, R.; Bernard, F.; Braat, L.; Christie, M.; Crossman, N.; Ghermandi, A.; Hein, L.; et al. Global estimates of the value of ecosystems and their services in monetary units. Ecosyst. Serv. 2012, 1, 50–61. [Google Scholar] [CrossRef]
- Maes, J.; Egoh, B.; Willemen, L.; Liquete, C.; Vihervaara, P.; Schägner, J.P.; Grizzetti, B.; Drakou, E.G.; La Notte, A.; Zulian, G.; et al. Mapping ecosystem services for policy support and decision making in the European Union. Ecosys. Serv. 2012, 1, 31–39. [Google Scholar] [CrossRef]
- MEA (Millennium Ecosystem Assessment). Ecosystems and Human Well-being: Current State and Trends; Island Press: Washington, DC, USA, 2005. [Google Scholar]
- Zhen, L.; Cao, S.Y.; Cheng, S.K.; Xie, G.D.; Wei, Y.J.; Liu, X.L.; Li, F. Arable land requirements based on food consumption patterns: case study in rural Guyuan District, Western China. Ecol. Econ. 2010, 69, 1443–1453. [Google Scholar] [CrossRef]
- Zhen, L.; Deng, X.Z.; Wei, Y.J.; Jiang, Q.N.; Lin, Y.Z.; Helming, K.; Wang, C.; König, H.J.; Hu, J. Future land use and food security scenarios for the Guyuan district of remote western China. IFOREST 2014, 7, 372–384. [Google Scholar] [CrossRef]
- Gerbens-Leenes, P.W.; Nonhebel, S. Consumption patterns and their effects on land required for food. Ecol. Econ. 2002, 42, 185–199. [Google Scholar] [CrossRef]
- Asıcı, A.; Acar, S. Does income growth relocate ecological footprint? Ecol. Indic. 2016, 61, 707–714. [Google Scholar] [CrossRef]
- DWR (Department of Water Resources). Report on Water Resources of Ningxia; Department of Water Resources: Yinchuan, China, 2015.
- SBNX (Statistic Bureau of Ningxia). Ningxia Statistical Yearbook 2014; Statistic Bureau of Ningxia: Yinchuan, China, 2015. (In Chinese)
- Bicknell, K.B.; Ball, R.J.; Cullen, R.; Bigsby, H.R. New methodology for the ecological footprint with an application to the New Zealand economy. Ecol. Econ. 1998, 27, 149–160. [Google Scholar] [CrossRef]
- Galli, A.; Kitzes, J.; Niccolucci, V.; Wackernagel, M.; Wada, Y.; Marchettini, N. Assessing the global environmental consequences of economic growth through the ecological footprint: a focus on China and India. Ecol. Indic. 2012, 17, 99–107. [Google Scholar] [CrossRef]
- Galli, A. On the rationale and policy usefulness of ecological footprint accounting: the case of Morocco. Environ. Sci. Policy 2015, 48, 210–224. [Google Scholar] [CrossRef]
- Bagliani, M.; Bravo, G.; Dalmazzone, S. A consumption-based approach to environmental Kuznets curves using the ecological footprint indicator. Ecol. Econ. 2008, 65, 650–661. [Google Scholar] [CrossRef]
- Mancini, M.S.; Galli, A.; Niccolucci, V.; Lin, D.; Bastianoni, S.; Wackernagel, M.; Marchettini, N. Ecological footprint: refining the carbon footprint calculation. Ecol. Indic. 2016, 61, 390–403. [Google Scholar] [CrossRef]
- Wackernagel, M. Comment on "ecological footprint policy? Land use as an environmental indicator". J. Ind. Ecol. 2014, 18, 20–23. [Google Scholar] [CrossRef]
- Ewing, B.; Moore, D.; Goldfinger, S.; Oursler, A.; Reed, A.; Wackernagel, M. The Ecological Footprint Atlas 2010; Global Footprint Network: Oakland, CA, USA, 2010. [Google Scholar]
- Ewing, B.; Reed, A.; Galli, A.; Kitzes, J.; Wackernagel, M. Calculation Methodology for the National Footprint Accounts, 2010 Edition; Global Footprint Network: Oakland, CA, USA, 2010. [Google Scholar]
- Kissinger, M.; Sussman, C.; Moore, J.; Rees, W.E. Accounting for the ecological footprint of materials in consumer goods at the urban scale. Sustainability 2013, 5, 1960–1973. [Google Scholar] [CrossRef]
- WWF. Living Planet Report2016—Risk and Resilience in a New Era; World Wide Fund for Nature: Gland, Switzerland, 2016. [Google Scholar]
- Borucke, M.; Moore, D.; Cranston, G.; Gracey, K.; Iha, K.; Larson, J.; Lazarus, E.; Morales, J.C.; Wackernagel, M.; Galli, A. Accounting for demand and supply of the biosphere's regenerative capacity: the National Footprint Accounts’ underlying methodology and framework. Ecol. Indic. 2013, 24, 518–533. [Google Scholar] [CrossRef]
- WWF. Living Planet Report—China 2015 Development, Species and Ecological Civilization; World Wide Fund for Nature: Morges, Switzerland, 2015. [Google Scholar]
- Baabou, W.; Grunewald, N.; Ouellet-Plamondon, C.; Gressot, M.; Galli, A. The ecological footprint of mediterranean cities: Awareness creation and policy implications. Environ. Sci. Policy 2017, 69, 94–104. [Google Scholar] [CrossRef]
- Chen, D.J.; Xu, Z.M.; Chen, G.D.; Zhang, Z.Q. Ecological footprint in Northwest China. J. Glaciol. Geocryol. 2001, 23, 164–169. (In Chinese) [Google Scholar]
- Zhang, Z.Q.; Xu, Z.M.; Chen, G.D.; Chen, D.J. The ecological footprints of the 12 provinces of West China in 1999. Acta Geogr. 2001, 56, 599–610. (In Chinese) [Google Scholar]
- Guo, X.R.; Yang, J.R.; Mao, X.Q. Calculation and analysis of urban ecological footprint: A case study of Guangzhou. Geogr. Res. 2003, 22, 654–662. (In Chinese) [Google Scholar]
- Xu, Z.M.; Zhang, Z.Q.; Chen, G.D.; Chen, D.J. Ecological footprint calculation and development capacity analysis of China in 1999. Chin. J. Appl. Ecol. 2003, 14, 280–285. (In Chinese) [Google Scholar]
- Scotti, M.; Bondavalli, C.; Bodini, A. Ecological footprint as a tool for local sustainability: The municipality of Piacenza (Italy) as a case study. EIA. Rev. 2009, 29, 39–50. [Google Scholar] [CrossRef]
- Goldstein, B.; Birkved, M.; Fernández, J.; Hauschild, M. Surveying the environmental footprint of urban food consumption. J. Ind. Ecol. 2016, 21, 151–165. [Google Scholar] [CrossRef]
- Monfreda, C.; Wackernagel, M.; Deumling, D. Establishing national natural capital accounts based on detailed ecological footprint and biological capacity assessments. Land Use Policy 2004, 21, 231–246. [Google Scholar] [CrossRef]
- Davis, K.F.; Gephart, J.A.; Emery, K.A.; Leach, A.M.; Galloway, J.N.; d’Odorico, P. Meeting future food demand with current agricultural resources. Glob. Environ. Chang. 2016, 39, 125–132. [Google Scholar] [CrossRef]
- Van den Bergh, J.C.J.M.; Grazi, F. Ecological footprint policy? Land use as an environmental indicator. J. Ind. Ecol. 2013, 18, 10–19. [Google Scholar]
- NDRC. The Thirteenth National Five-Year Plan of National Economy and Social Development in China; National Development and Reform Commission: Beijing, China, 2016.
- Song, G.; Li, M.; Semakula, H.M.; Zhang, S. Food consumption and waste and the embedded carbon, water and ecological footprints of households in China. Sci. Total Environ. 2015, 529, 191–197. [Google Scholar] [CrossRef] [PubMed]
- Song, G.; Li, M.; Fullana-i-Palmer, P.; Williamson, D.; Wang, Y. Dietary changes to mitigate climate change and benefit public health in China. Sci. Total Environ. 2017, 577, 289–298. [Google Scholar] [CrossRef] [PubMed]
- Hu, J.; Zhen, L.; Sun, C.Z.; Du, B.Z.; Wang, C. Ecological footprint of biological resources consumption in a typical area of the Green for Grain Project in Northwestern China. Environments 2015, 2, 44–60. [Google Scholar] [CrossRef]
- He, W.; Hu, H.X.; Shen, H.; Wang, Y.; Xu, F.L. Dynamic analysis of ecological footprint of biological resource: A case study of the “Two Circles” in Hubei Province. Chin. Popul. Resour. Environ. 2011, 21, 167–174. (In Chinese) [Google Scholar]
- Hu, H.X.; He, W.; Shen, H.; Wang, Y. Evaluation and prediction of sustainable development of the “Two Circles” in Hubei Province. Resour. Environ. Yangtze Basin 2010, 4, 351–359. (In Chinese) [Google Scholar]
- Weinzettel, J.; Hertwich, E.G.; Peters, G.P.; Steen-Olsen, S.; Galli, A. Affluence drives the global displacement of land use. Glob. Environ. Chang. 2013, 23, 433–438. [Google Scholar] [CrossRef]
- Andam, K.S.; Ferraro, P.J.; Pfaff, A.; Sanchez-Azofeifa, G.A.; Robalino, J. Measuring the effectiveness of protected area networks in reducing deforestation. Proc. Natl. Acad. Sci. USA 2008, 105, 16089–16094. [Google Scholar] [CrossRef] [PubMed]
- Arriagada, R.A.; Echeverria, C.M.; Moya, D.E. Creating protected areas on public lands: is there room for additional conservation? PLoS ONE 2016, 11, e0148094. [Google Scholar] [CrossRef] [PubMed]
- Arriagada, R.A.; Ferraro, P.J.; Sills, E.O.; Pattanayak, S.K.; Cordero-Sancho, S. Do payments for environmental services affect forest cover? A farm-level evaluation from Costa Rica. Land Econ. 2012, 88, 382–399. [Google Scholar] [CrossRef]
- SBGY (Statistic Bureau of Guyuan). Guyuan Household Socio-Economic Survey; Statistic Bureau of Guyuan Diaochadui: Ningxia, China, 2014. (In Chinese)
- Zhang, S.; Dong, Z.Q.; Wang, H.H.; Zou, F.C. Ecological footprint analysis of one county based on “city hectare” model. J. Anhui Agric. Sci. 2010, 38, 11867–11870. (In Chinese) [Google Scholar]
- Wackernagel, M.; Silverstein, J. Big things first: focusing on the scale imperative with the ecological footprint. Ecol. Econ. 2000, 32, 391–394. [Google Scholar]
- Haberl, H.; Erb, K.H.; Krausmann, F. How to calculate and interpret ecological footprints for long periods of time: the case of Austria 1926–1995. Ecol. Econ. 2001, 38, 25–45. [Google Scholar] [CrossRef]
- Jin, X.M.; Liu, Q.K. Evolution of ecological footprint models for natural resources accounting. J. Nat. Resour. 2017, 32, 163–176. (In Chinese) [Google Scholar]
- Kissinger, M. Approaches for calculating a nation’s food ecological footprint—The case of Canada. Ecol. Indic. 2013, 24, 366–374. [Google Scholar] [CrossRef]
- Zhang, H.Y.; Liu, W.D.; Lin, Y.X.; Shan, N.N.; Wang, S.Z. A modified ecological footprint analysis to a sub-national area: the case study of Zhejiang Province. Acta Ecol. 2009, 29, 2738–2748. (In Chinese) [Google Scholar]
- Liu, M.; Hu, Y.M.; Chang, Y.; Zhang, W.G.; Zhang, W. Modification of ecological footprint assessment based on emergy: a case study in the Upper Reaches of Minjiang River. J. Nat. Resour. 2008, 23, 447–457, (In Chinese with English summary). [Google Scholar]
- Venetoulis, J.; Talberth, J. Refining the ecological footprint. Environ. Dev. Sustain. 2008, 10, 441–469. [Google Scholar] [CrossRef]
- Wu, K.Y.; Wang, L.J. Accounting discrepancies of ecological footprint based on global hectare and national hectare. China Popul. Res. Environ. 2007, 17, 80–83. (In Chinese) [Google Scholar]
- Hashimoto, S.; Kawado, M.; Seko, R.; Kato, M.; Okabe, N. Bias of vaccination coverage in a household questionnaire survey in Japan. J. Epidemiol. 2005, 15, 15–19. [Google Scholar] [CrossRef] [PubMed]
- Jill, M.; Montaquila, J.; Michael, B.; Shelley, P. National Center for Education Statistics. Undercoverage Bias in Estimates of Characteristics of Households and Adults in the 1996 National Household Education Survey; Working Paper No. 97-39; U.S. Department of Education: Washington, DC, USA, 1997.
- Weber, K.E.; Tiwari, I.P. Research and Survey Format Design: An Introduction; Asian Institute of Technology: Bangkok, Thailand, 1992. [Google Scholar]
- Menger, K. On variables in mathematics and in natural science. Br. J. Philos. Sci. 1954, 18, 134–142. [Google Scholar] [CrossRef]
- Feng, X.T. Research Methods of Sociology; China Renmin University Press: Beijing, China, 2009. (In Chinese) [Google Scholar]
- Cooper, W.S.; Kaplan, R.H. Adaptive "coin-flipping": A decision-theoretic examination of natural selection for random individual variation. J. Theor. Biol. 1982, 94, 135–151. [Google Scholar] [CrossRef]
- Holden, S.T.; Lunduka, R.W. Input subsidies, cash constraints, and timing of input supply. Am. J. Agric. Econ. 2012, 96, 1–18. [Google Scholar] [CrossRef]
- McNair, W.E.; Lambert, D.M.; Eash, N.S. Conservation agriculture and household wellbeing: a non-causal comparison among smallholder farmers in Mozambique. J. Agric. Sci. 2016, 7, 1–18. [Google Scholar] [CrossRef]
- Zhen, L.; Ochirbat, B.; Lv, Y.; Wei, Y.J.; Liu, X.L.; Chen, J.Q.; Yao, E.Z.J.; Li, F. Comparing patterns of ecosystem service consumption and perceptions of range management between ethnic herders in Inner Mongolia and Mongolia. Environ. Res. Lett. 2010, 5, 15001–15011. [Google Scholar] [CrossRef]
- SBNX (Statistic Bureau of Ningxia). Ningxia Agricultural Statistics 1998-2000; Statistic Bureau of Ningxia: Yinchuan, China, 2001. (In Chinese)
- SBGY (Statistic Bureau of Guyuan). The Handbook of Economy in Guyuan in 2013; Statistic Bureau of Guyuan: Ningxia, China, 2014. (In Chinese)
- SBNX (Statistic Bureau of Ningxia). Ningxia Statistical Yearbook 2013; Statistic Bureau of Ningxia: Yinchuan, Ningxia, China, 2014.
- Chen, F. Agricultural Ecology; Meteorology Press: Beijing, China, 1998. (In Chinese) [Google Scholar]
- The Data Center for Resources and Environmental Sciences, the Institute of Geographic Sciences and Natural Resources Research, Beijing China. Available online: www.resdc.cn (accessed on 28 July 2017).
- Wang, C.; Maclaren, V. Evaluation of economic and social impacts of the sloping land conversion program: A case study in Dunhua County, China. For. Policy Econ. 2012, 14, 50–57. [Google Scholar] [CrossRef]
- Li, H.; Yao, S.; Yin, R.; Liu, G. Assessing the decadal impact of China’s sloping land conversion program on household income under enrollment and earning differentiation. For. Policy Econ. 2015, 61, 95–103. [Google Scholar] [CrossRef]
- Lin, Y.; Yao, S.B. Impact of the Sloping Land Conversion Program on rural household income: An integrated estimation. Land Use Policy 2014, 40, 56–63. [Google Scholar] [CrossRef]
- Li, Y.X.; Zhang, W.F.; Ma, L.; Wu, L.; Shen, J.B.; Davies, W.J.; Oenema, O.; Zhang, F.S.; Dou, Z.X. An analysis of China’s grain production: looking back and looking forward. Food Energy Secur. 2014, 3, 19–32. [Google Scholar] [CrossRef]
- Shock, C.C.; Pereira, A.B.; Eldredge, E.P. Irrigation best management practices for potato. In: Rosen, C., Thornton, M. (Eds.). Symposium on Best Management Practices for Nutrients and Irrigation: Research, Regulation, and Future Directions. Am. J. Potato Res. 2007, 84, 29–37. [Google Scholar] [CrossRef]
- Mao, Y.W.; Hopkins, D.L.; Zhang, Y.M.; Luo, X. Consumption patterns and consumer attitudes to beef and sheep meat in China. J. Food Nutr. Res. 2016, 4, 30–39. [Google Scholar]
- Lu, F.; Xu, J.H.; Wang, Z.Y.; Hu, X.F. Study on quantitative relationship between ecological footprint and economic growth and socioeconomic driving mechanism of ecological footprint: A case study in Xinjiang. Geogr. Geo-Inf. Sci. 2010, 26, 70–74. (In Chinese) [Google Scholar]
- Archer, E.; Hand, G.A.; Blair, S.N. Validity of U.S. Nutritional Surveillance: National Health and Nutrition Examination Survey Caloric Energy Intake Data, 1971–2010. PLoS ONE 2013, 8, e76632. [Google Scholar] [CrossRef]
- Galli, A.; Giampietro, M.; Goldfinger, S.; Lazarus, E.; Lind, D.; Saltelli, A.; Wackernagel, M.; Müller, F. Questioning the ecological footprint. Ecol. Indic. 2016, 69, 224–232. [Google Scholar] [CrossRef]
- CSYB. China Statistical Yearbook; National Bureau for Statistics: Beijing, China, 2015.
Figure 1.
The location of Guyuan in China, locations of the survey sites, and land-use map in 2013.
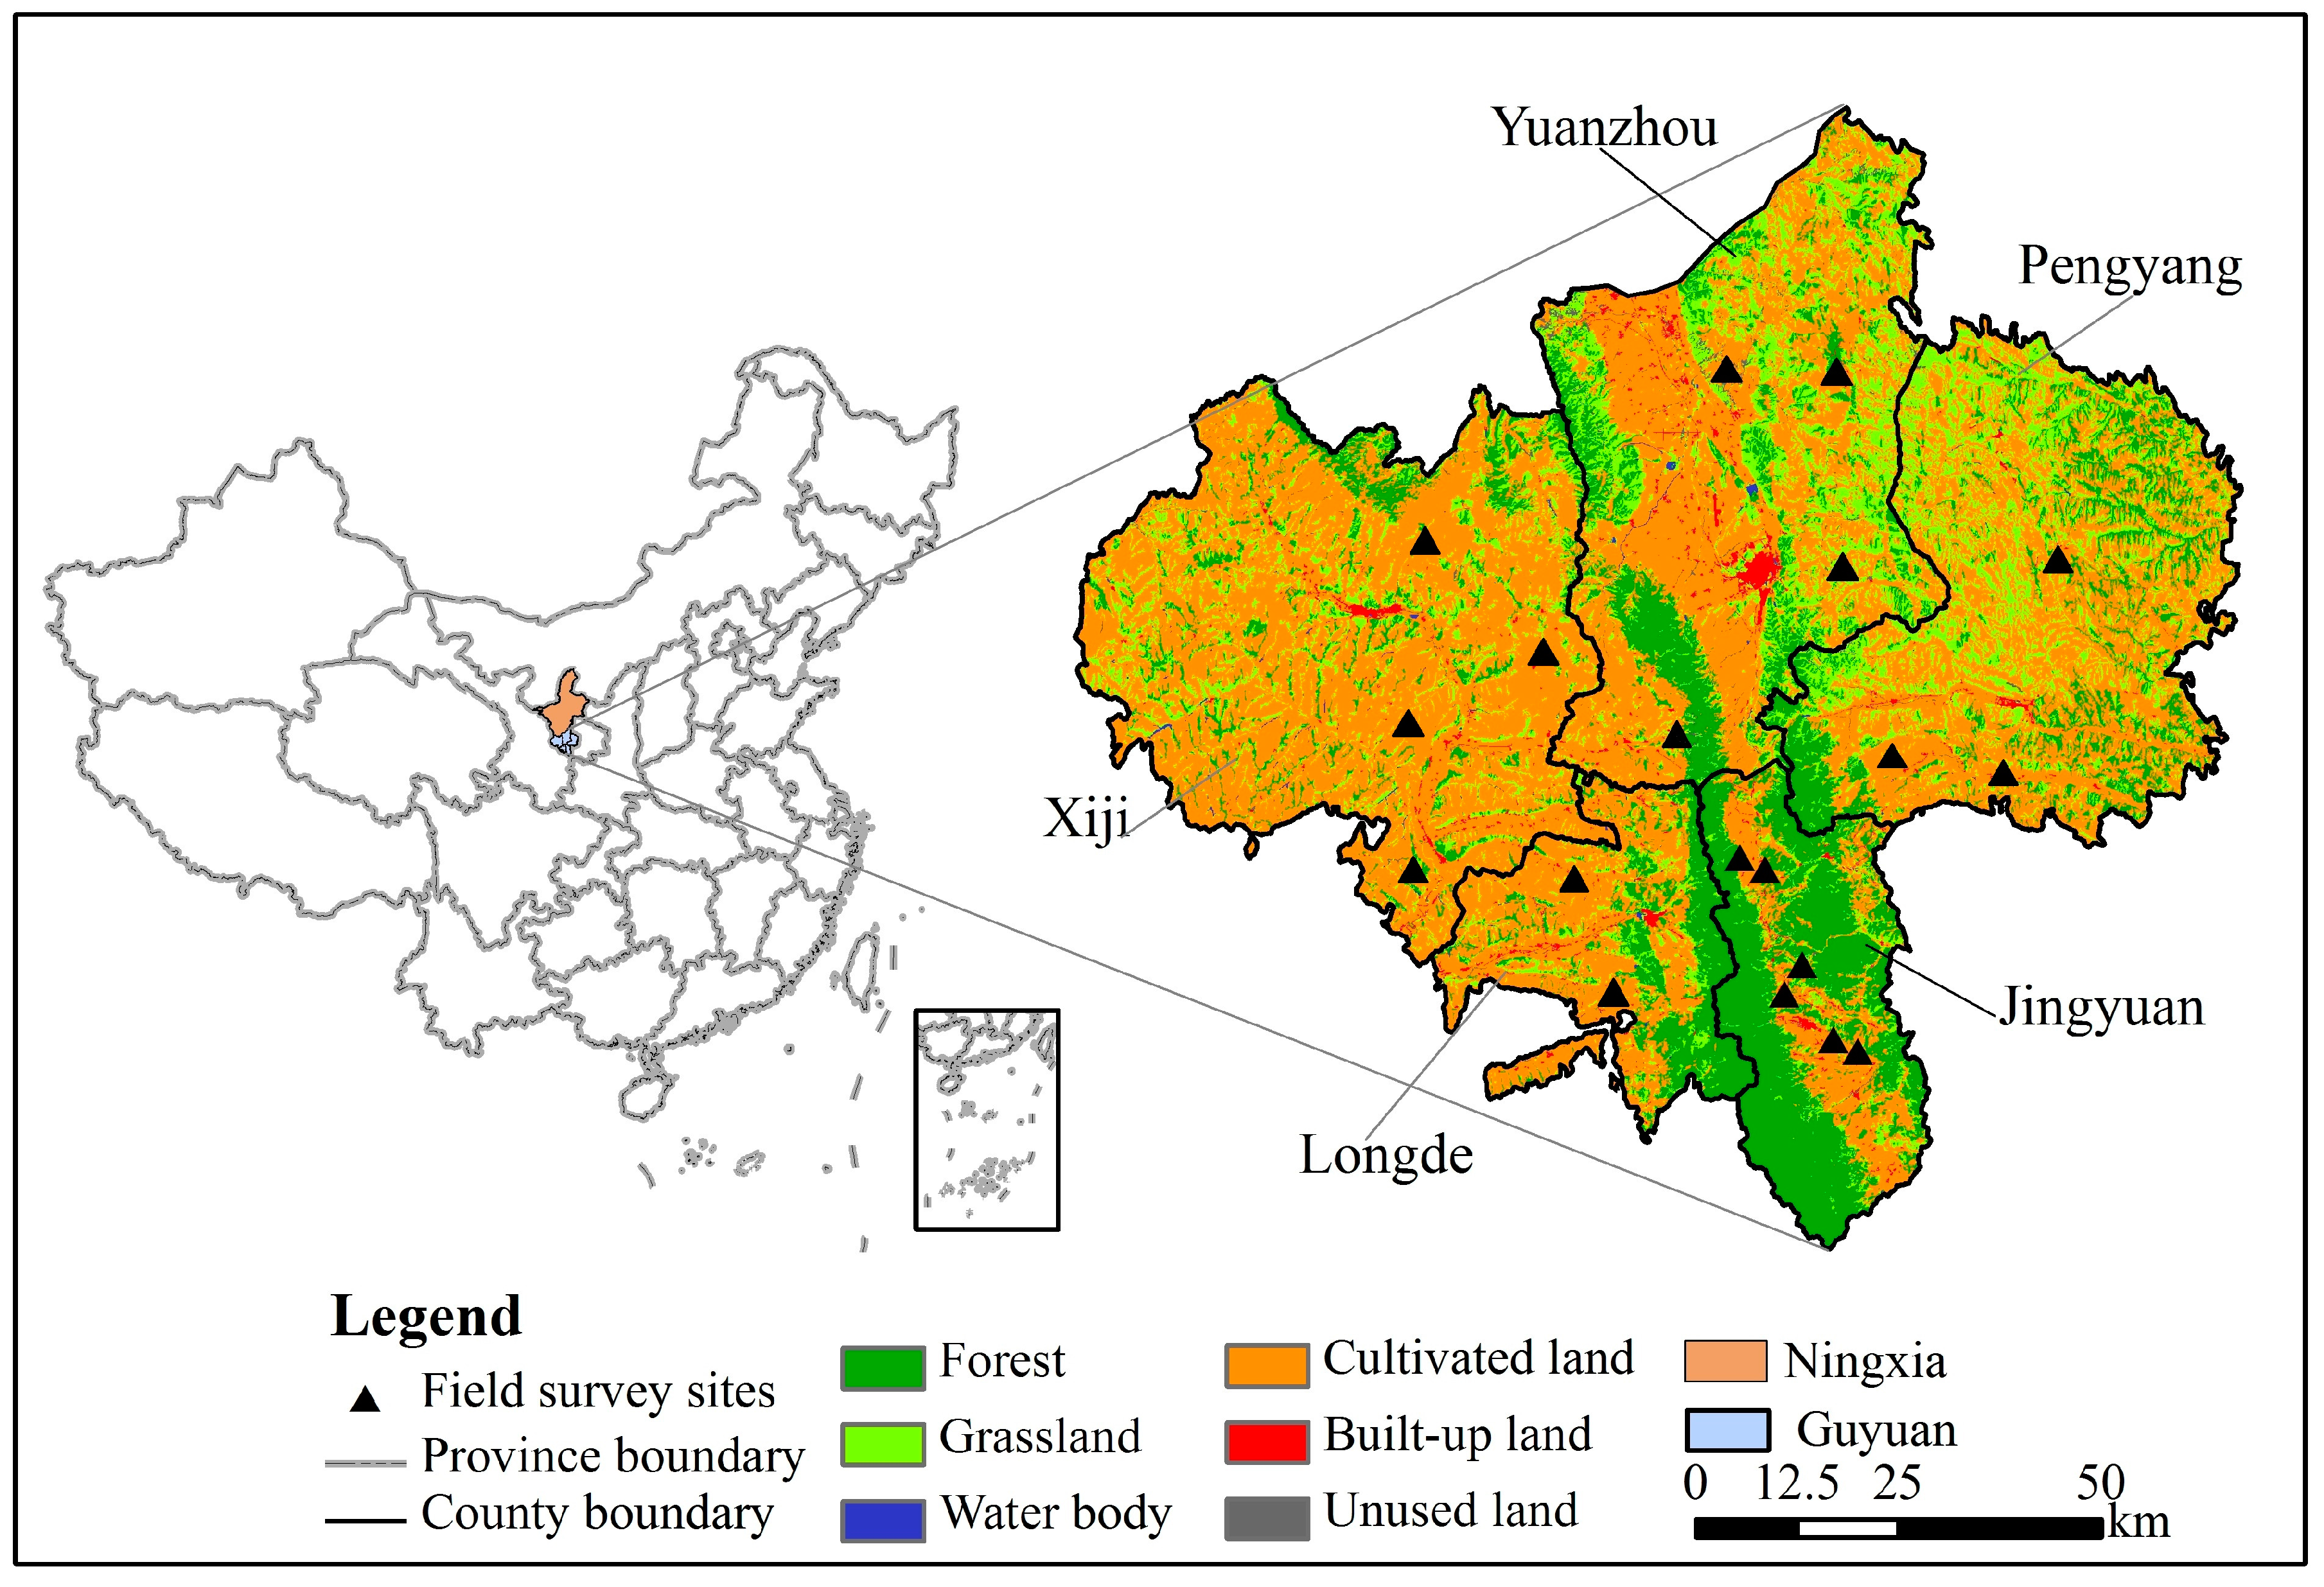
Figure 2.
Per capita ecological deficits (negative values) or surpluses (positive values) for the three main land use types based on food consumption patterns. The values for bodies of water (aquaculture products) are not shown because they would not be visible at this scale.
Figure 2.
Per capita ecological deficits (negative values) or surpluses (positive values) for the three main land use types based on food consumption patterns. The values for bodies of water (aquaculture products) are not shown because they would not be visible at this scale.


Table 1.
Background information about the respondents.
| Items | 1998 | 2013 |
|---|---|---|
| Average age | 45 | 51 |
| Educational attainment (years) | 8.01 | 8.51 |
| Per capita net income (CNY/year) | 980 | 4580 |
| Agriculture (%) | 76 | 44 |
| Off-farm (%) | 18 | 47 |
| Subsidies and other (%) | 6 | 9 |
Table 2.
Changes in the food consumption patterns and the associated per capita ecological footprint (EF) in Guyuan.
Table 2.
Changes in the food consumption patterns and the associated per capita ecological footprint (EF) in Guyuan.
| Food Items | 1998 | 2013 | Change | |||||
|---|---|---|---|---|---|---|---|---|
| Per Capita Quantity (kg) | Percentage of Total (%) | Per Capita EF (ha) | Per Capita Quantity (kg) | Percentage of Total (%) | Per Capita EF (ha) | Quantity (%) | EF (%) | |
| Staple foods | 456.44 ± 49.8 | 84.56 | 0.2222 | 182.53 ± 18.1 | 58.14 | 0.1291 | −60.01 | −41.90 |
| Cereals | 304.12 | (66.63) | 0.1561 | 175.58 | (96.19) | 0.1232 | −42.27 | −21.08 |
| Potatoes | 151.77 | (33.25) | 0.0655 | 5.30 | (2.90) | 0.0037 | −96.51 | −94.35 |
| Beans | 0.55 | (0.12) | 0.0006 | 1.65 | (0.90) | 0.0022 | 200.00 | 266.67 |
| Vegetables and melons | 51.74 ± 10.2 | 9.59 | 0.0207 | 75.18 ± 8.6 | 23.95 | 0.0028 | 45.30 | −86.47 |
| Meat, eggs, and milk | 10.81 | 2.00 | 0.6855 | 26.32 | 8.38 | 0.5998 | 143.47 | −12.50 |
| Meat | 8.26 ± 3.4 | (76.41) | 0.0095 | 19.12 ± 5.8 | (72.64) | 0.4037 | 131.48 | 4149.47 |
| Eggs | 2.45 ± 1.3 | (22.66) | 0.6682 | 4.02 ± 2.4 | (15.27) | 0.1614 | 64.08 | −75.85 |
| Milk | 0.10 ± 0.01 | (0.94) | 0.0078 | 3.18 ± 1.6 | (12.08) | 0.0347 | 3080.00 | 344.87 |
| Plant oils | 5.01 ± 2.3 | 0.93 | 0.0120 | 9.04 ± 2.8 | 2.88 | 0.0344 | 80.43 | 186.67 |
| Fruits | 15.64 ± 3.8 | 2.90 | 0.0018 | 20.28 ± 9.6 | 6.46 | 0.0049 | 29.67 | 172.22 |
| Aquaculture products | 0.15 ± 0.08 | 0.03 | 0.0001 | 0.60 ± 0.2 | 0.19 | 0.0001 | 300.00 | 0 |
| Total foods | 539.79 | 100 | 0.9423 | 313.95 | 100 | 0.7711 | −41.84 | −18.17 |
Table 3.
The per capita ecological footprint (EF) and biological capacity (BC) for food consumption in Guyuan in 1998 and 2013. Values in parentheses represent the proportion (%) of the total for a given parameter.
Table 3.
The per capita ecological footprint (EF) and biological capacity (BC) for food consumption in Guyuan in 1998 and 2013. Values in parentheses represent the proportion (%) of the total for a given parameter.
| Items | Year | Cultivated Land | Forest | Grassland | Water Body | Total |
|---|---|---|---|---|---|---|
| Per capita land area for producing the consumed food items (ha) | 1998 | 0.4884 | 0.0033 | 0.5773 | 0.0003 | 1.1687 |
| 2013 | 0.4240 | 0.0060 | 0.3349 | 0.0006 | 0.7655 | |
| Equivalence factor a | 1998 | 1.89 | 0.56 | 0.03 | 0.32 | |
| 2013 | 1.72 | 0.82 | 0.11 | 0.16 | ||
| EF (ha) | 1998 | 0.9231 (97.96) | 0.0018 (0.19) | 0.0173 (1.84) | 0.0001 (0.01) | 0.9423 (100) |
| 2013 | 0.7293 (94.58) | 0.0049 (0.64) | 0.0368 (4.77) | 0.0001 (0.01) | 0.7711 (100) | |
| Per capita area of biologically productive land (ha) | 1998 | 0.3420 | 0.0892 | 0.2714 | 0.0002 | 0.7028 |
| 2013 | 0.2854 | 0.2500 | 0.1779 | 0.0004 | 0.7137 | |
| Equivalence factor a | 1998 | 1.89 | 0.56 | 0.03 | 0.32 | |
| 2013 | 1.72 | 0.82 | 0.11 | 0.16 | ||
| Yield factor b | 1998 | 1 | 1 | 1 | 1 | |
| 2013 | 1 | 1 | 1 | 1 | ||
| BC c (ha) | 1998 | 0.5598 (91.75) | 0.0432 (7.08) | 0.0070 (1.15) | 0.0001 (0.02) | 0.6101 |
| 2013 | 0.4251 (68.60) | 0.1775 (28.64) | 0.0170 (2.74) | 0.0001 (0.02) | 0.6197 | |
| Per capita ecological deficit (=BC–EF; ha) | 1998 | −0.3633 | −0.0142 | −0.0103 | 0.0000 | −0.3878 |
| 2013 | −0.3042 | 0.1726 | −0.0198 | 0.0000 | −0.1514 | |
| Total ecological deficit (ha) | 1998 | −689,153.2 | +78,532.736 | −19538.34 | 0.00 | −630,158.8 |
| 2013 | −378,454.3 | +214,731.14 | −24,633.12 | 0.00 | −188,356.3 |
Notes: a Supplemental Tables S1–S14 provide the data used for the calculation; b Based on the average productivity of Guyuan, the equivalence factor was calculated and the yield factor was 1; c A total of 13.4% of the ecological capacity was reserved for biodiversity protection [51].
Table 4.
Variations of per capita ecological footprint (EF) and per capita biological capacity (BC) among the counties in Guyuan in 2013.
Table 4.
Variations of per capita ecological footprint (EF) and per capita biological capacity (BC) among the counties in Guyuan in 2013.
| Items | Pengyang | Jingyuan | Yuanzhou | Xiji | Longde |
|---|---|---|---|---|---|
| Per capita EF (ha) | 0.7997 | 0.4876 | 0.7823 | 0.8183 | 0.6847 |
| Per capita BC (ha) | 1.1623 | 0.4456 | 0.6739 | 0.6507 | 0.3552 |
| Per capita ecological deficit (BC–EF; ha) | 0.3626 | −0.0420 | −0.1084 | −0.1676 | −0.3295 |
| Ecological pressure (EF/BC) | 0.69 | 1.09 | 1.16 | 1.26 | 1.93 |
Note: We have calculated the productivity, equivalence factors, and yield factors for land in Guyuan and each of the five counties in 2013. Supplemental Tables S1–S14 provide the supporting data.
Table 5.
Food consumption in the five counties of Guyuan in 2013.
| Food Items (kg) | Yuanzhou | Pengyang | Jingyuan | Xiji | Longde |
|---|---|---|---|---|---|
| Staple foods | 180.77 | 173.02 | 135.62 | 204.36 | 163.77 |
| Cereals | 176.05 | 167.39 | 127.88 | 195.83 | 158.40 |
| Potatoes | 2.04 | 4.23 | 7.54 | 8.05 | 3.81 |
| Beans | 2.68 | 1.40 | 0.20 | 0.48 | 1.56 |
| Vegetables | 79.29 | 104.25 | 76.93 | 61.08 | 148.45 |
| Meat and eggs | 28.25 | 25.82 | 14.41 | 29.08 | 22.01 |
| Meat | 20.85 | 20.14 | 6.67 | 21.83 | 13.51 |
| Eggs | 3.37 | 5.48 | 3.94 | 3.89 | 4.06 |
| Milk | 4.03 | 0.20 | 3.80 | 3.36 | 4.44 |
| Oil | 11.03 | 8.22 | 8.7 | 7.09 | 8.71 |
| Fruits | 18.08 | 24.31 | 9.9 | 25.18 | 17.03 |
| Aquaculture | 0.81 | 0.43 | 0.32 | 0.65 | 0.64 |
Data source: household survey.
© 2017 by the authors. Licensee MDPI, Basel, Switzerland. This article is an open access article distributed under the terms and conditions of the Creative Commons Attribution (CC BY) license (http://creativecommons.org/licenses/by/4.0/).
Share and Cite
MDPI and ACS Style
Zhen, L.; Du, B. Ecological Footprint Analysis Based on Changing Food Consumption in a Poorly Developed Area of China. Sustainability 2017, 9, 1323. https://doi.org/10.3390/su9081323
AMA Style
Zhen L, Du B. Ecological Footprint Analysis Based on Changing Food Consumption in a Poorly Developed Area of China. Sustainability. 2017; 9(8):1323. https://doi.org/10.3390/su9081323
Chicago/Turabian StyleZhen, Lin, and Bingzhen Du. 2017. "Ecological Footprint Analysis Based on Changing Food Consumption in a Poorly Developed Area of China" Sustainability 9, no. 8: 1323. https://doi.org/10.3390/su9081323
Note that from the first issue of 2016, this journal uses article numbers instead of page numbers. See further details here.