The Influence of Green External Integration on Firm Performance: Does Firm Size Matter?


1
Institute of Management Science and Engineering, Henan University, Kaifeng 475001, China
2
School of Management, Xi’an Jiaotong University, Xi’an 710049, China
3
School of Economics and Management, Harbin Institute of Technology at Weihai, Weihai 264209, China
4
School of Management, Northwestern Polytechnical University, Xi’an 710072, China
*
Author to whom correspondence should be addressed.
Sustainability 2017, 9(8), 1328; https://doi.org/10.3390/su9081328
Submission received: 15 July 2017
/
Revised: 15 July 2017
/
Accepted: 27 July 2017
/
Published: 1 August 2017
(This article belongs to the Section Economic and Business Aspects of Sustainability)
Abstract
:Although the importance of green external integration has been widely recognized, our understanding of how firm size influences its link with firm performance is still limited. This study develops a conceptual framework in which firm size is proposed to moderate the relationships between green external integration, the time-to-market of environmentally friendly products and firm performance. We examine this model using data collected from 176 Chinese manufacturing companies. The results reveal that firm size moderates the relationship between green customer integration and business performance, the relationship between green supplier integration and operational performance, and the relationship between the time-to-market of environmentally friendly products and business performance. In addition, green customer and supplier integration improve both operational and business performance entirely by decreasing the time-to-market of environmentally friendly products for large firms, while green customer integration enhances operational performance entirely by shortening the time-to-market of environmentally friendly products for small and medium firms. These findings have important implications for research and practice in the fields of green supply chain integration and green innovation.
1. Introduction
To deal with environmental challenges and respond to customer demands in a timely manner, there has been a need for firms to create value jointly with their supply chain partners [1,2]. Previous literature has emphasized the important roles of green customer and supplier integration in providing resources and knowledge [3,4]. Thus, green external customer and supplier integration provides opportunities for firms to accelerate the pace of the introduction of environmentally friendly products [5,6], secure complementary resources and information [7], and improve performance and competitive advantages [8,9].
Despite the fact that its importance has been widely recognized, green external integration has only a recently become an entry on the agenda of researchers. In addition, findings about the relationship between green external integration and firm performance from previous studies are inconsistent. While some studies provided empirical evidence for the positive impact of green external integration on performance [10,11,12], others reported an insignificant or negative link between green external integration and performance [13]. We attribute the inconsistency in the findings concerning the relationship between green external integration and firm performance to the ignoring of context factors such as firm characteristics. To better understand the relationship between green external integration and firm performance, it is necessary to investigate whether green external integration is always effective under different conditions.
We conducted this study from the perspective of the organizational capability (OC). The OC perspective is similar to the resource-based view of the firm, which demonstrates how capabilities and resources enhance competitive advantages [1]. Firms with different sizes may differ in their levels of capability for the internalization and transfer of the knowledge gained from customers and suppliers due to their varying absorptive capacity, which measures the ability to identify, evaluate, assimilate and exploit external information and knowledge [1]. It has also been argued that larger firms have more flexibility to devote resources to green external integration activities than small firms [14]. Thus, firms with different sizes may have different green external integration efforts and capabilities and achieve different levels of performance. Moreover, many of the widely advocated green external integration practices are based on their successful adoption by relatively large firms [9]. The applicability and feasibility of such practices for small firms is still unknown; for example, small firms may lack the resources and capabilities to implement and profit from green supplier and customer integration [15]. This study explores how firm size, which is a proxy for absorptive capability and resources, influences the relationships between two dimensions of green external integration and two types of firm performance. Thus, our research question is: How does firm size influence the link between green external integration and firm performance?
Considering high-velocity environments, the time-to-market of products has emerged in recent years as an important competitive capability for achieving superior performance [16,17]. By integrating resources and information possessed by customers and suppliers, manufacturers can enhance the external innovation search capability and gain complementary resources and information, thereby reducing the time-to-market of environmentally friendly products [18]. Therefore, the time-to-market of environmentally friendly products may be an intermediate outcome of effective green external integration, which ultimately leads to improved performance. In this study, we investigate the moderating roles of firm size on the relationships between green external integration, the time-to-market of environmentally friendly products and firm performance.
The rest of this study is structured as follows. We first develop research hypotheses in Section 2. Subsequently, we discuss how survey data were collected and analyzed in Section 3. Section 4 demonstrates the analysis results, and discussion and managerial implications are shown in Section 5. Finally, we highlight the research contributions and offer opportunities for future research directions in Section 6.
2. Theory Framework and Hypotheses Development
By implementing green customer and supplier integration, supply chain partners can work to solve environmental problems jointly [19,20,21]. They can combine external resources and internal resource endowments to generate benefits [1,9,22]. Thus, green external integration is likely to decrease the time-to-market of environmentally friendly products and enhance firm performance. From the perspective of OC, the relationships among green external integration, the time-to-market of environmentally friendly products and firm performance might also be moderated by firm size. As presented in Figure 1, we have captured these relationships in an integrated framework.
Green external integration refers to the degree of environmental collaboration, information sharing and communal environmental problem-solving between manufacturers and their external partners [21,23]. There are mainly two types of green external integration: green customer integration and green supplier integration.
Although green external integration is considered to be performance-enhancing, it is questionable whether firms with different sizes can share equal benefits from green integration [1,9,20]. As indicated by OC, large and medium firms will be more capable of integrating leading customers into their environmental activities, because customers are more willing to do business with large firms [24,25]. On the other hand, small firms may be unable to convince leading customers to involve themselves in their environmental activities due to their low brand awareness [26,27]. Therefore, the options for small firms are admittedly limited when making green customer integration decisions. Furthermore, large firms are generally in better positions to monitor their dynamic environment and determine which customers are more or less suitable to be integrated [26,28].
Small and large firms also differ in their capabilities for the management green customer integration [1]. These capabilities include general routines that enhance inter-functional coordination, as well as firm-specific processes that aid in facilitating communication [4,17]. It is easier for large firms to internalize and transfer what they have learnt from customers [24,25], while small firms may lack the resources, skills and capabilities that facilitate the effective transmission of green information and knowledge gained from green customer integration [29,30]. Moreover, small firms are less likely to hire experienced specialists who directly manage environmental issues and green customer integration activities, and are less likely to invest in and develop skills in managing inter-organizational partnerships [27]. Given the associated challenges of managing green customer integration listed above, the lack of managerial and administrative skills and supporting resources of small firms suggests that they benefit less from green customer integration than large firms [1,26].
The risks, costs and opportunistic behaviors associated with green customer integration cannot be ignored [31]. The techniques which reduce the likelihood of collaboration risks and the opportunistic behaviors from their occurrence often require significant human and financial resources [32]. Small firms have a comparatively greater difficulty bearing these risks and costs in comparison to large firms. In addition, the history of green customer integration may be longer-lasting for large firms. Supply chain partners with a prior history of business relationships tend to develop a mutual trust and understanding, which can avoid opportunistic behaviors [33]. Thus, we propose:
Hypothesis 1.
The effects of green customer integration on (a) the time-to-market of environmentally friendly products, (b) operational performance and (c) business performance are moderated by firm size.
From an organizational perspective, the abilities for the identification and selection of suitable suppliers may also be affected by firm size. Large firms may hold more power over suppliers, and thus they can attract first class suppliers. Small firms may only account for a slight portion of a supplier’s volume, and hence their ability to integrate suppliers into environmental activities could be curtailed [14]. As a result, given that small firms have no, or at least more limited, options, they are more likely to integrate less capable suppliers in comparison to large firms. If small firms integrate less capable suppliers, they will be disadvantaged in their ability to achieve superior performance.
It is green information, knowledge and resources from suppliers which can contribute to performance improvement [34]. However, green supplier integration only provides the potential to access green information, knowledge and resources; it does not necessarily ensure the realization of performance improvement. To achieve the potential profits, firms should have the ability to evaluate, assimilate and exploit information and knowledge. Large firms can devote more resources to green supplier integration activities and make the best use of the information and knowledge available from suppliers [1].
The prior green supplier integration history of large firms signals trust and commitment to the relationship. Mutual trust and commitment are important in reducing risks and the opportunistic behaviors related to green supplier integration [19]. For small firms, conflicts between manufacturers and suppliers may exist in the early stage of green supplier integration, influencing the performance outcomes of green supplier integration. Thus, we propose:
Hypothesis 2.
The effects of green supplier integration on (a) the time-to-market of environmentally friendly products, (b) operational performance and (c) business performance are moderated by firm size.
Some supply chain management studies have suggested the use of both operational and business performance as indicators of firm performance [1,19,35]. This study uses two types of firm performance: operational performance and business performance. Operation performance refers to a firm’s performance in meeting its customer demands; business performance is defined as a firm’s profitability and market growth. While operational performance focuses on the operational aspects of firms, business performance evaluates the overall firm performance [35]. Suggested by the OC perspective, small firms often lack the experience and skill to manage the development of environmentally friendly products. For some small firms, shortening the time-to-market of environmentally friendly products often means blindly pursuing drastic cuts in development activities, which typically undermine performance [36,37]. Large firms usually decrease the time-to-market of environmentally friendly products by simplifying or speeding up operations, eliminating delays, or facilitating parallel processing of steps rather than skipping critical steps entirely [36,38].
The profits of the time-to-market of environmentally friendly products may be contingent on the capabilities of suppliers [37]. Only suppliers can delivery parts or components with a good quality at the right time and in the right place, meaning that manufacturers can translate this time advantage into operational and business performance improvement. As mentioned above, small firms are more likely to select less capable suppliers in comparison to large firms. Therefore, it is difficult for small firms to improve performance through shortening the time-to-market of environmentally friendly products, since small firms often cut important development activities to speed environmentally friendly products to market [36,37]. Therefore, we hypothesize:
Hypothesis 3.
The effects of the time-to-market of environmentally friendly products on (a) operational performance and (b) business performance are moderated by firm size.
3. Materials and Methods
3.1. Methodological Approach
3.1.1. Sampling and Data Collection
We tested the proposed hypotheses using data collected from Chinese manufacturing companies. The dynamic business environment, the increasingly serious environmental issues and the increasing individual requirements in China provide a fertile ground to understand the relationship between green external integration and firm performance. Since China is a large country and the degrees of industrial development and market formation are uneven across regions, we collected data mainly from four provinces to provide economic and geographic diversity [39]. Guangdong represents the Pearl River Delta, which is located in southern China. Shandong represents the Bohai region and reflects an average degree of industrial development and market economy. Shaanxi, located in the northwest, is a traditional industrial province and represents a relatively early stage of industrial reform. Henan is a traditional agricultural province in central China and represents a relatively low stage of industrial reform and marketization. They are representative of Chinese industrial development with the varying levels of their market economies.
We strategically obtained the sampled firms based on recommendations from local universities and the government to ensure accuracy and reliability. These firms cover a broad range of industries, including food and beverage, textile, chemical and related products, pharmaceutical and medical, rubber and plastics, non-metallic mineral products, smelting and pressing, metal products, machinery, transport equipment, electrical machinery and equipment, communication and computers related equipment, and instruments and related products. An important issue confronted in this study dealt with the collection of reliable data concerning green external integration. Many studies used a single informant in studying relationship issues between different organizations [19], while some researchers have demonstrated the benefits of using multiple informants [40]. After visiting ten firms during the pilot test of the questionnaire, we found that an appropriate method was to identify a key informant who is knowledgeable in green supply chain management [41]. The target informants were CEOs, presidents, vice presidents, or managers in the manufacturing companies.
The identified informants were first contacted by telephone to introduce the purpose of our study and to encourage their participation. We sent a questionnaire along with a personal cover letter to those who consented. Self-addressed and stamped envelopes were also sent together with the questionnaire, to facilitate the returning of the completed questionnaires. Anonymity was guaranteed for all respondents. To increase the response rate, follow-up calls were conducted at two-week intervals to remind and encourage them to complete the questionnaires.
Out of 400 companies, a total of 216 survey questionnaires were received, but 40 of these were deleted because of excessive missing data. The data used in the subsequent analyses contains 176 usable questionnaires. The response rate of 44.0% is considered satisfactory. Among the 176 questionnaires, 56 are from Guangdong (31.8%), 63 are from Shandong (35.8%), 24 are from Shaanxi (13.6%), and 13 are from Henan (7.4%). The characteristics of the respondents are presented in Table 1. A check of normality indicated the data to be approximately normally distributed.
3.1.2. Non-Response Bias and Common Method Bias
To examine non-response bias, we compared the differences in the means of the number of employees, annual sales, total assets, and the scale items of green customer integration, green supplier integration, operational performance and business performance between the early and late responses. No significant differences were found in the t-tests, which suggests that the non-response bias does not appear to be a serious concern in this study. An analysis of Harman’s one-factor test of common method bias [42] revealed five factors with eigenvalues above or near 1.0, indicating 75.6% total variance. The first factor captured 39.4% of the variance, which is not the majority of the total variance. As a second test of the common method bias, a measurement model including only the traits and one including a method factor in addition to the traits were tested [1,43]. The results of the method factor model marginally improved the model fit indices (non-normed fit index (NNFI) by 0.00 and comparative fit index (CFI) 0.01), with the common method factor accounting for 5.7% of the total variance. In addition, the factor loadings are still significant, in spite of the inclusion of a method factor, suggesting that the model was robust [44]. This provides a further indication that the common method bias was not a problem. Furthermore, we tried to control the influence of common method bias by separating the items of the constructs used in this study and improving the understandability of scale items [42,45]. Thus, it is reasonable to conclude that the effect of common method bias is rather negligible in this study.
3.2. Questionnaire Design and Measures
In this study, we conceptualized green external integration as having two dimensions: green customer integration and green supplier integration. We used two major dyadic relationships (manufacturer–key customer and manufacturer–key supplier) to represent the relational horizon of the manufacturer in the supply chain [39]. There are three major reasons for employing this approach. Firstly, green integration across supply chains is very complicated. To concretely measure green external integration, supply chains are simplified as supplier–manufacturer–customer chains and measure the two dyads from the perspective of the manufacturer. Since the manufacturer may have a different power over the customer and the supplier, the degrees of green customer integration and green supplier integration may be different. Therefore, we need to measure green customer integration and green supplier integration respectively. Secondly, since the content of green customer integration is different from that of green supplier integration, we need to develop separate measures for green customer and supplier integration. Thirdly, in order to examine the different impacts of green customer integration and green supplier integration on the time-to-market of environmentally friendly products and firm performance, we need to capture the content, degree of green customer and supplier integration respectively. As such, green customer integration and green supplier integration represent the overall level of green external integration in the simplified supply chain.
Since a manufacturer may have many suppliers and customers, and the level of green integration might be distinct for different customers and suppliers, the questions concerning green external integration required a response in reference to its key customer and supplier [39]. The key customer is defined as the customer who buys the highest dollar value products from the respondent. Similarly, the key supplier refers to the supplier who supplies the respondent the highest dollar value of supplies. The reasons for limiting measures to the key customer and supplier in investigating green external integration are as follows. Firstly, the key customer and supplier are the most important supply chain partners for the respondent, and as such can be expected to have the highest degree of involvement. Secondly, the single informant is more familiar with the key customer and supplier, and is more likely to provide accurate information on green external integration related to that customer or supplier. In addition, a focus on the dyadic relationship between a key customer and a key supplier has commonly been used in supply chain relationship management studies such as Ref. [39,46,47].
We reviewed the literature extensively to identify valid measures for related constructs. When there were no reliable and valid existing scales, we developed new scales, based on our understanding of the constructs and our observations during company visits and interviews [14]. Green customer and supplier integration are measured by five and four items, respectively. The five items of green customer integration were developed on the basis of work by Wu [9]. The four items of green supplier integration were also adapted from Ref. [9]. The four scales for the time-to-market of environmentally friendly products were adapted from Ref. [48]. The scale of operational performance and business performance, measured by four and five items, respectively, was largely derived from Ref. [44]. In this study, reversed measures were used for the time-to-market of environmentally friendly products. The items for each construct are used as reflective indicators. Respondents were asked to rate the degree to which the survey questions are a current concern in their firms, as compared to the industry average, using a seven-point Likert scale with “1” for “strongly disagree” and “7” for “strongly agree”. The advantage of comparing this with the industry average lies in the mitigation of industry effects in some degree [39,41]. The construct measurement items are listed in Appendix A.
As the scales were adapted from the English literature, the initial questionnaire was developed in English, and then translated into Chinese by three doctoral business students well versed in both languages and with research experience in China. To avoid cultural bias and to ensure validity, the Chinese version was then translated back into English by another three students, and the back-translated English version was checked against the original English version for discrepancies. In the survey, we used the Chinese version of the questionnaire.
We first submitted the questionnaire to three academicians and eight manufacturing managers for their review. Subsequently, we pre-tested it in a sample of ten randomly selected companies, which we visited to conduct face-to-face interviews with executives. Based on the feedback, we revised and refined the questionnaire to ensure it was understandable and relevant to practices in China.
3.3. Reliability and Validity
A rigorous process was conducted to validate the measurement items, as the scales had been developed in a very different national culture [41,49]. Exploratory factor analysis was employed to ensure the uni-dimensionality of the scales. Five factors with eigenvalues above or near 1.0 emerged, explaining 75.6% of the total variance. All items have strong loadings on their supposed construct and lower loadings on the constructs they were not intended to measure, demonstrating construct uni-dimensionality. The scales were all reliable, with alpha values ranging from 0.781 to 0.918 and composite reliability ranging from 0.796 to 0.920 (see Table 2). Content validity was established through an extensive literature review, feedback from executives and an iterative construct review by researchers.
Next, the convergent validity and discriminant validity were evaluated using confirmatory factor analysis (CFA) [50]. In the model, each measurement item is linked to its corresponding construct and the covariances among the constructs are freely estimated. The model fit indices were χ2 (142) = 300.14, root mean square error of approximation (RMSEA) = 0.077, non-normed fit index (NNFI) = 0.96, comparative fit index (CFI) = 0.96 and standard root mean square residual (SRMR) = 0.057. Thus, the CFA model was acceptable [51], demonstrating convergent validity. Moreover, all the factor loadings were greater than 0.60 (see Table 2), the t-values were all greater than 2.0, and each item’s coefficient was greater than twice its standard error, further indicating convergent validity. The estimates for the average variance extracted (AVE) ranged from 0.568 to 0.698, which were above the threshold of 0.50 suggested by [52]. Therefore, the constructs in this study have convergent validity.
To test discriminant validity, a constrained CFA model was built for each possible pair of latent constructs, in which the correlations between the paired constructs were fixed to 1.0. This was compared to the original unconstrained model, in which the correlations among constructs were freely estimated. A significant difference of the χ2 demonstrated discriminant validity [50,52]. As is indicated in Table 3, all the χ2 differences between the fixed and unconstrained model were significant at the level of 0.01, which indicates a good discriminant validity. Furthermore, the square root of AVE for each construct was greater than the correlation between that construct and the other constructs (see Table 4), providing further evidence of discriminant validity.
4. Results
Before testing the hypotheses, sample firms were classified into different groups according to their sizes. We formed small, medium and large groups based on the number of employees. Firms with less than 300, between 300 and 2000, and greater than 2000 employees are respectively classified as small (n = 57), medium (n = 58), and large (n = 61) firms. The standard of classification is consistent with the National Bureau of Statistics of China and the SME (small and medium enterprises) promotion law of China [53]. To test the moderating effect of firm size, a multi-group analysis of structural invariance across firm sizes was employed [1,14,54].
A baseline model for the three groups was first developed (Model 1). No equality constraints are specified across the three groups. This is followed by the imposition of equality constraints on both the factor loadings of the dependent and independent variables (Model 2). This test determines whether factor loadings are the same across groups. A χ2 difference between Models 2 and 1 can indicate whether the factor loadings are invariant across the three groups. To further test for the invariance of the model, additional constraints of equality are also placed on the error terms of the measurement (Model 3). A non-significant χ2 difference between Models 3 and 2 would indicate an invariance in the error terms between the three groups examined. Structural coefficient equality constraints can be imposed to establish Model 4. If no significant χ2 difference is found between Models 4 and 3, then there is evidence that the structural coefficients do not differ across the groups examined. If, however, there is a significant χ2 difference, then a search to identify which particular coefficients differ should logically take place (Model 5a, 5b, 5c, 5d, 5e, 5f, 5g and 5h).
The χ2 of the base line model with 460 degrees of freedom was compared against the χ2 of a model that specified equal factor loadings (Model 2) with 488 degrees of freedom. The difference of 28.18 in χ2 for 28 degrees of freedom is not statically significant (p = 0.455). The factor loadings appear to be invariant across the small, medium and large groups. Next, we compared the χ2 between Model 3 and Model 2. The χ2 difference between Model 3 and Model 2 is 40.41 with 19 degrees of freedom. The significant result (p = 0.003) indicates that the measurement errors are not equivalent across the three groups. Similarly, the difference in χ2 is 27.25 with 16 degrees of freedom. The difference is statistically significant (p = 0.039) and thus differences in structural coefficients are detected. Subsequently, a search procedure was performed to identify the different structural coefficients for the three groups.
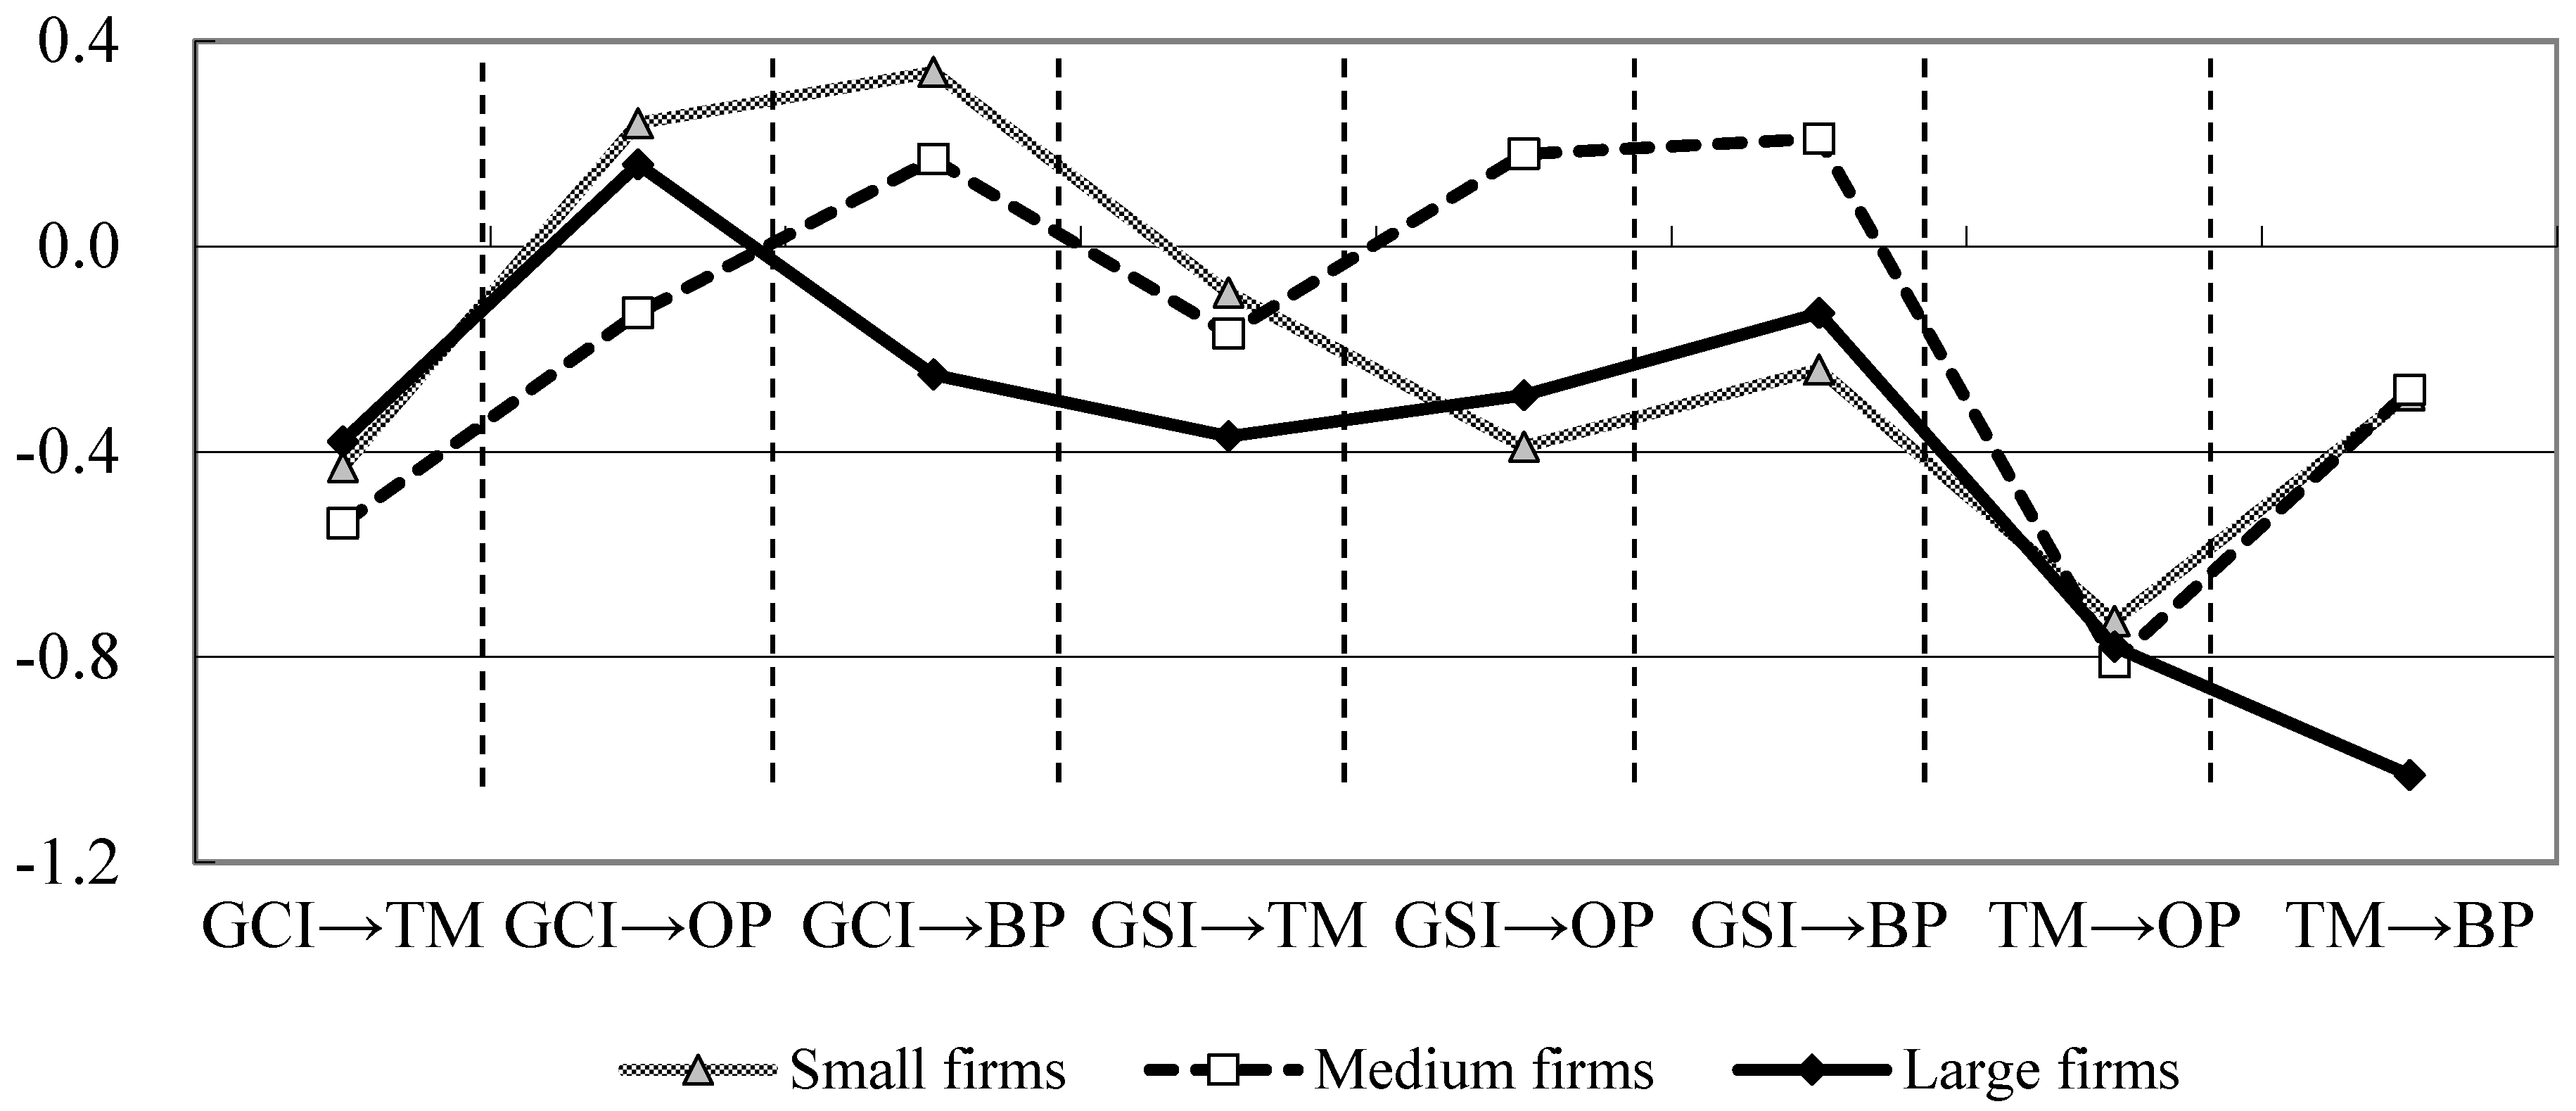
This involves the comparison of two models at a time; Model 3, and a model in which a given structural coefficient is specified as the invariant (Table 5). Thus, the difference in degrees of freedom is two. Chi-square differences greater than 5.99 are statistically significant at the level of 0.05. This is the case for three structural coefficients. The impact of green customer integration on business performance is contingent on firm size (χ2 difference = 6.48). Thus, H1c is supported. For small firms, green customer integration improves business performance significantly; however, for medium and large firms, green customer integration does not directly impact on business performance. The significant result reveals that the association between green supplier integration and operational performance is also different across small, medium and large firms (χ2 difference = 7.17), providing support for H2b. Surprisingly, the direct impact of green supplier integration on operational performance is significantly negative for small firms, while it is not significant for medium and large firms. Finally, the structural coefficient indicates that the relationship between the time-to-market of environmentally friendly products and business performance is not similar (χ2 difference = 13.76) across firm sizes, which offers empirical support for H3b. In fact, it appears that the time-to-market of environmentally friendly products has a significantly negative effect on business performance for large firms, while the effect is not significant for small and medium firms. To further analyze the moderating effect of firm size, the standardized structural coefficients across small, medium and large firms are plotted in Figure 2. To further validate the hypotheses, we conducted several regression analyses. The results are shown in Appendix B.
5. Discussion and Managerial Implications
5.1. Discussion
The importance of green external integration has received considerable attention in both the literature and academic outlets. The reported benefits include improvements in operational, environmental and financial performance. Considering the importance of green external integration, there has been a surge in academic empirical research studies in recent years. As a result of the discrepancies in the findings in existing literature, a basic research question is whether green external integration is always effective under different conditions [14]. This study examined the moderating roles of firm size on the relationships among green external integration, the time-to-market of environmentally friendly products and firm performance. Using data collected from 176 Chinese manufacturing companies, the findings indicate that firm size moderates three of the eight relationships. Thus, we answered the calls of researchers who have stressed the need for an investigation into which conditions of green external integration influence firm performance.
We have also found interesting results from Table A1, Table A2 and Table A3 in Appendix B. The time-to-market of environmentally friendly products mediates the relationships between green customer integration and operational performance for all the studied firms, while it mediates the relationships between green customer integration and business performance only for small and medium firms. In addition, the time-to-market of environmentally friendly products mediates the relationships between green supplier integration and operational performance for medium firms, while it mediates the relationships between green supplier integration and business performance for small and medium firms. Both operational performance (β = 0.406, p < 0.05) and business performance (β = 0.429, p < 0.001) are significantly influenced by green supplier integration for medium firms. However, the direct impacts of green supplier integration on operational and business performance are insignificant for small (β = 0.111, p > 0.1 and β = 0.146, p > 0.1) and large firms (β = 0.163, p > 0.1 and β = 0.198, p > 0.1).
These results echo the literature acknowledging the differences in the collaborative advantage and firm performance achieved from supply chain collaboration among small, medium and large firms [1]. There are three possible explanations for the different effects of green external integration on the time-to-market of environmentally friendly products and performance across firm sizes. Firstly, for small and medium firms, green customer integration helps them to introduce environmentally friendly products to market quickly and thus enhance their operational performance; however, it may be difficult for both small and large firms to internalize (mainly for small firms) or transfer (mainly for large firms) the knowledge gained from suppliers due to their small or large scales and scope of operations [1]. This may explain why green supplier integration is not conducive to both operational and business performance for small and large firms. For medium firms, it is easier for them to internalize and transfer what they have learnt from customers and suppliers to decrease the time-to-market of environmentally friendly products and improve performance. The second potential explanation may lie in the limited resources of small firms. Although small firms understand the objective of green external integration is to provide maximum value to customers, their resources that can be dedicated to green supplier integration are limited. Thirdly, solely implementing green supplier integration may not contribute to performance for small and large firms. As suggested by Flynn et al., small and large firms may implement green supplier integration and green customer integration simultaneously to improve performance [44].
Since these results could alternatively be attributed to different degrees of green customer and supplier integration across small, medium and large firms, caution should be taken before pronouncements are made in favor of certain practices. For example, a firm with higher degrees of green customer and supplier integration may be quicker to develop environmentally friendly products and achieve greater performance. In order to investigate this possibility, we conducted an analysis of variance by firm size. Table 6 shows that the differences of degrees of green customer and supplier integration across small, medium and large firms are not significant. Such information confirms that small and medium firms achieve fewer profits from implementing green external integration, and rules out the possible influence of green external integration level.
5.2. Managerial Implications
Our findings provide significant implications for firms with different sizes. For all firms studied, both green customer and supplier integration proved important in improving operational or business performance through the shortening of the time-to-market of environmentally friendly products. However, firms of different sizes could selectively deploy two dimensions of green external integration to improve their performance. Small firms should rely on green customer integration in improving both operational and business performance, while large firms should depend on green customer integration to enhance operational performance. On the other hand, medium firms can improve operational and business performance through implementing both green customer and supplier integration.
In addition, firms need to understand that linking green external integration with the time-to-market of environmentally friendly products is critical for the improvement of firm performance. Specifically, the time-to-market of environmentally friendly products mediates the relationships between two types of green external integration and two types of firm performance for medium firms, while it mediates the relationship between green customer integration and operational performance for small and large firms and mediates the relationship between green customer integration and business performance for small firms. Thus, firms expecting to improve performance should strive to decrease the time-to-market of environmentally friendly products through implementing green customer or supplier integration [40]. Firms that are devoting efforts to improve performance through implementing green external integration should not ignore the role of the time-to-market of environmentally friendly products.
6. Conclusions and Limitations
6.1. Research Contributions
This study contributes to the existing research on green supply chain integration in several important ways. Firstly, our research adds to the literature by including various dimensions of green external integration and different types of performance in a single model. The existing research has focused on either green customer integration or green supplier integration. In incorporating both green customer and supplier integration and including both operational and business performance, this study adds a greater comprehensiveness and richness to the green external integration literature and enhances our understanding of the impact of green external integration on firm performance.
Secondly, our study contributes to green external integration research by examining the moderating effect of firm size. The results suggest that green customer integration and green supplier integration improve both operational and business performance through shortening the time-to-market of environmentally friendly products for medium firms, while green customer integration enhances operational performance through reducing the time-to-market of environmentally friendly products for small and large firms. Therefore, we should not always expect to realize the same level of firm performance improvement through implementing green external integration for firms of different sizes.
Thirdly, this research enriches the research on green external integration by indicating the importance of green external integration practices in China. The previous related research has focused on other contexts, such as the US [4] and Canada [55]. China has become a global manufacturing base and is playing a more and more important role in the global supply chain [56]. However, the strategic factor markets and institutional infrastructures supporting green supply chain integration have not yet been well developed. An effective green external integration can substitute such institutional voids and serve as a conduit for a wide range of green information, resources and opportunities. Chinese manufacturers can improve their operational and business performance through the implementation of green external integration and decreasing the time-to-market of environmentally friendly products.
6.2. Limitations and Future Research
While our study makes significant contributions to both theory and practice, some limitations should be addressed in future research. Firstly, we used perceptual scales to measure green external integration. Future research may operationalize green external integration with other measures such as the frequency and number of integrating customers and suppliers into environmental activities and the type of customers and suppliers. For example, the integration of lead users may add greater value to product development performance and firm performance than others [57]. Moreover, future research could investigate why some firms value suppliers and customers more and have higher degrees of green external integration.
Secondly, we conducted this study at the strategic business unit (SBU) level and the findings may not be generalizable to the project level. It has been commonly assumed that green customer integration is more favorable to incremental innovation rather than radical innovation [58]. If this is true, green external integration could potentially limit the development of breakthrough products. However, the degree of product newness could only be taken into account in a project level study. This should be an important avenue for future research.
Thirdly, the data for this study consisted of responses from a single respondent in each firm. The use of a single respondent to represent what are supposed to be supply chain-wide variables may cause potential response bias and generate some measurement inaccuracy. This limitation should be taken into account when interpreting the research findings. Future research should also seek to apply multiple respondents from each participating company to enhance the reliability of the empirical findings. Furthermore, this study only took a manufacturer’s perspective; more insights will be gained by investigating the constructs and the relationships between them concurrently from a supplier, manufacturer and customer perspective.
Acknowledgments
This work was supported by the Key program of the National Social Science Foundation of China (No. 15ZDB150).
Author Contributions
Yongtao Song contributed reagents/materials/analysis tools; Taiwen Feng conceived and designed the experiments; Wenbo Jiang performed the experiments and analyzed the data; Yongtao Song and Taiwen Feng wrote the paper.
Conflicts of Interest
The authors declare no conflict of interest.
Appendix A. List of Construct Measurement Items
Green Customer Integration (Adapted from Wu, 2013 [9])
- GCI1: Achieving environmental goals through joint planning with the major customer
- GCI2: Cooperating with the major customer to reduce the environmental impact of our products
- GCI3: Cooperating with the major customer for cleaner production, green packaging, or other environmental activities
- GCI4: Collaborating with the major customer to implement an environmental management system
- GCI5: Implementing environmental audits for the major customer’s internal management
Green Supplier Integration (Adapted from Wu, 2013 [9])
- GSI1: Collaborating with a major supplier to set up environmental goals
- GSI2: Providing a major supplier with environmental design requirements related to design specifications and cleaner production technology
- GSI3: Requiring a major supplier to implement environmental management or obtain third-party certification of environmental management system (e.g., ISO 14001)
- GSI4: Selecting suppliers according to environmental criteria
Time-to-Market of Environmentally friendly Products (Adapted from Li et al., 2006 [48])
- TM1: We deliver environmentally friendly products to market quickly
- TM 2: We are first in the market in introducing environmentally friendly products
- TM 3: We have a time-to-market lower than the industry average
- TM 4: We have fast environmentally friendly product development *
Operational Performance (Adapted from Flynn et al., 2010 [44])
- OP1: We can quickly modify products to meet the major customer’s requirements *
- OP2: We have an outstanding on-time delivery record to a major customer
- OP3: The lead time for fulfilling the customers’ orders (the time which elapses between the receipt of customer’s order and the delivery of the goods) is short
- OP4: We provide a high level of customer service to the major customer
Business Performance (Adapted from Flynn et al., 2010 [44])
- BP1: Our return on investment (ROI) is very high
- BP2: The return on sales of our company is very high *
- BP3: The growth in sales of our company is very high
- BP4: The growth in profit of our company is very high
- BP5: The growth in market share of our company is very high
* Items are deleted after reliability or validity analysis.
Appendix B. Regression Analysis Results

Table A1.
Analysis results of small firms.
| Variables | Time-to-Market | Operational Performance | Business Performance | |||||||
|---|---|---|---|---|---|---|---|---|---|---|
| Model 1 | Model 2 | Model 3 | Model 4 | Model 5 | Model 6 | Model 7 | Model 8 | Model 9 | Model 10 | |
| Green customer integration | −0.441 *** | 0.336 * | 0.057 | 0.335 * | 0.222 | |||||
| Green supplier integration | −0.319 * | 0.111 | −0.111 | 0.146 | 0.037 | |||||
| Time-to-market | −0.634 *** | −0.694 *** | −0.257 * | −0.343 * | ||||||
| F value | 13.256 *** | 6.226 * | 7.023 * | 0.680 | 20.951 *** | 21.678 *** | 6.952 * | 1.198 | 5.353 ** | 3.929 * |
Note: *** p < 0.001; ** p < 0.01; * p < 0.05.
Table A2.
Analysis results of medium firms.
| Variables | Time-to-Market | Operational Performance | Business Performance | |||||||
|---|---|---|---|---|---|---|---|---|---|---|
| Model 1 | Model 2 | Model 3 | Model 4 | Model 5 | Model 6 | Model 7 | Model 8 | Model 9 | Model 10 | |
| Green customer integration | −0.564 *** | 0.403 ** | 0.091 | 0.430 *** | 0.262 * | |||||
| Green supplier integration | −0.427 *** | 0.406 ** | 0.182 | 0.429 *** | 0.292 * | |||||
| Time-to-market | −0.552 *** | −0.526 *** | −0.298 * | −0.321 * | ||||||
| F value | 26.117 *** | 12.454 *** | 10.846 ** | 11.085 ** | 16.170 *** | 17.708 *** | 12.668 *** | 12.641 *** | 8.920 *** | 10.079 *** |
Note: *** p < 0.001; ** p < 0.01; * p < 0.05.
Table A3.
Analysis results of large firms.
| Variables | Time-to-Market | Operational Performance | Business Performance | |||||||
|---|---|---|---|---|---|---|---|---|---|---|
| Model 1 | Model 2 | Model 3 | Model 4 | Model 5 | Model 6 | Model 7 | Model 8 | Model 9 | Model 10 | |
| Green customer integration | −0.463 *** | 0.413 *** | 0.149 | 0.198 | −0.103 | |||||
| Green supplier integration | −0.419 *** | 0.163 | −0.128 | 0.198 | −0.065 | |||||
| Time-to-market | −0.570 *** | −0.693 *** | −0.649 *** | −0.628 *** | ||||||
| F value | 16.097 *** | 12.561 *** | 12.159 *** | 1.604 | 21.563 *** | 21.206 *** | 2.401 | 2.410 | 17.004 *** | 16.660 *** |
Note: *** p < 0.001.
References
- Cao, M.; Zhang, Q. Supply chain collaboration: Impact on collaborative advantage and firm performance. J. Oper. Manag. 2011, 29, 163–180. [Google Scholar] [CrossRef]
- Heirati, N.; O’Cass, A.; Schoefer, K.; Siahtiri, V. Do professional service firms benefit from customer and supplier collaborations in competitive, turbulent environments? Ind. Mark. Manag. 2016, 55, 50–58. [Google Scholar] [CrossRef]
- Chiou, T.Y.; Chan, H.K.; Lettice, F.; Chung, S.H. The influence of greening the suppliers and green innovation on environmental performance and competitive advantage in Taiwan. Transp. Res. Part E Logist. Transp. Rev. 2011, 47, 822–836. [Google Scholar] [CrossRef]
- Vachon, S.; Klassen, R.D. Extending green practices across the supply chain: The impact of upstream and downstream integration. Int. J. Oper. Prod. Manag. 2006, 26, 795–821. [Google Scholar] [CrossRef]
- Lin, R.J. Using fuzzy DEMATEL to evaluate the green supply chain management practices. J. Clean. Prod. 2013, 40, 32–39. [Google Scholar] [CrossRef]
- Rao, P.; Holt, D. Do green supply chains lead to competitiveness and economic performance? Int. J. Oper. Prod. Manag. 2005, 25, 898–916. [Google Scholar] [CrossRef]
- Ryszko, A. Proactive Environmental strategy, technological eco-innovation and firm performance—Case of Poland. Sustainability 2016, 8, 156. [Google Scholar] [CrossRef]
- Weng, H.H.R.; Chen, J.S.; Chen, P.C. Effects of green innovation on environmental and corporate performance: A stakeholder perspective. Sustainability 2015, 7, 4997–5026. [Google Scholar] [CrossRef]
- Wu, G.C. The influence of green supply chain integration and environmental uncertainty on green innovation in Taiwan’s IT industry. Supply Chain Manag. Int. J. 2013, 18, 539–552. [Google Scholar] [CrossRef]
- Dai, J.; Cantor, D.E.; Montabon, F.L. How environmental management competitive pressure affects a focal firm’s environmental innovation activities: A green supply chain perspective. J. Bus. Logist. 2015, 36, 242–259. [Google Scholar] [CrossRef]
- Kirchoff, J.F.; Tate, W.L.; Mollenkopf, D.A. The impact of strategic organizational orientations on green supply chain management and firm performance. Int. J. Phys. Distrib. Logist. Manag. 2016, 46, 269–292. [Google Scholar] [CrossRef]
- Kuei, C.; Madu, C.N.; Chow, W.S.; Chen, Y. Determinants and associated performance improvement of green supply chain management in China. J. Clean. Prod. 2015, 95, 163–173. [Google Scholar] [CrossRef]
- Zhu, Q.; Feng, Y.; Choi, S.B. The role of customer relational governance in environmental and economic performance improvement through green supply chain management. J. Clean. Prod. 2017, 155, 46–53. [Google Scholar] [CrossRef]
- Koufteros, X.A.; Cheng, T.C.E.; Lai, K.H. ‘‘Black-box’’ and ‘‘gray-box’’ supplier integration in product development: Antecedents, consequences and the moderating role of firm size. J. Oper. Manag. 2007, 25, 847–870. [Google Scholar] [CrossRef]
- Zhu, Q.; Sarkis, J.; Lai, K.H.; Geng, Y. The role of organizational size in the adoption of green supply chain management practices in China. Corp. Soc. Responsib. Environ. Manag. 2008, 15, 322–337. [Google Scholar] [CrossRef]
- Chang, W.; Taylor, S.A. The effectiveness of customer participation in new product development: A meta-analysis. J. Mark. 2016, 80, 47–64. [Google Scholar] [CrossRef]
- Feng, T.; Cai, D.; Zhang, Z.; Liu, B. Customer involvement and new product performance: The jointly moderating effects of technological and market newness. Ind. Manag. Data Syst. 2016, 116, 1700–1718. [Google Scholar] [CrossRef]
- Johnson, W.H.A.; Luo, C. NPD project timeliness: The project-level impact of early engineering effort and customer involvement. Int. J. Prod. Dev. 2008, 6, 160–176. [Google Scholar] [CrossRef]
- Song, Y.; Cai, J.; Feng, T. The influence of green supply chain integration on firm performance: A contingency and configuration perspective. Sustainability 2017, 9, 763. [Google Scholar] [CrossRef]
- Yang, C.S.; Lu, C.S.; Haider, J.J.; Marlow, P.B. The effect of green supply chain management on green performance and firm competitiveness in the context of container shipping in Taiwan. Transp. Res. Part E Logist. Transp. Rev. 2013, 55, 55–73. [Google Scholar] [CrossRef]
- Yu, W.; Chavez, R.; Feng, M.; Wiengarten, F. Integrated green supply chain management and operational performance. Supply Chain Manag. Int. J. 2014, 19, 683–696. [Google Scholar] [CrossRef]
- Lavie, D. The competitive advantage of interconnected firms: An extension of the resource-based view. Acad. Manag. Rev. 2006, 31, 638–658. [Google Scholar] [CrossRef]
- Wolf, J. Sustainable supply chain management integration: A qualitative analysis of the German manufacturing industry. J. Bus. Ethics 2011, 102, 221–235. [Google Scholar] [CrossRef]
- Wu, G.C.; Ding, J.H.; Chen, P.S. The effects of GSCM drivers and institutional pressures on GSCM practices in Taiwan’s textile and apparel industry. Int. J. Prod. Econ. 2012, 135, 618–636. [Google Scholar] [CrossRef]
- Thoumy, M.; Vachon, S. Environmental projects and financial performance: Exploring the impact of project characteristics. Int. J. Prod. Econ. 2012, 140, 28–34. [Google Scholar] [CrossRef]
- Carbonell, P.; Rodriguez-Escudero, A.I.; Pujari, D. Performance effects of involving lead users and close customers in new service development. J. Serv. Mark. 2012, 26, 497–509. [Google Scholar] [CrossRef]
- Leonidou, L.C.; Christodoulides, P.; Kyrgidou, L.P.; Palihawadana, D. Internal drivers and performance consequences of small firm green business strategy: The moderating role of external forces. J. Bus. Ethics 2017, 140, 585–606. [Google Scholar] [CrossRef]
- Weerawardena, J.; Mort, G.S.; Salunke, S.; Knight, G.; Liesch, P.W. The role of the market sub-system and the socio-technical sub-system in innovation and firm performance: A dynamic capabilities approach. J. Acad. Mark. Sci. 2015, 43, 221–239. [Google Scholar] [CrossRef]
- Brunswicker, S.; Vanhaverbeke, W. Open innovation in small and medium-sized enterprises (SMEs): External knowledge sourcing strategies and internal organizational facilitators. J. Small Bus. Manag. 2015, 53, 1241–1263. [Google Scholar] [CrossRef]
- Ismail, N.A.; King, M. Factors influencing the alignment of accounting information systems in small and medium sized Malaysian manufacturing firms. J. Inf. Syst. Small Bus. 2014, 1, 1–20. [Google Scholar]
- Ertimur, B.; Venkatesh, A. Opportunism in co-production: Implications for value co-creation. Australas. Mark. J. 2010, 18, 256–263. [Google Scholar] [CrossRef]
- Zsidisin, A.G.; Ellram, L.M. An agency theory investigation of supply risk management. J. Supply Chain Manag. 2003, 39, 15–27. [Google Scholar] [CrossRef]
- Panayides, P.M.; Lun, Y.H.V. The impact of trust on innovativeness and supply chain performance. Int. J. Prod. Econ. 2009, 122, 35–46. [Google Scholar] [CrossRef]
- Schoenherr, T.; Wagner, S.M. Supplier involvement in the fuzzy front end of new product development: An investigation of homophily, benevolence and market turbulence. Int. J. Prod. Econ. 2016, 180, 101–113. [Google Scholar] [CrossRef]
- Huo, B. The impact of supply chain integration on company performance: An organizational capability perspective. Supply Chain Manag. Int. J. 2012, 17, 596–610. [Google Scholar] [CrossRef]
- Carbonell, P.; Rodriguez, A.I. The impact of market characteristics and innovation speed on perceptions of positional advantage and new product performance. Int. J. Res. Mark. 2006, 23, 1–12. [Google Scholar] [CrossRef]
- Chen, J.; Reilly, R.R.; Lynn, G.S. The impacts of speed-to-market on new product success: The moderating effects of uncertainty. IEEE Trans. Eng. Manag. 2005, 52, 199–212. [Google Scholar] [CrossRef]
- Feng, T.; Sun, L.; Zhu, C.; Sohal, A.S. Customer orientation for decreasing time-to-market of new products: IT implementation as a complementary asset. Ind. Mark. Manag. 2012, 41, 929–939. [Google Scholar] [CrossRef]
- Huo, B.; Qi, Y.; Wang, Z.; Zhao, X. The impact of supply chain integration on firm performance: The moderating role of competitive strategy. Supply Chain Manag. Int. J. 2014, 19, 369–384. [Google Scholar] [CrossRef]
- Ernst, H.; Hoyer, W.D.; Krafft, M.; Krieger, K. Customer relationship management and company performance—the mediating role of new product performance. J. Acad. Mark. Sci. 2010, 39, 290–306. [Google Scholar] [CrossRef]
- Zhao, X.; Huo, B.; Selen, W.; Yeung, J.H.Y. The impact of internal integration and relationship commitment on external integration. J. Oper. Manag. 2011, 29, 17–32. [Google Scholar] [CrossRef]
- Podsakoff, P.M.; MacKenzie, S.B.; Lee, J.Y.; Podsakoff, N.P. Common method variance in behavioral research: A critical review of the literature and recommended remedies. J. Appl. Psychol. 2003, 88, 879–903. [Google Scholar] [CrossRef] [PubMed]
- Williams, L.J.; Cote, J.A.; Buckley, M.R. Lack of method variance in self-reported affect and perceptions at work: Reality or artifact. J. Appl. Psychol. 1989, 74, 462–468. [Google Scholar] [CrossRef]
- Flynn, B.B.; Huo, B.; Zhao, X. The impact of supply chain integration on performance: A contingency and configuration approach. J. Oper. Manag. 2010, 28, 58–71. [Google Scholar] [CrossRef]
- Podsakoff, P.M.; MacKenzie, S.B.; Podsakoff, N.P. Sources of method bias in social science research and recommendations on how to control it. Annu. Rev. Psychol. 2012, 63, 539–569. [Google Scholar] [CrossRef] [PubMed]
- Fynes, B.; Voss, C.; de Búrca, S. The impact of supply chain relationship quality on quality performance. Int. J. Prod. Econ. 2005, 96, 339–354. [Google Scholar] [CrossRef]
- Krause, D.R.; Handfield, R.B.; Tyler, B.B. The relationships between supplier development, commitment, social capital accumulation and performance improvement. J. Oper. Manag. 2007, 25, 528–545. [Google Scholar] [CrossRef]
- Li, S.; Ragu-Nathan, B.; Ragu-Nathan, T.S.; Rao, S.S. The impact of supply chain management practices on competitive advantage and organizational performance. Omega 2006, 34, 107–124. [Google Scholar] [CrossRef]
- Min, S.; Mentzer, J.T. Developing and measuring supply chain management concepts. J. Bus. Logist. 2004, 25, 63–99. [Google Scholar] [CrossRef]
- O’Leary-Kelly, S.W.; Vokurka, R.J. The empirical assessment of construct validity. J. Oper. Manag. 1998, 16, 387–405. [Google Scholar] [CrossRef]
- Hu, L.; Bentler, P.M. Cutoff criteria for fit indices in covariance structure analysis: Conventional criteria versus new alternatives. Struct. Equ. Model. 1999, 6, 1–55. [Google Scholar] [CrossRef]
- Fornell, C.; Larcker, D.F. Evaluating structural equation models with unobservable variables and measurement error. J. Mark. Res. 1982, 18, 29–50. [Google Scholar] [CrossRef]
- Sjöholm, F.; Lundin, N. The role of small firms in the technology development of China. World Econ. 2010, 33, 1117–1139. [Google Scholar] [CrossRef]
- Joreskog, K.G.; Sorbom, D. LISREL 8 User’s Reference Guide; Scientific Software Inc.: Chicago, IL, USA, 1996. [Google Scholar]
- Green, K.W., Jr.; Zelbst, P.J.; Meacham, J.; Bhadauria, V.S. Green supply chain management practices: Impact on performance. Supply Chain Manag. Int. J. 2012, 17, 290–305. [Google Scholar] [CrossRef]
- Feng, T.; Sun, L.; Zhang, Y. The effects of customer and supplier involvement on competitive advantage: An empirical study in China. Ind. Mark. Manag. 2010, 39, 1384–1394. [Google Scholar] [CrossRef]
- Lilien, G.L.; Morrison, P.D.; Searls, K.; Sonnack, M.; von Hippel, E. Performance assessment of the lead user idea-generation process for new product development. Manag. Sci. 2002, 48, 1042–1059. [Google Scholar] [CrossRef]
- Heiskanen, E.; Hyvönen, K.; Niva, M.; Pantzar, M.; Timonen, P.; Varjonen, J. User involvement in radical innovation: Are consumers conservative? Eur. J. Innov. Manag. 2007, 10, 489–509. [Google Scholar] [CrossRef]
Figure 1.
Conceptual model.
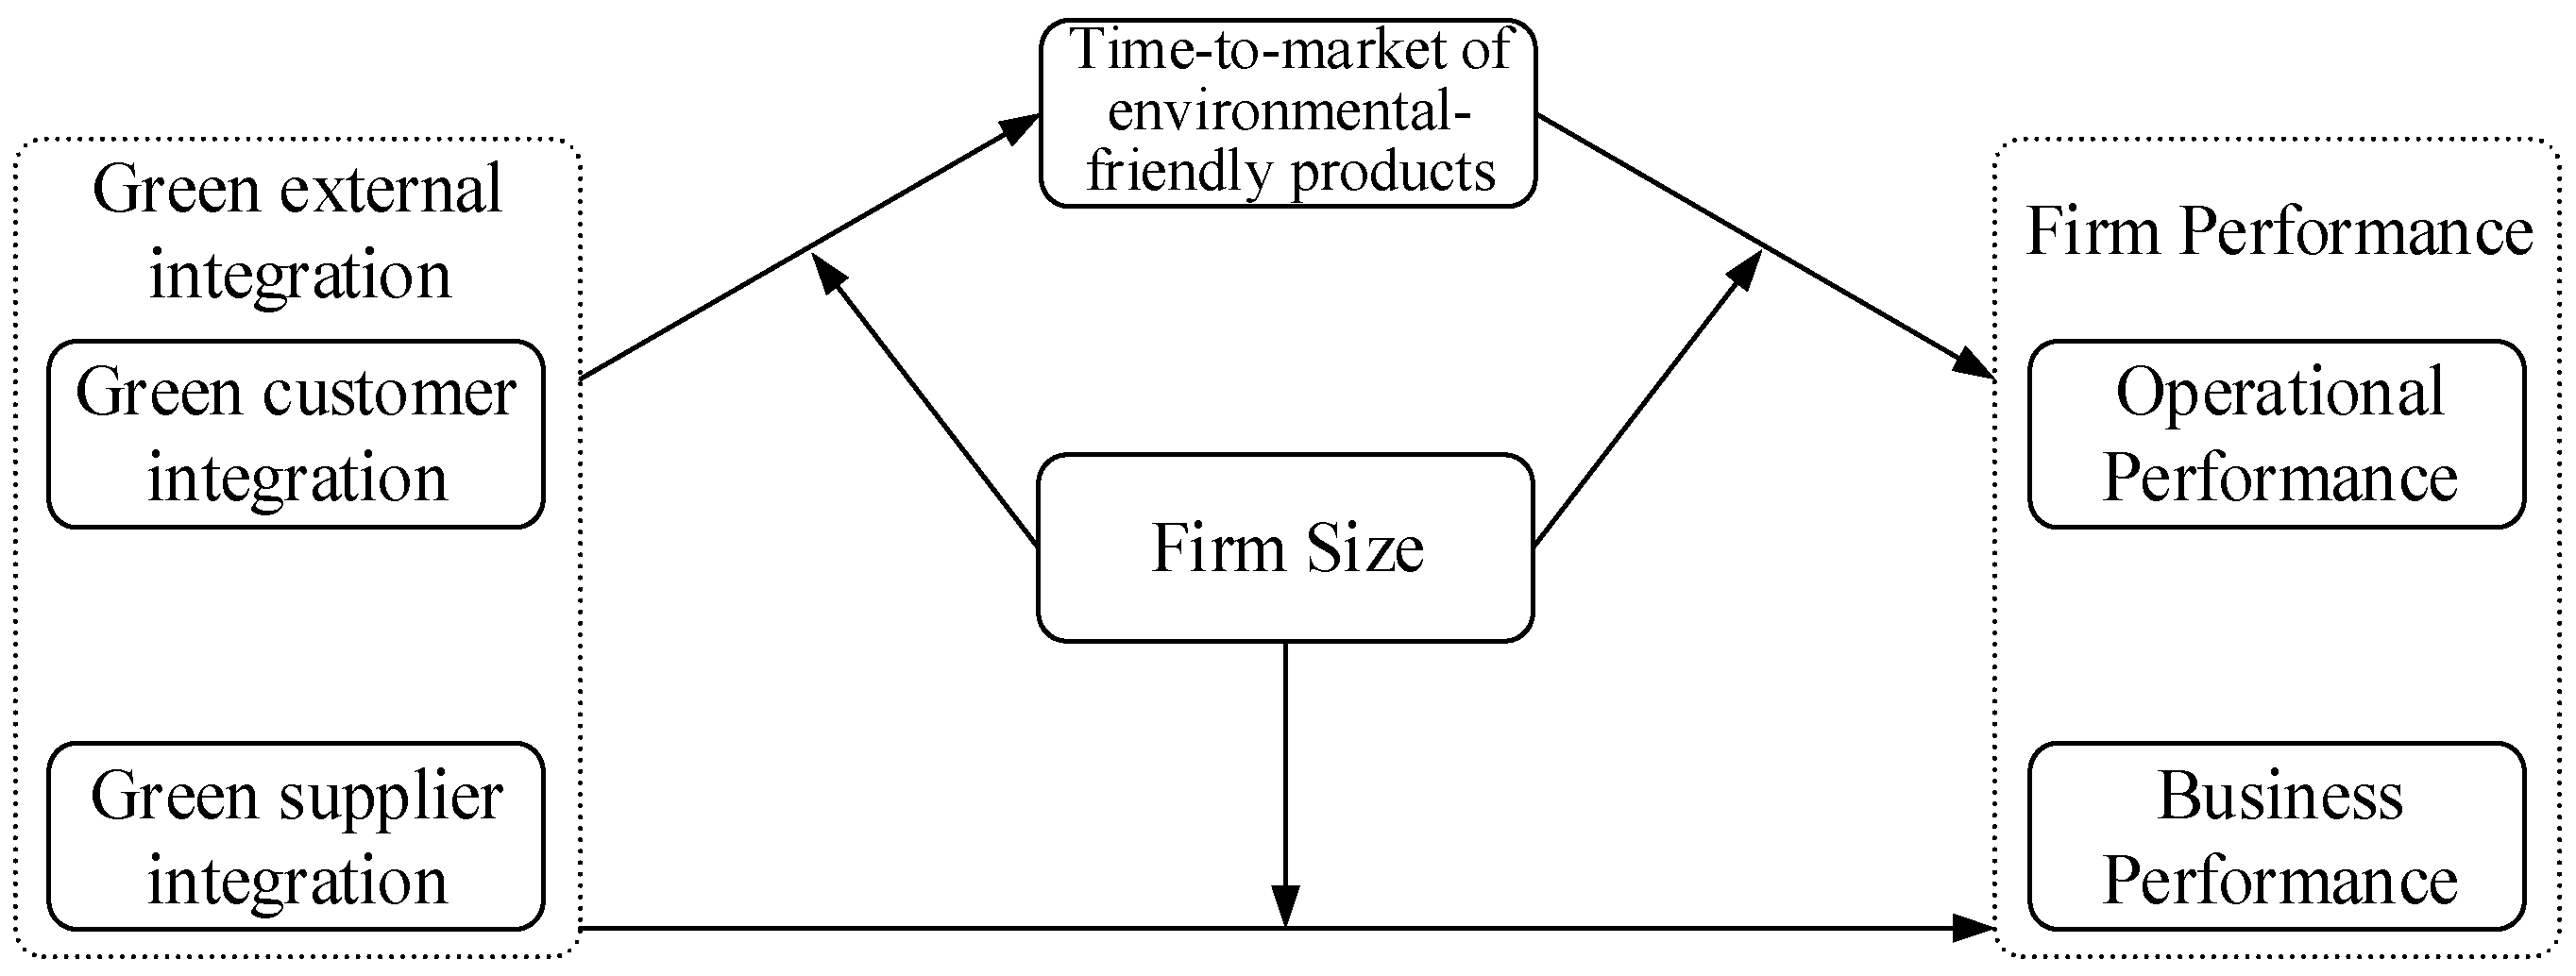
Figure 2.
The standardized coefficients of different relationships across firm sizes.

Table 1.
Sample description.
| Characteristics of Firms | Frequency | Percentage |
|---|---|---|
| Industry | ||
| Food and beverage | 7 | 4.0 |
| Chemical and related products | 4 | 2.3 |
| Pharmaceutical and medical | 2 | 1.1 |
| Rubber and plastics | 13 | 7.4 |
| Smelting and pressing | 4 | 2.3 |
| Metal products | 4 | 2.3 |
| Machinery | 32 | 18.2 |
| Transport equipment | 13 | 7.4 |
| Electrical machinery and equipment | 20 | 11.4 |
| Communication and computers related equipment | 46 | 26.1 |
| Instruments and related products | 4 | 2.3 |
| Others | 27 | 15.3 |
| Number of Employees | ||
| 1–49 | 15 | 8.5 |
| 50–99 | 10 | 5.7 |
| 100–299 | 32 | 18.2 |
| 300–999 | 30 | 17.1 |
| 1000–1999 | 28 | 15.9 |
| 2000–4999 | 31 | 17.6 |
| Over 5000 | 30 | 17.1 |
| Ownership | ||
| State and collectively-owned | 45 | 25.6 |
| Privately-owned | 60 | 34.1 |
| Foreign invested | 71 | 40.3 |
Table 2.
Confirmatory factor analysis, Cronbach alpha, and composite reliability results.
| Construct | Item Code | Factor Loading | t-Value | Cronbach Alpha | Composite Reliability |
|---|---|---|---|---|---|
| Green customer integration | GCI1 | 0.75 | 11.48 | 0.918 | 0.920 |
| GCI2 | 0.88 | 14.47 | |||
| GCI3 | 0.89 | 14.77 | |||
| GCI4 | 0.81 | 12.64 | |||
| GCI5 | 0.84 | 13.53 | |||
| Green supplier integration | GSI1 | 0.86 | 13.70 | 0.891 | 0.894 |
| GSI2 | 0.75 | 11.33 | |||
| GSI3 | 0.88 | 14.03 | |||
| GSI4 | 0.80 | 12.45 | |||
| Time-to-market of environmentally friendly products | TM1 | 0.75 | 11.08 | 0.828 | 0.834 |
| TM2 | 0.80 | 12.13 | |||
| TM3 | 0.82 | 12.37 | |||
| Operational performance | OP2 | 0.86 | 12.68 | 0.781 | 0.796 |
| OP3 | 0.66 | 9.12 | |||
| OP4 | 0.73 | 10.29 | |||
| Business performance | BP1 | 0.73 | 10.69 | 0.875 | 0.877 |
| BP3 | 0.82 | 12.72 | |||
| BP4 | 0.84 | 13.02 | |||
| BP5 | 0.81 | 12.47 |
Fit indices: χ2 (142) = 300.14, root mean square error of approximation (RMSEA) = 0.077, non-normed fit index (NNFI) = 0.96, comparative fit index (CFI) = 0.96, standard root mean square residual (SRMR) = 0.057.
Table 3.
Discriminant validity test.
| Construct | GCI | GSI | TM | OP |
|---|---|---|---|---|
| Green customer integration (GCI) | ||||
| Green supplier integration (GSI) | 272.32 | |||
| Time-to-market (TM) | 131.29 | 145.83 | ||
| Operational performance (OP) | 123.81 | 142.39 | 37.23 | |
| Business performance (BP) | 314.53 | 319.64 | 112.72 | 115.87 |
Note: All the Chi-square differences are significant at the level of 0.01.
Table 4.
Correlations matrix for the construct.
| Construct | Mean | S.D. | GCI | GSI | TM | OP | BP |
|---|---|---|---|---|---|---|---|
| Green customer integration (GCI) | 5.140 | 1.038 | 0.835 | ||||
| Green supplier integration (GSI) | 4.766 | 1.077 | 0.516 | 0.823 | |||
| Time-to-market (TM) | 4.879 | 1.030 | 0.483 | 0.380 | 0.791 | ||
| Operational performance (OP) | 5.195 | 0.938 | 0.387 | 0.237 | 0.629 | 0.754 | |
| Business performance (BP) | 4.508 | 1.095 | 0.298 | 0.254 | 0.490 | 0.393 | 0.801 |
Note: S.D. means standard deviation; numbers in bold on the diagonal indicate the square root of average variance extracted (AVE)s.
Table 5.
Invariance tests across firm size.
| Models | χ2 | d.f. | NNFI | CFI | Nested Models | ∆χ2 | ∆d.f. | Significant Level | Small Firms (n = 57) | Medium Firms (n = 58) | Large Firms (n = 61) | |||
|---|---|---|---|---|---|---|---|---|---|---|---|---|---|---|
| Standardized Coefficient | t-Value | Standardized Coefficient | t-Value | Standardized Coefficient | t-Value | |||||||||
| 1. Base line model | 806.24 | 460 | 0.91 | 0.92 | ||||||||||
| 2. Equal loadings | 834.42 | 488 | 0.92 | 0.92 | 2–1 | 28.18 | 28 | 0.455 | ||||||
| 3. Equal loadings, measurement error | 874.83 | 507 | 0.92 | 0.92 | 3–2 | 40.41 | 19 | 0.003 * | ||||||
| 4. Equal loadings, measurement error, structural coefficients | 902.08 | 523 | 0.92 | 0.91 | 4–3 | 27.25 | 16 | 0.039 * | ||||||
| 5a. GCI → TM | 875.36 | 509 | 0.92 | 0.92 | 3–5a | 0.53 | 2 | 0.767 | −0.43 * | −2.62 | −0.54 * | −3.26 | −0.38 * | −2.43 |
| 5b. GCI → OP | 877.06 | 509 | 0.92 | 0.92 | 3–5e | 2.23 | 2 | 0.328 | 0.24 | 1.50 | −0.13 | −0.79 | 0.16 | 1.04 |
| 5c. GCI → BP | 881.31 | 509 | 0.91 | 0.92 | 3–5f | 6.48 | 2 | 0.039 * | 0.34 * | 2.04 | 0.17 | 1.02 | −0.25 | −1.45 |
| 5d. GSI → TM | 876.25 | 509 | 0.92 | 0.92 | 3–5b | 1.42 | 2 | 0.492 | −0.09 | −0.56 | −0.17 | −1.07 | −0.37 * | −2.31 |
| 5e. GSI → OP | 882.00 | 509 | 0.91 | 0.92 | 3–5g | 7.17 | 2 | 0.028 * | −0.39 * | −2.63 | 0.18 | 1.21 | −0.29 | −1.86 |
| 5f. GSI → BP | 879.07 | 509 | 0.92 | 0.92 | 3–5h | 4.24 | 2 | 0.120 | −0.24 | −1.59 | 0.21 | 1.42 | −0.13 | −0.70 |
| 5g. TM → OP | 874.94 | 509 | 0.92 | 0.92 | 3–5c | 0.11 | 2 | 0.946 | −0.73 * | −4.39 | −0.81 * | −4.82 | −0.78 * | −4.90 |
| 5h. TM → BP | 888.59 | 509 | 0.91 | 0.91 | 3–5d | 13.76 | 2 | 0.001 * | −0.29 | −1.74 | −0.28 | −1.74 | −1.03 * | −5.36 |
* Indicates a significant value at the 0.05 level.
Table 6.
Analysis of variance by firm size.
| Sum of Squares | d.f. | Mean Square | F | Sig. | Mean Score by Firm Size | ||
|---|---|---|---|---|---|---|---|
| Green customer integration | Between Groups | 0.134 | 2 | 0.067 | 0.062 | 0.940 | Small: 5.136 |
| Within Groups | 188.470 | 173 | 1.089 | Medium: 5.107 | |||
| Total | 188.604 | 175 | Large: 5.174 | ||||
| Green supplier integration | Between Groups | 2.259 | 2 | 1.130 | 0.974 | 0.380 | Small: 4.610 |
| Within Groups | 200.654 | 173 | 1.160 | Medium: 4.797 | |||
| Total | 202.914 | 175 | Large: 4.881 | ||||
| Time-to-market of environmentally friendly products | Between Groups | 1.393 | 2 | 0.696 | 0.653 | 0.522 | Small: 4.991 |
| Within Groups | 184.357 | 173 | 1.066 | Medium: 4.879 | |||
| Total | 185.750 | 175 | Large: 4.774 | ||||
| Operational performance | Between Groups | 0.197 | 2 | 0.099 | 0.111 | 0.895 | Small: 5.197 |
| Within Groups | 153.737 | 173 | 0.889 | Medium: 5.236 | |||
| Total | 153.935 | 175 | Large: 5.154 | ||||
| Business performance | Between Groups | 1.480 | 2 | 0.740 | 0.615 | 0.542 | Small: 4.593 |
| Within Groups | 208.170 | 173 | 1.203 | Medium: 4.379 | |||
| Total | 209.650 | 175 | Large: 4.549 |
© 2017 by the authors. Licensee MDPI, Basel, Switzerland. This article is an open access article distributed under the terms and conditions of the Creative Commons Attribution (CC BY) license (http://creativecommons.org/licenses/by/4.0/).
Share and Cite
MDPI and ACS Style
Song, Y.; Feng, T.; Jiang, W. The Influence of Green External Integration on Firm Performance: Does Firm Size Matter? Sustainability 2017, 9, 1328. https://doi.org/10.3390/su9081328
AMA Style
Song Y, Feng T, Jiang W. The Influence of Green External Integration on Firm Performance: Does Firm Size Matter? Sustainability. 2017; 9(8):1328. https://doi.org/10.3390/su9081328
Chicago/Turabian StyleSong, Yongtao, Taiwen Feng, and Wenbo Jiang. 2017. "The Influence of Green External Integration on Firm Performance: Does Firm Size Matter?" Sustainability 9, no. 8: 1328. https://doi.org/10.3390/su9081328
Note that from the first issue of 2016, this journal uses article numbers instead of page numbers. See further details here.