A New Dynamic Pricing Model for the Effective Sustainability of Perishable Product Life Cycle


Department of Industrial Engineering, Cukurova University, 01330 Adana, Turkey
*
Author to whom correspondence should be addressed.
Sustainability 2017, 9(8), 1330; https://doi.org/10.3390/su9081330
Submission received: 6 June 2017
/
Revised: 21 July 2017
/
Accepted: 27 July 2017
/
Published: 29 July 2017
(This article belongs to the Special Issue Sustainability in Food Supply Chain and Food Industry)
Abstract
:Perishable products run their life cycle in a short period of time due to the shortness of their shelf lives. Product efficiency falls when especially non-recyclable products are thrown away without being used. Furthermore, this kind of products that unnecessarily occupy shelves of supermarkets cause supermarkets to follow an insufficient stock management policy. Unconscious and unplanned use of our limited natural resources will deteriorate the product portfolio for future generations. Such unconscious production and consumption patterns will disrupt natural balance and damage sustainability of products. In addition to creating very high costs for producers, sellers and consumers alike, these unsold or stale products lead to environmental problems due to such pricing policies. In other words, although the products have to be thrown away without being sold is attributed by many managers to be attributable to the unplanned over-orders, the actual reason is something else. The real contributor of the problem is changing purchase attitudes of customers because of wrong pricing policies of wholesaler. In addition, limited resources are also consumed fast and in unnecessary amounts. The imbalance in respect to the sustainability of these products leads to increase in the production costs, procurement costs and failure to achieve balance among products to be kept in storage houses as some of the products occupy stocks unnecessarily. In the present study, a new pricing policy is developed for product stock whose shelf lives are about to expire and generally become waste to increase salability of these products in reference to fresher stocks of these products. The present study, which is designed to reduce the above-mentioned losses, will seek to minimize the cost of waste, maximize the profit earned by supermarkets from the product, maximize product utilization rates and ensure sustainability of products and stocks as well. Fulfillment of these objectives will increase productivity and enhance the significance of product efficiency and nature-friendly attitudes.
1. Introduction
Withdrawal of highly perishable and non-recyclable food products from shelves of supermarkets without being sold and their transfer to the category of waste products lead to unnecessarily superfluous exploitation of our limited and consumable resources [1]. While their sustainability cannot be ensured, as they are non-recyclable, surpluses of orders directly and negatively affect revenue of supermarkets. For food safety concerns, consumers generally prefer not to buy products whose expiration date is about to come. This is why fresher products are sold in higher numbers and faster in comparison to staler products. This leads to the practice of throwing outdated products away, when their self-lives expire. The present study seeks to donate environmental sustainability with a new perspective combining social sustainability, environmental sustainability, profit concerns, corporate interests and public interest. In this context, the present study will develop a new dynamic pricing approach and help organizations produce and sell in amounts corresponding to the real need, within the natural life cycle of the products. The new model developed in the study will attempt to change purchase attitudes with new optimum strategic sale decisions of markets to ensure sustainability [2,3,4].
Dynamic price falls will allow supermarkets to sell products before they perish, thereby bringing with it maximum income from these products. The model developed in the study introduced a new assumption to the literature. This assumption suggests that all products within the product groups offered for sale affect each other’s staleness degree. The results of the study reveal that new pricing approaches minimized the staleness and sales of products are maximized, thus ensuring their sustainability and productivity. Furthermore, optimum benefit–cost balance is enlightened for non-recyclable and fast moving consumer products for future studies in the field of food industry. The practices prevailing in the food sector today have gained importance due to the physical infrastructure problems, limited natural resources and environmental sustainability studies. All countries around the world have the desire and the awareness of the need for a stock of right products and the right quantity needed by their societies despite the limited resources. This is where food safety and product life cycle sustainability appear as two important parameters. The products that could not be consumed by consumers constitute the losses of system as waste [5,6]. Then, how can we ensure that the products are consumed in the most appropriate manner and how can we slow down the consumption of the limited natural resources with sustainable life cycle? All people around the world need sufficient, safe and nutritive food products for a healthy and active life. It is very important to ensure that consumers have access to food products any time they need at affordable prices.
The importance of food products for least developed countries and countries in crises urges the need to prevent unnecessary consumption of food and better planning of food consumption all around the world. Around one billion people currently feed on 1 USD daily income, which clearly shows the significance of food products. In this context, life cycle sustainability of food products, non-recyclable ones in particular, is of paramount importance. All related groups, from producers to wholesalers, from wholesalers to consumers, carry important responsibilities for food sustainability in this life cycle. One of the most important duties belongs to wholesaler companies who are directly connected to consumers, the last ring in the chain, and in direct and personal communication with consumers. Under today’s competitive circumstances, sustainability brings with it numerous risks and opportunities. Although it is hard to clearly determine these risks and opportunities and re-regulate the corporate operations and services accordingly, companies that achieved this will gain advantage against their competitors in future. Naturally, it is not easy to achieve. For companies to better evaluate the risks and opportunities in terms of sustainability, they need to better know their social stakeholders and measure the impacts of social and environmental factor on their companies and consumers. From the perspective of consumers, the subject is even more important compared to the wholesalers, the organizations defined above [7].
Consumers see quality as the core of their preferences; therefore, they act meticulously about food safety when they are about to buy highly perishable products. The most important parameter for the highly perishable products is the remaining shelf-life. Supermarkets may make discounts on products whose shelf-life is about to expire for the purpose of boosting sale of products when the amount of such products is significantly high. Consumers make their purchasing decision on discounted products by weighing benefits and costs of the product. In other words, they go for the products which offer them the highest benefit with the price offered [8]. In this context, consumers want to buy the freshest product from which they can obtain the highest benefit at the price offered. The analysis of customer behaviors showed that when different stocks of the same product with different degrees of freshness (samples) are offered for sale on the same shelves shows that customers prefer the freshest product. For example, when a pack of yoghurt which expires after 21 days stands on the same shelf with a pack of yogurt which expires after 15 days, customers prefer to buy the pack which expires within 21 days. Within the cost–benefit–price triangle, customers prefer the product from which they can obtain maximum benefit and thus fresh stock are sold, while other stocks of the same product generally become stale after a while. The lifecycle of perishable products comprise certain key rings. Absence of even one ring disrupts the sustainability of the chain. To this end, optimized solution of the problem is very important in terms of sustainability concerns and reduction of waste amount. In this sale cycle, consumers buy freshest product and the stalest products become waste and are separated from other products as they remain unsold when their shelf-life expires. In this system flow, evaluation of customer demands reveals that certain stalest groups of products have to be continuously considered as waste.
In today’s information age with increased social awareness, it has become a must to display more environmentalist approaches and make future plans considering the changing food needs of consumers. Management of perishable products in particular is harder than other types of food in terms of the quality loss occurring in time. It is estimated that approximately 33% of food products become waste and are lost every year. The amount of product loss particularly originating from the damages and spoilage on shelves or in stocks is assumed to be around 15%. Consequently, spoilage in food products occurs at serious levels [9,10,11]. In addition, excessive use of today’s limited natural resources may cause difficulties and limitations in the production of products in the coming years. Then, how can we achieve a decline in the cost originating from loss of products and ensure a sustainable life cycle of food products, starting from the date of production to the date of consumption? Thus, the present study aims to include the effect of freshness status of the perishable product stocks on their prices during simultaneous sale of perishable products arriving the organizations at different times upon order. In other words, this paper is set to determine sale prices of the same product group, when different stocks with different freshness status are offered for sale simultaneously. At this stage, multiplier effect of products’ staleness rates on each other is analyzed and a new point of view will be offered in respect to the customers’ attitudes towards price-freshness-purchase. The present study also seeks to provide profit maximization with a new mathematical model to be developed in consideration of the multiplier effect imposed by remaining shelf lives of products on the pricing of each product on others. To this end, a mathematical model of the system is created and the model is solved with GAMS software program within the scope of the study.
2. Literature Review
The concept of Revenue Management is widely defined as selling the right product to the right customer at the right price in the literature. The literature review revealed that various previous studies treated many different important parameters as separate constraints and examined the effect imposed by these constraints as a whole on revenue management. However, the literature review offers no study analyzing the effects of variations of product with different significance levels on each other’s sale rates, under the same constraint.
The literature review is taken with a general point of view up to 2005 considering pricing strategies of different product groups. The studies are contributed to the literature by introducing different points such as price sensitive customer approach, return products, stock levels and also seasonal products. Although Elmaghraby and Keskinocak [12] provide a detailed review of dynamic pricing in different scenarios for different inventory situations and customer classification, the same area continues to be discussed in recent years [4,13,14,15,16,17,18,19,20,21]. However, the discounting and replenishment decisions are not modeled in these studies, except Geoffrey et al. In addition to these areas of works, some studies categorized the selling price time periods into terms; however, generally short term is preferred [22,23,24].
Liu and Milner [25] consider a dynamic pricing problem for multiple items under a selling season constraint and common price constraint. They found it necessary for sellers to offer their products at the same prices with respect to the continuous time pricing with stochastic demand. Their studies highlighted the trend of prices of the products to fall down with the stocks decreasing, although the prices of the products are expected to increase with declining stocks under normal conditions, as there is variety of demand rates for alternative products.
Modarres and Sharifyazdi [26] focused on stochastic capacity distribution problems in the production systems. They reported that the capacity is limited or variable; demand has a stochastic nature and problem definitions entail different customer classes. The customers are grouped into two groups as frequent and occasional customer. Various penalty fines are classified for order cancellations due to overbooking. Optimum solution of the problem is found by developing a mathematical model to optimize the revenue management for two different customer classes and stochastic capacity.
Aydın, Akçay and Karaesmen’s study [27] analyzed the single items revenue management under multiple-item demand. In this paper, optimal outcomes are defined as a finite event. In addition, a mathematical model is developed to optimize the RM under the concerned constraints and the stock is assumed to be certain for single-item. Furthermore, periodical pricing policy is analyzed for the same year. The selling seasons of the products are divided into T periods, and also these periods are assumed independent from the customer arrival which has Poisson process. The system is analyzed with MNL Model using by Bayesian Learning Method. Another study conducted by Koening and Meisser [28] compared list price capacity control policy and dynamic pricing policy which also reflects the costs of price change. The list price policy is determined more beneficial in the conclusion.
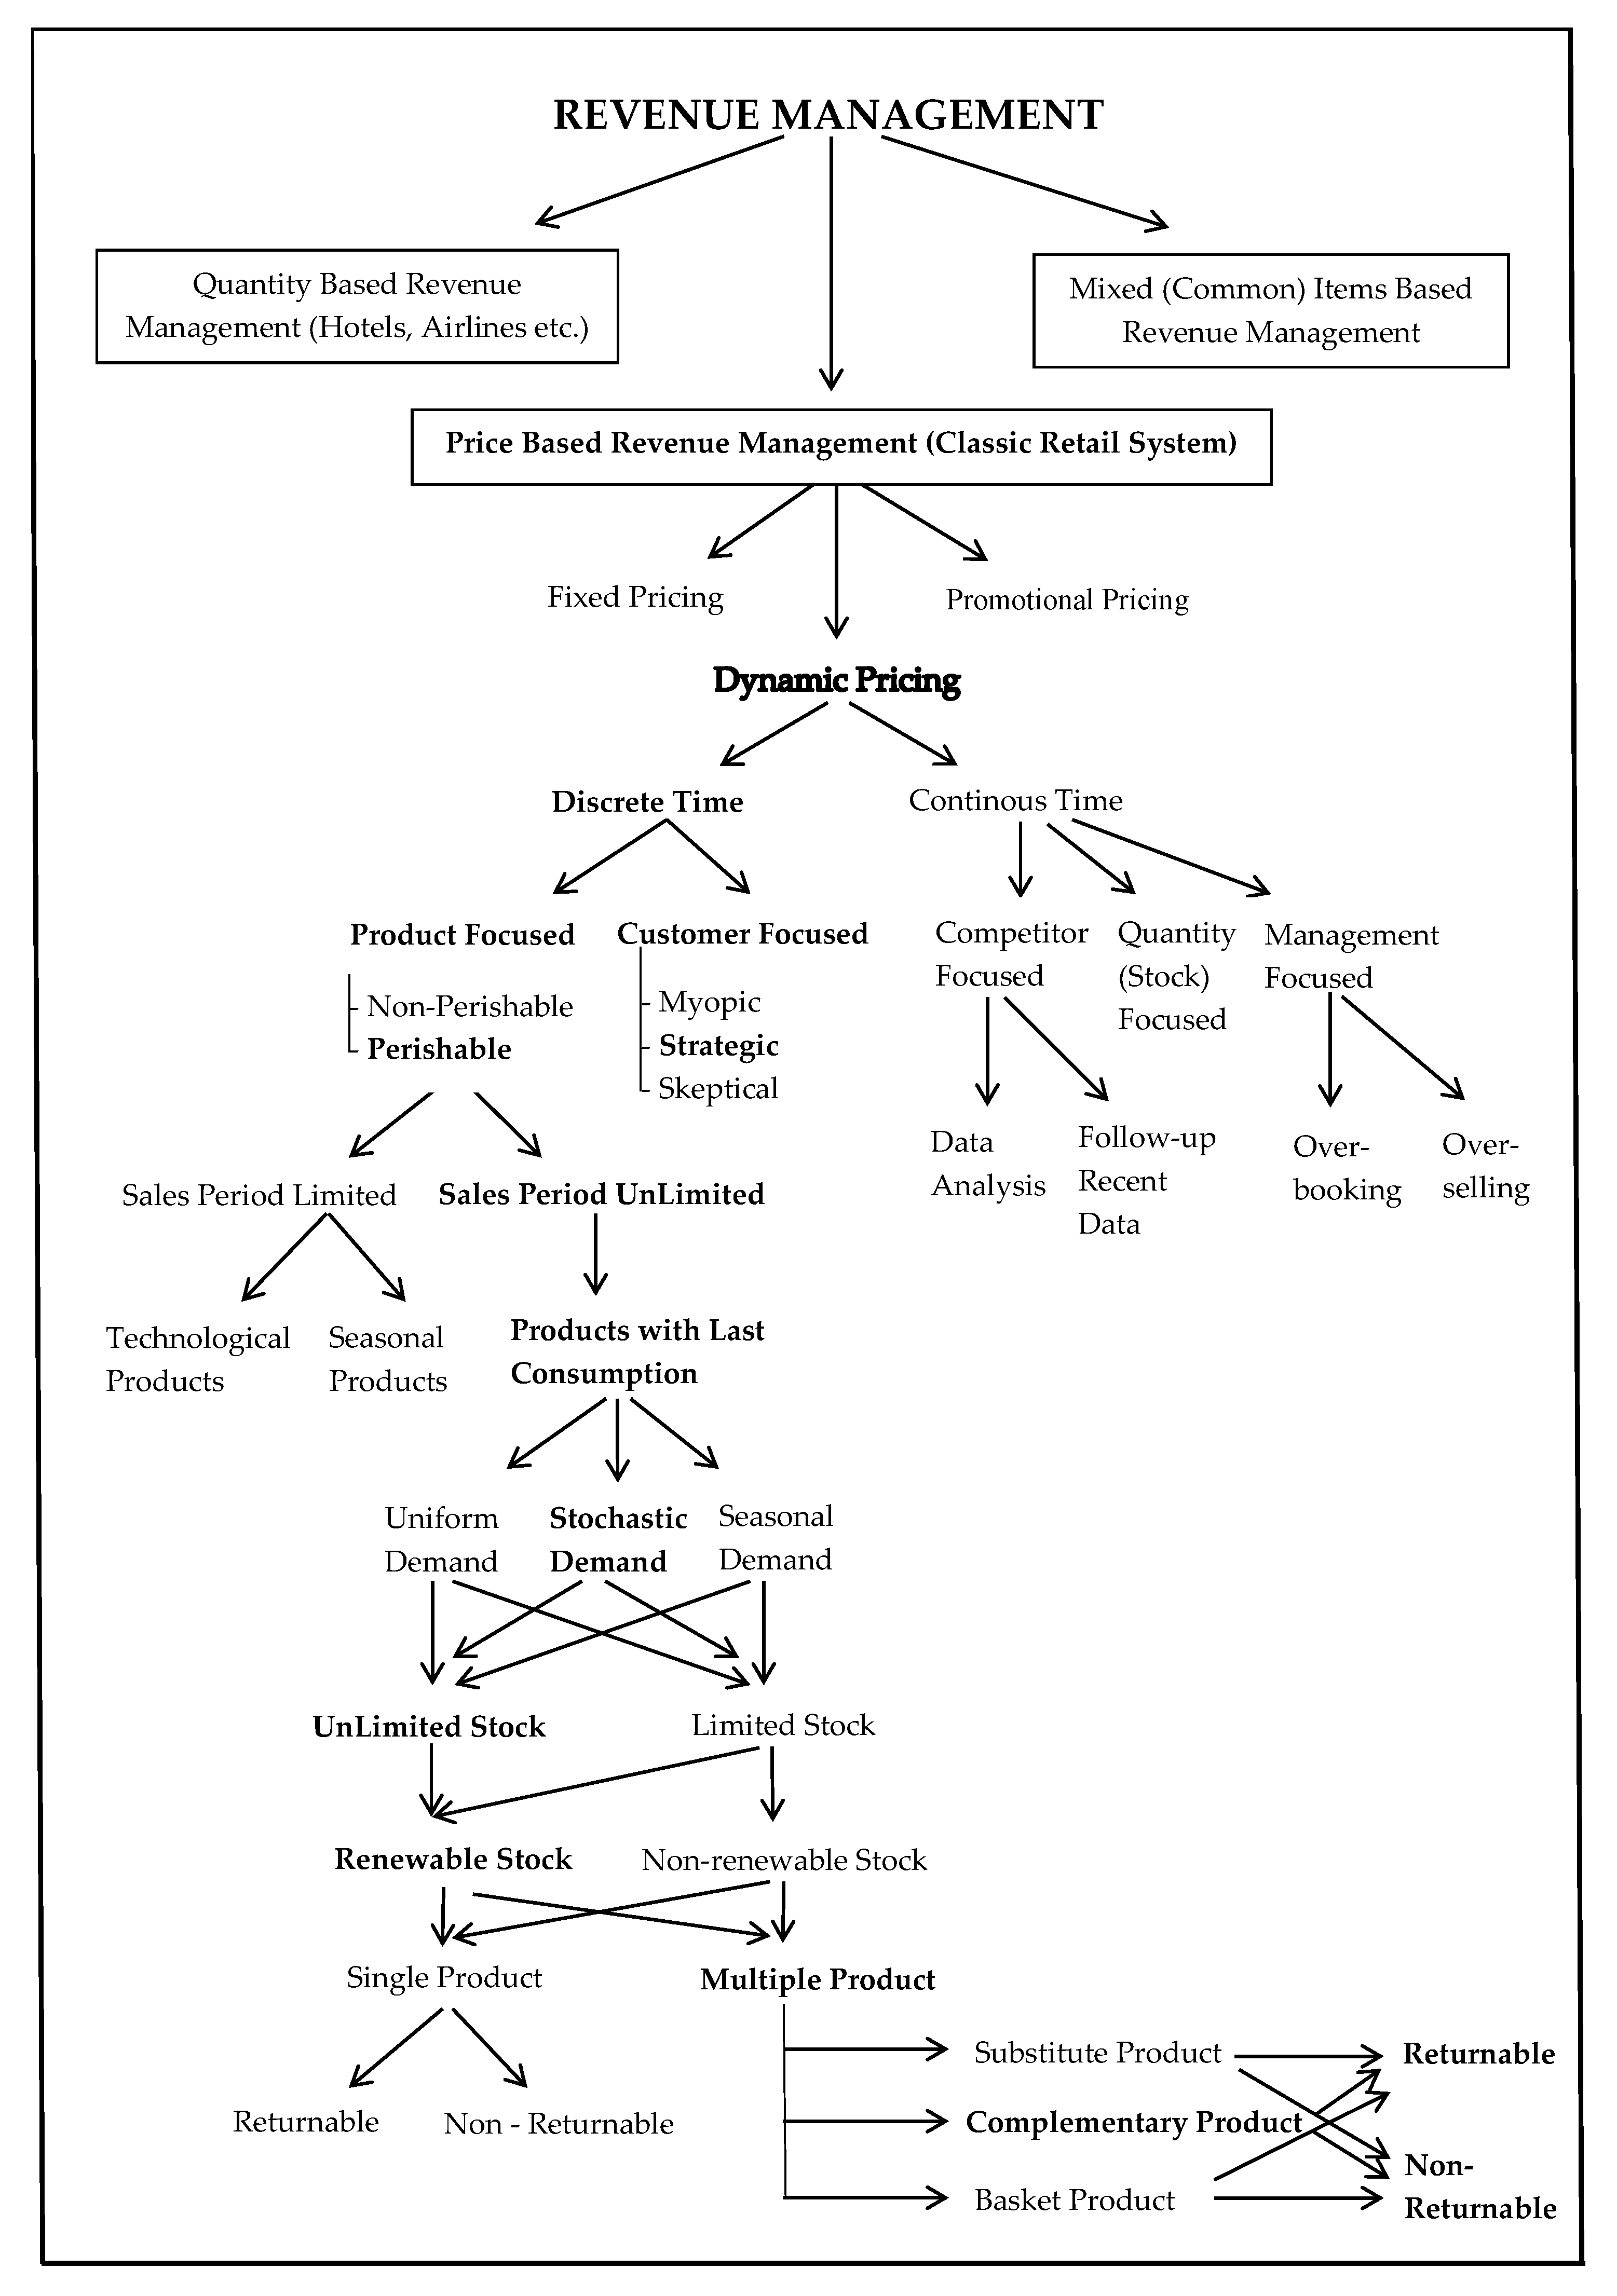
After 2010, most of the studies have focused on getting higher profitability and spoilage reduction. In addition, the customer payment willingness is assumed fixed and the product returns are ignored. However, ignorance of the business conditions of enterprises can be also determined as a loss of important data. The review articles are considered as the source of this information [29,30,31,32]. Recently, some researchers try to reduce the amount of perishable products spoilage by using dynamic pricing. The effects of some factors such as price elasticity and age-sensitivity of demand and age profile of initial inventory are modeled via deterministic mathematical modeling. The price discounts are differentiated via scenarios, and the effects on total revenue and waste are determined in detail [20,21,33,34]. The summaries of the reviewed articles are discussed in detail. Thus, all studies are categorized to transform the sub groups of the system traits and key features into a schema as a taxonomy, as seen in Figure 1.
The present literature review first shed light to the revenue management in general and moved towards dynamic pricing activities in the retail sector, thus it is revealed that customer’s buying attitudes may be manipulated through new strategies. More specifically, a customer who is not planning to buy a certain product may buy it under the influence of the promotion activities. On the other hand, when a customer already has the plan of buying a certain product, the cost of the promotion activities addressing to this customer may seem to be unnecessary, as the customer would already buy it without the promotion in the scene. Thus, further studies may be conducted on instant follow-up of customers in the retail sector and dynamic pricing of the products based on customers [4].
Retail sector offers a wide range of products, as seen in the previous literature. Because it shelters many different systems, the dynamic of the system is very difficult. This present literature review, which first shed light to the revenue management in general and moved towards dynamic pricing activities in the retail sector, revealed that customer’s buying attitudes may be manipulated by new strategies applied. More specifically, a customer who is not planning to buy a certain product may buy it under the influence of the promotion activities. On the other hand, when a customer already has the plan of buying a certain product, the cost of the promotion activities addressing that customer may seem to be unnecessary, as the customer would already buy it without the promotion in the scene. Supermarkets, which have a very important place in retail sector, are becoming increasingly complicated daily, because of the difficulty of tracking customers’ different profiles simultaneously, product diversity and intensive stocks they have. While advance studies on balancing revenue management activities continue, the literature review unfortunately yields no result for studies where different variations of the same product or each different stock of products in the same discount groups with different dates of entry to the stock are considered as a constraint in sale policies.
Thus, the main contribution of this study is to include the effect of freshness status of the same/different perishable product stocks on their prices dynamically during simultaneous sale of products arriving the organizations at different times upon order. At this stage, multiplier effect of products’ staleness rates on each other, which has not been considered yet in the literature, is analyzed. In addition, all new model parameters used in this study are shown in bold form in Figure 1 to classify the differences of this paper among others. In addition, the differences between the proposed work and the previous works are clearly presented in details in the Section 3.
3. The Relationship between Revenue Management and Products Life Cycle Sustainability
3.1. General System and Pricing Policy in Supermarkets
In general, supermarkets operate in line with a similar sales policy that is common nearly all around the world. This sales policy foresees placement of least fresh product at the front of shelves by the organizations, when they have different stocks of a product with different freshness level, thereby increasing the possibility of customers buying the older stocks. The real intention behind this management practice is, in its simplest term, the application of FIFO rule. This rule requires the organization to sell the products of older stock before the products which enter the inventory at a more recent date. The primary objective of this practice is to allow the organizations to finish their old stocks by selling them. If it is not possible to finish stocks of a particular product group through pricing policy, minimization of wastage rate of product is the primary priority to be followed.
However, organizations tend to decrease the wastage rate and increase their revenue by applying a common pricing approach for all different stock groups. This practice encountered widely in daily life has nearly lost its effectiveness in practice due to the diversity of strategic customers’ attitudes to purchase. While strategic customers tend to purchase the newest stock of a product among the products with different freshness status on shelves by checking their dates, the organizations aim to sell the stale product for the best price in best sale amounts. However, this balance has been disrupted and wastage rate of products has started to increase due to the customers’ attitudes to purchase [8]. At this point, organizations started to increase their efforts in stock management activities within the organization. Under this management style, many markets refuse to place products of different stocks entering the market at different dates on the same shelf. Instead, they place one and only one stock group of a particular product on respective shelf and keep it there until the stock becomes outdated [4].
This sales policy causes spoilage of newer product groups while older product groups are offered for sale on shelves. This prevents the sale of products despite the decrease in their freshness level and continuous presence of products with certain freshness level. The literature review underlines an assumption that all stocks of a given product have the same level of effects on pricing policy to be followed. This is to say that the effect of product groups with different shelf-lives on each other is ignored. The important point here is to sell the products in stock for the best price before they are spoiled. Thus, in the context of a revenue management problem, to what extent does pricing the same products with different shelf life and displaying on different shelves affect the system efficiency?
Displaying the same products with different prices on the shelves simultaneously is still not an approach we encounter today in daily life. The pricing approaches applied by supermarkets are based on the principle of determining a common price for all stocks of a certain product. However, in the case of perishable products in real life, remaining shelf lives of orders and the products in stock are very important for the managers of the organizations [10,13,30,35]. Although the pricing policies is very important for the shelf lives of the products in stocks, organizations review their stock policies with the increasing amount of products spoiled in the stocks. However, it is possible to sell out the remaining stocks with a different pricing policy.
3.2. Dynamic Pricing Problem
Perishable products clearly have the highest intensity rate in supermarkets. An analysis of their stock cycle speed and profit margins reveals that one of the most important factors that affect the profit of organizations is to determine the correct amount of stocks and proper pricing policy. The customers who purchase perishable products are very responsive towards price sensitivity. This is to say that customers prefer to purchase or not to purchase perishable products by calculating the link between their prices and their rate of outdating/decay in the best way. When a product appears on a shelf for the first time, it has a long shelf life. The differentiation in price that is made by organizations with the shortening shelf life directly affects the amounts of their sale.
In daily life, it is seen that organizations apply discounts on such products by considering their increasing perishability and stock status. The customers who perform cost effectiveness analysis of the prices applied by organizations play the most important role in the sale of such products. The biggest problem in these approaches is that, when a discount is made on the product, customers purchase the freshest one on shelves. In general, sellers place products by keeping the stalest product at the anterior sections of the shelves, and placing the freshest ones at the rear sections of shelves. However, conscious customers prefer to buy the products placed at the rear sections of shelves. For this reason, although organizations strive to sell the stalest product, the number of fresh ones of the concerned product decreases in the stocks of organizations [36]. However, how can this problem be solved and how can revenue be managed better by organizations?
Customers are sensitive about the balance between price and shelf life. Selling to strategic customers is more difficult than selling to other groups of customers. Urgency of the need for a particular product sold for a particular price is also important, in addition to the balance between the price and shelf life. To define how much a product is needed by customers, it is necessary to reveal the benefit and cost relationship through product comparisons [16]. For this reason, customers should compare competitors or substitution products. Another important factor that may increase the sales is the evaluation made by customers on the differentiated prices when they see the products with different shelf lives together simultaneously. The present study, in line with the above-mentioned purposes, seeks to analyze selections/groups of products with different shelf lives in the stocks as separate products. The present study also seeks to provide profit maximization with a new mathematical model developed in accordance with the multiplier effect imposed by the remaining shelf lives of products.
3.3. The Proposed System and System Dynamics
Wide product range and large quantity of perishable products in supermarkets complicate system management significantly. The difficulty and complexity of system management increases the probability of failure by managers in detecting system errors. Looking for system errors at wrong sources and thus development of different and wrong solutions may affect the system performance negatively and further complicate the system. For this reason, the first task should be to make proper and correct system analysis and find correct solutions for the problems. The problem analyzed in the present study is based on the principle of increasing the salability of a product, by decreasing the amount of unsold perishable product and increasing their salability with new promotion/sale techniques in supermarkets, which have an important place in the retail sector. As it is well-known, profitability of organizations needs to be increased to ensure growth and hot money cycle. The best revenue management is possible through proper management of the system with right strategic decisions taken at right times.
Organizations place orders for products to ensure the stock availability within certain time intervals. Ordering the right quantity is one of the most important measures of successful revenue management. This is because over-ordering products may increase operating costs of organizations, while under-ordering may cause speedy depletion of stocks and loss of customers who come to purchase those products. Non-availability of products in stocks is both a loss of profit and also loss of customer confidence. For this reason, achievement of this sensitive balance is not only difficult, but also effort-consuming.
Under increasing competitive conditions, each organization must fight against their rivals, increase their profits and become preferable for customers. For this reason, the decision process is very important as mentioned above. Unfortunately, neither the literature nor the daily practice reveals any new policy developed in response to this challenge (a certain product’s different stocks with different shelf lives). Thus, the present study tries to develop different price policies for different stocks of a certain product, which arrive at organizations at different dates, and have different shelf lives. Firstly, the study differentiated stocks of the same products and formed different product groups. Having departed from the assumption that the prices of these diverse groups are affected from each other’s freshness status, the product prices are differentiated for different stocks. Customer’s purchase attitudes towards the products with different freshness status at different prices are analyzed again, and it is concluded that this method could decrease the cost of stale products and accelerate the product stock cycle. To this end, a mathematical model of the system is created and the model is solved with GAMS software program.
This software program made it possible to solve the mathematical model and to price different stocks of a certain product in accordance of their freshness status. This also helped to eliminate the problem of customer’s buying the freshest product at the same price. In addition, it is proved that newly arrived stocks directly affect the customer attitudes towards purchase.
The abundant amounts of products on shelves create difficulty in making discount for such products or the obligation to sell the fresh products at lower prices due to the high amount of unsold stale products and lead to inefficient use of products from the revenue management point of view. This limits profit margin. However, selling different subgroups of the same product at different prices is a key detail, which might change the customer attitude towards purchase. Unfortunately, this key detail has been ignored so far. This point of view would produce a certain level of irresistible profitability for managers with strong business experience. The mathematical model produced is solved after being encoded with GAMS. All results obtained from the developed solution are explained in detail in the following sections.
4. System Modeling and Formulation
4.1. System Design
The new system made it possible to conduct age categorization of stocks (separation of product into different stocks and thus determination of different shelf life). This allows the products with different shelf lives to have different prices. This, in return, will make it possible for customers to make comparisons among products. Wastage costs of the products whose self-lives are about to expire and not sold sometimes reach serious levels. However, when spoilage losses increase, organizations firstly question appropriateness of the size of the order placed for the concerned product.
However, most of the time, the first mistake is to decide on size of the group ordered based on follow-ups of the stock cycle speed again. Actually, what needs to be done in such a case is to implement new pricing strategies and different sale techniques, instead of revising the size of the groups ordered through controls of the stock cycle speed. This would allow organizations to increase their revenue and profit rates, as well as enhance the efficiency of the sale and stock cycle of products. Staleness degree of products has exponential distribution. In other words, the lengths of time within which products remain on shelves decrease their preferability for customers. For this reason, the preferability of products decreases in parallel to declining freshness status.
The dynamic promotions in the prices of products directly affect customers’ attitudes towards purchase. This approach increases revenue earned, but it brings limited improvement on profit of organizations. This is because sale rate increase continuously occurs on products with high freshness status to a certain extent. However, the real issue, in the opinion of the organization, is the need to increase revenue by increasing the sales of products about to become stale, and accordingly to decrease spoilage costs through these sales and increase the profit.
4.2. Scenario Definition
Under the present study, dynamism of pricing system modeled with GAMS software program varies according to the staleness degree of product stocks. The present study explored two different scenarios in line with differences among stocks in terms of age profiles (freshness status) and different dynamic pricing strategies. These scenarios sought to maximize profit by using different pricing formula.
In the first scenario, pricing is made dynamic with the assumption that pricing of each stock of a product is affected only by its own staleness degree.
The second scenario assumed that staleness degree of different stocks of a product on shelves simultaneously has multiplying effect (all stocks on shelves are affected by the staleness rate and their prices are determined accordingly).
In the third scenario, the freshness rate of different products stocks, which are determined in the same discount group by the supermarket managers, affect each stock’s price dynamically. The decision of the related products is very important for low pricing type. The last scenario is inspired from Turkey’s real applications in the supermarkets. In the last day of the perishable products, markets want to sell total amount of the stocks to the wholesale buyer instead of selling to the customer one by one. These types of customers (wholesalers) are usually patisseries and bakery markets. Alternatively, sometimes the supermarkets use their own nearly perished products to cook some fresh foods in their patisserie department. To sell all in the last day instead of being wasted, the markets price this type of products at very low (deep) price. The results obtained through these scenarios are compared with the real size of the order (stock amount), sale prices and sale amounts of a real and big supermarket with high profit margin in Turkey. The system comparisons based on the findings obtained are presented in the following tables and figures.
The present study analyses the impact of dynamic pricing on total sale amount, total profit and spoilage amount. It is assumed that the system operates continuously and it can be renewed under deterministic demand within a determined period of time (orders are placed continuously) and the demand has price elasticity. The degree of response shown by consumers (sensitivity degree) to changes in price in the form of changing the amount of product they buy is defined as price elasticity of demand. In the present study, elasticity of price is provided with a coefficient.
At the stage of modeling, perishable products, their stocks and the number of days they have remained on shelves are stated separately. It is assumed that the product does not have starting stock and that the number of product stocks is controlled separately every day. The intervals between the orders are not fixed. In addition, it is assumed that the duration within which orders are delivered to supermarkets and the sizes of orders are variable.
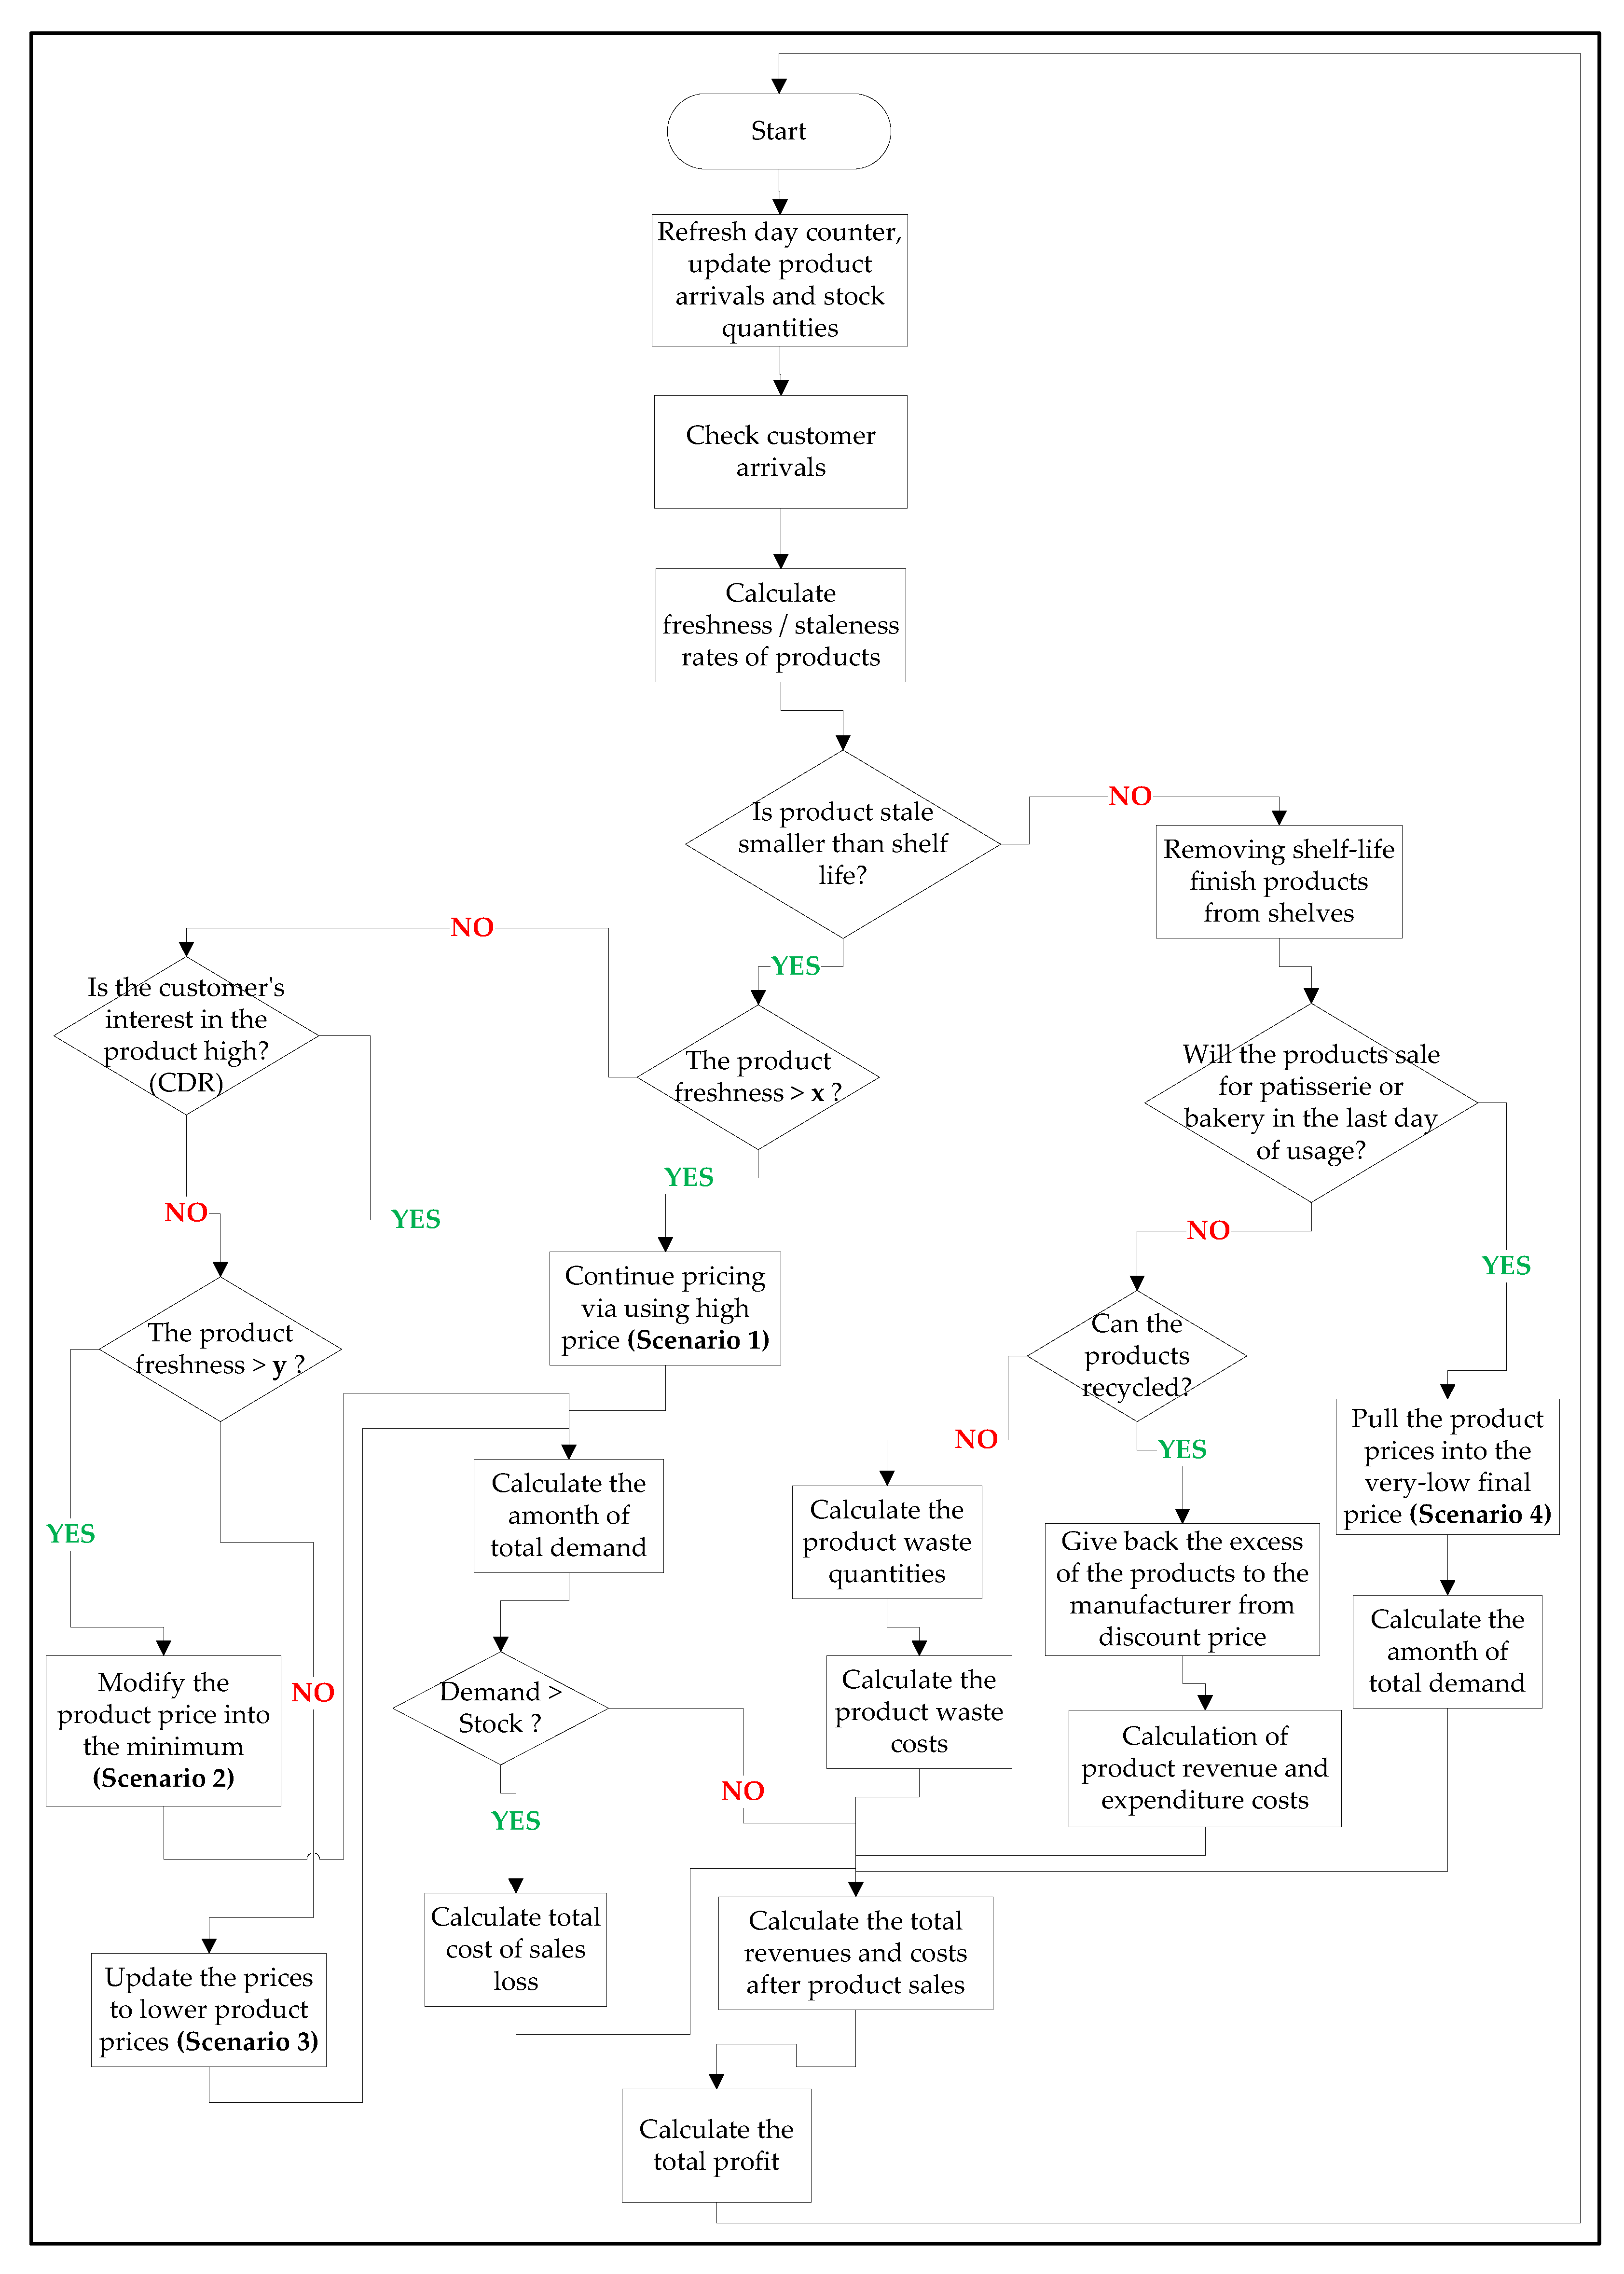
The products with 0 shelf-life and the unsold ones are defined as stale products and they are removed from shelves. For this reason, different stocks of products are sometimes displayed on shelves simultaneously, and same group stocks of a product with the same shelf life are sometimes displayed on shelves together, as well. The work flow of different scenario based models is shown in detail in Figure 2. The system of the proposed model continues to work until the end of the market decision period. In addition, the limits of each product freshness rates, such as x and y, are determined by the supermarket’s top managers depending on the products sales rate. Thus, every product life cycle sustainability and customer attitudes change in different scenarios.
4.3. Problem Formulation
The objective of supermarkets is to maximize the expected profit. However, the revenue management system of the markets has several different significant constraints. Thus, the system is so complex and it should be strategically managed. The aim of this paper is to mitigation of spoilage rates of perishable products by applying dynamic pricing strategies. Thus, the system is conducted with a deterministic model approach in consideration of various factors, such as interaction between freshness/staleness degrees of different groups of products, elasticity of demand against price and sensitivity of demand towards freshness degree. All the indexes and notations of the proposed model are shown as below.
Indexes
| Product index | |
| Stock index | |
| Time period index |
Parameters and Variables
| The freshness rate of the product inventories | |
| The total rafted time of the product | |
| The duration of the transportation delay | |
| The shelf life of the product | |
| Total daily product demand | |
| Total daily customer demand | |
| The number of total stocks on the date of t | |
| The total unsold inventory of the product on the last day of its shelf life | |
| The total demand of the product stocks during their shelf lives | |
| The total amount of the products entered into stocks from supplier | |
| The total number of the unsold/perished products | |
| The number of customer arrivals to the supermarkets on the date of t | |
| Number of the unmet customer orders during product shelf life | |
| The number of the daily unmet customer orders | |
| The unit price of the product’s waste cost (product return cost from supermarket to the manufacturer or directly idle product cost) | |
| The unit price of the product setup cost | |
| The unit price of the products holding cost | |
| The unit unmet price of the products | |
| Total daily demand rate by customer arrivals | |
| Binary variable for setup costs of the products [0, 1] | |
| The purchasing price of the product stocks | |
| Deep selling price in very low customer demand and freshness rate | |
| Low selling price in low customer demand and freshness rate | |
| Medium selling price in average customer demand and freshness rate | |
| High selling price in peak customer demand and freshness rate | |
| Fixed selling price of the product stocks recommended by supplier or manufacturer |
Constants
, , , , , , , , , , ,
The staleness degree of products is calculated by dividing the number of days a product remains in stock to its sell-by-date. Freshness degree can be easily calculated by deducting from 1. This constraint is the most important criteria in determination of different price values to be given to different stocks in particular. During concurrent pricing of more than one stock group, the freshness degree of each product inevitably and dynamically affects the prices of other stock groups, through multiplier effect.
The number of perishable products is very high in supermarkets as mentioned previously. For this reason, the present study applied constraints on product structure/specification. The products with more intensive wastage rate are identified, and generally sale of perishable products is more problematic for supermarkets, which negatively affects profit margin. For this reason, the study is expected to cover products with a maximum remaining shelf life. In other words, the study attempts to perform production categorization under this constraint. All the notations for new system design are shown in Figure 2. In addition, the study covers fast-moving consumer goods. For this reason, shelf life should not be more than q days.
The value range accommodating prices should be kept limited when the prices of products are calculated daily as they change dynamically. This limits the extent to which the minimum selling price of product can be lower or higher than its purchasing price; in line with the rates to be determined by top management of supermarket. In addition, the initial sale price of product may be determined by organization accordingly.
Customers create a certain demand after they evaluate the freshness degree of all stocks made available for the product on that day and the dynamic price charged for the product by the supermarket.
In other words, the total demand occurred for the product within the implementation period is the total demand shown for all stocks of the product within time intervals specified.
If the product groups in the stocks are bigger than the demand, the products will become stale. This is very important for supermarkets as it incurs return or wastage cost. The account of stale products is formulated as follows.
If the amounts of product groups regularly ordered by supermarkets are lower than the amount of demand, the supermarkets will not provide the products desired by customers. This indicates that the maximum revenue cannot be achieved. This is to say that the organizations will suffer loss from their revenue.
The number of customers visiting supermarkets and shopping or leaving without shopping varies from day to day. This constraint is applied in order to reveal the link between the number of daily visits paid by the customers to supermarket and the number of products sold. Thanks to this constraint, increases and decreases in sales will not be taken alone on daily basis. This constraint serves as a dynamic input for the system by measuring the attention showed by customers to pricing, in other words, the performance of customer attitudes formed in response to pricing. Calculation of sale rate based on the number of customers visiting supermarket daily, which is missing in evaluations, will make it easier to evaluate revenue more efficiently. The study will include this constraint to the evaluation during the determination of discount start time of product. The management of organizations operates the system dynamically by deciding on scenarios to be implemented on prices in line with this constraint.
The amount of stocks is one of the important factors which affect the customer attitudes to purchase and organization’s profitability (in terms of whether the orders placed are used efficiently or not). Stock status is among the determinants of sizes of order groups and frequencies at which orders are placed.
The price including the discount made by supplier in cases of high amount purchased is formulated as follows:
In the cases of high purchase amounts, the costs of keeping products in stock are variable for organizations. Pricing policies determined in accordance with the degrees of freshness, staleness and customer demand at different times are very important for profitability of companies. Different dynamic scenarios planned to be implemented at different times are defined as follows.
The first thing to be determined as the decision variable of the mathematical model is the price of products. These prices will play a determinant role in the model in line with the demands shown for the freshness status and products. When the degree of freshness of products or demand of customers for products decreases, top managements of supermarkets decide to implement various price policies (scenarios) for the purpose of boosting their sales, as seen in the Table 1. However, the present study seeks to determine the prices easily by using the model created under the above-mentioned constraints. To this end, the dynamic product pricings with formulas that belong to the scenarios developed are calculated under the model and presented to the customers. In this regard, the prices given to products under various constraints are formulated as follows.
The new pricing approach described above is re-formalized for minimizing customer preference of the freshest products as a result of joint and concurrent pricing of various groups of products (substitutions). It is a common customer practice to choose the freshest products/groups when they all have the same price. This pricing formula is based on the assumption that product interactions and freshness of degradable products are exponentially distributed. However, when supermarkets differentiate the price of each group of products, it could decrease the amount of unsold products.
The present study seeks to increase the sale of products by differentiating the prices of product stocks with different features at the right extents and amounts. In addition, another innovative aspect of the present study, which is not present in other studies, is that different freshness degrees of different groups of products affect each other’s freshness degrees and thus decrease sales (affects the purchase attitude of customers significantly). It is very important that these products, which interact with each other in ways that cannot be ignored, are sold for dynamic prices and offered to customers at the right time, and with the right strategies.
The real objective of the present study is to sell perishable products whose shelf lives are close to the end at the very best prices and with the best product stock combinations. The other objectives of the model developed under the present study are to enhance the potential to sell products to customers and thus minimize the returns of products and spoilage costs of products, all of which, in return, will furnish supermarkets with a sale and pricing policy which can bring highest profit. Sub-functions of the objective function can be described as below. The objective function is not only to maximize the revenue, but also to minimize the cost at the same time. The unique decision variable of the system is product price in this model.
4.4. Numerical Simulation
In this section, a case study is carried out for clear understanding of the system. Four different scenarios are used to show the results of the dynamic selling price cases. Price discounts are defined according to the freshness of the products and customer density function. Thus, the system compares the real-time pricing methodology and scenario based cases. The proposed model data are given in Table 2, Table 3, Table 4 and Table 5. All cases are compared with each other in the following parts.
Four product samples with a shelf life of 6–15 days are selected as an example for this part. The product arrival time is taken as three days for the first and third products, four days for the second and two days for the last one. In addition, some more information is given in Table 6. All scenarios are simulated via GAMS for different time periods. The positive improvements or negative effects on revenue, cost and profit are explained in the following parts. The operation times are tried in long term for 30 days. At the end of the assessment, the effects of different pricing scenarios on the product prices are shown in the following Tables and Figures.
All type of products has different setup, waste and holding costs. In addition, if the customer demand is not being met because of small amount of stock/order, the costs for each sample products are defined in Table 2. The numerical simulation is made for four complementary milk products in the supermarkets. The costs and profits balance from the sale of four sample perishable products, which are generally preferred together by the customer shopping, have been determined according to the respective price policies. Amount of orders for ten different groups of products is given in Table 3. Due to inflation and so on, the purchase price of each product stocks varies in the markets, as seen in Table 4. Customer demand is used in the system modeling for 30 days, although customer demand rate is given for 12 days as a sample in Table 5.
All the real life parameters and data are used in the numerical simulation part. The customers buy these products together or individually every day in 30 days. Although the total demands of each product are given in Table 7 for a month to show the data used in real life pricing type, the customer demands on different stocks of each product are classified in Table 6 to show the differences between this paper and reality. For instance, the demand of second product on ninth day is totally 23, as clearly seen in Table 7.
However, the products chosen by customers have three different stock types: seven demanded for first group; six demanded for second; and 10 for third group of the product. The first product is selected as an example to show that how the price is changing from the initial price to the end. It is clearly seen in Figure 3 that high pricing strategy and low one follow a similar path after the freshness rate of 0.33 (after 11th day of its shelf-life). Thus, when the staleness rate is getting higher, the pricing strategies are working in the same way. In addition, the medium pricing strategy and very low (deep) one reach the same price at the end of life cycle of the product. All other products, 2–4, have the similar solutions as the first product. All other product prices have the same way trend, as seen in Figure 3 and Table 8, Table 9 and Table 10.
It is clearly seen from the proposed model data that high pricing is decreased slowly daily. The initial price of the products is decreased approximately 30%–35% at the end of the shelf-life in high pricing strategy. In medium pricing strategy, the price of the products is decreased suddenly after the freshness rate 0.5. When the staleness rate nearly reaches 0.75, the second sharp pricing promotion is used to accelerate the sales of the products. This pricing depends on the freshness status of the same product stocks. Thus, every different stock of the same product on the shelves effects the pricing of others to differentiate the product stocks.
The other case, as compared with this first two strategies, is low pricing. This promotion type has a group of complementary products in the milk product department. The top managers in the supermarkets decide which type of products is sold together more effectively. The freshness rate of all stocks of each product in the same promotion group affects the others dynamically.
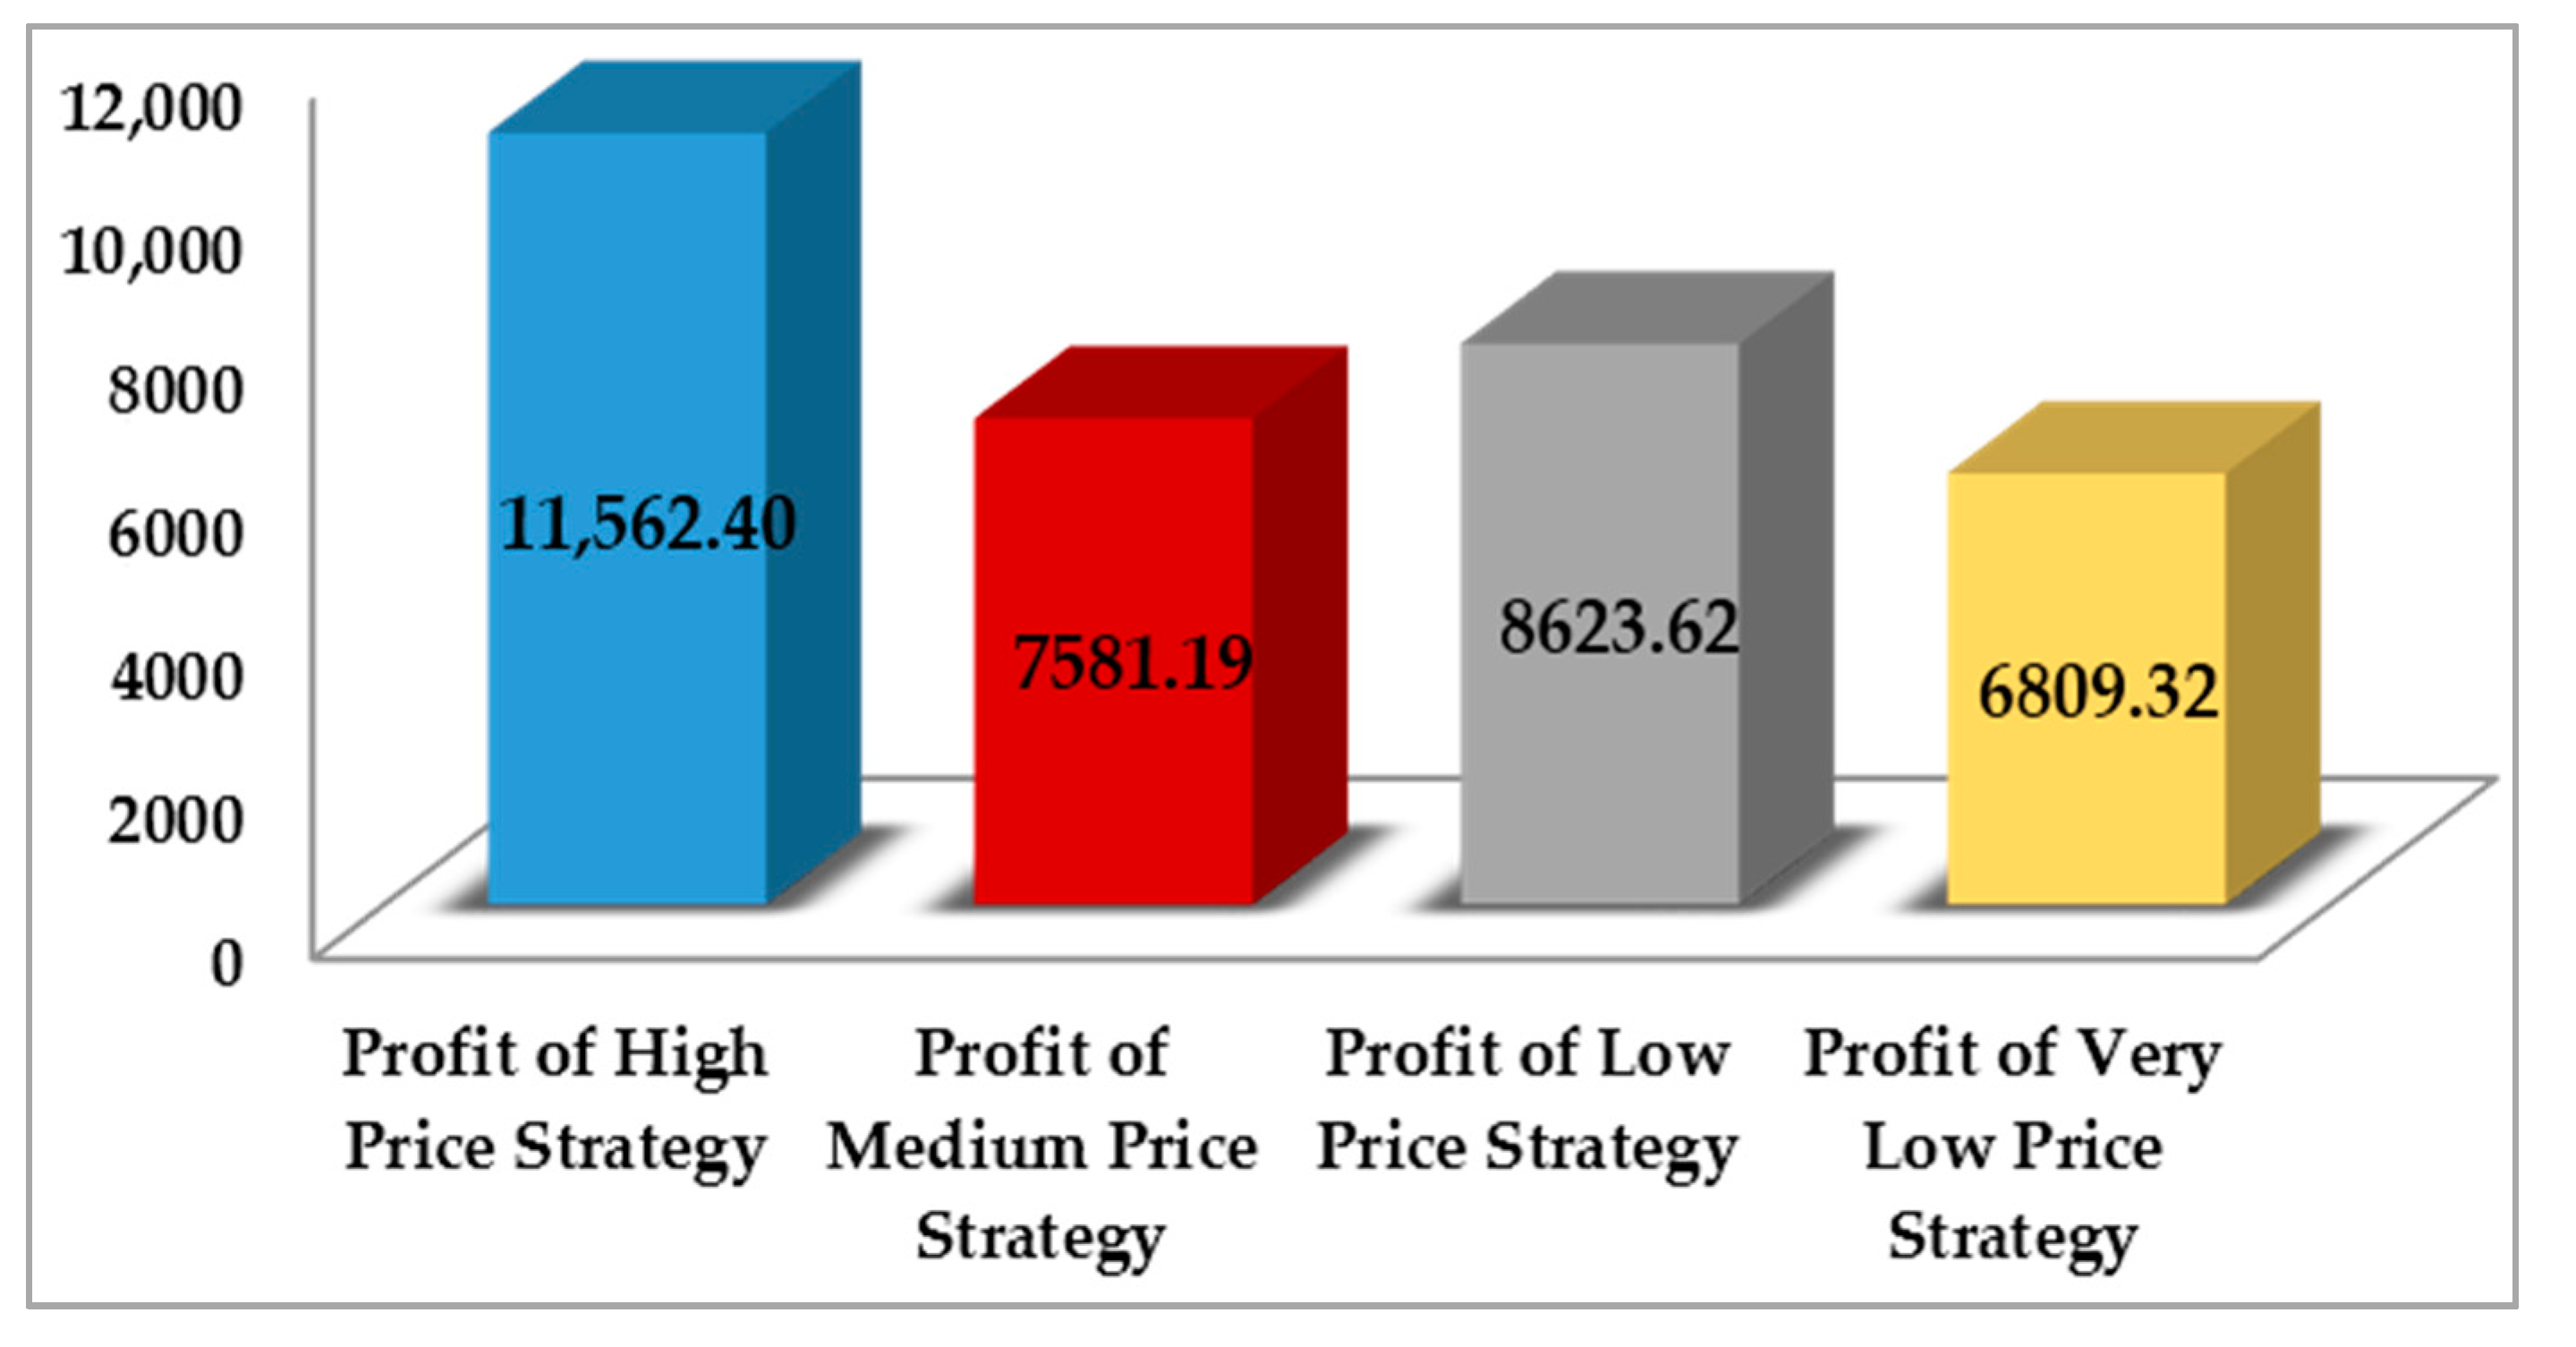
Although low prices and deep (very low) prices of the products are close, the methodologies are different. In addition, deep pricing strategy is just for big customers and applied occasionally when top management decides to use it. Consequently, the most profitable strategy for the supermarkets is low pricing scenario in Figure 4, although small price variation between low and deep pricing is determined in the tables above.
Furthermore, the differences between the common and the proposed systems for supermarkets are compared with each other. It is clearly determined in this paper that total profit of scenario 3 (low pricing strategy) is increased, while the total cost is decreased approximately 98.5% in the long term, as clearly seen in Figure 5. However, more than 15% improvement is achieved for total profit via scenario 3. Moreover, numerical simulation results are defined with figures to show the effects of the proposed system in detail. It is clearly seen that although very low-price strategy is the most preferable strategy for the customers, it is not so useful for the supermarkets (because of profit balance). Therefore, low price based scenario is more profitable for both sustainable nature balance and sales sustainability in real life.
5. Results and Discussion
Under the present study, a new perspective of dynamic pricing strategy is introduced and the relationship among product price, total profit and costs of stale products is analyzed in detail. All sample combinations of different parameters are tested through GAMS software, which is widely known and used in scientific applications. For this reason, in daily life, products are priced by company managers without consideration of the stock differences. Then, freshness degrees of the products on shelves and their general stock status are considered for developing various promotion strategies and price breakdowns. However, there can only be one price of a product under any condition. Customers tend to prefer products that are more preferable in terms of cost-effectiveness; in order words, the ones with longer shelf lives. However, the intention behind reduced price is to sell the products whose shelf lives are shorter than others as a priority, and thus to minimize the idle cost which occurs due to unsold products. In the system established in the present study, various stocks of the same product and different product groups with different features are defined as subcategories of the same product, with the assumption that staleness degrees of subcategories affect their prices. Thus, presentation of the same products for different prices and customer responses changing according to prices are analyzed through different scenarios. Thus, the main purpose of the study is to implement dynamic pricing for the products with different freshness degrees that are displayed concurrently on the same shelves with respect to the interaction between staleness rates.
The new system is expected to enable organizations to increase the sale rates and decrease the wastage cost originating from stale products and use product orders more efficiently. Moreover, it can be easily conducted from the proposed model that lower price strategy based on the lower product freshness in a short term (for 15 days) leads to increase in the expected profit as well as the new medium price strategy based on scenario 2 in long term (30 days). However, the total cost of the system in scenario 2 is approximately five times higher than scenario 3, as well as two times higher than scenario 4. In addition, high pricing strategy has very high total cost, which is included in very important percentage of wastage cost because of unsold products.
6. Conclusion
The concept of Revenue Management is widely defined as selling the right product to the right customer at the right price in the literature. Especially in recent years, this concept has started to be even more productive and rewarding for organizations, thanks to the revenue management tools and techniques developed. This has increased the interest of organizations in the revenue management activities every day and transformed many management techniques from theory into practice. Retail sector offers a wide range of products. Because it shelters many different systems, the dynamic of the system is very difficult. Supermarkets, which have a very important place in retail sector, are becoming increasingly complicated daily, because of the difficulty of tracking customers of different profiles simultaneously, product diversity and intensive stocks they have. While advance studies on balancing in revenue management activities continue, literature review unfortunately yields no result for studies where different variations of the same/different product with different dates of entry to the stock are not considered as a constraint in sale policies.
In real life, the customer is becoming more strategic than ever before to pay lower prices for their shopping. At the same time, the supermarkets want to sell their products in the most profitable way. Thus, what is the balance of these perspectives in reality? It may be more sales if the markets offer right products in the right prices to their customers when they are shopping. In other words, the customer can choose the products which have limited shelf-life, if they use these products immediately in daily life. For example, if they cook some dessert for dinner on the same day as shopping, they can prefer to buy the milk which has two days left of shelf-life instead of the fresher products on the shelf, if the market offers different attractive prices for each. Thus, a new system wants to be improved to get maximum profitability for both customer and market side, as well as ensure the sustainability of the products in the best way because of limited sources in the world.
Thus, the main contribution of this paper is to decrease of spoilage rates of perishable products by applying different type of dynamic pricing strategies. This study is solved with a deterministic model approach in consideration of various factors, such as interaction between freshness/staleness degrees of the same discount groups of complementary products, elasticity of demand against price and sensitivity of demand towards freshness degree. Different effects of price discounts on customers’ attitudes to purchase, contribution of these effects on total profit are found to be significant. Furthermore, in the proposed system, the wastage caused by stale products and recycle products returning to manufacturer for reprocessing, which are two important parameters affecting total profit margin, thus costs of partial returns are significantly reduced. The renewed dynamic pricing approach treated in the proposed system makes it possible to increase the product sales significantly.
A systematic analysis of the previous studies in the literature indicates the deficiency of study taxonomy about revenue management. For this reason, the present study makes significant contributions to future studies. In addition, the most important benefit of this study is the new pricing policy developed for product stock whose shelf lives are about to expire and generally become waste to increase salability of these product in reference to other stocks of these fresher products. The present study, which is designed to minimize the above-mentioned losses, will seek to minimize the cost of waste, maximize the profit earned by supermarkets from the perishable product, maximize product utilization rates and ensure sustainability of products and stocks as well. Fulfillment of these objectives will increase productivity and enhance the significance of product efficiency and nature-friendly attitudes.
Consequently, although the proposed approach distinguishes aggregate perspective of both customers’ behavior perspective and decision of pricing strategy for supermarket perspective for just four perishable products, more complex scenarios for plural products with different perishable types can be developed. In future studies, new systems can be modeled via the proposed pricing models for more different types of products with different shelf lives and more complex interactions. The deterioration speeds of the proposed products are presumed linearly in this paper. However, different perishable products deteriorate in different speeds generally. Thus, this rate can be assumed nonlinear in the future. In addition, new methodologies under new constraints for dynamic pricing can be examined by the researchers.
Acknowledgement
The authors would like to acknowledge the Scientific Project Unit of Cukurova University (FDK-2016-7561) for full financial support.
Author Contributions
Pırıl Tekin was mainly responsible for the idea and concept of this research. In addition to this, Rızvan Erol contributed to the scientific content of the paper as well as supervising the manuscript. All authors contributed equally to the writing of this paper and also critically revised and approved the final version of the manuscript.
Conflicts of Interest
The authors declare no conflict of interest.
Abbreviations
The following abbreviations are used in this manuscript:
| FIFO | First In First Out |
| GAMS | General Algebraic Modeling System |
References
- Onat, N.C.; Kucukvar, M.; Halog, A.; Cloutier, S. System Thinking for Life Cycle Sustainability Assessment: A Review of Recent Developments, Applications and Future Perspectives. Sustainability 2017, 9, 706. [Google Scholar] [CrossRef]
- Chatwin, R.E. Optimal dynamic pricing of perishable products with stochastic demand and finite set of prices. Eur. J. Oper. Res. 2000, 125, 149–174. [Google Scholar] [CrossRef]
- Bitran, G.; Caldentey, R. An overview of pricing models for revenue management. Manuf. Serv. Oper. Manag. 2003, 5, 203–229. [Google Scholar] [CrossRef]
- Tekin, P.; Erol, R. A Literature Review of Revenue Management in Retail Sectors and the Categorization of Solution Methods. 2016. Available online: http://ieeexplore.ieee.org/abstract/document/7920235/ (accessed on 26 July 2017).
- Zhao, W.; Zheng, Y.S. Optimal dynamic pricing for perishable assets with non-homogenous demand. Manag. Sci. 2000, 46, 375–388. [Google Scholar] [CrossRef]
- Lin, K.Y. Sequential dynamic pricing model and its applications. Nav. Res. Logist. 2004, 51, 501–521. [Google Scholar] [CrossRef]
- Nojavan, S.; Zare, K.; Ivatloo, B.M. Optimal stochastic energy management of retailer based on selling price determination under smart grid environment in the presence of demand response program. Appl. Energy 2017, 187, 449–464. [Google Scholar] [CrossRef]
- Lippman, B.W. Retail revenue management competitive strategy for grocery retailers. J. Revenue Pricing Manag. 2003, 2, 229–233. [Google Scholar] [CrossRef]
- Liu, X.; Tang, O.; Huang, P. Dynamic Pricing and Ordering Decision for the Perishable Food of the Supermarket Using RFID Technology. Asia Pac. J. Mark. Logist. 2008, 20, 7–22. [Google Scholar] [CrossRef]
- Chew, E.P.; Lee, C.; Liu, R. Joint inventory allocation and pricing decisions for perishable products. Int. J. Prod. Econ. 2009, 120, 139–150. [Google Scholar] [CrossRef]
- Nagare, M.; Dutta, P. Continuous Review Model for Perishable Products with Inventory Dependent Demand. 2012. Available online: http://www.iaeng.org/publication/IMECS2012/IMECS2012_pp1513-1517.pdf (accessed on 26 July 2017).
- Elmaghraby, W.; Keskinocak, P. Dynamic pricing in the presence of inventory considerations: Research overview, current practices, and future directions. Manag. Sci. 2003, 49, 1287–1309. [Google Scholar] [CrossRef]
- Bao, J.; Lee, C.; Lee, L.H. The value of electronic marketplace in a perishable product inventory system with auto-correlated demand. OR Spectr. 2007, 29, 627–641. [Google Scholar] [CrossRef]
- Piramuthu, S.; Farahani, P.; Grunow, M. RFID-generated traceability for contaminated product recall in perishable food supply. Eur. J. Oper. Res. 2013, 225, 253–262. [Google Scholar] [CrossRef]
- Piramuthu, S.; Zhou, W. RFID and perishable inventory management with self-space and freshness dependent demand. Int. J. Prod. Econ. 2013, 144, 635–640. [Google Scholar] [CrossRef]
- Chew, E.P.; Lee, C.; Liu, R. Optimal dynamic pricing and ordering decisions for perishable products. Int. J. Prod. Econ. 2014, 157, 39–48. [Google Scholar] [CrossRef]
- Ozkan, C.; Karaesmen, F.; Ozekici, S. A Revenue Management problem with a choise model of consumer behaviour in a random environment. OR Spectr. 2015, 37, 457–473. [Google Scholar] [CrossRef]
- Naeem, B.; Belleh, F.; Charles, R.S. Optimal product pricing and lot sizing decisions for multiple products with nonlinear demands. Int. J. Manag. Anal. 2016, 3, 43–58. [Google Scholar]
- Neugebauer, S.; Forin, S.; Finkbeiner, M. From Life Cycle Costing to Economic Life Cycle Assessment—Introducing an Economic Impact Pathway. Sustainability 2016, 8, 428. [Google Scholar] [CrossRef]
- Zhang, X.; Huang, S.; Wan, Z. Optimal pricing and ordering in global supply chain management with constraints under random demand. Appl. Math. Model. 2016, 40, 10105–10130. [Google Scholar] [CrossRef]
- Adenso-Díaz, B.; Lozano, S.; Palacioa, A. Effects of dynamic pricing of perishable products on revenue and waste. Appl. Math. Model. 2017, 45, 148–164. [Google Scholar] [CrossRef]
- Gallego, G.; Van Ryzin, G. Optimal dynamic pricing of inventories with stochastic demand over finite horizons. Manag. Sci. 1994, 40, 999–1020. [Google Scholar] [CrossRef]
- Bitran, G.R.; Wadhwa, H.K. Some Structural Properties of the Seasonal Product Pricing Problem; MIT Sloan School of Management: Cambridge, MA, USA, 1996. [Google Scholar]
- Anjos, M.F.; Cheng, R.C.H.; Currie, C.S.M. Optimal Pricing Policies for Perishable Products. Eur. J. Oper. Res. 2005, 166, 246–254. [Google Scholar] [CrossRef]
- Liu, B.; Milner, J. Multiple-Item Dynamic Pricing under a Common Pricing Constraint; University of Toronto: Toronto, ON, Canada, 2006. [Google Scholar]
- Modarres, M.; Sharifyazdi, M. Revenue management approach to stochastic capacity allocation problem. Eur. J. Oper. Res. 2009, 192, 442–459. [Google Scholar] [CrossRef]
- Aydın, S.; Akcay, Y.; Karaesmen, F. On the structural properties of a discreate-time single product revenue management. Oper. Res. Lett. 2009, 37, 1–23. [Google Scholar] [CrossRef]
- Koening, M.; Meisser, J. List pricing versus dynamic pricing: Impact on the revenue risk. Eur. J. Oper. Res. 2010, 204, 505–512. [Google Scholar] [CrossRef]
- Shields, J.; Shelleman, J. Development of a revenue management checklist. Small Bus. Inst. Natil. Proc. 2009, 33, 91–103. [Google Scholar]
- Petrick, A.; Gönsch, J.; Steinhardt, C.; Klein, R. Dynamic control mechanisms for revenue management with flexible products. Comput. Oper. Res. 2010, 37, 2027–2039. [Google Scholar] [CrossRef]
- Sato, K.; Sawaki, K. A continuous-time dynamic pricing model knowing the competitor’s pricing strategy. Eur. J. Oper. Res. 2012, 7, 111–128. [Google Scholar] [CrossRef]
- Wang, X.; Li, D. A dynamic product quality evaluation based pricing model for perishable food supply chains. Omega 2012, 40, 906–917. [Google Scholar] [CrossRef]
- Chiang, W.C.; Chen, J.C.H.; Xu, X. An overview of research on revenue management: Current issues and future research. Int. J. Revenue Manag. 2007, 1, 97–128. [Google Scholar] [CrossRef]
- Zhang, L.; Wang, J. Coordination of the traditional and the online channels for a short-life-cycle product. Eur. J. Oper. Res. 2017, 258, 639–651. [Google Scholar] [CrossRef]
- Philips, R.L. Pricing and Revenue Optimization; Stanford University Press: Stanford, CA, USA, 2005. [Google Scholar]
- Kuyumcu, H.A. Emerging trends in scientific pricing. J. Revenue Pricing Manag. 2007, 6, 293–299. [Google Scholar] [CrossRef]
Figure 1.
The proposed model taxonomy.

Figure 2.
The proposed system work flow.

Figure 3.
Different pricing strategies for the sample product_1 during the shelf life.
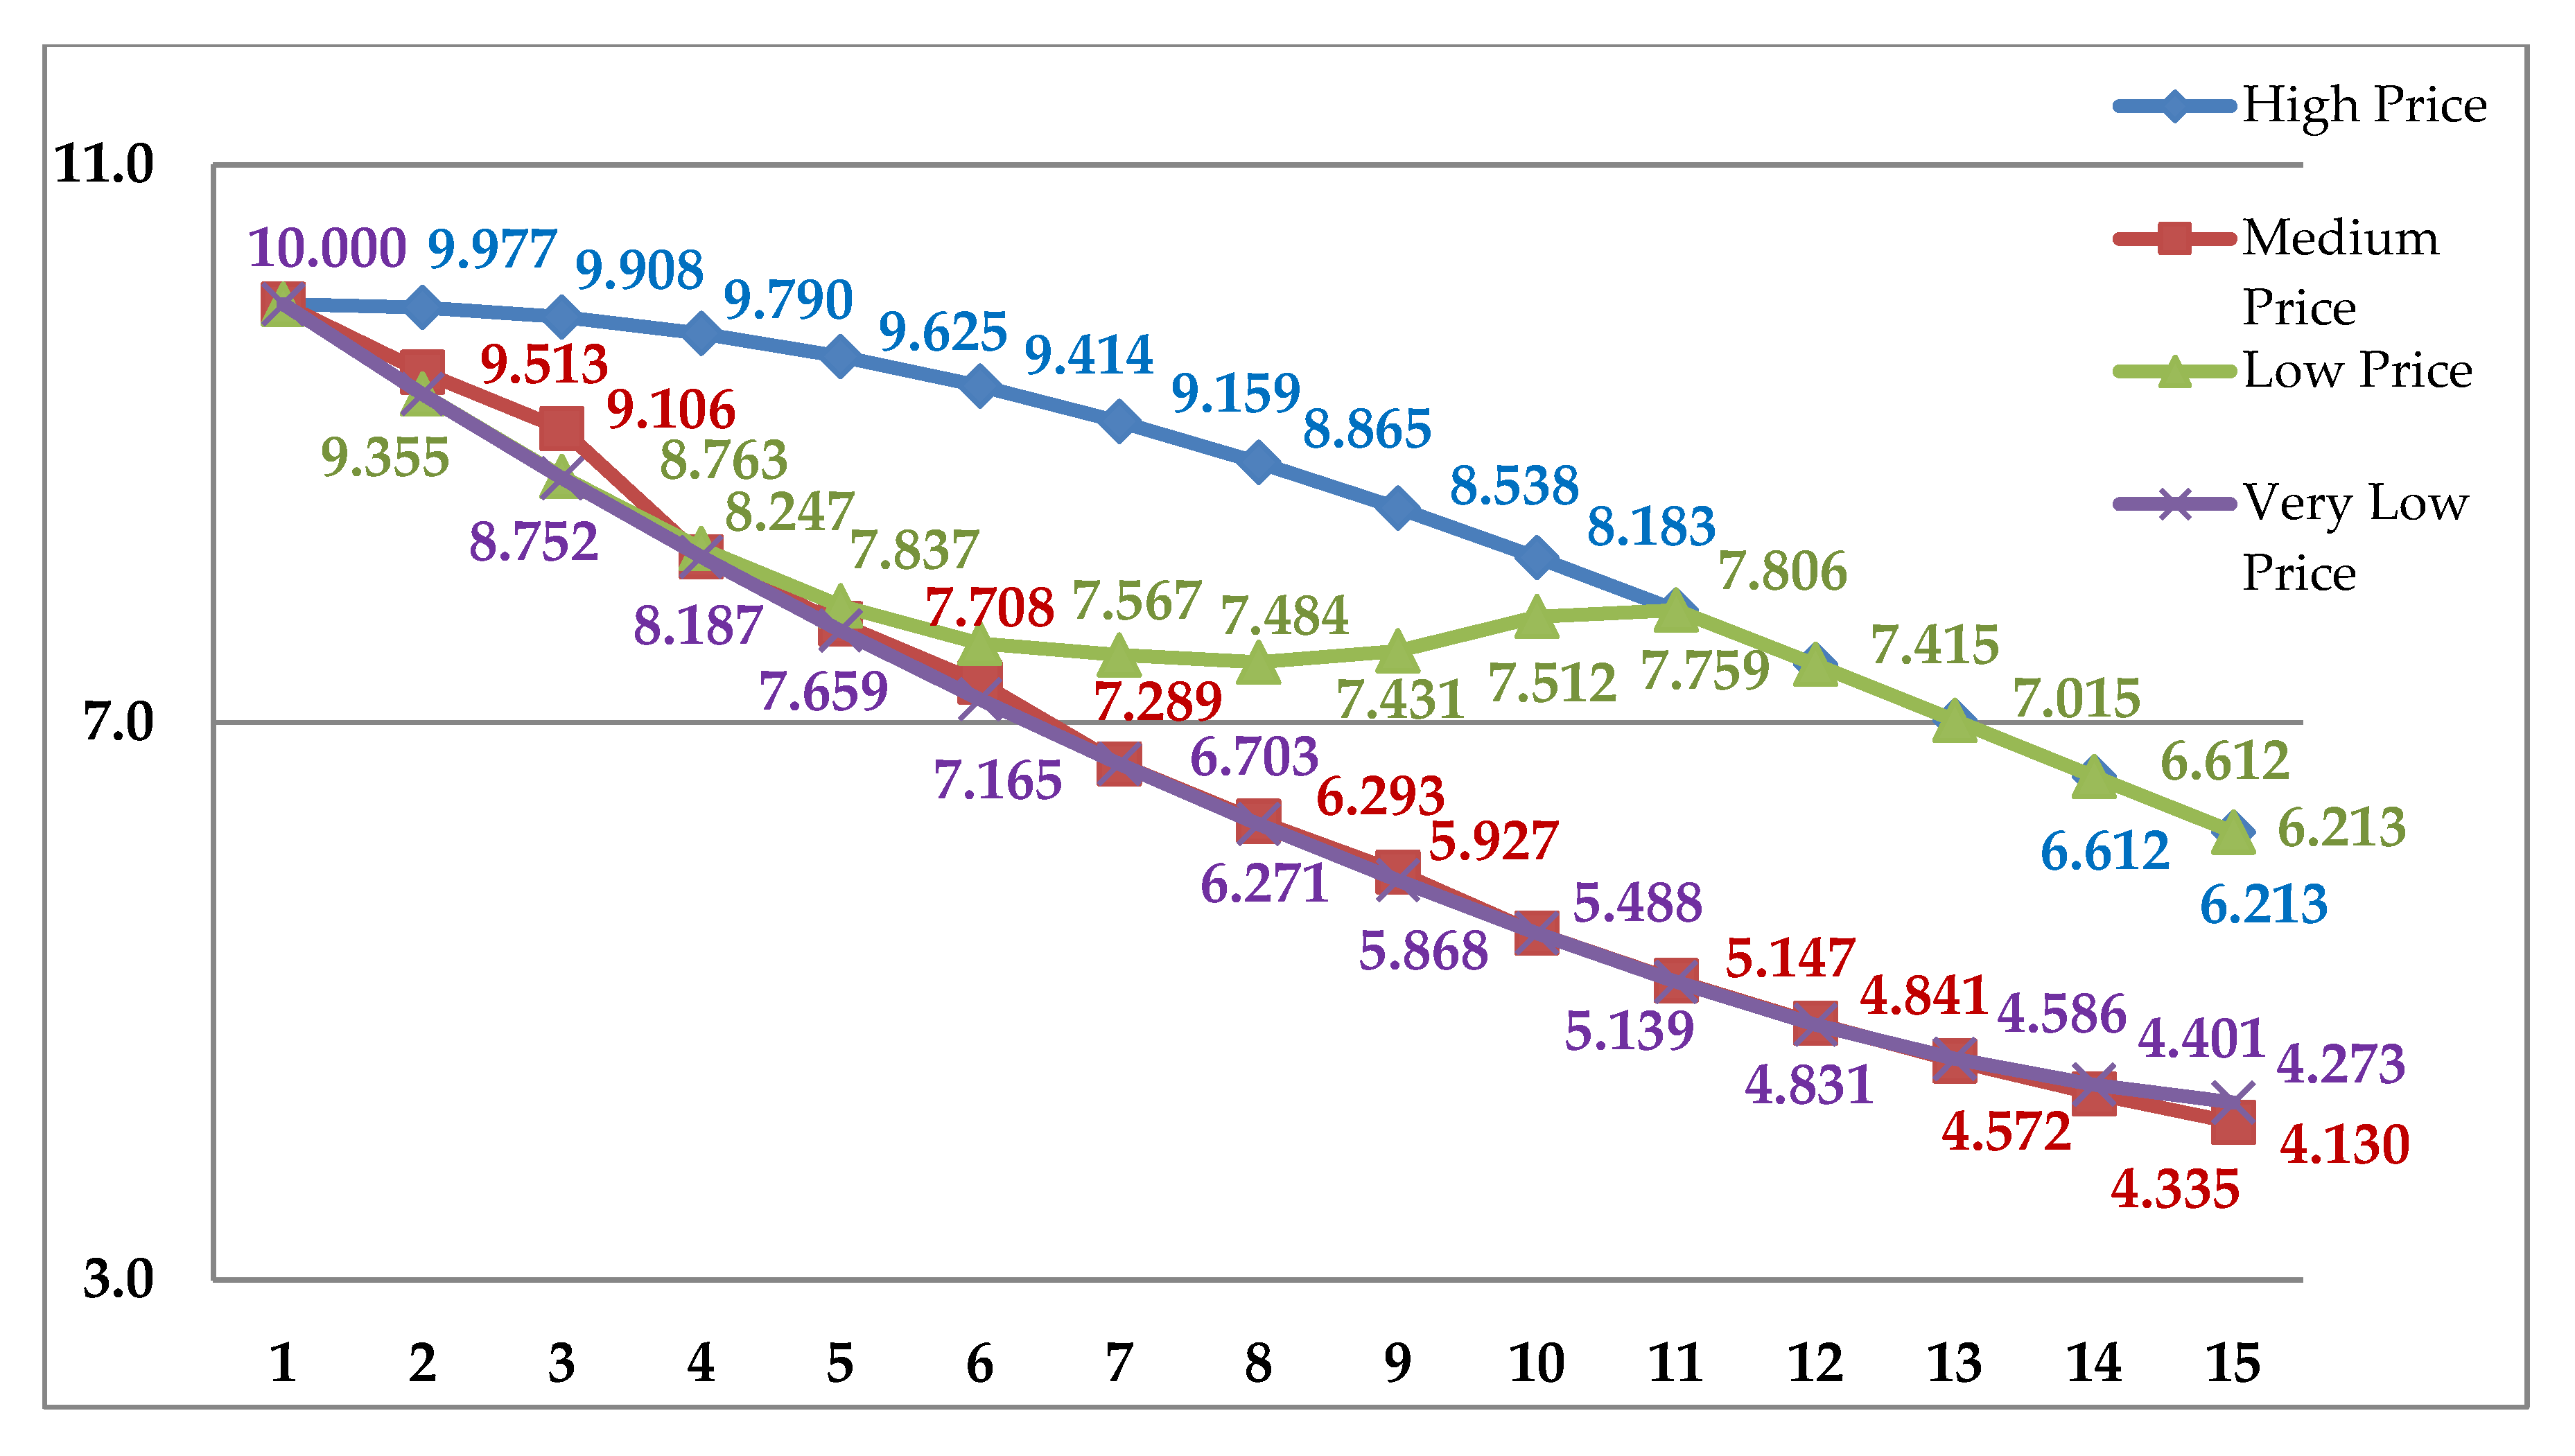
Figure 4.
Scenario-based profit comparisons.

Figure 5.
Scenario-based total cost comparisons.


Table 1.
Pricing types applied in the new scenarios.
| Scenario Number | Pricing Type | Dynamic Interaction Type |
|---|---|---|
| 0 | Fix | - |
| 1 | High | Just Its Own Freshness |
| 2 | Medium | Only Each Freshness of The Same Products Stocks |
| 3 | Low | Freshness of Every Stock of Every Products |
| 4 | Deep | Nearly Purchasing Price |
Table 2.
Some key information about sample products.
| Holding Cost | Setup Cost | Unmet Product Cost | Products Shelf Life | Waste Cost | |||||||||||||||
|---|---|---|---|---|---|---|---|---|---|---|---|---|---|---|---|---|---|---|---|
| h(1) | h(2) | h(3) | h(4) | st(1) | st(2) | st(3) | st(4) | us(1) | us(2) | us(3) | us(4) | L(1) | L(2) | L(3) | L(4) | wc(1) | wc(2) | wc(3) | wc(4) |
| 0.2 | 0.15 | 0.33 | 0.18 | 10 | 8 | 7 | 5 | 4 | 2 | 3 | 1.5 | 15 | 9 | 6 | 10 | 3 | 4 | 3 | 2 |
Table 3.
Amount of orders for all products.
| Q (i, j) | |||||||||
|---|---|---|---|---|---|---|---|---|---|
| 1.1 | 1.2 | 1.3 | 1.4 | 1.5 | 1.6 | 1.7 | 1.8 | 1.9 | 1.10 |
| 100 | 100 | 110 | 90 | 100 | 95 | 100 | 90 | 100 | 90 |
| 2.1 | 2.2 | 2.3 | 2.4 | 2.5 | 2.6 | 2.7 | 2.8 | 2.9 | 2.10 |
| 60 | 45 | 60 | 55 | 55 | 60 | 45 | 60 | 55 | 55 |
| 3.1 | 3.2 | 3.3 | 3.4 | 3.5 | 3.6 | 3.7 | 3.8 | 3.9 | 3.10 |
| 50 | 44 | 48 | 52 | 48 | 50 | 44 | 48 | 52 | 48 |
| 4.1 | 4.2 | 4.3 | 4.4 | 4.5 | 4.6 | 4.7 | 4.8 | 4.9 | 4.10 |
| 70 | 65 | 72 | 62 | 75 | 70 | 65 | 70 | 70 | 65 |
Table 4.
Purchasing prices of products.
| PP (i, j) | |||||||||
|---|---|---|---|---|---|---|---|---|---|
| 1.1 | 1.2 | 1.3 | 1.4 | 1.5 | 1.6 | 1.7 | 1.8 | 1.9 | 1.10 |
| 4 | 5 | 4 | 4 | 5 | 4 | 5 | 4 | 4 | 5 |
| 2.1 | 2.2 | 2.3 | 2.4 | 2.5 | 2.6 | 2.7 | 2.8 | 2.9 | 2.10 |
| 1.5 | 2 | 2 | 2.3 | 1.7 | 1.5 | 2 | 2 | 2.3 | 1.7 |
| 3.1 | 3.2 | 3.3 | 3.4 | 3.5 | 3.6 | 3.7 | 3.8 | 3.9 | 3.10 |
| 3 | 4 | 3.5 | 3.5 | 4 | 3 | 4 | 3.5 | 3.5 | 4 |
| 4.1 | 4.2 | 4.3 | 4.4 | 4.5 | 4.6 | 4.7 | 4.8 | 4.9 | 4.10 |
| 1.2 | 1.1 | 1 | 1.2 | 1.3 | 1.2 | 1.1 | 1 | 1.2 | 1.3 |
Table 5.
Customer demand rate for 12 days sample.
| CDR (i, j, t) | CDR (i, j, t) | ||||||||||||
|---|---|---|---|---|---|---|---|---|---|---|---|---|---|
| 1 | 2 | 3 | 4 | 5 | 6 | 7 | 8 | 9 | 10 | 11 | 12 | ||
| 1.1 | 0.296 | 0.200 | 0.318 | 0.217 | 0.323 | 0.538 | 2.2 | 0.360 | 0.229 | 0.176 | 0.259 | 0.118 | 0.200 |
| 1.2 | 0.261 | 0.290 | 0.385 | 2.3 | 0.294 | 0.259 | 0.265 | 0.280 | |||||
| 2.1 | 0.222 | 0.600 | 0.318 | 0.391 | 0.387 | 0.154 | 3.2 | 0.280 | 0.229 | 0.265 | |||
| 2.2 | 0.258 | 0.346 | 3.3 | 0.280 | 0.171 | 0.294 | 0.222 | 0.147 | 0.320 | ||||
| 3.1 | 0.296 | 0.520 | 0.318 | 0.348 | 0.355 | 0.269 | 3.4 | 0.407 | 0.206 | 0.320 | |||
| 3.2 | 0.348 | 0.129 | 0.462 | 4.1 | 0.120 | 0.114 | 0.265 | 0.370 | |||||
| 4.1 | 0.222 | 0.600 | 0.318 | 0.391 | 0.065 | 0.154 | 4.2 | 0.240 | 0.200 | 0.118 | 0.185 | 0.265 | 0.400 |
| 4.2 | 0.364 | 0.391 | 0.290 | 0.192 | 4.3 | 0.323 | 0.269 | ||||||
| 4.3 | 0.323 | 0.269 | 4.3 | 0.360 | 0.200 | 0.118 | 0.222 | 0.118 | 0.120 | ||||
| 7 | 8 | 9 | 10 | 11 | 12 | 4.4 | 0.440 | 0.114 | 0.559 | 0.296 | 0.118 | 0.440 | |
| 1.1 | 0.480 | 0.229 | 0.265 | 0.259 | 0.147 | 0.400 | 4.5 | 0.353 | 0.296 | 0.353 | 0.520 | ||
| 1.2 | 0.200 | 0.229 | 0.176 | 0.111 | 0.176 | 0.360 | 4.6 | 0.324 | 0.280 | ||||
| 1.3 | 0.280 | 0.171 | 0.353 | 0.222 | 0.147 | 0.280 | 4.4 | 0.440 | 0.114 | 0.559 | 0.296 | 0.118 | 0.440 |
| 1.4 | 0.407 | 0.206 | 0.360 | 4.5 | 0.353 | 0.296 | 0.353 | 0.520 | |||||
| 2.1 | 0.240 | 0.114 | 0.206 | 4.6 | 0.324 | 0.280 |
Table 6.
Individual demands of the each product stocks for the first 15 days.
| t, i.j. | 1.1. | 1.2. | 1.3. | 1.4. | 1.5. | 2.1. | 2.2. | 2.3. | 2.4. | 3.1. | 3.2. | 3.3. | 3.4. | 3.5. | 4.1. | 4.2. | 4.3. | 4.4. | 4.5. | 4.6. | 4.7. | 4.8. |
|---|---|---|---|---|---|---|---|---|---|---|---|---|---|---|---|---|---|---|---|---|---|---|
| 1 | 8 | 6 | 8 | 6 | ||||||||||||||||||
| 2 | 5 | 15 | 13 | 15 | ||||||||||||||||||
| 3 | 7 | 7 | 7 | 7 | 8 | |||||||||||||||||
| 4 | 5 | 6 | 9 | 8 | 8 | 9 | 9 | |||||||||||||||
| 5 | 10 | 9 | 12 | 8 | 11 | 4 | 2 | 9 | 10 | |||||||||||||
| 6 | 14 | 10 | 4 | 9 | 7 | 12 | 4 | 5 | 7 | |||||||||||||
| 7 | 12 | 5 | 7 | 6 | 9 | 0 | 7 | 7 | 3 | 6 | 9 | 11 | ||||||||||
| 8 | 8 | 8 | 6 | 4 | 8 | 8 | 6 | 4 | 7 | 7 | 4 | |||||||||||
| 9 | 9 | 6 | 12 | 7 | 6 | 10 | 9 | 10 | 9 | 4 | 4 | 19 | 12 | |||||||||
| 10 | 7 | 3 | 6 | 11 | 0 | 7 | 7 | 0 | 6 | 11 | 10 | 5 | 6 | 8 | 8 | |||||||
| 11 | 5 | 6 | 5 | 7 | 4 | 9 | 5 | 7 | 0 | 9 | 4 | 4 | 12 | 11 | ||||||||
| 12 | 10 | 9 | 7 | 9 | 5 | 7 | 8 | 8 | 10 | 3 | 11 | 13 | 7 | |||||||||
| 13 | 14 | 10 | 12 | 11 | 14 | 9 | 4 | 11 | 0 | 10 | 14 | 0 | 9 | 4 | 7 | 8 | 7 | |||||
| 14 | 12 | 5 | 7 | 8 | 9 | 0 | 6 | 14 | 8 | 9 | 11 | 6 | 8 | 10 | 6 | |||||||
| 15 | 7 | 8 | 6 | 4 | 10 | 4 | 9 | 6 | 1 | 0 | 7 | 4 | 8 | 10 | 12 |
Table 7.
Total demand on all stocks of the products for a month.
| Day | Product_1 | Product_2 | Product_3 | Product_4 | Day | Product_1 | Product_2 | Product_3 | Product_4 |
|---|---|---|---|---|---|---|---|---|---|
| 1 | 8 | 6 | 8 | 6 | 16 | 41 | 14 | 19 | 44 |
| 2 | 5 | 15 | 13 | 15 | 17 | 30 | 24 | 14 | 34 |
| 3 | 7 | 7 | 7 | 15 | 18 | 33 | 18 | 8 | 36 |
| 4 | 11 | 9 | 16 | 18 | 19 | 24 | 16 | 17 | 41 |
| 5 | 19 | 20 | 15 | 21 | 20 | 44 | 15 | 23 | 34 |
| 6 | 24 | 13 | 19 | 16 | 21 | 37 | 21 | 19 | 26 |
| 7 | 24 | 15 | 14 | 29 | 22 | 26 | 22 | 18 | 31 |
| 8 | 22 | 12 | 14 | 22 | 23 | 23 | 12 | 17 | 37 |
| 9 | 27 | 23 | 19 | 48 | 24 | 21 | 14 | 13 | 22 |
| 10 | 27 | 14 | 17 | 37 | 25 | 12 | 22 | 17 | 16 |
| 11 | 23 | 13 | 12 | 40 | 26 | 8 | 8 | 13 | 23 |
| 12 | 35 | 12 | 16 | 44 | 27 | 17 | 16 | 17 | 5 |
| 13 | 61 | 24 | 24 | 35 | 28 | 14 | 7 | 16 | 5 |
| 14 | 41 | 20 | 17 | 41 | 29 | 12 | 20 | 15 | 0 |
| 15 | 35 | 13 | 7 | 41 | 30 | 7 | 13 | 20 | 0 |
Table 8.
The proposed model solutions for product_2.
| The Day | Freshness Rate | High Price | Medium Price | Low Price | Deep Price |
|---|---|---|---|---|---|
| 1 | 1 | 12 | 12 | 12 | 12 |
| 2 | 0.88888889 | 11.924 | 11.366 | 10.792 | 10.738 |
| 3 | 0.77777778 | 11.689 | 10.902 | 9.609 | 9.610 |
| 4 | 0.66666667 | 11.296 | 10.560 | 8.632 | 8.606 |
| 5 | 0.55555556 | 10.761 | 7.694 | 7.813 | 7.694 |
| 6 | 0.44444444 | 10.107 | 7.138 | 7.123 | 6.885 |
| 7 | 0.33333333 | 9.367 | 6.668 | 6.161 | 6.163 |
| 8 | 0.22222222 | 8.578 | 6.259 | 5.513 | 5.525 |
| 9 | 0.11111111 | 7.774 | 4.933 | 4.934 | 4.933 |
| 10 | 0 | 0 | 0 | 0 | 0 |
Table 9.
Different price strategies for product_3.
| The Day | Freshness Rate | High Price | Medium Price | Low Price | Deep Price |
|---|---|---|---|---|---|
| 1 | 1 | 9 | 9 | 9 | 9 |
| 2 | 0.833333 | 8.870 | 8.870 | 7.618 | 7.630 |
| 3 | 0.666667 | 8.472 | 8.472 | 6.449 | 6.448 |
| 4 | 0.5 | 7.835 | 5.459 | 5.459 | 5.458 |
| 5 | 0.333333 | 7.025 | 4.900 | 4.621 | 4.620 |
| 6 | 0.166667 | 6.132 | 4.448 | 3.911 | 3.911 |
| 7 | 0 | 0 | 0 | 0 | 0 |
Table 10.
Proposed model comparisons for Product_4.
| The Day | Freshness Rate | High Price | Medium Price | Low Price | Deep Price |
|---|---|---|---|---|---|
| 1 | 1 | 8 | 8 | 8 | 8 |
| 2 | 0.9 | 7.959 | 7.441 | 7.239 | 7.238 |
| 3 | 0.8 | 7.832 | 6.550 | 6.550 | 6.549 |
| 4 | 0.7 | 7.620 | 5.993 | 5.927 | 5.926 |
| 5 | 0.6 | 7.327 | 5.363 | 5.365 | 5.362 |
| 6 | 0.5 | 6.964 | 4.883 | 4.852 | 4.852 |
| 7 | 0.4 | 6.546 | 4.390 | 4.391 | 4.394 |
| 8 | 0.3 | 6.089 | 3.391 | 3.973 | 3.972 |
| 9 | 0.2 | 5.612 | 3.658 | 3.595 | 3.594 |
| 10 | 0.1 | 5.130 | 3.383 | 3.253 | 3.256 |
| 11 | 0 | 0 | 0 | 0 | 0 |
© 2017 by the authors. Licensee MDPI, Basel, Switzerland. This article is an open access article distributed under the terms and conditions of the Creative Commons Attribution (CC BY) license (http://creativecommons.org/licenses/by/4.0/).
Share and Cite
MDPI and ACS Style
Tekin, P.; Erol, R. A New Dynamic Pricing Model for the Effective Sustainability of Perishable Product Life Cycle. Sustainability 2017, 9, 1330. https://doi.org/10.3390/su9081330
AMA Style
Tekin P, Erol R. A New Dynamic Pricing Model for the Effective Sustainability of Perishable Product Life Cycle. Sustainability. 2017; 9(8):1330. https://doi.org/10.3390/su9081330
Chicago/Turabian StyleTekin, Pırıl, and Rızvan Erol. 2017. "A New Dynamic Pricing Model for the Effective Sustainability of Perishable Product Life Cycle" Sustainability 9, no. 8: 1330. https://doi.org/10.3390/su9081330
Note that from the first issue of 2016, this journal uses article numbers instead of page numbers. See further details here.