National Water Footprint: Toward a Comprehensive Approach for the Evaluation of the Sustainability of Water Use in Italy


1
Engineering Department, University of Perugia, 06125 Perugia, Italy
2
Interuniversity Research Center on Pollution and Environment, University of Perugia, 06125 Perugia, Italy
*
Authors to whom correspondence should be addressed.
Sustainability 2017, 9(8), 1341; https://doi.org/10.3390/su9081341
Submission received: 7 June 2017
/
Revised: 27 July 2017
/
Accepted: 28 July 2017
/
Published: 1 August 2017
(This article belongs to the Special Issue 17th CIRIAF National Congress—Energy–Environmental Sustainability and Seismic Retrofit of Built Heritage)
Abstract
:The aim of this study is to monitor the water use over the national territory and evaluate water flows by economic sectors across regional boundaries. The sustainability level is evaluated in terms of water scarcity (the ratio between water consumption and water availability). Publicly-available geo-referenced maps containing the annual average volume of available and consumed water for different economic activities, pollution loads, and land cover are elaborated with geographic information system (GIS) software. Different administrative and geographic boundaries (regional, river basin, and hydrogeological complex) are used to produce a statistical overview of the sustainability level in water use over the Italian territory. Water footprint indicators are set up for the blue and grey components, while the sustainability of the green component is preliminarily evaluated from land use. The effective impact on the water resource is assessed in terms of water scarcity for all the three components. Water availability data refer to annual average computed between 1990 and 2010. Water consumption and land cover refer to reference year 2006. Results are shown as annual averages and they are used to establish a baseline of the national water use that is expected to be particularly relevant for next-coming analyses, including virtual water flows associated to import/export activities and trending reports for future periods.
1. Introduction
The Water Footprint (WF) has become a widespread indicator for the evaluation of the environmental impact associated to the water resource arising from human activities [1]. It consists of evaluating all of the water flows that are related to a given process from a life-cycle perspective [2,3,4], hence, including any direct and indirect water use. To this extent, a process is defined as any human activity, or part of it, related to the life cycle of a product or a service. Water flows are defined as the volumes of water that are consumed, incorporated, and needed to dilute pollutants emitted during the process. They are commonly divided into three components: the green water footprint represents the volume of rainwater that is evapotranspirated; the blue water footprint is the volume of freshwater withdrawn (either consumed or returned to the environment at a different time, or to a different place); and the grey water footprint is the volume of water for pollutant dilution [1,5]. While the first two volumes are real (i.e., they are actually processed), the grey water footprint is a virtual volume: grey water is defined as the amount of water that would be necessary to dilute the pollutant load below some reference level [6,7].
In order to evaluate the sustainability of the water use, however, it is very important to take into account the location where water consumption occurs [8]. This plays a major role, since the effects on the environment are much dependent on the particular local conditions (e.g., unlike other human-related impacts as green-house gases emission). The same process, in fact, can produce different impacts if taking place in regions where there is a large water availability or in regions experiencing water shortages. As supported by the findings of the present work, changing the scale at which impacts are evaluated can also result in large variations of the sustainability assessment. For example, averaging results over too large an area can either smear out possible hot spots or overestimate their spatial extent beyond their actual physical boundaries.
This study represents a first effort to evaluate the sustainability of the national water use not only providing estimates of the water volumes that are consumed, but also proposing a methodology for assessing the impacts in terms of pressure on the local water resource.
The sustainability of the water resource from a local perspective is already presented in a few literature studies: a particular emphasis is given to the necessity of reaching a sub-basin scale, however, they focus on a single river basin [9,10] or irrigation district [11]. A recent work [12] proposes a comprehensive approach including efficiency and equity of the water use applied to the Latin American and Caribbean area. Although a detailed analysis of the nexus between the water footprint and trade is presented in the former study, environmental sustainability is only assessed in terms of blue water scarcity and water pollution. The water footprint is mostly due to crop production (71%) and grazing (23%), the high blue-water scarcity indicating that a further expansion of irrigated agriculture would not be sustainable. Additionally, a large part of the area shows a water pollution level above sustainability [1]. Similarly, the water footprint of Italy was recently presented [13]. In terms of production within the national territory, agriculture is still responsible for the largest water footprint (85%), followed by industry and domestic water supply. As for national consumption, most of the water footprint is due to food (89%) products. This study, however, is only based on the evaluation of water volumes and not directly on the impact on the water resource; as it emerges that Italy is one of the most water-demanding country in Europe, not much can be said about the sustainability of water use from a local perspective.
In this paper, the National Water Footprint (NWF, [14]) methodology is applied to the Italian case study. The goal is to produce a detailed estimate of water flows over the national territory as a function of relevant geographical boundaries (i.e., administrative and physical) associated to economic activities in order to assess the sustainability level of the current water use, find possible hot spots, and guide decision-makers and stakeholders towards effective strategies and solutions.
2. Methodology and Datasets
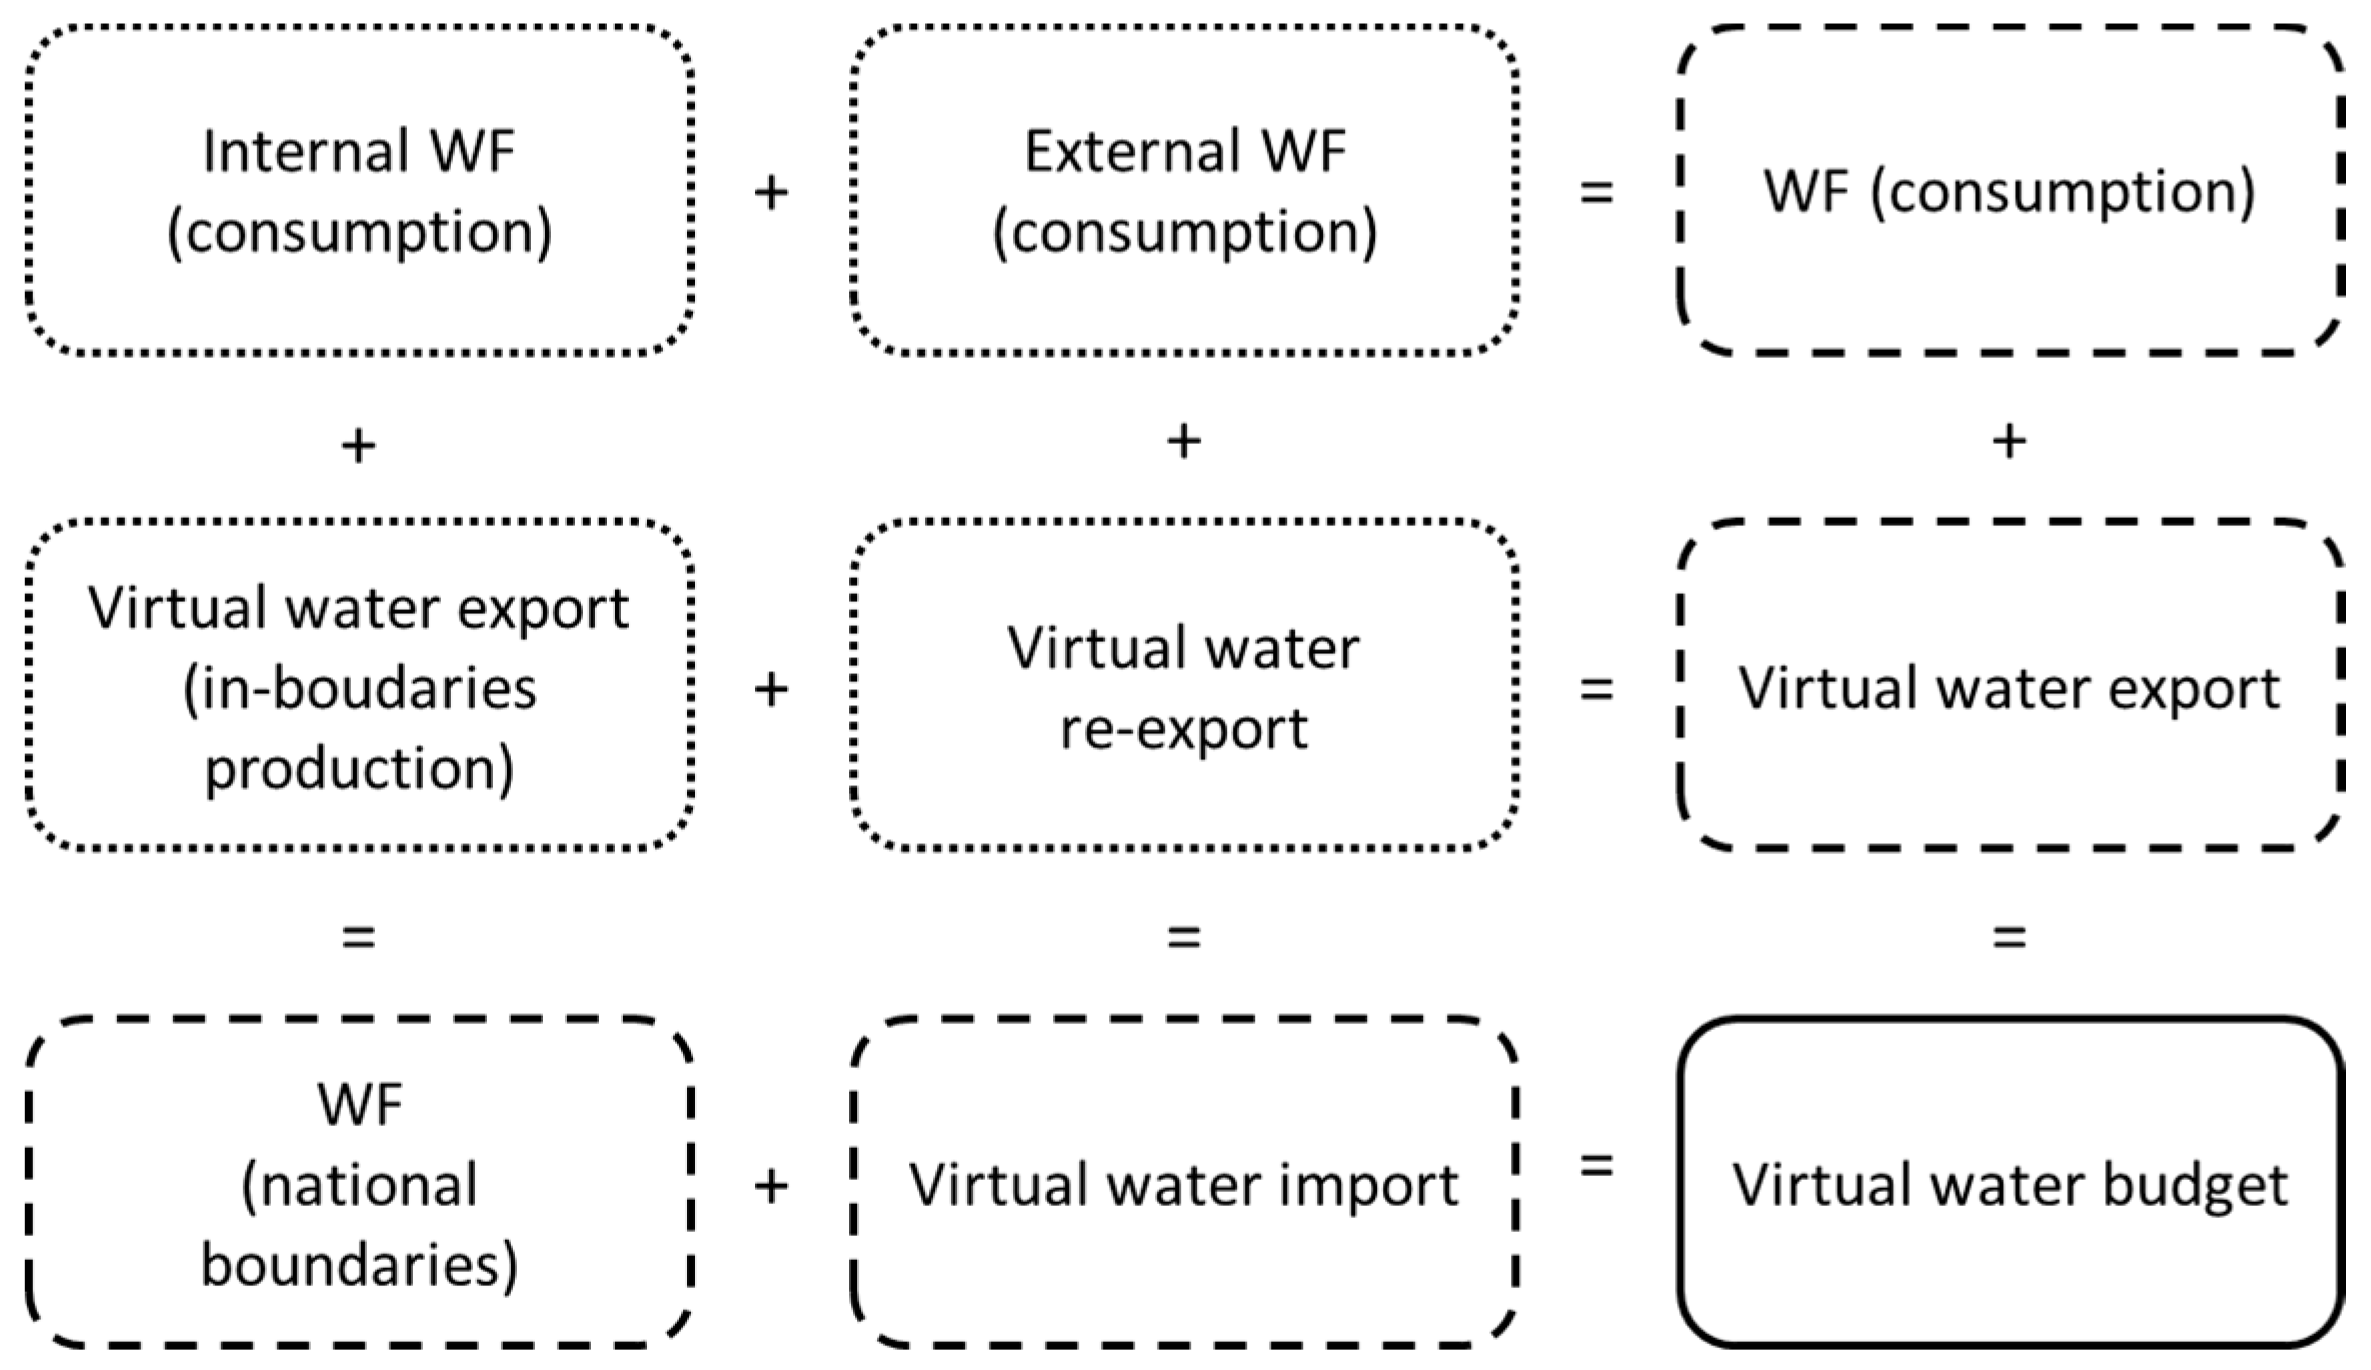
The general picture of a NWF accounting scheme is given in Figure 1. We focus here on the water footprint generated within the national boundaries, hence, taking into account all of the water flows generated for goods production and services within the Italian territory for both domestic consumption and export.
The water footprint, in general, is defined as the sum of three components [1]:
where real water volumes (green and blue) are summed to virtual water volumes (grey).
The evaluation methodology was setup following an approach similar to that of previous literature studies applied to geographical boundaries [12,13]. At this stage, we focused on establishing a baseline for the sustainability of national water use that will be the starting point for future developments of this work. In particular, blue and grey water volumes (i.e., blue and grey water footprint) are computed in detail and compared to the reference water availability (WA) level in order to assess synthetic impact indicators. The sustainability of the green water use is preliminary assessed considering the fraction of land preserved as natural, which does not represent a direct estimate of the green water footprint.
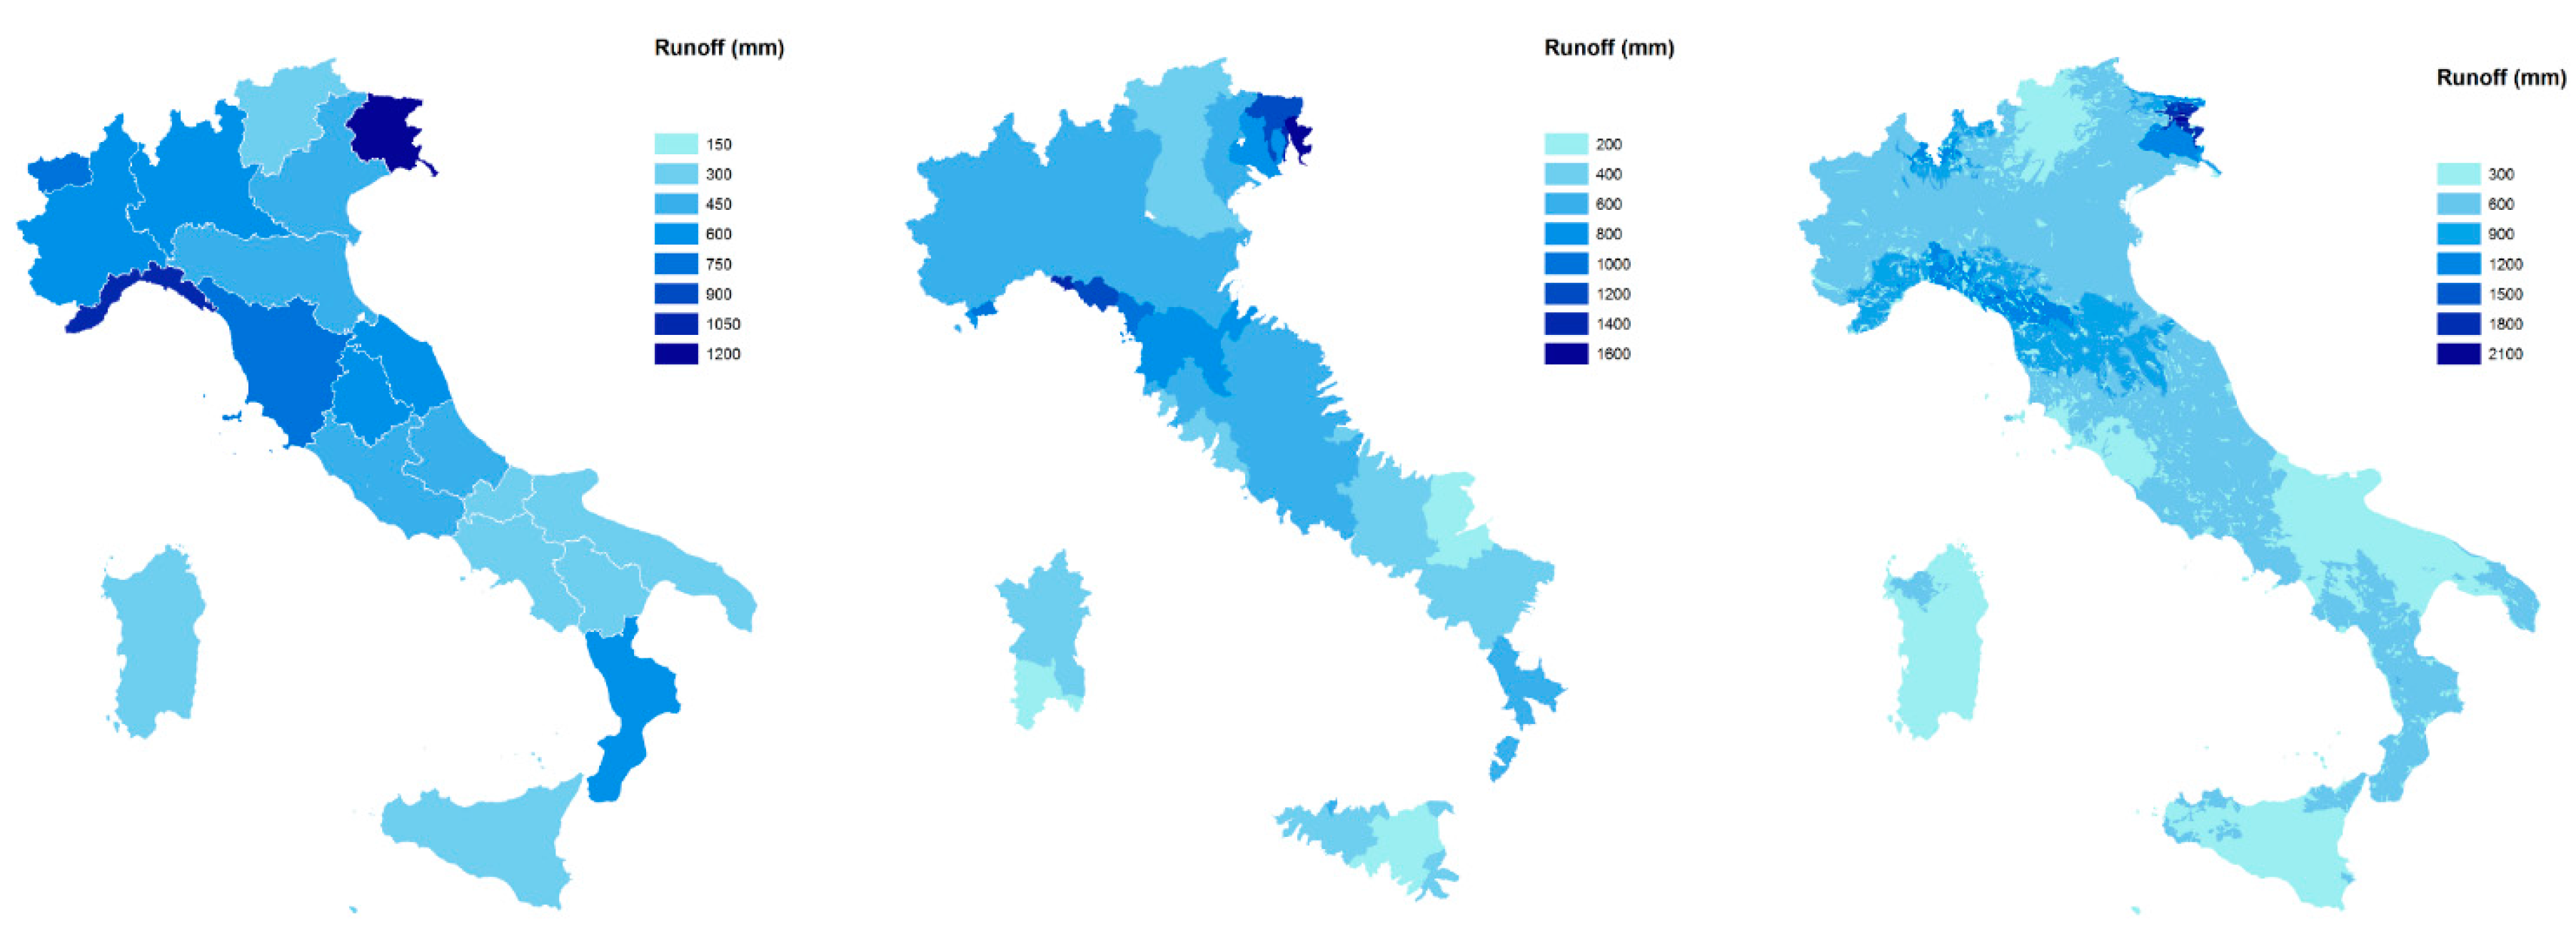
Available water in a given geographical area is defined as the amount of freshwater that exits from the area during the reference time period (i.e., the runoff). Raster datasets for this, and other, water-quantity indicators are made freely available by the Joint Research Center (JRC) data portal [14], the science and knowledge service of the European Commission. Maps show the simulated annual average between 1990 and 2010 validated against meteorological observation and gridded using a 5 km × 5 km scale.
The totally-available water within a region was used to estimate the maximum volumes that can be abstracted or polluted without exceeding the sustainable level. As Hoekstra and Richter [16,17] estimate that 20% of the total natural runoff can be used by human activities without significantly impacting on the ecosystem, such an amount of water is considered as the upper limit for a sustainable blue water footprint.
The remaining water (80% of the runoff) is then considered as the maximum amount that can be used to dilute the pollutant load. This is a more conservative estimate of the grey water availability than the one in [16], which indicates the total available water (100% of the runoff) to be the upper limit for the grey water footprint. This latter approach, however, can lead to an underestimate of the water scarcity index in such cases when the blue water footprint is not negligible with respect to the available water.
Unlike blue and grey water, evapotranspiration can only be computed at a single-crop level, and it is practically impossible to produce detailed green water footprint maps over large areas (e.g., at a national or regional scale). Nonetheless, upper limits, indicating a sustainable use of the green water for human activities, cannot be set straightforwardly. The simplified and preliminary approach proposed in this paper, is to consider the minimum fraction of land required to be preserved as natural, in order to guarantee the minimum amount of evapotranspiration needed to sustain biodiversity [12]. From this perspective, the baseline is represented by a completely natural environment, which is sustainable by definition. Considering that, as a rough estimate, at least 25–50% of the land has to be reserved to natural areas [12], green water scarcity is estimated as the fraction of land occupied by human activities. Table 1 summarizes the reference values used in this study.
Water abstraction data is available in [14]. Raster files (5 km × 5 km resolution) show the total water abstraction (WFblue) and the share among livestock (WFblueliv), irrigation (WFblueirr), industry (WFblueind), energy (WFblueene), and domestic (WFbluedom) use for reference year 2006. It is important to remark that, in this study, water abstraction is used as an estimate of the blue water footprint. This conservative assumption was made in order to include not only the water that is consumed, but also those volumes returned to the environment at different places or different times [1]. The ratio between WFblue and WFbluemax is the blue water scarcity (WSblue) index, representing the normalized footprint on the freshwater resource.
The grey water footprint (WFgrey) is a virtual volume and it is defined as the water needed to dilute pollutants below some reference value [1]:
where Li is the load of the i-th pollutant (kg), Cmaxi and Cnati the maximum and natural concentration of the i-th pollutant (kg/m3), respectively. In this study, pollution from nitrogen (N) and phosphorus (P) only is considered. A JRC dataset is available at river basin district (RBD) scale for the loads of N and P from point and diffuse sources [18]. Maximum and natural concentrations used in this work are given in Table 2. The total WFgrey is the maximum of WFgreyi. The ratio between WFgrey and WFgreymax is the grey water scarcity (WSgrey) index, often referred to as water pollution level, representing the normalized footprint on the freshwater resource.
Similarly, a green water scarcity (WSgreen) index can be computed considering the fraction of land, in a given area, that is occupied by human activities. In this case, the CORINE Land Cover (CLC) dataset for 2006 was used to obtain the classification of the national land cover with a 100-m resolution [20]. Level 1 classification was used to distinguish among artificial, agricultural, forest, wetlands, and water surfaces.
In addition, WFblue and WFgrey per person were also estimated using a 2005 population dataset with a 1 km × 1 km resolution [21].
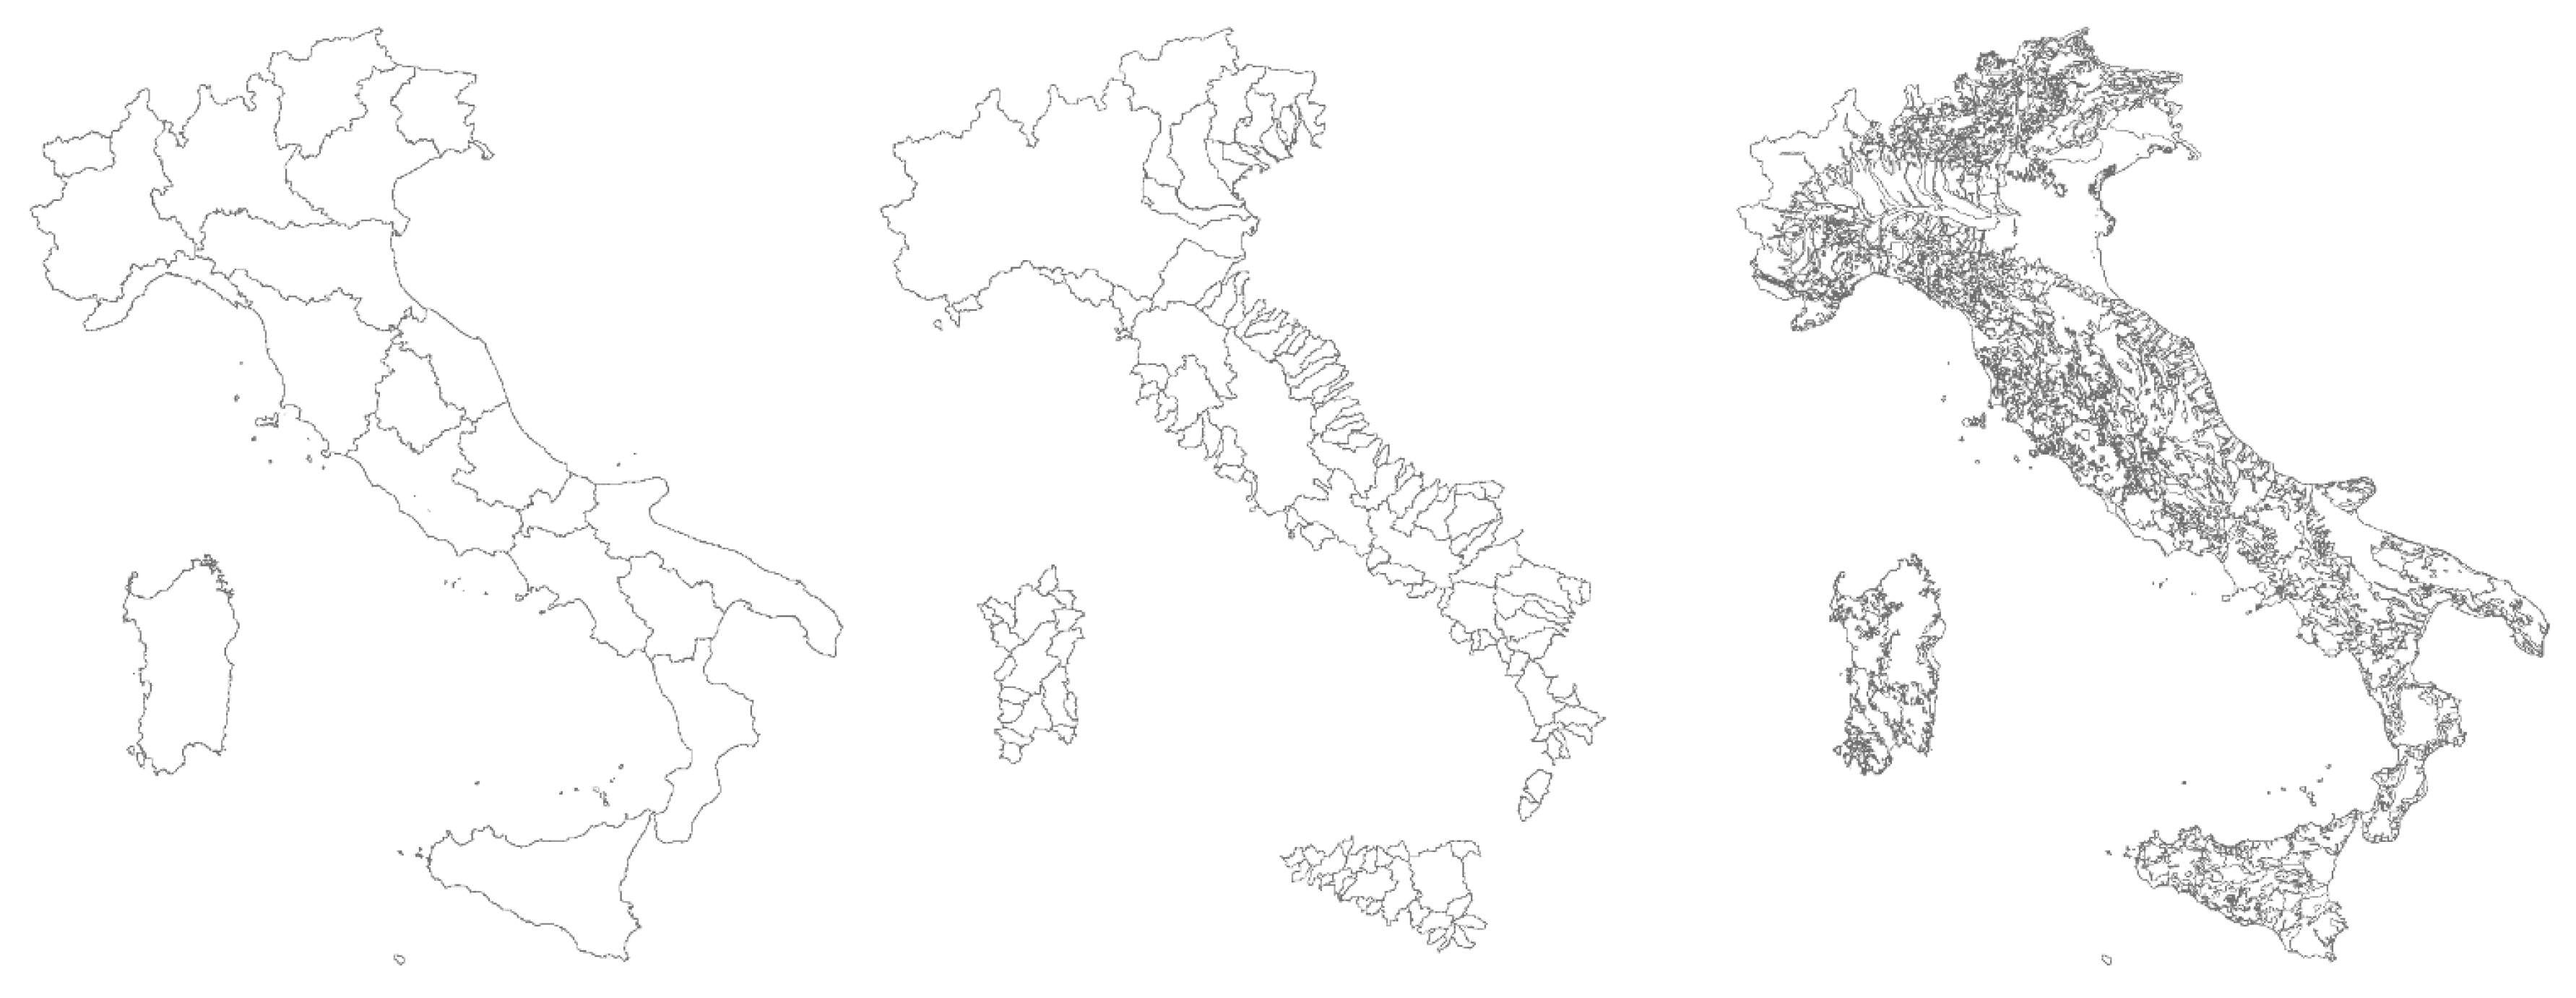
The analysis was performed considering three different geographical boundary sets (Figure 2):
- regional (administrative) boundaries (REG, [22]), consisting of 20 polygons with an average extension of 15,103 km2;
- river basin (BAS, [23]), consisting of 137 polygons with an average extension of 1827 km2;
- hydrogeological complex (i.e., areas with same lithological properties) (COM, [24]) consisting of 3011 polygons with an average extension of 100 km2.
3. Results and Discussion
Maps of available water for the three boundary sets are shown in Figure 3. Blue (WAblue) and grey (WAgrey) water availability were computed according to [16] from such maps.
The ratio between WFbluetot and WAblue is shown in Figure 4. From a preliminary analysis, it is evident that blue water consumption (i.e., freshwater withdrawn from aquifers and surface water) is larger than the sustainable level where agriculture is largely practiced despite the large water availability (Northern Italy) and where precipitations are less abundant (Southern Italy). The presence of dense, built environments also produces hot spots of blue water scarcity (e.g., metropolitan areas of Rome, Naples, and Cagliari). Detailed results for the REG boundaries are given in Table 3. It can be noted that agriculture is almost always the most water-demanding sector and only in 4 regions out of 20 the overall water scarcity is less than 1. In such cases, there is a combination of large WAblue and small WFblueagr.
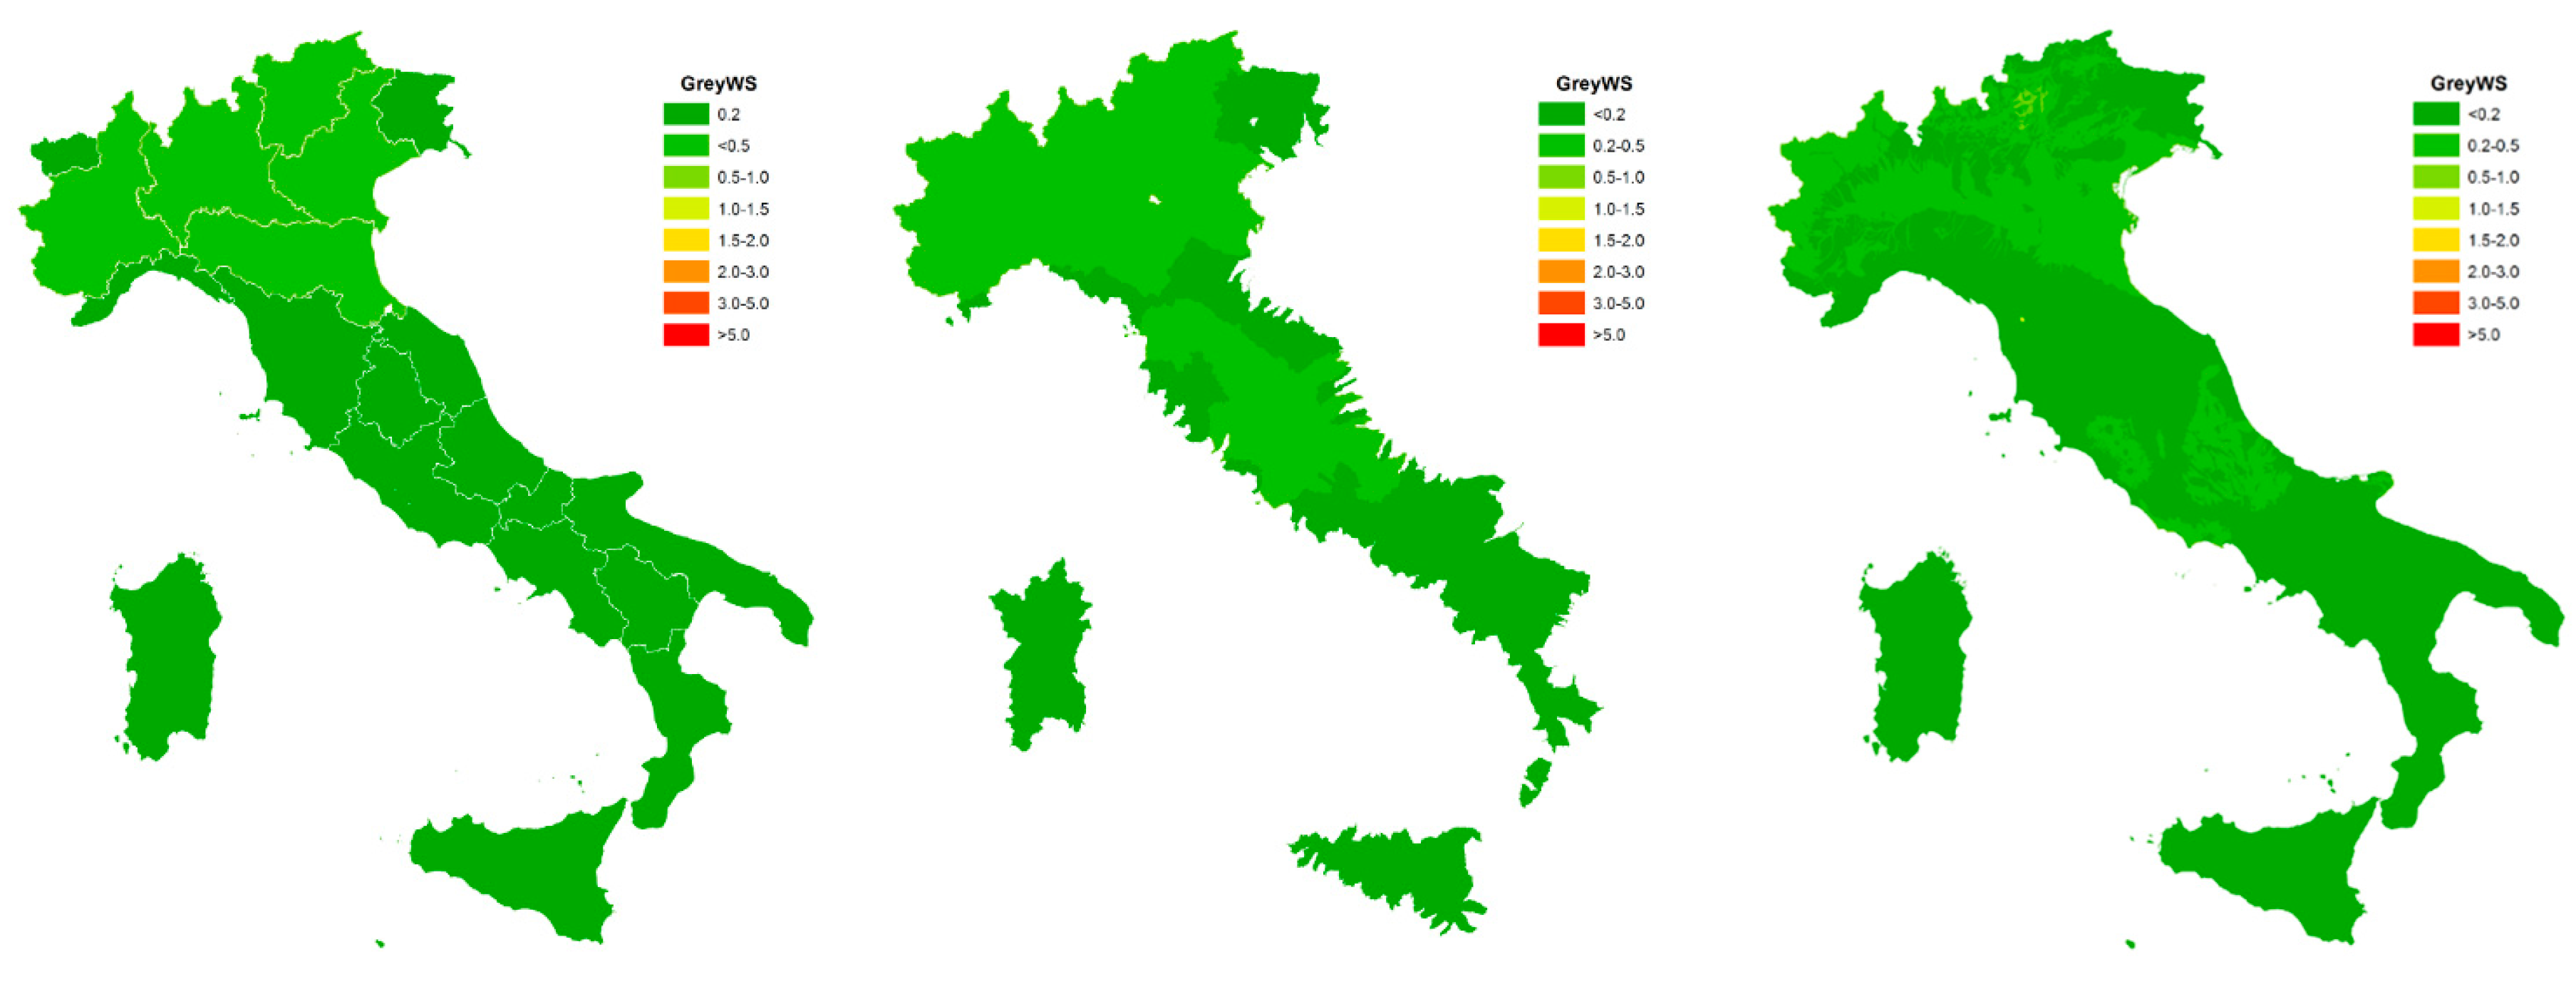
The ratio between WFgreytot and WAgrey is shown in Figure 5. Water pollution from N and P is well below sustainable levels at large scales (REG and BAS), the maximum value of WSgrey not exceeding 0.35. The same is on average true for the COM boundaries, with a maximum WSgrey equal to 1.31. In this case, however, hotspots from local pollution is not evident because of the spatial resolution of available maps for N and P loads, and such a result has to be considered preliminarily. In future development of this work, a more resolved estimate of freshwater pollution will be performed to match the hydrogeological complex scale. Detailed results for the REG boundaries are given in Table 4. The poor scale resolution of the maps for N and P loads (eight polygons with an average surface of 37,600 km2) is evident from the trend of CN and CP from Northern to Southern Italy.
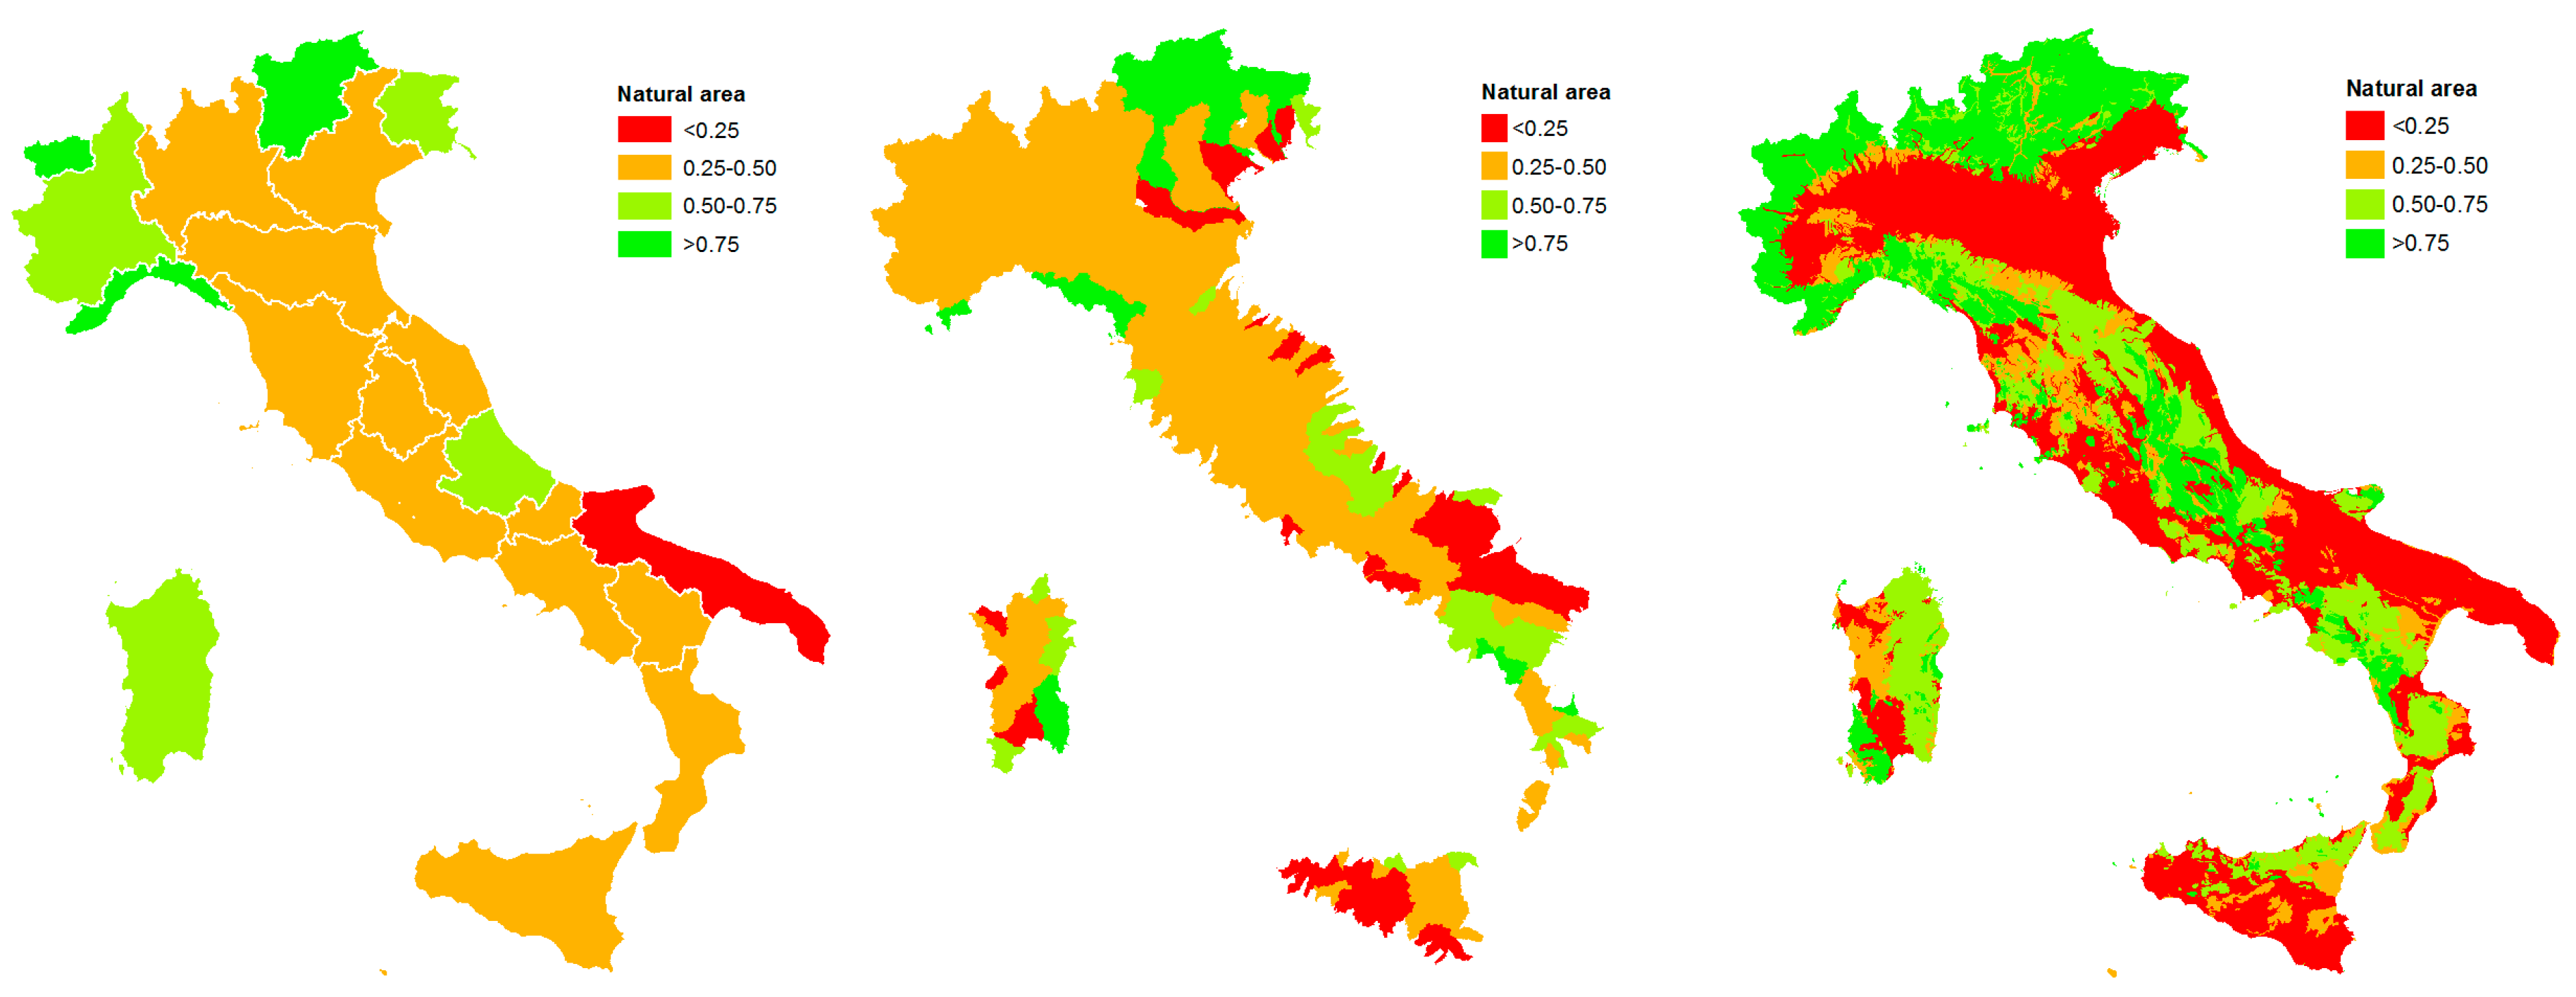
The ratio between natural and total area is shown in Figure 6. According to the Level 1 classification of the CORINE Land Cover dataset, the extent of a natural surface was computed as the sum of forest, wetlands, and water bodies. The correlation between blue (Figure 4) and green water scarcity is evident. The so-computed WSgreen indicator does not provide an estimate of the actual WFgreen, and it is not possible, at this stage, to provide a proper estimate of the overall NWF including all the three components. Future steps will include the quantification of the green water footprint as a function of the land use (i.e., land cover classification) to attempt a first estimate of this quantity and its correlation with human activities categorized on an economic basis. Detailed results for the REG boundaries are given in Table 5.
Results for the three components (WSgreen, WSblue, WSgrey) were also analyzed together to produce an overall view of the sustainability of the water use over the national territory (Table 6). For each boundary set, the number of geographic units (i.e., polygons) having a sustainable use of water is shown along with the associated area and population. It can be observed that, in all cases, the blue water preservation represents the most unattended target. There is also a systematic difference between the sustainable fraction of national surface and the sustainable fraction of people. This is directly related to the fact that urban areas, where the population is concentrated, produce the largest water footprint. Additionally, a significant difference is observed from coarser to finer geographical partitions. At the hydrogeological complex scale the sustainable area reaches 32% of the territory, corresponding to 16% of the population. This is also a hint of the large spread in the use of water from a spatial perspective and future analysis will be dedicated to fully exploit this nexus.
The comparison with previous literature data was only possible for the blue and grey water footprint presented in the 2014 study [13]. Due to the different approaches adopted and the different reference years, it is not straightforward to compare the two datasets in detail. In both cases, as expected, the total blue water footprint (computed on a national basis), is mostly due to the agricultural and livestock sector (68% present study, 75% 2014 study). Similarly, the second most-impacting sector is domestic use (18% for both studies). Since no details on the grey water footprint by economic sectors are provided in this study, only the total value can be compared: 8.4 × 10⁹ m3/year and 10.6 × 10⁹ m3/year, respectively. The difference can be explained by the fact that [13] also took into account other sources of pollution, like, for example, pesticides. However, this can be considered nothing but an approximate comparison. To our knowledge, no similar results are available, and the preliminary outcome of this study, especially in terms of environmental sustainability of the water resource exploitation (water scarcity), is new.
Limitations of the results are mainly due to the simplified procedure for estimating the green water scarcity, however, in practice, no other options are available for a large-scale study. Future efforts will be dedicated to better understand the nexus between green water availability and green water footprint in order to estimate uncertainties of the proposed methodology. Computing the actual green water footprint based on land use will also strengthen future results. Finally, with agriculture being the most impacting sector, a better insight of the impacts arising from different crops, including rain-fed vs irrigated agriculture, would be needed to fully understand the national scenario and propose effective solutions for enhancing the sustainability of the water use.
The preliminary estimation of the WF per person shows a large range of variability. While its strong correlation with the population density is self-evident, and, as computed in this study, it includes both internal production and consumption, this result is the starting point for future evaluations of the water footprint for consumption, which is an indicator of the water-related life-style sustainability of a person.
4. Conclusions
Preliminary results for the evaluation of the national water footprint of Italy are presented considering 2006 as reference year. This work is intended to provide a baseline scenario for future analysis of the Italian water use and consumption processes related to human activities. Georeferenced maps are used to compute mid-point impact indicators relative to three components: green, blue, and grey water. The analysis is performed considering three territorial aggregation scales of the national boundaries: regional administrative limits; river basins; and hydrogeological complexes. It is found that grey water footprint limits are never exceeded, while, on average, blue water consumption is below sustainability levels.
The sustainable level of the green water use is assessed in terms of the fraction of land reserved as natural, considering that at least 25% of the surface has not to be modified by human activities in order to preserve the ecosystem and guarantee the minimum evaporative flux within a geographic region. At large scales (i.e., administrative boundaries), 94% of the national territory is above the sustainability threshold, however, at smaller scales (i.e., hydrogeological complexes), the value drops to 56%. Small-extent hotspots (densely-built environment or cropped land) are smeared out when averaging over large scales.
Blue water use was assessed in terms of total water abstracted by different economic activities. It was compared to the maximum blue water availability (20% of the runoff within the geographical region) to assess the blue water scarcity. Similarly to the green component, blue water scarcity is highly influenced by the spatial resolution of the analysis: 10% of the national territory is sustainable at larger scales, 38% at smaller scales. Water-demanding hotspots are so much above the critical value that they are able to degrade the surrounding environment within large influence radii.
These two results confirm that water footprint analysis should be performed on a local scale, which should be chosen carefully in order to match the spatial extent of the local water resource. River basins appear to be a fair choice. This approach, however, requires further work on the currently-available national maps which do not include some coastal areas since they are not classified as catchment areas.
Grey water footprint was computed considering the load of pollutants (N and P) and the virtual water needed to dilute them below maximum concentration levels. Grey water scarcity was also evaluated considering the maximum grey water availability (80% of the runoff). At all scales, grey water sustainability is reached for 100% of the national territory. Limitations to this analysis arise from the poor spatial resolution of pollutant load maps, which may produce unreliable results at smaller resolutions (i.e., complex scale) and to the preliminary methodology used for the evaluation of the green water sustainability. Future development of this work will be focused in producing higher-resolution maps for pollutants.
As a final remark, the results presented in this study are to be considered as a first attempt to evaluate the sustainability of the water use in Italy not only from a water footprint perspective (quantification of water volumes associated to human activities), but also considering the effective impact on the environment in terms of water scarcity. Freshwater consumption is found to be the major concern, with a strong indication that the current withdrawal from aquifers and surface water should be treated carefully. It appears clear that national policies cannot be set up starting from a national perspective only, and they should deal with this problem locally in order to be effective.
Acknowledgments
This work was supported by the Italian Ministry for the Environment.
Author Contributions
E.B. and S.R. developed the evaluation methodology and implemented the GIS model. A.N. and F.C. supervised the activities.
Conflicts of Interest
The authors declare no conflict of interest.
References
- Hoekstra, A.Y.; Chapagain, A.K.; Aldaya, M.M.; Mekonnen, M.M. The Water Footprint Assessment Manual: Setting the Global Standard; Earthscan: London, UK, 2011. [Google Scholar]
- ISO 14046:2014, Environmental Management—Water Footprint—Principles, Requirements and Guidelines; ISO: Geneva, Switzerland, 2014.
- Bonamente, E.; Cotana, F. Carbon and Energy Footprint of Prefabricated Industrial Buildings: A systematic Life Cycle Assessment Analysis. Energies 2015, 8, 12685–12701. [Google Scholar] [CrossRef]
- Bonamente, E.; Pelliccia, L.; Merico, M.C.; Rinaldi, S.; Petrozzi, A. The Multifunctional Environmental Energy Tower: Carbon Footprint and Land Use Analysis of an Integrated Renewable Energy Plant. Sustainability 2015, 7, 13564–13584. [Google Scholar] [CrossRef]
- Water Footprint Network—What is the Water Footprint? Available online: http://waterfootprint.org/en/water-footprint/what-is-water-footprint (accessed on 27 July 2017).
- Rinaldi, S.; Bonamente, E.; Scrucca, F.; Merico, M.C.; Asdrubali, F.; Cotana, F. Water and Carbon Footprint of Wine: Methodology Review and Application to a Case Study. Sustainability 2016, 8, 621. [Google Scholar] [CrossRef]
- Bonamente, E.; Scrucca, F.; Rinaldi, S.; Merico, M.C.; Asdrubali, F.; Lamastra, L. Environmental impact of an Italian wine bottle: Carbon and Water Footprints assessment. Sci. Total Environ. 2016, 560–561, 274–283. [Google Scholar] [CrossRef] [PubMed]
- Wichelns, D. Volumetric water footprints, applied in a global context, do not provide insight regarding water scarcity or water quality degradation. Ecol. Indic. 2017, 74, 420–426. [Google Scholar] [CrossRef]
- Salmoral, G.; Willaarts, B.A.; Garrido, A.; Guse, B. Fostering integrated land and water management approaches: Evaluating the water footprint of a Mediterranean basin under different agricultural land use scenarios. Land Use Policy 2017, 61, 24–39. [Google Scholar] [CrossRef]
- Zheng, Z.; Liu, J.; Koeneman, P.H.; Zarate, E.; Hoekstra, A.Y. Assessing water footprint at river basin level: A case study for the Heihe River Basin in Northwest China. Hydrol. Earth Syst. Sci. 2012, 16, 2771–2781. [Google Scholar] [CrossRef] [Green Version]
- Liu, J.; Wang, Y.; Yu, Z.; Cao, X.; Tian, L.; Sun, S.; Wu, P. A comprehensive analysis of blue water scarcity from the production, consumption, and water transfer perspectives. Ecol. Indic. 2017, 72, 870–880. [Google Scholar] [CrossRef]
- Mekonnen, M.M.; Pahlow, M.; Aldays, M.M.; Zarate, E.; Hoekstra, A.Y. Sustainability, Efficiency and Equitability of Water Consumption and Pollution in Latin America and the Caribbean. Sustainability 2015, 7, 2086–2112. [Google Scholar] [CrossRef]
- Sartori, M.; Tavernini, S.; Consalvo, C. Water Footprint of Italy; WWF: Roma, Italy, 2014. [Google Scholar]
- Mekonnen, M.M.; Hoekstra, A.Y. National Water Footprint Accounts: The Green, Blue and Grey Water Footprint of Production and Consumption; UNESCO-IHE: Delft, The Netherlands, 2011. [Google Scholar]
- Joint Research Center Data Portal. Available online: http://water.jrc.ec.europa.eu/waterportal (accessed on 27 July 2017).
- Hoekstra, A.Y. Sustainable, efficient, and equitable water use: The three pillars under wise freshwater allocation. WIREs Water 2014, 1, 31–40. [Google Scholar] [CrossRef]
- Richter, B.D.; Davis, M.M.; Apse, C.; Konrad, C. A presumptive standard for environmental flow protection. River Res. Appl. 2012, 28, 1312–1321. [Google Scholar] [CrossRef]
- Pistocchi, A.; Alberto, A.; Simone, B.; Faycal, B.; Andreas, B.P.; de Arie, R.; Bruna, G.; Camino, L.G.M.D.; Marco, P.; Fuensanta, S.H.M.; et al. Assessment of the Effectiveness of Reported Water Framework Directive Programmes of Measures; Publications Office of the European Union: Luxembourg City, Luxembourg, 2015. [Google Scholar]
- Liu, C.; Kroeze, C.; Hoekstra, A.Y.; Gerbens-Leenes, W. Past and future trends in grey water footprints of anthropogenic nitrogen and phosphorus inputs to major world rivers. Ecol. Indic. 2012, 18, 42–49. [Google Scholar] [CrossRef]
- European Environment Agency. CLC2006 Technical Guidelines; EEA: Copenhagen, Denmark, 2007. [Google Scholar]
- Center for International Earth Science Information Network. Documentation for the Gridded Population of the World, Version 4 (GPWv4); NASA Socioeconomic Data and Applications Center: Palisades, NY, USA, 2016.
- Regional Administrative Boundaries. Available online: https://www.istat.it/it/archivio/124086 (accessed on 27 July 2017).
- River Basins. Available online: http://www.sinanet.isprambiente.it/it/sia-ispra/download-mais/bacini-idrografici-principali-1-250.000/view (accessed on 27 July 2017).
- Hydrogeological Complexes. Available online: http://www.sinanet.isprambiente.it/it/sia-ispra/download-mais/complessi-idrogeologici/view (accessed on 27 July 2017).
Figure 1.
National Water Footprint accounting scheme [1].
Figure 1.
National Water Footprint accounting scheme [1].

Figure 2.
Geographical boundaries: REG (left); BAS (center); and COM (right).

Figure 3.
Average annual water availability (mm) for time period 1990–2010: REG (left); BAS (center); and COM (right).
Figure 3.
Average annual water availability (mm) for time period 1990–2010: REG (left); BAS (center); and COM (right).

Figure 4.
Blue water scarcity for 2006: REG (left); BAS (center); and COM (right).
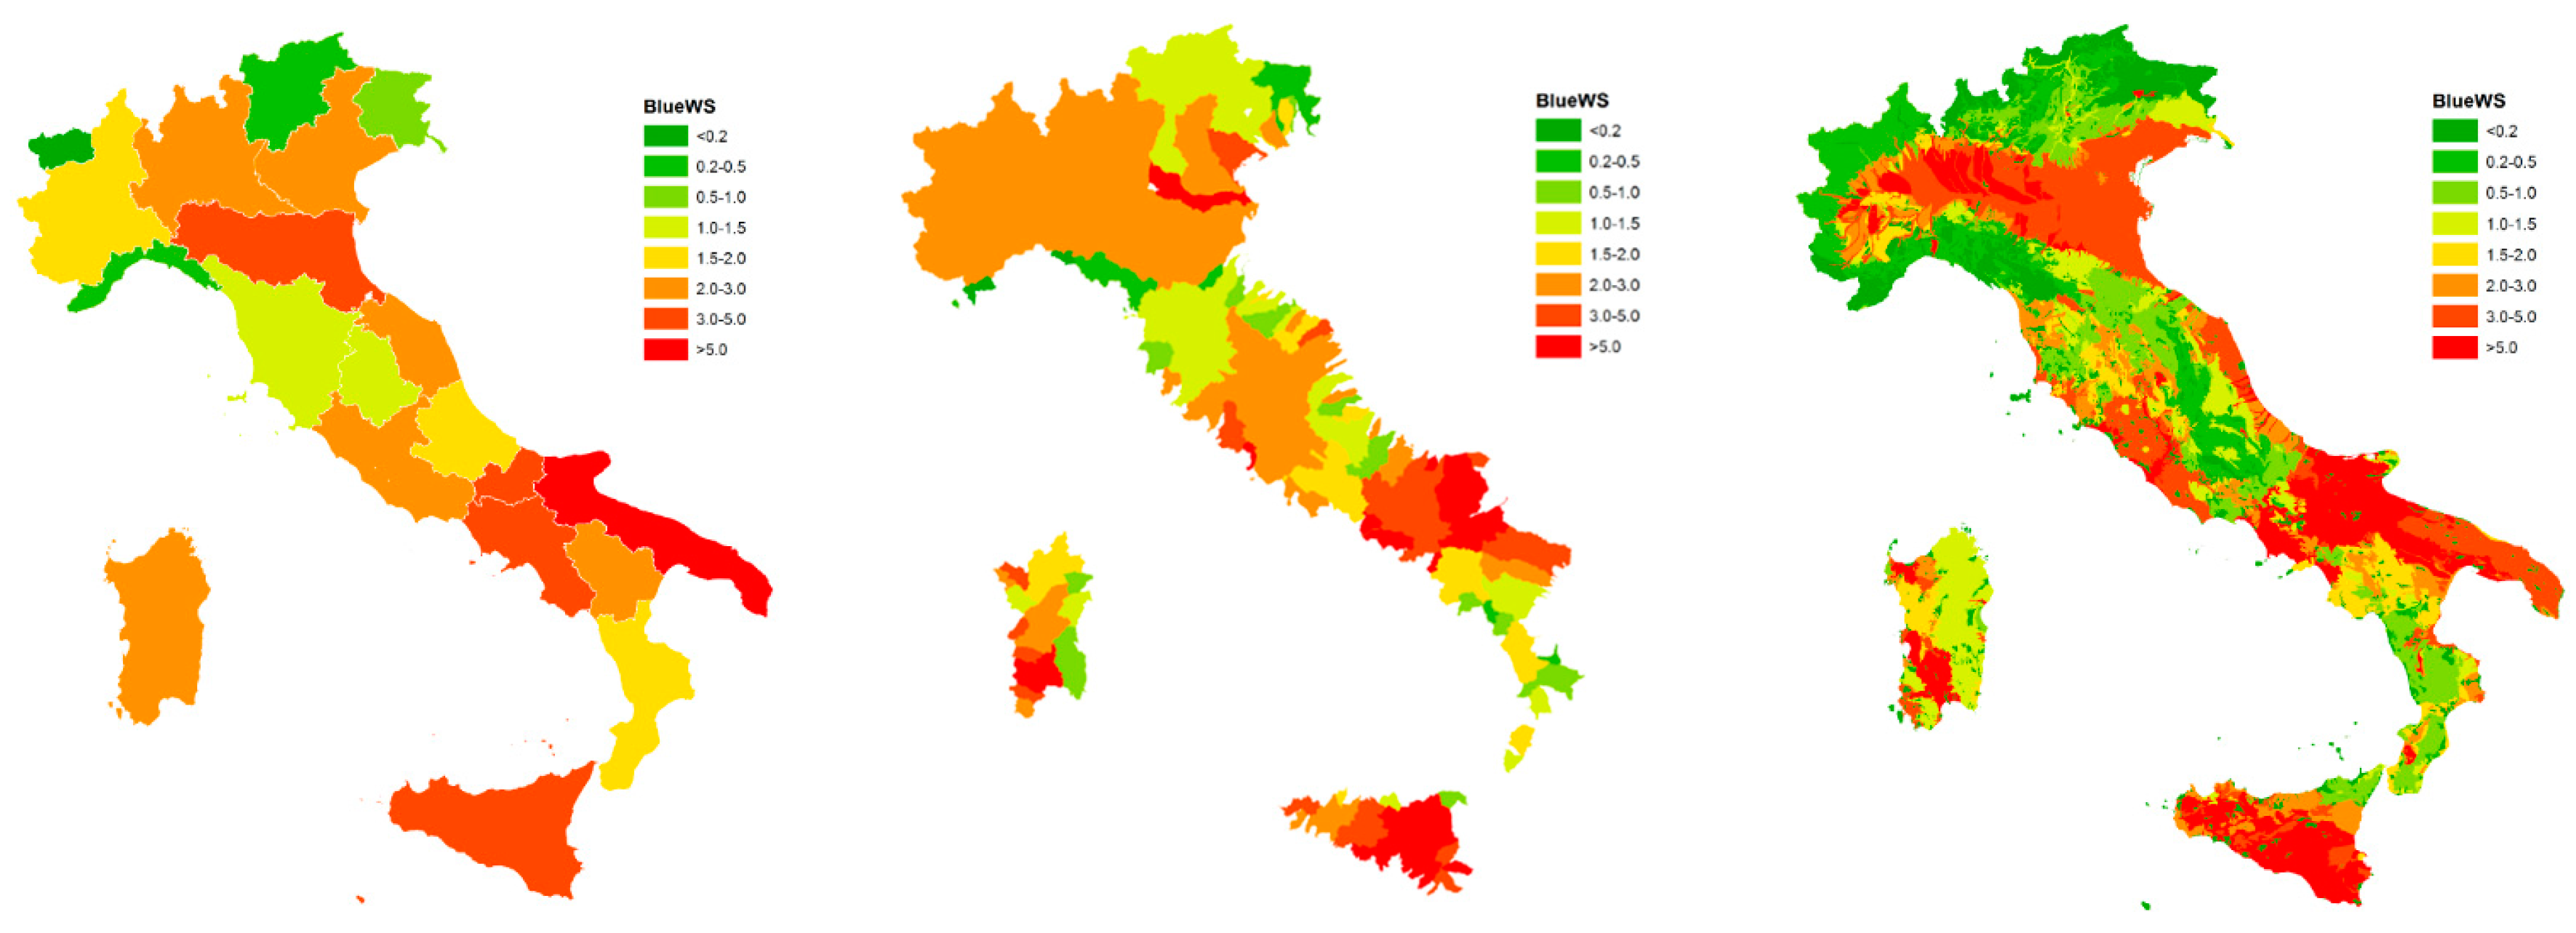
Figure 5.
Grey water scarcity for 2006: REG (left); BAS (center); and COM (right).

Figure 6.
Green water scarcity for 2006: REG (left); BAS (center); and COM (right).


Table 1.
Maximum water availability within a region.
| Water Type | Upper Limit | Description | Value |
|---|---|---|---|
| Blue | Maximum sustainable blue water footprint | ||
| Grey | Maximum sustainable grey water footprint | ||
| Green | Maximum sustainable land use |
Table 2.
Maximum and natural concentrations of pollutants [19].
Table 2.
Maximum and natural concentrations of pollutants [19].
| Pollutant | ||
|---|---|---|
| (kg/m3) | (kg/m3) | |
| N | 1 × 10⁻³ | 0.2 × 10⁻³ |
| P | 0.005 × 10⁻³ | 0.12 × 10⁻³ |
Table 3.
Blue water footprint: REG boundaries.
| Region | Runoff | WAblue | WFblue | WFblue | WSblue | Domestic | Energy | Industry | Irrigation | Livestock |
|---|---|---|---|---|---|---|---|---|---|---|
| (mm) | (mm) | (mm) | (m3/pers/year) | (-) | (%) | (%) | (%) | (%) | (%) | |
| Piemonte | 497.5 | 99.5 | 184.2 | 1082 | 1.9 | 13.6% | 40.4% | 10.0% | 34.0% | 2.0% |
| Valle D’Aosta | 729.6 | 145.9 | 5.1 | 129 | 0.0 | 61.8% | 0.0% | 32.5% | 0.0% | 5.7% |
| Lombardia | 477.4 | 95.5 | 233.6 | 584 | 2.4 | 24.5% | 8.7% | 19.4% | 42.1% | 5.3% |
| Trentino-Alto Adige | 266.0 | 53.2 | 24.0 | 331 | 0.5 | 49.8% | 28.0% | 19.4% | 0.5% | 2.3% |
| Veneto | 411.0 | 82.2 | 219.3 | 811 | 2.7 | 17.3% | 9.5% | 16.3% | 51.5% | 5.2% |
| Friuli Venezia Giulia | 1054.4 | 210.9 | 179.6 | 1209 | 0.9 | 12.0% | 26.7% | 10.9% | 47.6% | 2.8% |
| Liguria | 945.0 | 189.0 | 77.3 | 268 | 0.4 | 35.5% | 45.4% | 12.1% | 6.3% | 0.6% |
| Emilia-Romagna | 428.6 | 85.7 | 269.6 | 1446 | 3.1 | 11.3% | 21.1% | 12.4% | 53.2% | 2.1% |
| Toscana | 682.5 | 136.5 | 161.3 | 1038 | 1.2 | 16.4% | 13.5% | 13.5% | 52.3% | 1.5% |
| Umbria | 495.6 | 99.1 | 143.3 | 1406 | 1.4 | 11.2% | 16.2% | 11.0% | 58.8% | 2.8% |
| Marche | 477.4 | 95.5 | 192.0 | 1197 | 2.0 | 12.9% | 0.1% | 12.8% | 71.6% | 1.8% |
| Lazio | 400.4 | 80.1 | 217.5 | 707 | 2.7 | 19.7% | 5.4% | 12.3% | 61.9% | 0.6% |
| Abruzzo | 394.4 | 78.9 | 121.9 | 1014 | 1.5 | 18.9% | 7.8% | 16.3% | 56.8% | 0.7% |
| Molise | 285.2 | 57.0 | 232.9 | 3236 | 4.1 | 5.1% | 30.8% | 3.2% | 59.6% | 0.4% |
| Campania | 290.5 | 58.1 | 237.4 | 566 | 4.1 | 25.0% | 16.0% | 9.0% | 49.4% | 0.7% |
| Puglia | 210.1 | 42.0 | 247.0 | 1177 | 5.9 | 13.0% | 2.2% | 8.2% | 70.9% | 0.4% |
| Basilicata | 275.0 | 55.0 | 137.7 | 2321 | 2.5 | 5.9% | 0.0% | 5.9% | 87.0% | 1.2% |
| Calabria | 470.1 | 94.0 | 142.3 | 1084 | 1.5 | 12.0% | 20.2% | 5.6% | 61.6% | 1.0% |
| Sardegna | 243.9 | 48.8 | 113.8 | 1613 | 2.3 | 7.6% | 7.9% | 8.0% | 73.0% | 3.0% |
| Sicilia | 260.6 | 52.1 | 225.0 | 1158 | 4.3 | 13.0% | 9.8% | 6.0% | 64.8% | 0.5% |
Table 4.
Grey water footprint: REG boundaries.
| Region | Runoff | WAgrey | WFgrey | WFgrey | CN | CP | WSblue |
|---|---|---|---|---|---|---|---|
| (mm) | (mm) | (mm) | (m3/pers/year) | (10−3 kg/m3) | (10−3 kg/m3) | (-) | |
| Piemonte | 497.5 | 398.0 | 50.2 | 180 | 0.202 | 0.013 | 0.25 |
| Valle D’Aosta | 729.6 | 583.6 | 50.2 | 99 | 0.138 | 0.009 | 0.17 |
| Lombardia | 477.4 | 381.9 | 49.5 | 71 | 0.207 | 0.014 | 0.26 |
| Trentino-Alto Adige | 266.0 | 212.8 | 36.8 | 165 | 0.277 | 0.019 | 0.35 |
| Veneto | 411.0 | 328.8 | 34.4 | 56 | 0.167 | 0.011 | 0.21 |
| Friuli Venezia Giulia | 1054.4 | 843.5 | 61.2 | 78 | 0.116 | 0.009 | 0.15 |
| Liguria | 945.0 | 756.0 | 15.3 | 7 | 0.032 | 0.002 | 0.04 |
| Emilia-Romagna | 428.6 | 342.9 | 35.2 | 102 | 0.164 | 0.011 | 0.21 |
| Toscana | 682.5 | 546.0 | 43.3 | 154 | 0.127 | 0.007 | 0.16 |
| Umbria | 495.6 | 396.5 | 39.1 | 78 | 0.158 | 0.011 | 0.20 |
| Marche | 477.4 | 382.0 | 33.2 | 47 | 0.139 | 0.010 | 0.17 |
| Lazio | 400.4 | 320.3 | 31.2 | 42 | 0.156 | 0.011 | 0.19 |
| Abruzzo | 394.4 | 315.5 | 26.4 | 57 | 0.134 | 0.009 | 0.17 |
| Molise | 285.2 | 228.1 | 7.3 | 11 | 0.052 | 0.004 | 0.06 |
| Campania | 290.5 | 232.4 | 7.3 | 6 | 0.051 | 0.004 | 0.06 |
| Puglia | 210.1 | 168.1 | 7.3 | 16 | 0.070 | 0.005 | 0.09 |
| Basilicata | 275.0 | 220.0 | 7.3 | 30 | 0.053 | 0.004 | 0.07 |
| Calabria | 470.1 | 376.1 | 7.3 | 20 | 0.031 | 0.002 | 0.04 |
| Sardegna | 243.9 | 195.1 | 6.3 | 51 | 0.051 | 0.003 | 0.06 |
| Sicilia | 260.6 | 208.5 | 7.8 | 25 | 0.060 | 0.004 | 0.08 |
Table 5.
Green water: REG boundaries.
| Region | Population (pers/km2) | Total Area (km2) | Artificial (%) | Agriculture (%) | Forest (%) | Wetlands (%) | Water (%) | Natural Area (frac) |
|---|---|---|---|---|---|---|---|---|
| Piemonte | 170.3 | 25,401 | 4.6% | 43.7% | 50.9% | 0.0% | 0.9% | 0.52 |
| Valle D’Aosta | 39.6 | 3262 | 1.4% | 8.0% | 90.5% | 0.0% | 0.1% | 0.91 |
| Lombardia | 400.0 | 23,879 | 11.1% | 47.6% | 38.3% | 0.1% | 2.9% | 0.41 |
| Trentino-Alto Adige | 72.7 | 13,605 | 2.1% | 13.8% | 83.7% | 0.0% | 0.4% | 0.84 |
| Veneto | 270.6 | 18,398 | 8.5% | 57.0% | 28.9% | 1.5% | 4.1% | 0.34 |
| Friuli Venezia Giulia | 148.5 | 7849 | 7.2% | 38.9% | 51.5% | 0.3% | 2.0% | 0.54 |
| Liguria | 288.8 | 5420 | 5.1% | 16.5% | 78.2% | 0.0% | 0.2% | 0.78 |
| Emilia-Romagna | 186.4 | 22,453 | 5.1% | 67.2% | 26.1% | 0.5% | 1.0% | 0.28 |
| Toscana | 155.3 | 22,987 | 4.7% | 45.4% | 49.3% | 0.2% | 0.4% | 0.50 |
| Umbria | 101.9 | 8454 | 3.4% | 51.0% | 43.7% | 0.1% | 1.8% | 0.46 |
| Marche | 160.4 | 9382 | 4.7% | 64.3% | 30.8% | 0.0% | 0.1% | 0.31 |
| Lazio | 307.6 | 17,203 | 6.2% | 56.5% | 35.7% | 0.0% | 1.5% | 0.37 |
| Abruzzo | 120.3 | 10,797 | 3.0% | 44.9% | 51.9% | 0.0% | 0.2% | 0.52 |
| Molise | 72.0 | 4440 | 1.9% | 61.6% | 36.3% | 0.0% | 0.3% | 0.37 |
| Campania | 419.2 | 13,600 | 7.2% | 55.3% | 37.3% | 0.0% | 0.2% | 0.38 |
| Puglia | 209.8 | 19,355 | 4.9% | 83.1% | 10.7% | 0.4% | 0.8% | 0.12 |
| Basilicata | 59.3 | 9992 | 1.5% | 57.3% | 40.7% | 0.1% | 0.4% | 0.41 |
| Calabria | 131.3 | 15,083 | 3.6% | 48.2% | 47.9% | 0.0% | 0.3% | 0.48 |
| Sardegna | 70.6 | 24,119 | 2.9% | 46.2% | 49.7% | 0.3% | 0.9% | 0.51 |
| Sicilia | 194.3 | 25,718 | 4.9% | 67.7% | 26.8% | 0.1% | 0.5% | 0.27 |
Table 6.
Sustainable areas.
| REG Boundaries | BAS Boundaries | COM Boundaries | |||||||
|---|---|---|---|---|---|---|---|---|---|
| Polygons | Area | Population | Polygons | Area | Population | Polygons | Area | Population | |
| Green water | 19/20 | 94% | 93% | 95/137 | 86% | 84% | 2160/3011 | 56% | 31% |
| Blue water | 4/20 | 10% | 7% | 29/137 | 9% | 4% | 2433/3011 | 38% | 21% |
| Grey water | 20/20 | 100% | 100% | 137/137 | 100% | 100% | 3010/3011 | 100% | 100% |
| ALL | 4/20 | 10% | 7% | 28/137 | 8% | 3% | 1820/3011 | 32% | 16% |
© 2017 by the authors. Licensee MDPI, Basel, Switzerland. This article is an open access article distributed under the terms and conditions of the Creative Commons Attribution (CC BY) license (http://creativecommons.org/licenses/by/4.0/).
Share and Cite
MDPI and ACS Style
Bonamente, E.; Rinaldi, S.; Nicolini, A.; Cotana, F. National Water Footprint: Toward a Comprehensive Approach for the Evaluation of the Sustainability of Water Use in Italy. Sustainability 2017, 9, 1341. https://doi.org/10.3390/su9081341
AMA Style
Bonamente E, Rinaldi S, Nicolini A, Cotana F. National Water Footprint: Toward a Comprehensive Approach for the Evaluation of the Sustainability of Water Use in Italy. Sustainability. 2017; 9(8):1341. https://doi.org/10.3390/su9081341
Chicago/Turabian StyleBonamente, Emanuele, Sara Rinaldi, Andrea Nicolini, and Franco Cotana. 2017. "National Water Footprint: Toward a Comprehensive Approach for the Evaluation of the Sustainability of Water Use in Italy" Sustainability 9, no. 8: 1341. https://doi.org/10.3390/su9081341
Note that from the first issue of 2016, this journal uses article numbers instead of page numbers. See further details here.